PDF 原檔:報告_JPM_台灣工業自動化_Initiation_20261026_original.pdf
圖片清單(已驗證 2026-10-27)
| 檔名 | size | 分類 | 親眼所見內容 |
|---|---|---|---|
報告_JPM_台灣工業自動化_Initiation_20261026_001.png |
66KB | 真資料圖 | 折線與長條圖,2015–2026:灰色長條為日本工具機訂單月 YoY,黑線 AirTAC、藍線 Hiwin、亮藍線 Syntec 的三個月移動平均營收 YoY;Syntec 線於最右端急升至約 150% |
報告_JPM_台灣工業自動化_Initiation_20261026_002.png |
50KB | 真資料圖 | 股價走勢圖 Dec-20–Oct-26:AirTAC(藍)、Syntec(黑)、Hiwin(灰,右軸) |
報告_JPM_台灣工業自動化_Initiation_20261026_003.png |
22KB | 真資料圖 | 長條圖,AirTAC 股價依季度(Q1–Q4)2021–2025 年度漲跌幅及平均線;平均線顯示 Q3 最弱、Q4 回升 |
報告_JPM_台灣工業自動化_Initiation_20261026_004.png |
111KB | 真資料圖 | AirTAC 股價走勢(NT$)Aug-21–Oct-26,疊註各階段事件說明文字 |
報告_JPM_台灣工業自動化_Initiation_20261026_005.png |
31KB | 真資料圖 | AirTAC 12M forward P/E 走勢(Dec-10–Dec-25 起)及 mean、±1std、±2std 水平線 |
報告_JPM_台灣工業自動化_Initiation_20261026_006.png |
32KB | 真資料圖 | AirTAC 三個月平均成交值(US$m)Oct-21–Oct-26 折線 |
報告_JPM_台灣工業自動化_Initiation_20261026_007.png |
33KB | 真資料圖 | AirTAC 2026 年初至今每週外資/投信/自營商買賣超(長條,NT$m)與股價(紅線,右軸) |
報告_JPM_台灣工業自動化_Initiation_20261026_008.png |
115KB | 真資料圖 | Hiwin 股價走勢 Dec-21–Oct-26,疊註各階段事件文字 |
報告_JPM_台灣工業自動化_Initiation_20261026_009.png |
31KB | 真資料圖 | Hiwin 三個月平均成交值(US$m)折線 Oct-21–Oct-26 |
報告_JPM_台灣工業自動化_Initiation_20261026_010.png |
29KB | 真資料圖 | Hiwin 12M forward P/E 走勢 Jun-09–Jun-26 及 mean、±1std、±2std 線 |
報告_JPM_台灣工業自動化_Initiation_20261026_011.png |
34KB | 真資料圖 | Hiwin 2026 年初至今每週法人買賣超(長條)與股價(紅線) |
報告_JPM_台灣工業自動化_Initiation_20261026_012.png |
98KB | 真資料圖 | Syntec 股價走勢 Sep-25–Oct-26,疊註各階段事件文字 |
報告_JPM_台灣工業自動化_Initiation_20261026_013.png |
25KB | 真資料圖 | Syntec 三個月平均成交值(US$m)折線 Oct-24–Oct-26 |
報告_JPM_台灣工業自動化_Initiation_20261026_014.png |
28KB | 真資料圖 | Syntec forward P/E 走勢 Sep-25–Oct-26 及 mean、±1std、±2std 線 |
報告_JPM_台灣工業自動化_Initiation_20261026_015.png |
32KB | 真資料圖 | Syntec 2026 年初至今每週法人買賣超(長條)與股價(紅線) |
報告_JPM_台灣工業自動化_Initiation_20261026_016.png |
106KB | 真資料圖 | 日本工具機訂單月 YoY 長條圖 Jan-08–Jul-26,疊註各景氣循環(2009-11、2013-15、2016-18、2020-22、2024-Now 上行;2008-09、2012-13、2015-16、2018-20、2022-24 下行) |
報告_JPM_台灣工業自動化_Initiation_20261026_017.png |
40KB | 真資料圖 | 日本工具機訂單 YoY:藍線國內、灰線國外,Aug-11–Aug-26 |
報告_JPM_台灣工業自動化_Initiation_20261026_018.png |
45KB | 真資料圖 | 日本對中國工具機訂單(JPYbn,長條)與 YoY(灰線,右軸)Aug-11–Aug-26 |
報告_JPM_台灣工業自動化_Initiation_20261026_019.png |
36KB | 真資料圖 | 中國製造業 PMI 折線 Jan-12–Sep-26,紅線標 50 榮枯線 |
報告_JPM_台灣工業自動化_Initiation_20261026_020.png |
30KB | 真資料圖 | 中國工業生產 YoY(%)折線 Jan-12–Sep-26 |
報告_JPM_台灣工業自動化_Initiation_20261026_021.png |
87KB | 真資料圖 | 中國工業自動化(IA)市場規模長條圖(Rmb MM)1Q17–1Q26,分 OEM 與專案型兩組 |
報告_JPM_台灣工業自動化_Initiation_20261026_022.png |
90KB | 真資料圖 | 中國 IA 市場季 YoY 折線:整體、Factory Automation(OEM)、Process Automation(專案型)1Q18–2Q26 |
報告_JPM_台灣工業自動化_Initiation_20261026_023.png |
41KB | 真資料圖 | Syntec 累計營收 YoY(灰線,右軸)與中國工具機營收 YoY(藍線)Jan-25–Aug-26 |
報告_JPM_台灣工業自動化_Initiation_20261026_024.png |
46KB | 真資料圖 | Syntec 累計營收 YoY 與中國金屬切削工具機營收 YoY Jan-25–Aug-26 |
報告_JPM_台灣工業自動化_Initiation_20261026_025.png |
53KB | 真資料圖 | 台灣機械外銷訂單(US$mn,長條)與 YoY(灰線)Sep-16–Sep-26 |
報告_JPM_台灣工業自動化_Initiation_20261026_026.png |
48KB | 真資料圖 | 台灣機械設備出口 YoY(藍)與 AirTAC 日均營收 YoY(灰)Jan-23–Sep-26 |
報告_JPM_台灣工業自動化_Initiation_20261026_027.png |
49KB | 真資料圖 | 台灣線性滑軌出口值(US$mn,長條)與 YoY Sep-16–Sep-26 |
報告_JPM_台灣工業自動化_Initiation_20261026_028.png |
54KB | 真資料圖 | 台灣對中國及香港機械外銷訂單(US$mn,長條)與 YoY Sep-16–Sep-26 |
報告_JPM_台灣工業自動化_Initiation_20261026_029.png |
47KB | 真資料圖 | 台灣機械設備出口 YoY(藍)與 Hiwin 日均營收 YoY(灰)Jan-23–Sep-26 |
報告_JPM_台灣工業自動化_Initiation_20261026_030.png |
49KB | 真資料圖 | 台灣滾珠螺桿出口值(US$mn,長條)與 YoY Sep-16–Sep-26 |
報告_JPM_台灣工業自動化_Initiation_20261026_031.png |
39KB | 真資料圖 | 半導體資本支出 YoY(藍,2009–2028E)與 AirTAC 營收 YoY(黑)折線 |
報告_JPM_台灣工業自動化_Initiation_20261026_032.png |
37KB | 真資料圖 | 半導體資本支出 YoY 與 Hiwin 營收 YoY 折線 2009–2028E |
報告_JPM_台灣工業自動化_Initiation_20261026_033.png |
44KB | 真資料圖 | EMS/ODM 與蘋果供應鏈資本支出 YoY 對 AirTAC、Hiwin 營收 YoY 折線 2009–2028E |
報告_JPM_台灣工業自動化_Initiation_20261026_034.png |
46KB | 真資料圖 | 中國電池廠資本支出 YoY(藍)與 AirTAC 營收 YoY(黑,右軸)2009–2028E |
報告_JPM_台灣工業自動化_Initiation_20261026_035.png |
45KB | 真資料圖 | 中國車廠資本支出 YoY(藍)與 AirTAC 營收 YoY(黑,右軸)2009–2028E |
報告_JPM_台灣工業自動化_Initiation_20261026_036.png |
34KB | 真資料圖 | EMS/ODM 與蘋果供應鏈資本支出 YoY 對 Syntec 營收 YoY 折線 2022–2028E |
報告_JPM_台灣工業自動化_Initiation_20261026_037.png |
38KB | 真資料圖 | 中國電池廠資本支出 YoY 與 Hiwin 營收 YoY 折線 2009–2028E |
報告_JPM_台灣工業自動化_Initiation_20261026_038.png |
38KB | 真資料圖 | 中國車廠資本支出 YoY 與 Hiwin 營收 YoY 折線 2009–2028E |
報告_JPM_台灣工業自動化_Initiation_20261026_039.png |
39KB | 真資料圖 | 中國工業機器人月產量(units,長條)與 YoY(灰線)Mar-16–Mar-26 起 |
報告_JPM_台灣工業自動化_Initiation_20261026_040.png |
35KB | 真資料圖 | 中國工業機器人累計產量(units,長條)與 YoY(灰線)Mar-16–Mar-26 起 |
報告_JPM_台灣工業自動化_Initiation_20261026_041.png |
32KB | 真資料圖 | 台灣工業機器人出口值(US$m,長條)與 YoY(灰線)2016–9M26 |
報告_JPM_台灣工業自動化_Initiation_20261026_042.png |
35KB | 真資料圖 | 台灣工業機器人對中國出口值(US$m,長條)與 YoY 2016–9M26 |
報告_JPM_台灣工業自動化_Initiation_20261026_043.png |
26KB | 真資料圖 | 圓餅圖,台灣工業機器人 9M26 出口地區占比:中國 22%、美國 21%、以色列 17%、馬來西亞 7%、日本 6%、荷蘭 4%、越南、泰國 3%、其他 16% |
報告_JPM_台灣工業自動化_Initiation_20261026_044.png |
33KB | 真資料圖 | 台灣工業機器人對美國出口值(US$m,長條)與 YoY(灰線)2016–9M26 |
報告_JPM_台灣工業自動化_Initiation_20261026_045.png |
22KB | 真資料圖 | 中國氣動元件市占折線 2013–1H26:SMC(藍,約 31%→33%)、AirTAC(灰,約 14%→30%)、Festo(黑,約 9%→13%) |
報告_JPM_台灣工業自動化_Initiation_20261026_046.png |
18KB | 真資料圖 | SMC 分地區營收堆疊長條(JPY bn)2018–2026(日本、美國、中國、亞洲、歐洲、其他) |
報告_JPM_台灣工業自動化_Initiation_20261026_047.png |
19KB | 真資料圖 | THK 分地區營收堆疊長條(JPY bn)2018–2025(日本、美洲、歐洲、中國、其他) |
報告_JPM_台灣工業自動化_Initiation_20261026_048.png |
18KB | 真資料圖 | NSK 分地區營收堆疊長條(JPY bn)2018–2025(日本、美洲、歐洲、中國、其他亞洲) |
報告_JPM_台灣工業自動化_Initiation_20261026_049.png |
26KB | 真資料圖 | FANUC 分部門營收堆疊長條(JPY bn)1Q25–1Q26(FA、Robot、Robomachine、Service) |
報告_JPM_台灣工業自動化_Initiation_20261026_050.png |
27KB | 真資料圖 | 西門子 Digital Industries 與 Smart Infrastructure 營收 YoY 長條 2020–2028E |
報告_JPM_台灣工業自動化_Initiation_20261026_051.png |
39KB | 真資料圖 | AirTAC 股價(藍)與指數(灰)近一年走勢(封面 Price Performance 小圖) |
報告_JPM_台灣工業自動化_Initiation_20261026_052.png |
23KB | 真資料圖 | 長條圖 Performance Drivers:Market 33%、Region 2%、Macro 12%、Style 3%、Idiosyn. 50% |
報告_JPM_台灣工業自動化_Initiation_20261026_053.png |
23KB | 真資料圖 | AirTAC 毛利率長條圖 2020–2028E(49.5%、48.6%、45.6%、46.1%、46.7%、46.0%、49.1%、49.1%、48.7%) |
報告_JPM_台灣工業自動化_Initiation_20261026_054.png |
24KB | 真資料圖 | 堆疊長條,中國氣動市占 2015/2020/2025/1H26:SMC 32/34/33/33%、AirTAC 16/23/30/30%、Festo 11/12/13/13%、其他 41/31/24/24% |
報告_JPM_台灣工業自動化_Initiation_20261026_055.png |
33KB | 真資料圖 | AirTAC 存貨天數(長條)與存貨 YoY(灰線)2020–2028E |
報告_JPM_台灣工業自動化_Initiation_20261026_056.png |
31KB | 真資料圖 | AirTAC 分產品營收占比堆疊長條 2021–2025(氣動執行元件 47–48%、控制元件 21–23%、氣源處理 6–7%、其他 23–26%) |
報告_JPM_台灣工業自動化_Initiation_20261026_057.png |
21KB | 真資料圖 | AirTAC 直銷占營收比折線 2016–2025(約 79% 降至 66% 再回 68%) |
報告_JPM_台灣工業自動化_Initiation_20261026_058.png |
34KB | 真資料圖 | AirTAC 分產業營收占比堆疊長條 2021–2025(電子、電池、汽車、包裝、工具機、一般機械、紡織、其他;2025 電子 27%、電池 14%) |
報告_JPM_台灣工業自動化_Initiation_20261026_059.png |
22KB | 真資料圖 | AirTAC 分地區營收占比 2021–2025(中國 93–94%、台灣 2–3%、海外 4%) |
報告_JPM_台灣工業自動化_Initiation_20261026_060.png |
106KB | 真資料圖 | 氣動系統作動示意插圖:空壓機(Air Compressor)→ 氣源處理單元(FRL,含排水)→ 氣閥(Air valve)→ 氣缸(Cylinder),虛線箭頭表示氣流順序,產品皆標 AirTAC |
報告_JPM_台灣工業自動化_Initiation_20261026_061.png |
287KB | 真資料圖 | 汽車組裝線實景照片,兩處黃色虛線圈出多支氣缸(Product application by industry - automobile assembly) |
報告_JPM_台灣工業自動化_Initiation_20261026_062.png |
42KB | 真資料圖 | Hiwin 股價(藍)與指數(灰)近一年走勢(Price Performance 小圖) |
報告_JPM_台灣工業自動化_Initiation_20261026_063.png |
22KB | 真資料圖 | Hiwin 機器人營收占總營收比長條 2021–2028E(7%、8%、8%、7%、9%、12%、12%、13%) |
報告_JPM_台灣工業自動化_Initiation_20261026_064.png |
22KB | 真資料圖 | Hiwin 機器人營收 YoY 長條 2021–2028E(2%、17%、-17%、-7%、26%、62%、21%、13%) |
報告_JPM_台灣工業自動化_Initiation_20261026_065.png |
32KB | 真資料圖 | 線性滑軌出口均價(US$/pc)折線 Jan-14–2026,約 5–29 區間 |
報告_JPM_台灣工業自動化_Initiation_20261026_066.png |
41KB | 真資料圖 | 毛利率比較折線 1Q15–1Q26:AirTAC(約 54%→50%)、Hiwin(約 25–41%→34%)、Syntec(約 42–49%) |
報告_JPM_台灣工業自動化_Initiation_20261026_067.png |
28KB | 真資料圖 | Hiwin 分產品營收占比堆疊長條 2021–2025(線性滑軌 62–64%、滾珠螺桿 19–22%、機器人 7–9%、其他) |
報告_JPM_台灣工業自動化_Initiation_20261026_068.png |
30KB | 真資料圖 | Hiwin 分地區營收占比堆疊長條 2021–2025(台灣 50%→44%、德國、中國 18%→21%、日本、美國、其他) |
報告_JPM_台灣工業自動化_Initiation_20261026_069.png |
95KB | 真資料圖 | Hiwin 線性滑軌產品照:多種尺寸導軌與滑塊(紅綠色滑塊,含微型導軌) |
報告_JPM_台灣工業自動化_Initiation_20261026_070.png |
22KB | 真資料圖 | Hiwin 外資持股比率折線 Oct-16–Oct-26(約 19–48%,近期回升至約 39%) |
報告_JPM_台灣工業自動化_Initiation_20261026_071.png |
75KB | 真資料圖 | Hiwin 滾珠螺桿產品照:多種螺桿與螺帽(含法蘭型與軸端加工件,螺帽刻 HIWIN) |
報告_JPM_台灣工業自動化_Initiation_20261026_072.png |
37KB | 真資料圖 | Syntec 股價(藍)與指數(灰)近一年走勢(Price Performance 小圖) |
報告_JPM_台灣工業自動化_Initiation_20261026_073.png |
23KB | 真資料圖 | 中國 CNC 出貨量(k units,長條)與 YoY(灰線)2024–2028E |
報告_JPM_台灣工業自動化_Initiation_20261026_074.png |
19KB | 真資料圖 | Syntec 中國 CNC 市占(unit basis)長條:2024 20%、2025 23%、2026E 26.5%、2030E 33% |
報告_JPM_台灣工業自動化_Initiation_20261026_075.png |
43KB | 真資料圖 | Syntec 累計營收 YoY 與中國工具機、金屬切削工具機營收 YoY 折線 Jan-25–Jul-26 |
報告_JPM_台灣工業自動化_Initiation_20261026_076.png |
20KB | 真資料圖 | Syntec 控制器與伺服營收 YoY 長條:2025 19%/41%、2026E 97%/116%、2027E 24%/23%、2028E 8%/7% |
報告_JPM_台灣工業自動化_Initiation_20261026_077.png |
23KB | 真資料圖 | 聯達(Leantec)與 Jumbo FY24–FY25 營收、營業利益、稅後淨利長條(Leantec FY25 營收 58、獲利約 19–20;Jumbo FY25 營收 50、虧損約 25,NT$m) |
報告_JPM_台灣工業自動化_Initiation_20261026_078.png |
28KB | 真資料圖 | Syntec 智慧製造產品營收(NT$m,長條)與 YoY:2025 約 440、2026E 約 890(+103%)、2027E 約 1,430(+61%)、2028E 約 1,670(+16%) |
報告_JPM_台灣工業自動化_Initiation_20261026_079.png |
42KB | 真資料圖 | 印度工具機消費值(₹ Cr.,長條)與 YoY 2016-17–2025-26 |
報告_JPM_台灣工業自動化_Initiation_20261026_080.png |
24KB | 真資料圖 | 印度工具機產業生產、進口、出口值(₹ Cr.)2015-16–2025-26,進口大於生產 |
報告_JPM_台灣工業自動化_Initiation_20261026_081.png |
27KB | 真資料圖 | Syntec 分產品營收占比堆疊長條 2022–2025(控制器 51/55/53/48%、伺服 44/40/43/47%、智慧製造 3% 前後、其他 2%) |
報告_JPM_台灣工業自動化_Initiation_20261026_082.png |
21KB | 真資料圖 | Syntec 分地區營收占比 2021–2025(亞洲 95–98%、台灣 1–5%) |
報告_JPM_台灣工業自動化_Initiation_20261026_083.png |
128KB | 真資料圖 | Syntec 組織架構圖(截至 2025-12-31):母公司 100% 持有 Leantec、Jumbo Laser、Hong Kong Zhong Cheng、越南、印度、馬來西亞 SDN BHD 等子公司;Hong Kong Zhong Cheng 下轄 Syntec(Suzhou)、蘇州聯達、泰國等 |
報告_JPM_台灣工業自動化_Initiation_20261026_084.png |
24KB | 真資料圖 | Syntec 外資持股比率折線 Oct-25–Oct-26(約 9% 升至 18% 後回落至約 16%) |
報告_JPM_台灣工業自動化_Initiation_20261026_085.png |
201KB | 真資料圖 | Syntec 產品與集團業務圖:控制器、伺服驅動器、馬達、編碼器產品照,及 Syntec/Leantec/Jumbo 三大業務線(控制器與自動化、機器人與雲端、雷射與智慧工廠)圖示 |
報告_JPM_台灣工業自動化_Initiation_20261026_086.png |
82KB | 真資料圖 | AirTAC 股價與 JPM 歷次評等/目標價標註(N NT$1,085、N 1,000、OW 1,250、OW 1,075、OW 1,000、OW 1,150、OW 1,350)Jan-24–Sep-26 |
報告_JPM_台灣工業自動化_Initiation_20261026_087.png |
119KB | 真資料圖 | Hiwin 股價與評等/目標價歷史圖及表(N 200 → UW 160/155/145/140/160,2023-11–2026-03) |
原始內容
J PMORGAN
Taiwan Industrial Automation
Navigating the cycle: Assuming coverage of AirTAC (OW) an Hiwin (N); initiating on Syntec (OW)
We assume coverage of AirTac (at OW) and Hiwin (at Neutral) and initiate coverage of Syntec (at OW) in Taiwan's industrial automation sector. We see an upcycle underway supported by recovering machine-tool demand policy-backed manufacturing upgrades in China and structural AI/semis investment. However performance across the sector may vary depending on company growth drivers profitability and valuation. We prefer AirTAC and Syntec (both OW) over Hiwin (N) reflecting their stronger profitability and better risk-reward while Syntec is relatively under-covered with no foreign broker covering it currently.
- Cyclical recovery and structural capex support industry cycle. Japan Machine Tool Builders' Association (JMTBA) machine-tools orders a leading indicator of factory automation cycle rose 65% YoY in Aug 2026 marking the 14 th consecutive month of growth while Taiwan machinery export orders rose 23% YoY in 9M26. Beyond the cyclical recovery AI/semis investment provides structural demand with our tech team forecasting semis capex growth of 58%/29% YoY in 2026/27. Longer-term broader industrial robotics adoption and humanoid robot commercialization should offer additional growth opportunities for Taiwan's component and module suppliers.
- Growth drivers and profitability differentiate performance through the cycle. While all three names benefit from industry tailwinds solid growth drivers should drive higher profits for AirTAC and Syntec (FY26-28E ROE at 23%-46% vs. Hiwin at 8-9%). AirTAC continues to gain share in China's pneumatic market targeting 35%+ by 2030E from 30% in 1H26 with margins staying resilient on improved efficiency. Syntec's cost-performance advantage and responsive customer services underpin its rising CNC penetration in China while its product mix upgrades and smart-manufacturing business expansion reinforce further growth. We believe both should consistently outperform their respective markets with better through-cycle resilience. Hiwin's extended lead times enhance pricing and order visibility but its AI/ semis and robotics contributions will likely ramp gradually preventing material near-term earnings upgrades. Intensifying Chinese competition and more cyclical margins pose higher downside risks.
- AirTAC = Syntec > iwin: prefer quality and growth at attractive valuation. AirTAC is our quality pick on proven share-gains resilient margins through downcycles and an undemanding 16x FY27E P/E at 1-std below its LT-avg. Syntec offers greater earnings growth potential on rising market share and improving product mix at an attractive 15x FY27E P/E. Hiwin provides better near-term order visibility and liquidity but its weaker profitability premium valuation of 27x FY27E P/E and greater potential downside limit its risk-reward driving our preference for AirTAC and Syntec.
Equity Ratings and Price Targets
| Company | Ticker | Mkt Cap - ($ mn) | Price - CCY | Price | Rating - Cur | Rating - Prev | Price Target - Cur | Price Target - End Date | Price Target - PrevEnd Date | Price Target - PrevEnd Date |
|---|---|---|---|---|---|---|---|---|---|---|
| AirTAC | 1590 TT | 6,784 | TWD | 1,100.00 | OW | n/c | 1,600.00 | Dec-27 | 1,350.00 | Dec-26 |
| Hiwin | 2049 TT | 3,262 | TWD | 299.00 | N | UW | 310.00 | Dec-27 | 160.00 | Dec-26 |
| S ntec | 7750 TT | 4,010 | TWD | 1,810.00 | OW | - | 2,580.00Dec-27 | - | - |
Source: Compan data, Bloomberg Finance L.P., J.P. Morgan estimates. n/c = no change.All prices as of 22 Oct 26.
See page 69 or analyst certi ication and important disclosures, including non-US analyst disclosures.
Taiwan Industrial
Amanda Chang AC
(886-2) 2725-9861
aman a.chang@jpmorgan.com J.P. Morgan Securities (Taiwan) Limite
aren Li, CFA (852) 2800-8589 karen.yy.li@jpmorgan.com J.P. Morgan Securities (Asia Pacific) Limite / J.P. Morgan Broking (Hong Kong) Limite
Table Of Contents
| Investment Summary...................................... | 3 |
|---|---|
| Valuation Analysis......................................... | 9 |
| AirTAC: Dec-27 PT of NT$1,600 base on 22x 12M forwar EPS....... | 9 |
| Hiwin: Dec-27 PT of NT$310 base on 27x 12M forwar EPS.......... | 10 |
| Syntec: Dec-27 PT of NT$2,580 base on 20x 12M forwar EPS....... | 11 |
| Industry Analysis.......................................... | 14 |
| I. In ustrial automation cycle continues to show strength............. | 14 |
| II. CAPEX outlook by in ustry.................................. | 18 |
| III. Robotics as the long-term growth river........................ | 21 |
| IV. Competitive lan scape..................................... | 24 |
| AirTAC. . . . . . . . . . . . . . . . . . . . . . . . . . . . . . . . . . . . . . . . . . . . . . . . . . . . . | 27 |
| Investment Thesis........................................... | 29 |
| Investment Risks............................................ | 32 |
| Company Backgroun ........................................ | 33 |
| Financial Analysis........................................... | 35 |
| Hiwin. . . . . . . . . . . . . . . . . . . . . . . . . . . . . . . . . . . . . . . . . . . . . . . . . . . . . . | 41 |
| Investment Thesis........................................... | 43 |
| Investment Risks............................................ | 45 |
| Company Backgroun ........................................ | 46 |
| Financial Analysis........................................... | 48 |
| Syntec. . . . . . . . . . . . . . . . . . . . . . . . . . . . . . . . . . . . . . . . . . . . . . . . . . . . . | 55 |
| Investment Thesis........................................... | 57 |
| Investment Risks............................................ | 60 |
| Company Backgroun ........................................ | 61 |
| Financial Analysis........................................... | 63 |
Investment Summary
The industrial automation cycle is supported by cyclical recovery and structural capex. From a top-down perspective we see indicators remaining constructive including: 1) JMTBA (Japan Machine Tool Builders' Association) orders rose 65% YoY in Aug 2026 for the 14 th consecutive monthly increase while China orders were still robust at 62% YoY; Taiwan machinery export orders increased 23% YoY in 9M26 with linear guideway/ball screw exports also up 13%/10% YoY respectively. 2) AI and semiconductor capex are providing a structural driver with our tech team forecasting semi capex growth of 58%/29% YoY in 2026/27E and AI-driven manufacturing and infrastructure buildouts adding incremental automation demand. 3) In the long-run robotics offers another growth driver with industrial robot applications expanding and humanoid commercialization to ramp up in 2027 driving global humanoid robot shipments to c.1.75mn units by 2030E per our industrial team's forecasts and benefiting Taiwan's component and module suppliers.
Figure 1: Monthly Japan Machine Tools Order growth vs company sales growth
Source: JMTBA, Compan data, J.P. Morgan.
Pecking order: AirTAC (OW) = Syntec (OW) > iwin (N). We assume coverage of AirTAC at OW and Hiwin at Neutral and initiate on Syntec at OW. While all three names benefit from the industrial automation upcycle we prefer AirTAC and Syntec for their stronger profitability more structural growth drivers and better risk-reward. Hiwin offers greater near-term order visibility and liquidity but its lower ROE premium valuation and higher margin-downside risk limit its relative appeal.
- Stronger profitability and returns. AirTAC and Syntec have higher-quality business models with FY26E GM/OPM/ROE of 49%/34%/23% and 46%/29%/46% well ahead of Hiwin's 34%/13%/8%. We believe AirTAC's scale operating efficiency and proven share-gain track record together with Syntec's improved product mix and continued market share growth should support better through-cycle earnings resilience. By contrast Hiwin's lower structural ROE and greater exposure to price competition leave it more vulnerable in a downturn.
-
More structural growth drivers. AirTAC and Syntec have clearer self-help drivers incl. AirTAC's China share gains and efficiency improvements and Syntec's rising CNC controller penetration product upgrades and increasing turnkey adoption. New applications such as AirTAC's electrical controllers/ semiconductor exposure and Syntec's smart manufacturing business also add to medium-term growth potential.
-
Better risk-reward. AirTAC trades at 16x FY27E P/E c.1-std below its 10Y average forward P/E which we view as undemanding given its resilient margins and expanding market share. Syntec's valuation of 15x FY27E P/E remains attractive relative to its earnings growth and peer valuations supported by share gains and product mix upgrades. Hiwin benefits from better near-term order visibility and liquidity which however we believe is largely reflected in its 27x FY27E P/E while weaker ROE and greater margin sensitivity in a downturn limit relative upside.
AirTAC: Quality growth in China's automation upcycle (OW; Dec-27 PT NT $1,600). AirTAC is China's second-largest pneumatic components supplier with 30% market share in 1H26 (vs 33% for SMC) and is delivering above-industry growth driven by: 1) continued share gains to c.35%+ by 2030E; 2) resilient GM of 49.1% in our FY26/27E forecast on improved utilization and efficiency; and 3) solid pneumatic demand with key end markets (e.g. electronics batteries autos machinery) growing double-digits in FY26E. Following 32% underperformance vs the TAIEX since the August peak we view the pullback as largely seasonal with valuation undemanding at 16x FY27E P/E and expect momentum to improve into the 2Q27 peak season. Our PT of NT$1 600 (45% potential upside) is based on a target P/E of 22x and a 12M fwd EPS of NT$72.7 supported by a 20% EPS CAGR in FY25-28E. Key risks incl.: faster-thanexpected cycle normalization margin pressure from competition/raw material costs execution risks on new growth initiatives and higher-than-expected opex.
iwin: Solid visibility but valuation and margin cyclicality limit upside (N; Dec-27 PT of NT$310). Hiwin is a leading linear guideways and ball screws supplier benefiting from the recovering automation cycle and rising AI/semiconductor and robotics demand while the extended lead times (4-6 months for linear guideways; 6 months for ball screws) should also support pricing power and order visibility. However Hiwin's valuation remains relatively demanding with its 27x FY27E P/E representing a 30-40% premium to domestic peer average despite structurally lower profitability and greater margin downside in a cyclical downturn. With semiconductor and robotics contributions expected to ramp up gradually we see limited room for material earnings upgrades and further re-rating potential resulting in its less compelling risk-reward than peers. Our PT of NT$310 (4% upside) is based on 27x 12M forward EPS reflecting no re-rating/de-rating impulse from here to our PT horizon. Key upside risks include a faster ramp-up in semiconductor equipment and robotics stronger margin expansion and sustained order momentum; downside risks include a slowdown in the automation cycle intensifying competition rising raw material costs and adverse FX fluctuations.
Syntec: A rising share gainer from controllers to smart factories (OW; Dec-27 PT of NT$2,580). Syntec supplies CNC controllers (48% of FY25 revenue) and servo products (47%) with >90% of revenue from China. Following its 104% YoY revenue growth in 9M26 we see further growth potential driven by: 1) continued share gains in China's CNC controller market from c.20% in FY24 to >25% in FY26E supported by stable lead times amid memory supply disruptions cost-performance advantage strong local service capabilities and an open platform architecture that enables better customization; management targets 33% share by 2030E and expects its controller revenue growth to outpace the industry by 10-15ppt annually; 2) product mix upgrades and rising turnkey penetration with c.90% of controllers bundled with servos increasing Syntec's content per machine and strengthening customer retention through more integrated control-and-servo solutions; and 3) expansion in smart manufacturing (incl. robotics and cloud services) where we forecast 103%/61% YoY revenue growth in FY26/27E as Syntec leverages its installed base of controllers and servo systems to cross-sell robotics and factory-automation solutions.
Despite outperforming the TAIEX by 54% YTD Syntec trades at 15x FY27E P/E which we view as undemanding given a stronger 2H26 vs. 1H26 and our EPS growth forecast of 167%/27% YoY in FY26/27E. Our Dec-27 PT of NT$2 580 implying 43% upside is based on 20x 12M forward EPS underpinned by a 54% FY25-28E EPS CAGR and an improving earnings trajectory vs. its own history. Key risks include share gains failing to materialize or persist after the memory disruption eases component cost inflation and supply constraints China revenue concentration and cyclicality and higher-than-expected opex.
Where are we vs consensus? Relative to Bloomberg consensus our forecasts are broadly aligned on revenue with differences driven mainly by margin and operating leverage assumptions. For AirTAC we are only slightly above consensus in FY26E but below in FY27-28E with revenue differences of +1%/-2%/-3% and EPS differences of +1%/-3%/-5%. This reflects a more conservative view on growth outlook as the cycle normalizes given pneumatic's typically short lead times and limited order visibility. For Hiwin our revenue forecast is broadly in line through FY27E and more constructive in FY28E (+1%/+2%/+12%) but our GM and OPM assumptions are more conservative in FY26-28E. For Syntec we are more positive on the near-term with FY26E revenue +5% and EPS +9% vs. consensus supported by stronger demand and mix; the gap narrows in FY27E with revenue broadly in line and EPS +3% while FY28 consensus is unavailable.
Table 1: Company comparison - AirTAC vs Hiwin vs Syntec
| Company | AirTAC | HiWin | Syntec |
|---|---|---|---|
| Ticker | 1590 TT Equity | 2049 TT Equity | 7750 TT Equity |
| Establishment | 1988 | 1989 | 1995 |
| Market cap (US$mn) | 6,759 | 3,250 | 3,995 |
| FINI holding | 80% | 39% | 16% |
| YTD performance | 21% | 55% | 113% |
| 1M performance | -11% | -10% | -8% |
| FY25 Financials | |||
| Sales (US$mn) | 1,105 | 781 | 449 |
| YoY sales growth | 12% | -1% | 29% |
| Gross margin | 46% | 29% | 46% |
| Operating margin | 30% | 7% | 20% |
| ROE | 17% | 4% | 28% |
| Net debt/equity | -7% | 6% | -66% |
| Capex (US$mn) | 90 | 89 | 24 |
| CAPEX to sales | 8% | 11% | 5% |
| Sales mix by region | China (94%); Taiwan (2%); Overseas (4%) | Taiwan (44%); China (21%); Germany (16%); U.S. (5%); Japan (4%); Others (10%) | Asia (98%); Taiwan (1%); Overseas (0%) |
| Sales mix by product | Pneumatic actuator (47%); Pneumatic control component (21%); Air preparation unit (6%); Others (26%) | Linear guideways (62%); Ball screws (20%); Robots (9%); Others (9%) | Controllers (48%); Servos (47%); Smart manufacturing (3%); Others (2%) |
Source: Compan data, Bloomberg Finance L.P., TEJ, J.P. Morgan. Note: data as of Oct 22, 2026. Past performance is not an indicator of future results.
Table 2: Financial summary by company
| Company | 1Q26 | 2Q26 | 3Q26E | 4Q26E | FY24 | FY25 | FY26E | FY27E | FY28E |
|---|---|---|---|---|---|---|---|---|---|
| Revenue (NT$m; YoY) | |||||||||
| AirTAC | 10,014 | 12,164 | 11,512 | 10,961 | 30,660 | 34,330 | 44,651 | 49,268 | 53,517 |
| YoY | 24% | 36% | 40% | 21% | 3% | 12% | 30% | 10% | 9% |
| Hiwin | 6,379 | 7,508 | 8,110 | 8,049 | 24,392 | 24,263 | 30,046 | 35,072 | 37,048 |
| YoY | 9% | 27% | 35% | 24% | -1% | -1% | 24% | 17% | 6% |
| Syntec | 4,865 | 8,260 | 7,805 | 7,851 | 10,808 | 13,960 | 28,781 | 35,883 | 38,807 |
| YoY | 49% | 107% | 158% | 112% | 37% | 29% | 106% | 25% | 8% |
| EPS (NT$; YoY) | |||||||||
| AirTAC | 13.4 | 16.6 | 15.6 | 14.7 | 38.1 | 42.0 | 60.2 | 67.1 | 72.7 |
| YoY | 38% | 63% | 48% | 27% | 9% | 10% | 43% | 11% | 8% |
| Hiwin | 1.6 | 2.4 | 2.5 | 2.5 | 5.6 | 4.3 | 9.0 | 11.1 | 11.5 |
| YoY | 20% | 527% | 98% | 92% | -3% | -23% | 110% | 23% | 4% |
| Syntec | 15.4 | 27.1 | 24.8 | 26.3 | 22.3 | 35.1 | 93.6 | 119.1 | 129.0 |
| YoY | 100% | 185% | 339% | 104% | 106% | 57% | 167% | 27% | 8% |
| GM (%) | |||||||||
| AirTAC | 48.0% | 49.7% | 49.3% | 49.1% | 46.7% | 46.0% | 49.1% | 49.1% | 48.7% |
| Hiwin | 31.9% | 34.2% | 34.6% | 34.3% | 29.6% | 28.8% | 33.8% | 34.2% | 33.6% |
| Syntec | 48.8% | 44.1% | 45.6% | 45.7% | 43.9% | 45.8% | 45.7% | 45.9% | 45.6% |
| OPM (%) | |||||||||
| AirTAC | 33.2% | 35.1% | 34.0% | 33.8% | 29.4% | 30.0% | 34.1% | 34.2% | 34.2% |
| Hiwin | 9.9% | 13.8% | 14.1% | 12.8% | 8.4% | 6.8% | 12.8% | 13.8% | 13.5% |
| Syntec | 25.8% | 28.9% | 29.2% | 29.6% | 15.2% | 20.2% | 28.7% | 30.1% | 30.1% |
| ROE (%, annualized) | |||||||||
| AirTAC | 20.7% | 25.1% | 22.1% | 21.1% | 16.9% | 16.7% | 22.6% | 23.7% | 23.4% |
| Hiwin | 5.8% | 8.5% | 8.6% | 8.6% | 5.5% | 4.1% | 8.2% | 9.5% | 9.3% |
| Syntec | 37.7% | 61.0% | 48.4% | 45.6% | 34.3% | 28.1% | 46.1% | 42.6% | 36.8% |
Source: Compan reports, J.P. Morgan estimates.
Table 3: Monthly revenues and growth by company
| Month | Revenues (NT$m) - AirTAC | Revenues (NT$m) - Hiwin | Revenues (NT$m) - Syntec | Revenues (YoY) - AirTAC | Revenues (YoY) - Hiwin | Revenues (YoY) - Syntec | Revenues (MoM) - AirTAC | Revenues (MoM) - Hiwin | Revenues (MoM) - Syntec |
|---|---|---|---|---|---|---|---|---|---|
| Jan-26 | 3,702 | 2,150 | 1,676 | 66.8% | 13.1% | 102.9% | 11.8% | -3.1% | 13.8% |
| Feb-26 | 2,171 | 1,872 | 942 | -8.4% | -3.0% | 2.7% | -41.4% | -12.9% | -43.8% |
| Mar-26 | 4,140 | 2,357 | 2,246 | 18.1% | 17.4% | 48.6% | 90.6% | 25.9% | 138.5% |
| Apr-26 | 4,342 | 2,474 | 2,920 | 25.2% | 20.7% | 94.9% | 4.9% | 5.0% | 30.0% |
| May-26 | 3,909 | 2,480 | 2,690 | 40.4% | 28.2% | 88.3% | -10.0% | 0.2% | -7.9% |
| Jun-26 | 3,913 | 2,554 | 2,650 | 44.9% | 31.6% | 151.4% | 0.1% | 3.0% | -1.5% |
| Jul-26 | 3,994 | 2,682 | 2,870 | 50.8% | 33.9% | 202.6% | 2.1% | 5.0% | 8.3% |
| Aug-26 | 3,708 | 2,708 | 2,437 | 43.3% | 42.3% | 151.1% | -7.2% | 1.0% | -15.1% |
| Sep-26 | 3,811 | 2,720 | 2,499 | 26.6% | 30.1% | 125.1% | 2.8% | 0.4% | 2.6% |
Source: MOPS.
Table 4: Price target analysis by company
| Item | AirTAC | Hiwin | Syntec |
|---|---|---|---|
| Dec-27 PT (NT$) | 1,600 | 310 | 2,580 |
| 12M forward EPS (NT$) | 72.7 | 11.5 | 129.0 |
| Target P/E multiple (x) | 22.0 | 27.0 | 20.0 |
| Share price (NT$, Oct 22, 2026) | 1,100 | 299 | 1,810 |
| Implied upside/downside (%) | 45% | 4% | 43% |
| FY27E P/E (x, JPME) | 16.4 | 26.9 | 15.2 |
| FY27E P/E (x, BBG) | 15.9 | 25.2 | 15.7 |
| 12M Fwd P/E_Current (x, BBG) | 17.2 | 27.4 | 17.4 |
| 12M Fwd P/E_10Y average (x, BBG) | 23.6 | 33.7 | 16.3 |
| EPS CAGR (FY25-28E) | 20% | 39% | 54% |
| ROE (FY27E) | 24% | 9% | 43% |
Source: Bloomberg Finance L.P. estimates, J.P. Morgan estimates. Note: S ntec's 10Y average forward P/E refers to its average P/E since listing on TWSE in 2025.
Table 5: Valuation summary by company
| Company | 10/22/2026 - Ticker | Price - (LCY) | Mkt Cap - (US$mn) | 3M_ADV - (US$m) | P/E (x) - 26E | P/E (x) - 27E | P/B (x) - 26E | P/B (x) - 27E | ROE - 26E | ROE - 27E | EPS growth - 26E | EPS growth - 27E |
|---|---|---|---|---|---|---|---|---|---|---|---|---|
| JPM estimates | ||||||||||||
| AirTAC | 1590 TT | 1,100.0 | 6,759 | 37 | 18.3 | 16.4 | 4.1 | 3.7 | 22.6% | 23.7% | 43.3% | 11.4% |
| Hiwin | 2049 TT | 299.0 | 3,250 | 45 | 33.1 | 26.9 | 2.6 | 2.5 | 8.2% | 9.5% | 109.6% | 22.8% |
| Syntec | 7750 TT | 1,810.0 | 3,995 | 19 | 19.3 | 15.2 | 7.6 | 5.9 | 46.1% | 42.6% | 166.5% | 27.2% |
| BBG consensus | ||||||||||||
| AirTAC | 1590 TT | 1,100.0 | 6,759 | 37 | 18.5 | 15.9 | 3.8 | 3.4 | 21.5% | 22.6% | 41.8% | 16.0% |
| Hiwin | 2049 TT | 299.0 | 3,250 | 45 | 32.2 | 25.2 | 2.7 | 2.5 | 8.8% | 10.4% | 115.2% | 27.9% |
| Syntec | 7750 TT | 1,810.0 | 3,995 | 19 | 21.2 | 15.7 | 7.6 | 5.7 | 44.3% | 47.5% | 143.5% | 34.7% |
Source: Bloomberg Finance L.P., J.P. Morgan estimates.
Table 6: YTD share price per ormance by company
| Company | Ticker | 22-Oct-26 - Price | Absolute performance - 1m | Absolute performance - 3m | Absolute performance - 6m | Absolute performance - YTD | Relative to TWSE - 1m | Relative to TWSE - 3m | Relative to TWSE - 6m | Relative to TWSE - YTD |
|---|---|---|---|---|---|---|---|---|---|---|
| AirTAC | 1590 TT | 1,100 | -11% | -22% | -15% | 21% | -8% | -24% | -37% | -38% |
| Hiwin | 2049 TT | 299 | -10% | -6% | -4% | 55% | -7% | -9% | -25% | -4% |
| Syntec | 7750 TT | 1,810 | -8% | -16% | -11% | 113% | -4% | -19% | -33% | 54% |
| TAIEX | TWSE Index | 46,041 | -4% | 3% | 22% | 59% | 0% | 0% | 0% | 0% |
Source: Bloomberg Finance L.P. Note: Past performance is not an indicator of future results.
Figure 2: Historical share price trend by company
Source: Bloomberg Finance L.P. Note: Past performance is not an indicator of future results.
Figure 3: AirTAC's share per ormance typically so tens in Q3 and tends to improve in Q4
Source: Bloomberg Finance L.P.
Table 7: Annual JPMe vs BBG consensus estimates - AirTAC
| NT$m | JPMe - 2026E | JPMe - 2027E | JPMe - 2028E | Consensus - 2026E | Consensus - 2027E | Consensus - 2028E | Difference (JPMe vs. Con) - 2026E | Difference (JPMe vs. Con) - 2027E | Difference (JPMe vs. Con) - 2028E |
|---|---|---|---|---|---|---|---|---|---|
| Revenues | 44,651 | 49,268 | 53,517 | 44,172 | 50,093 | 55,206 | 1% | -2% | -3% |
| Gross profit | 21,904 | 24,183 | 26,065 | 21,580 | 24,566 | 26,796 | 2% | -2% | -3% |
| Operating profit | 15,204 | 16,872 | 18,276 | 15,017 | 17,296 | 19,054 | 1% | -2% | -4% |
| Pre-tax profit | 15,329 | 16,978 | 18,417 | 15,225 | 17,565 | 19,364 | 1% | -3% | -5% |
| Net income | 12,039 | 13,413 | 14,549 | 11,923 | 13,815 | 15,193 | 1% | -3% | -4% |
| GM (%) | 49.1% | 49.1% | 48.7% | 48.9% | 49.0% | 48.8% | 13 bps | 6 bps | -7 bps |
| OPM (%) | 34.1% | 34.2% | 34.2% | 34.1% | 34.7% | 34.4% | -7 bps | -46 bps | -23 bps |
| EPS (Basic, NT$) | 60.2 | 67.1 | 72.7 | 59.5 | 69.0 | 76.3 | 1% | -3% | -5% |
Source: Bloomberg Finance L.P. estimates, J.P. Morgan estimates.
Table 8: Annual JPMe vs BBG consensus estimates - Hiwin
| NT$m | JPMe - 2026E | JPMe - 2027E | JPMe - 2028E | Consensus - 2026E | Consensus - 2027E | Consensus - 2028E | Difference (JPMe vs. Con) - 2026E | Difference (JPMe vs. Con) - 2027E | Difference (JPMe vs. Con) - 2028E |
|---|---|---|---|---|---|---|---|---|---|
| Revenues | 30,046 | 35,072 | 37,048 | 29,864 | 34,334 | 33,067 | 1% | 2% | 12% |
| Gross profit | 10,164 | 11,993 | 12,460 | 10,218 | 12,204 | 11,190 | -1% | -2% | 11% |
| Operating profit | 3,833 | 4,850 | 5,010 | 4,010 | 5,214 | 5,045 | -4% | -7% | -1% |
| Pre-tax profit | 3,998 | 4,923 | 5,098 | 4,184 | 5,305 | 5,012 | -4% | -7% | 2% |
| Net income | 3,199 | 3,928 | 4,067 | 3,367 | 4,264 | 4,005 | -5% | -8% | 2% |
| GM (%) | 33.8% | 34.2% | 33.6% | 34.2% | 35.2% | 34.4% | -37 bps | -97 bps | -81 bps |
| OPM (%) | 12.8% | 13.8% | 13.5% | 13.5% | 15.5% | 15.9% | -71 bps | -170 bps | -234 bps |
| EPS (Basic, NT$) | 9.0 | 11.1 | 11.5 | 9.3 | 11.9 | 11.3 | -3% | -6% | 1% |
Source: Bloomberg Finance L.P. estimates, J.P. Morgan estimates.
Table 9: Annual JPMe vs BBG consensus estimates - Syntec
| NT$m | JPMe - 2026E | JPMe - 2027E | JPMe - 2028E | Consensus - 2026E | Consensus - 2027E | Consensus - 2028E | Difference (JPMe vs. Con) - 2026E | Difference (JPMe vs. Con) - 2027E | Difference (JPMe vs. Con) - 2028E |
|---|---|---|---|---|---|---|---|---|---|
| Revenues | 28,781 | 35,883 | 38,807 | 27,384 | 36,050 | NA | 5% | 0% | NA |
| Gross profit | 13,163 | 16,464 | 17,679 | 12,584 | 16,733 | NA | 5% | -2% | NA |
| Operating profit | 8,248 | 10,787 | 11,671 | 7,561 | 10,425 | NA | 9% | 3% | NA |
| Pre-tax profit | 8,539 | 10,859 | 11,763 | 7,937 | 10,710 | NA | 8% | 1% | NA |
| Net income | 6,536 | 8,315 | 9,008 | 6,076 | 8,214 | NA | 8% | 1% | NA |
| GM (%) | 45.7% | 45.9% | 45.6% | 46.0% | 46.4% | NA | -22 bps | -53 bps | NA |
| OPM (%) | 28.7% | 30.1% | 30.1% | 27.6% | 28.9% | NA | 105 bps | 114 bps | NA |
| EPS (Basic, NT$) | 93.6 | 119.1 | 129.0 | 85.5 | 115.2 | NA | 9% | 3% | NA |
Source: Bloomberg Finance L.P. estimates, J.P. Morgan estimates.
Valuation Analysis
AirTAC: Dec-27 PT of NT$1,600 based on 22x 12M forward EPS
We derive our Dec-27 PT of NT$1 600 based on 22x 12M forward EPS implying 45% potential upside. We value AirTAC on a P/E basis as the margin and earnings growth outlooks are the key valuation drivers. Based on Bloomberg consensus AirTAC trades at 19x/16x FY26/27E P/E broadly in line with Japanese peers but at a 15-25% discount to China/Hong Kong peers. We believe this discount is wider than warranted as our forecast 20% FY25-28E EPS CAGR is close to the 21% for China/HK peers with our expected ROE of 23-24% higher than 14-16% for China/HK peers. Our 22x target P/E implies a narrower discount to China/HK peers reflecting AirTAC's comparable longterm growth and its leading position in China's pneumatic components market while remaining below its 10-year average of 24x on a more conservative basis given the potential for a cyclical downturn.
Figure 4: Share price per ormance analysis - AirTAC
Source: Bloomberg Finance L.P., J.P. Morgan. Note: Past performance is not an indicator of future results.
Table 10: Valuation summary - AirTAC
| Item | Value |
|---|---|
| 12M forward EPS (NT$) | 72.7 |
| Target P/E (x) | 22.0 |
| Price Target (Dec-27, NT$) | 1,600 |
| Current share price (as of 22 Oct 2026) | 1,100 |
| Upside/Downside | 45% |
| AirTAC historical trading P/E (x) | |
| 10-year average | 23.6 |
| ±2 Std Dev band | 11.8-35.4 |
| Peer median P/E (FY27E, x) | |
| Domestic peers | 15.9 |
| Japan peers | 17.2 |
| China and HK peers | 19.1 |
Source: Bloomberg Finance L.P. , J.P. Morgan estimates.
Figure 5: Forward P/E - AirTAC
Source: Bloomberg Finance L.P., J.P. Morgan calculations.
Figure 6: 3M average trading value - AirTAC
Source: TEJ, J.P. Morgan calculations.
Figure 7: Weekly net buy/sell vs. share price o AirTAC -YTD2026
Source: TEJ, J.P. Morgan calculations.
Hiwin: Dec-27 PT of NT$310 based on 27x 12M forward EPS
Our Dec-27 PT of NT$310 is based on 27x 12M forward EPS implying 4% upside from current levels. We use a P/E methodology given the importance of earnings growth and profitability to Hiwin's valuation. While Hiwin trades below its long-term average its 30-40% P/E premium to domestic peer average appears demanding given its structurally lower ROE and limited near-term earnings upside. However we do not expect a significant de-rating towards peer valuations as Hiwin's better liquidity order visibility and thematic interest in AI/semiconductor equipment and robotics continue to support a premium. We therefore adopt a 27x target multiple reflecting no re-rating/derating impulse from here to our PT horizon.
Figure 8: Share price per ormance analysis - Hiwin
Source: Bloomberg Finance L.P., J.P. Morgan. Note: Past performance is not an indicator of future results.
Table 11: Valuation summary - Hiwin
| Item | Value |
|---|---|
| 12M forward EPS (NT$) | 11.5 |
| Target P/E (x) | 27.0 |
| Price Target (Dec-27, NT$) | 310 |
| Current share price (as of 22 Oct 2026) | 299 |
| Upside/Downside | 4% |
| Hiwin historical trading P/E (x) | |
| 10-year average | 33.7 |
| ±2 Std Dev band | 11.8-55.7 |
| Peer median P/E (FY27E, x) | |
| Domestic peers | 15.9 |
| Japan peers | 17.2 |
| China and HK peers | 19.1 |
Source: Bloomberg Finance L.P., J.P. Morgan estimates.
Figure 10: 3M average trading value - Hiwin
Source: TEJ, J.P. Morgan calculations.
Figure 9: Forward P/E - Hiwin
Source: Bloomberg Finance L.P., J.P. Morgan calculations.
Figure 11: Weekly net buy/sell vs. share price o Hiwin -YTD2026
Source: TEJ, J.P. Morgan calculations.
Syntec: Dec-27 PT of NT$2,580 based on 20x 12M forward EPS
We derive our Dec-27 PT of NT$2 580 based on 20x 12M forward EPS implying 43% potential upside. We value Syntec on a P/E basis since the margin and earnings growth outlook would be the key valuation drivers. Our target multiple of 20x P/E is above Syntec's average forward P/E since listing on TWSE which we believe is justified given its higher growth and an improving earnings trajectory vs. history with FY25-28E EPS CAGR of 54% supported by ongoing share gains and mix upgrade. According to Bloomberg consensus estimates Syntec trades at 21x/16x P/E for FY26/27E representing 10-20% discount to the domestic peer average due to its shorter publicmarket track record and lower liquidity despite the decent earnings growth outlook.
Figure 12: Share price per ormance analysis - Syntec
Source: Bloomberg Finance L.P., J.P. Morgan. Note: Past performance is not an indicator of future results.
Table 12: Valuation summary - Syntec
| Item | Value |
|---|---|
| 12M forward EPS (NT$) | 129.0 |
| Target P/E (x) | 20.0 |
| Price Target (Dec-27, NT$) | 2,580 |
| Current share price (as of 22 Oct 2026) | 1,810 |
| Upside/Downside | 43% |
| Syntec historical trading P/E (x) | |
| Average since listed on TWSE | 16.3 |
| ±2 Std Dev band | 5.5-27 |
| Peer median P/E (FY27E, x) | |
| Domestic peers | 15.9 |
| Japan peers | 17.2 |
| China and HK peers | 19.1 |
Source: Bloomberg Finance L.P., J.P. Morgan estimates.
Figure 14: 3M average trading value - Syntec
Source: TEJ, J.P. Morgan calculations.
Figure 13: Forward P/E - Syntec
Source: Bloomberg Finance L.P., J.P. Morgan calculations. Note: Data starts from when listing on the TWSE.
Figure 15: Weekly net buy/sell vs. share price o Syntec -YTD2026
Source: TEJ, J.P. Morgan calculations.
Table 13: Valuation summary or automation peers
| Company | 10/22/2026 - Ticker | Price - (LCY) | Mkt Cap - (US$mn) | P/E (x) - 26E | P/E (x) - 27E | P/B (x) - 26E | P/B (x) - 27E | ROE - 26E | ROE - 27E | EPS growth - 26E | EPS growth - 27E |
|---|---|---|---|---|---|---|---|---|---|---|---|
| Domestic peers | |||||||||||
| AIRTAC INTERNATI | 1590 TT | 1,100.0 | 6,759 | 18.5 | 15.9 | 3.8 | 3.4 | 21.5% | 22.6% | 41.8% | 16.0% |
| HIWIN TECH | 2049 TT | 299.0 | 3,250 | 32.2 | 25.2 | 2.7 | 2.5 | 8.8% | 10.4% | 115.2% | 27.9% |
| SYNTEC TECHNOLOG | 7750 TT | 1,810.0 | 3,995 | 21.2 | 15.7 | 7.6 | 5.7 | 44.3% | 47.5% | 143.5% | 34.7% |
| Average | 24.0 | 18.9 | 4.7 | 3.9 | 24.8% | 26.8% | 100.2% | 26.2% | |||
| Median | 21.2 | 15.9 | 3.8 | 3.4 | 21.5% | 22.6% | 115.2% | 27.9% | |||
| Japan peers | |||||||||||
| SMC CORP | 6273 JP | 63,570.0 | 25,871 | 18.4 | 17.2 | 1.8 | 1.7 | 10.2% | 10.2% | 30.9% | 6.7% |
| THK CO LTD | 6481 JP | 5,676.0 | 4,307 | 13.1 | 14.3 | 2.2 | 2.1 | 15.8% | 15.6% | 170.1% | -8.4% |
| NSK LTD | 6471 JP | 995.0 | 3,170 | 14.8 | 11.6 | 0.7 | 0.7 | 4.9% | 6.0% | 43.6% | 27.5% |
| FANUC CORP | 6954 JP | 5,624.0 | 35,200 | 25.5 | 23.8 | 2.7 | 2.6 | 10.8% | 11.4% | 23.8% | 7.2% |
| MITSUB ELEC CORP | 6503 JP | 4,881.0 | 65,723 | 18.7 | 16.7 | 2.1 | 1.9 | 11.5% | 12.0% | 31.5% | 11.9% |
| HARMONIC DRIVE | 6324 JP | 4,875.0 | 2,992 | 70.7 | 48.8 | 5.5 | 5.1 | 7.9% | 10.5% | 306.1% | 44.9% |
| YASKAWA ELECTRIC | 6506 JP | 4,033.0 | 6,853 | 23.1 | 18.1 | 2.1 | 1.9 | 9.1% | 10.9% | 28.3% | 27.6% |
| Average | 26.3 | 21.5 | 2.4 | 2.3 | 10.0% | 10.9% | 90.6% | 16.8% | |||
| Median | 18.7 | 17.2 | 2.1 | 1.9 | 10.2% | 10.9% | 31.5% | 11.9% | |||
| China/HK peers | |||||||||||
| SHENZHEN INOVA-A | 300124 CH | 49.9 | 20,266 | 23.0 | 18.6 | 3.4 | 2.9 | 15.1% | 16.4% | 16.2% | 23.6% |
| DONGGUAN YIHED-A | 301029 CH | 24.0 | 2,288 | 24.1 | 19.6 | 3.2 | 2.9 | 13.7% | 15.2% | 22.8% | 22.8% |
| Average | 23.5 | 19.1 | 3.3 | 2.9 | 14.4% | 15.8% | 19.5% | 23.2% | |||
| Median | 23.5 | 19.1 | 3.3 | 2.9 | 14.4% | 15.8% | 19.5% | 23.2% |
Source: Bloomberg Finance L.P. estimates, J.P. Morgan.
In ustry Analysis
I. Industrial automation cycle continues to show strength
JMTBA machine tools orders point to a sustained upcycle
JMTBA orders have historically served as a leading indicator for the factory automation (FA) cycle typically leading downstream automation demand by c.2-3 quarters. Following an inflection in May 2024 total orders returned to positive growth and have continued to strengthen with the latest reading up 2% MoM and 65% YoY in August 2026. Meanwhile orders from China have sustained well at 62% YoY driven by rising investment in high-end manufacturing and cross-border capital expenditure. Overall we believe the continued improvement in both total and China orders points to an ongoing factory automation upcycle.
Figure 16: Japan machine tools orders monthly YoY growth across past cycles
Source: JMTBA, J.P. Morgan.
Figure 17: JMTBA machine tools orders YoY - Domestic vs Foreign
Source: JMTBA, J.P. Morgan.
Figure 18: JMTBA machine tools orders - China
Source: JMTBA, J.P. Morgan.
Robust China automation demand on policy support and end-market recovery
China's factory automation outlook remains constructive supported by policy tailwinds and improving demand. The 15 th Five-Year Plan 2026 NPC work report and the Politburo meeting continue to emphasize advanced manufacturing robotics and highend equipment development reinforcing long-term support for automation investment. Meanwhile the FA upcycle remains intact with improving order momentum across key end markets such as machinery electronics and semiconductor-related supply chains while AI infrastructure buildout is driving incremental demand for related equipment. The recovery is also extending to the machine-tools market with metal-cutting machine revenues up 19% YoY in 8M26 which is particularly relevant to Syntec given its exposure to CNC controllers and machine-tools applications. Beyond traditional automation humanoid robotics presents another longer-term opportunity with its early adoption also creating additional demand for select precision components.
Table 14: Summary o key China policies a ecting manu acturing capex
| Introduced Time | Policy / Event | Key Highlights |
|---|---|---|
| 2015 | Made in China 2025 | • Identified high-end manufacturing, industrial robotics and CNC machine tools as national priorities • Local governments introduced subsidies and investment incentives to accelerate factor automation |
| 2016 | Suppl -Side Structural Reform | • Eliminated excess capacit in traditional industries • Improved profitabilit and cash flow of industrial enterprises • Supported equipment replacement and manufacturing capex |
| 2017 | Financial Deleveraging | • Tightened credit conditions and shadow banking regulation • Reduced financing availabilit for private manufacturers • Slowed fixed asset investment and dela ed equipment purchases |
| 2021 | 14th Five-Year Plan | • Prioritized smart manufacturing, industrial robotics and high-end equipment • Promoted technolog self-sufficienc and localization of ke automation components • Provided long-term polic support, with limited near-term demand stimulus |
| 2021 | Propert Deleveraging | • Propert downturn weakened business confidence and industrial investment • Falling land sales reduced local government fiscal capacit • Became a ke drag on manufacturing capex despite supportive industrial policies |
| 2023 | New Qualit Productive Forces | • Prioritized AI, semiconductors, advanced manufacturing and new materials • Reinforced long-term industrial upgrading |
| 2024 | Large-scale Equipment Renewal Program | • Subsidized replacement of obsolete industrial equipment • Encouraged energ -efficient and intelligent manufacturing upgrades |
| 2026 | 15th Five-Year Plan | • Prioritized AI, advanced manufacturing and industrial software • Continued to support robotics, high-end equipment and intelligent manufacturing • Reinforced manufacturing upgrading, technolog self-sufficienc and industrial competitiveness |
Source: J.P. Morgan.
Figure 19: China manu acturing PMI reached 50.1 in Sep 2026
Figure 20: China industrial production growth was 5.5% YoY in Sep 2026
Source: TEJ.
Figure 21: China IA market - market size
Figure 22: China IA market - quarterly growth YoY
China IA market Factory Automation (i.e. OEM market) Process Automation (i.e. Project-based market)
Source: MIR databank, J.P. Morgan.
Figure 23: Cumulative revenue growth - Syntec vs. China machine tools
Source: CMTBA, compan report.
Source: MIR databank, J.P. Morgan.
Figure 24: Cumulative revenue growth - Syntec vs. China metal-cutting machine tools
Source: CMTBA, compan report.
Taiwan machinery exports and linear motion components remain resilient
Taiwan's machinery export orders grew 23% YoY in 9M26 driven mainly by China & HK/ASEAN where orders increased 39%/61% YoY respectively reflecting the recovery in manufacturing investment in China and ongoing supply chain diversification into ASEAN. Meanwhile Taiwan's machinery equipment exports increased 20% YoY in 9M26 with September marking the 20 th consecutive month of positive YoY export growth supported by robust electronic equipment exports amid continued AI/ semiconductor investment.
At the individual product level the recovery was uneven across machinery categories. Taiwan's machine tool exports declined 2% YoY in 9M26 impacted mainly by lower export competitiveness amid weaker JPY and KRW against TWD. In contrast key motion control components remained resilient with linear guideway exports increasing 13% YoY in 9M26 and ball screw exports growing 10% YoY. This divergence suggests that Hiwin's core linear motion business is benefiting from the automation demand such as in semiconductor equipment and AI infrastructure partially offsetting the slower growth in traditional machine tools.
Figure 25: Taiwan machinery export orders and YoY growth - Total
Source: MOEA, J.P. Morgan.
Figure 27: Taiwan machinery equipment exports vs. AirTAC average daily sales - YoY growth
Source: TAMI, Compan data, J.P. Morgan.
Figure 29: Taiwan linear guide export value
Source: Taiwan Customs, Ministr of Finance, J.P. Morgan.
Figure 26: Taiwan machinery export orders and YoY growth - China & HK
Source: MOEA, J.P. Morgan.
Figure 28: Taiwan machinery equipment exports vs. Hiwin average daily sales - YoY growth
Source: TAMI, Compan data, J.P. Morgan.
Figure 30: Taiwan ball screw export value
Source: Taiwan Customs, Ministr of Finance, J.P. Morgan.
II. CAPEX outlook by industry
End-market exposure of the companies
AirTAC Hiwin and Syntec's operating performance is influenced by the industrial automation cycle and downstream capex though each company has distinct end-market exposure and demand drivers. AirTAC has broad exposure across electronic equipment (27% of 1H26 direct sales) battery (19%) automotive (9%) and traditional machinery (e.g. textiles packaging machine tools etc.) Hiwin is more leveraged to precision motion applications such as machine tools traditional machinery and semiconductor/ electronics etc. Meanwhile Syntec is mainly exposed to general components (26% of 1H26 sales) machinery manufacturing/equipment (24%) automotive (22%) 3C/ electronics (9%) etc. Given these differences we use the capex outlook of key end markets as a directional indicator of automation demand and analyze the trends by aggregating capex forecasts for selected companies across semiconductor electronics China battery and China auto in the following sections.
Table 15: End-market correlation and demand indicators o the companies
| End market correlation/demand indicators | AirTAC | Hiwin | Syntec |
|---|---|---|---|
| Semiconductor | Mid-to-high | High | Mid |
| Electronics | High | High | High |
| Batter | Mid-to-high | Mid-to-low | Low |
| Auto | Mid-to-high | Mid-to-high | High |
| Machine tools | Mid-to-high | High | High |
| Robotics | Mid-to-low | Mid-to-high | Mid-to-high |
Source: J.P. Morgan.
Table 16: Sample companies or industry capex analysis
| Industry | Major sample companies |
|---|---|
| Semiconductor | Intel, Texas Instruments, TSMC, Samsung Logic, Globalfoundries, UMC, SMIC, Hua Hong, Samsung, SK H nix, Micron Technolog , Kioxia/ Sandisk, YMTC |
| EMS&ODM | Quanta, Wistron, Compal, Pegatron, Inventec, Hon Hai |
| Apple suppl chain (Camera + Acoustics + Casing) | Largan, Genius, Merr , AAC Tech, Catcher, Lens Tech, Jabil |
| China batter | CATL, BYD, Gotion, Eve Energ , CALB, Sunwoda, REPT BATTERO |
| China auto | Geel , Dongfeng, GAC, GWM, SAIC, BYD, Changan Auto |
Source: J.P. Morgan.
(1) Semiconductor capex growth remains solid
Semiconductor capex has been in a solid upcycle with our semiconductor team forecasting 58%/29% YoY growth in 2026/27E before moderating to 9% in 2028E (link). The current expansion is becoming more broad-based with growth extending beyond leading-edge logic into advanced packaging and memory supported by sustained AI infrastructure investment and strong HBM demand. While capex growth is likely to slow in 2028E spending should remain on a solid growth trajectory in 2026/27E providing a favorable backdrop for the companies.
(2) Electronics capex sees normalization in EMS/ODM but recovering smartphone investment
We believe EMS/ODM capex is normalizing after the AI server-driven capacity buildout in 2025-26E as Bloomberg consensus indicates the capex of major EMS/ODM players may rise 15% YoY in 2026E but moderate to 1% YoY in 2027E. In contrast smartphone-related investment appears to be bottoming with Bloomberg consensus suggesting capex among Apple suppliers (including cameras acoustics and casings) to decline 11% YoY in 2026 before recovering to 12%/6% YoY in 2027/28E. For AirTAC smartphone-related applications represent c.25-30% of electronics revenue and management is seeing improving demand from international customers with regular product specifications launched in 1H27 expected to support growth from 2H26.
(3) China battery capex moderates from FY25 peak but overseas expansion and technology upgrades provide support
China battery capex rebounded 46% YoY in 2025 after a 17% contraction in 2024. Looking ahead Bloomberg consensus forecasts capex to decline 14%/6%/5% YoY in 2026-28E with the pace of contraction gradually easing. For AirTAC its battery-related automation demand should remain relatively resilient in the near-term supported by overseas capacity expansion investment in next-generation battery technologies such as solid-state batteries and stronger energy storage demand; however the capex moderation through 2028E may imply a more limited incremental growth contribution from the battery segment.
(4) China auto capex set to decline in FY26-28E
Bloomberg consensus indicates that China auto capex rose 28% YoY in 2025 but may decline 18%/3%/7% in 2026/27/28E respectively. This reflects a shift from capacity build-out toward more selective investment as many Chinese OEMs have already invested heavily in domestic production capacity in recent years while incremental spending increasingly targets selected overseas plants and autonomous driving technology. As a result the peak in capacity-related capex may be behind us for now limiting the contribution from new capacity additions to AirTAC's China auto business. However we believe AirTAC's market share gains in China's auto sector could help partially mitigate the impact of a slower capex cycle and support its continued growth in the segment.
Figure 31: Semiconductor capex vs. AirTAC sales - YoY growth
Source: Compan data, J.P. Morgan estimates.
Figure 32: Semiconductor capex vs. Hiwin sales - YoY growth
Source: Compan data, J.P. Morgan estimates.
Figure 33: Electronics capex vs. AirTAC and Hiwin sales - YoY growth
Source: Compan data, J.P. Morgan, Bloomberg Finance L.P. estimates.
Figure 35: China battery capex vs. AirTAC sales - YoY growth
Source: Compan data, J.P. Morgan, Bloomberg Finance L.P. estimates.
Figure 37: China auto capex vs. AirTAC sales - YoY growth
Source: Compan data, J.P. Morgan, Bloomberg Finance L.P. estimates.
Figure 34: Electronics capex vs. Syntec sales - YoY growth
Source: Compan data, J.P. Morgan, Bloomberg Finance L.P. estimates.
Figure 36: China battery capex vs. Hiwin sales - YoY growth
Source: Compan data, J.P. Morgan, Bloomberg Finance L.P. estimates.
Figure 38: China auto capex vs. Hiwin sales - YoY growth
Source: Compan data, J.P. Morgan, Bloomberg Finance L.P. estimates.
III. Robotics as the long-term growth driver
Global robotics enters a new growth cycle amid humanoid commercialization and industrial automation
The global robotics industry is entering a new growth cycle driven by continued commercialization of humanoid robots and sustained demand for industrial robots. According to our industrial team (link) JPM forecasts global humanoid robot shipments to reach c.1.75mn units by 2030E (c.150% CAGR over 2025-30E) with broader global adoption expected to accelerate from 2027 onwards as supply chains mature and physical AI technology improves. Meanwhile industrial robot demand continues to broaden beyond traditional manufacturing into AI server assembly semiconductor equipment PCB production and other high-value automation applications supporting ongoing investment across robotics and factory automation.
Table 17: Humanoid robot shipment orecast
| Thousand units | 2025E | 2026E | 2027E | 2028E | 2029E | 2030E |
|---|---|---|---|---|---|---|
| China | 15 | 50 | 120 | 280 | 550 | 900 |
| ex-China | 3 | 10 | 100 | 250 | 500 | 850 |
| Global total humanoid robot shipment unit | 18 | 60 | 220 | 530 | 1,050 | 1,750 |
| Y/Y Chg | 233% | 267% | 141% | 98% | 67% |
Source: J.P. Morgan estimates.
China robotics growth driven by accelerating deployment and policy support
China is solidifying its robotics leadership with rapid deployment and continued policy support. Our industrial team estimates (link) that China accounted for over 80% of global humanoid robot shipments in 2025 and will represent c.50% of global shipments by 2030E while industrial robot shipments are to grow 20%/15%/12% YoY over 202628E supported by both traditional manufacturing and AI-related applications. The favorable industry outlook is further reinforced by policy support including the MIIT and SASAC's real-world program targeting routine adoption across 100+ high-value scenarios and 10k cumulative deployments by 2026E (link) while the government also plans to invest Rmb2tn in AI and emerging technologies over the next five years to further support the robotics ecosystem development.
Table 18: China industrial robot shipment orecast
| 2017 | 2018 | 2019 | 2020 | 2021 | 2022 | 2023 | 2024 | 2025 | 2026E | 2027E | 2028E | |
|---|---|---|---|---|---|---|---|---|---|---|---|---|
| Unit sales | 145,850 | 154,336 | 149,400 | 171,490 | 256,360 | 282,076 | 283,154 | 294,178 | 334,062 | 400,874 | 461,006 | 516,326 |
| Y/Y Chg | 6% | -3% | 15% | 49% | 10% | 0% | 4% | 14% | 20% | 15% | 12% |
Source: MIR databank, J.P. Morgan estimates.
Figure 39: China industrial robot, monthly production (Units) Y/Y trend
Source: WIND, J.P. Morgan.
Figure 40: China industrial robot, cumulative production (units) Y/Y trend
Source: WIND, J.P. Morgan.
Taiwan supply chain to benefit from the growing robotics demand
Taiwan's industrial robot exports rose 31% YoY in 9M26 to US$116mn supported by AI-related manufacturing capex semiconductor capacity expansion and automotive automation demand. China remained the largest end market accounting for 22% of total exports while shipments to the U.S. grew 54% YoY driven mainly by solid deliveries of wafer-handling and logistics robots as well as related key components. Given Taiwan's strengths in critical components and customized module solutions we believe the local robotics supply chain is a key beneficiary of this growing trend. Over the medium term broader global adoption of robotics should further support structural demand growth for these high-value components.
Within Taiwan's robotics supply chain Hiwin is a leading supplier of precision motion components and is expanding its product portfolio for robotic applications including harmonic drives planetary roller screws and actuator modules etc. Together with its affiliate Hiwin Mikrosystem (4576 TT Not Covered [NC]) which focuses on motors and drives the group provides integrated solutions that support higher torque density and improved motion control performance. For Syntec it has growing exposure to robotics via its subsidiary Leantec which leverages the group's controller and software capabilities and provides solutions across industrial and collaborative robots. Beyond the two companies other Taiwanese suppliers are also participating across key robotics subsystems such as Sinbon (3023 TT covered by Gokul Hariharan) in robot cables Solomon (2359 TT NC) in AI vision systems Mirle (2464 TT NC) in joint drive modules and Apex Dynamics (4583 TT NC) in planetary gearboxes further strengthening Taiwan's position in the robotics value chain.
Figure 41: Taiwan industrial robot exports and YoY growth
Source: Taiwan Customs, J.P. Morgan.
Figure 43: Taiwan industrial robot exports and YoY growth - China
Source: Taiwan Customs, J.P. Morgan.
Table 19: Summary o key Taiwan robotics suppliers
| Name | Ticker | Market Cap (US$Mn) | ADV (US$mn) | Type of Involvement/ Component | Comment |
|---|---|---|---|---|---|
| Syntec | 7750 TT | 3,995 | 19 | Controllers/robot arms | Partners with Huayan Robotics to integrate robot controllers into cobot solutions for CNC applications |
| Hiwin | 2049 TT | 3,250 | 45 | Harmonic gear drive, robot joints, planetary roller screw | Supplies wafer robots/transfer system for semi applications; logistics robots with Dexterity |
| Sinbon | 3023 TT | 2,198 | 10 | Cables | Cooperates with/supplies to leading humanoid robotics companies (e.g. Figure, Agility Robots, etc). |
| Mirle | 2464 TT | 1,125 | 74 | Harmonic gear drive, robot joint modules | Provides AMR, AI robot solutions, and semiconductor AMHS system; formed a JV (i.e. Main Drive Corp) with Hota; Supplies key harmonic reducers and joint modules for Optimus V3 |
| Apex Dynamics | 4583 TT | 951 | 2 | Precision gearbox, reducers | Supplies to Amazon's warehouse robot and 7-axis robot |
| Techman Robot | 4585 TT | 868 | 2 | Cobots | Supplies robotic arms and wheeled humanoid robots; subsidiary of the Quanta group |
| Hiwin Mikrosystem | 4576 TT | 749 | 16 | Servo motor | Supplies wafer robots/transfer system for semi applications; partners with Hiwin for Boston Dynamics' humanoid and quadruped robots |
| Solomon Tech | 2359 TT | 606 | 27 | AI vision software | Distributes Universal Robots (UR); partners with Unitree on AI vision system; integrates NVIDIA NemoClaw to enable multi-agent AI coordination for humanoid robots |
| Kenmec | 6125 TT | 374 | 1 | AMR, warehouse automation | Partners with Germany's NEURA Robotics to develop humanoid robot solutions |
| CPC | 1597 TT | 370 | 10 | Linear guideways, control/joint modules | Developing humanoid and quadruped robot joint modules |
| TBI Motion | 4540 TT | 203 | 5 | Ball screws, linear guideways | Supplies miniature ball screws for Chinese dexterous-hand manufacturers; developing lower- limb modules and miniature linear actuators for humanoid robots |
| Nextron | 8147 TT | 161 | 1 | Connectors | Provides interconnect solutions for industrial robots targeting automotive OEM production lines (e.g. BMW/Mercedes-Benz), with customer pilot production underway |
Source: Bloomberg Finance L.P., J.P. Morgan. Note: data as of Oct 22, 2026.
Figure 42: Taiwan industrial robot exports breakdown by countries - 9M26
4%
Source: Taiwan Customs, J.P. Morgan.
Figure 44: Taiwan industrial robot exports and YoY growth - U.S.
Source: Taiwan Customs, J.P. Morgan.
IV. Competitive landscape
Competitive landscape - pneumatic component
China's pneumatic components market is highly consolidated with SMC (33%) AirTAC (30%) and Festo (13%) collectively accounting for 76% of the market in 1H26 up from 54% in 2013. AirTAC has gained market share by offering a strong price-toperformance proposition targeting the mid-range segment rather than directly competing with SMC and Festo in premium applications. Its competitive advantage is supported by a highly vertically integrated manufacturing model and an extensive direct sales network with over 80% of key components produced in-house enabling cost efficiency tight quality control and short lead times. We believe the company could further gain share to 35% in China by 2030E with potential upside depending on sales mix optimization and market conditions.
- SMC (6273 JP, NC): SMC is the global leader in pneumatic automation components with c.30-40% market share and a strong presence across Japan Europe and Asia. Its extensive product portfolio includes 12k standard models and over 880k product variations supporting a broad range of industrial automation applications. In China SMC maintained a stable market share of 33% in 2025 vs. 2016 while AirTAC expanded its share from 17% to 30% reflecting increasing competition and pricing pressure. However SMC's differentiated position lies in its premium products and integrated automation solutions.
- Festo (Not listed): Festo is a German automation company specializing in pneumatic and electric automation solutions. Compared with AirTAC Festo focuses on high-end industrial applications and multinational customers with higher exposure to the auto industry. Its market share in China increased modestly from 10% in 2016 to 13% in 2025 reflecting limited share gains with a relatively stable presence in the market.
Figure 45: Pneumatic component market share in China
Source: Compan data.
Figure 46: Revenue by region - SMC
Source: Compan data, Bloomberg Finance L.P. Note: 2026 refers to the fiscal ear ending in March 2026.
Competitive landscape - Linear guides & Ball screws
The linear motion and ball screw markets are led by THK followed by Hiwin and NSK. While Japanese players benefit from accumulated engineering expertise strong brand recognition and deep client relationships Hiwin targets mid-range-to-high-end customers and differentiates through greater customization flexibility and a shift toward system-level solutions which helps strengthen customer stickiness and reduce price competition.
Figure 47: Revenue by region - THK
Source: Compan report.
- T K (6481 JP, NC): THK is the global leader and a pioneer in linear motion guide products. Its competitive positioning is underpinned by technology leadership and long-standing customer relationships. Relative to Hiwin THK has deeper penetration in Japan and has been expanding in Southeast Asia. China is THK's largest overseas market accounting for 30% of sales in 2025 where it retains its leading position despite intensifying competition from Hiwin and domestic suppliers.
- NSK (6471 JP, NC): NSK is a leading supplier of linear motion products and ball screws and is also the world's third largest bearings manufacturer. The company's margins are the lowest among the peer group reflecting its higher mix towards bearings and automotive end markets. That said NSK is increasingly shifting its portfolio toward higher value-added products while expanding its non-Japanese customer base. In May 2026 NSK and NTN (6472 JP NC) announced plans to merge by October 2027 (link) which will create the world's largest bearings supplier upon completion.
Figure 48: Revenue by region - NSK
Source: Compan report. Note: 2025 refers to the fiscal ear ending in March 2025.
Competitive landscape - CNC controllers
China's CNC controller market is led by FANUC and Syntec (c.20-25% market share each) followed by Siemens and Mitsubishi Electric (c.10-15% each) if using unit-based share estimates. The remainder is fragmented among various players such as GSK and HCNC. Compared to global leaders Syntec differentiates itself through competitive price-performance an open platform that enables flexible customization and an extensive direct-sales channel (c.85-90% of revenues) to provide responsive customer service. Compared to local peers GSK focuses more on the lower-end market while HCNC has weaker service capabilities given its focus on state-prioritized initiatives. While recent order transfers amid memory supply disruptions have supported Syntec's growth we believe these competitive advantages should help retain customers with continued share gains.
- FANUC (6954 JP, NC): FANUC is a global leader in CNC controllers supported by strong brand recognition product reliability and broad application coverage. Its vertical integration across CNC systems industrial robots and Robomachines enables a highly integrated product offering with strong engineering capabilities. Syntec competes on c.20% lower pricing greater customization a more compatible platform and faster customer responsiveness. Unlike FANUC Syntec also does not manufacture complete machine tools avoiding direct competition with its customers.
Figure 49: Revenue by division - FANUC
Source: Compan data.
Table 20: Peer comparison summary
| Company (FY25; US$m, %) | AirTAC | SMC | Hiwin | THK | NSK | Syntec | FANUC | Siemens |
|---|---|---|---|---|---|---|---|---|
| Ticker | 1590 TT | 6273 JP | 2049 TT | 6481 JP | 6471 JP | 7750 TT | 6954 JP | SIE GR |
| Market cap | 6,759 | 25,863 | 3,250 | 4,306 | 3,169 | 3,995 | 35,189 | 228,227 |
| Revenues | 1,105 | 5,200 | 781 | 1,608 | 5,230 | 449 | 5,233 | 87,258 |
| Gross margin | 46% | 46% | 29% | 29% | 22% | 46% | 37% | 39% |
| Net margin | 25% | 20% | 6% | 4% | 1% | 16% | 19% | 10% |
| ROE | 17% | 8% | 4% | 3% | 2% | 28% | 9% | 14% |
| Revenue mix | Pneumatic actuator (47%); Pneumatic control component (21%); Air preparation unit (6%); Others (26%) | Automatic Control Equipment (100%) | Linear guidewa s (62%); Ball screw (20%); Robots (9%); Others (9%) | Industrial Equipment (100%) | Automotive (44%); Industrial machiner (41%); Steering (11%); Others (3%) | Controller products (48%); Servo products (47%); Smart manufacturing (3%); Others (2%) | Robot (44%); FA (24%); Service (17%); Robomachine (15%) | Industrial Business (97%); Others (2%); Financials Services (1%) |
Source: Bloomberg Finance L.P., Compan data, TEJ, J.P. Morgan. Note: SMC/NSK/FANUC are fiscal ear ending March, while Siemens is ending September. Data as of Oct 22, 2026.
- Siemens (SIE GR, covered by Phil Buller): Siemens' Sinumerik CNC platform is positioned at the premium end with strengths in high-precision and large-scale machining and is favored by top-tier Chinese machine tools builders serving export markets. However this is evolving of late with the launch of e.g. the Sinumerik 828D Smart which is part of the strategy that Siemens is deploying in China to address what it describes as the 'value for money' segment a key focus over the past c.18 months. For now however Siemens' China market share remains below Syntec on a unit-basis reflecting the weaker localization and/or higher pricing and a more closed architecture with less flexibility for customization.
Figure 50: Siemens revenue YoY growth - Digital Industries and Smart In rastructure
Source: Compan data, J.P. Morgan estimates.
Overweight
1590.TW, 1590 TT
Price (22 Oct 26):NT$1,100.00
▲Price Target (Dec-27):NT$1,600.00 Prior (Dec-26):NT$1,350.00
Taiwan Industrial
Amanda Chang AC
(886-2) 2725-9861 aman a.chang@jpmorgan.com J.P. Morgan Securities (Taiwan) Limite
ey Changes (FYE Dec)
| Prev | Cur Δ | |
|---|---|---|
| Adj. EPS - 26E (NT$) | 49.21 | 60.1922.3% |
| Adj. EPS - 27E (NT$) | 53.98 | 67.0524.2% |
Style Exposure
| Quant - Factors | Current - %Rank | Hist %Rank (1=Top) - 6M | Hist %Rank (1=Top) - 1Y | Hist %Rank (1=Top) - 3Y | Hist %Rank (1=Top) - 5Y |
|---|---|---|---|---|---|
| Value | 27 | 36 | 34 | 41 | 58 |
| Growth | 61 | 27 | 39 | 17 | 26 |
| Momentum | 59 | 45 | 53 | 56 | 69 |
| Quality | 38 | 9 | 17 | 19 | 22 |
| Low Vol | 36 | 41 | 53 | 64 | 80 |
| ESGQ | 94 | 97 | 92 |
AirTAC
Quality Growth in China's Automation Upcycle
We assume coverage of AirTAC with an OW rating and a Dec-27 PT of NT$1 600. AirTAC is a key beneficiary of China's automation upcycle driven by policy-led manufacturing upgrades and a recovery in end-market demand. Beyond cyclical tailwinds AirTAC continues to gain market share in China maintain resilient margins via improving efficiency and is broadening beyond core pneumatics into new businesses. While the shares have underperformed the TAIEX by 32% since the August peak we view the pullback as largely seasonal with current valuation undemanding at 16x FY27E P/E and expect momentum to recover into the traditional peak season in 2Q27.
- Sustained share gains with resilient margins. AirTAC is the second-largest pneumatic supplier in China with 30% market share in 1H26 (vs. 33%/13% for SMC/Festo respectively). We believe AirTAC could continue to gain share as its brand image improves and greater internal efficiency helps sustain its price-performance advantage with China market share reaching 35%+ by 2030E. This efficiency has also kept margins resilient with GM holding at 46-47% in FY22-25 before expanding to 48%/49.7% in 1Q26/2Q26. We forecast GM to remain c.49% in FY26-28E with higher utilization driving improvement in linear guideway margins to c.30% in FY26E.
- Solid pneumatic demand amid end-market tailwinds. Pneumatic demand remains healthy across major end markets. We believe the overall pneumatic market could grow mid-single digits YoY in FY26E with AirTAC growing c.10ppt above the market implying at least mid-teens YoY growth. We see the growth coming from AI-driven electronics orders a recovery in machinery and robust battery-related demand while the company's continued share gains should also help partially offset a weaker automotive market.
- Broadening product portfolio adds new growth drivers. Beyond core pneumatics AirTAC is growing its linear guideways electrical controllers and semiconductor applications. Linear guideways grew 26% YoY in 2Q26 with mgmt. targeting annual revenue of RMB3bn in the next decade. For electrical controllers three new product launches this year should support further revenue growth in FY27E toward the same RMB3bn annual revenue target over the next 10 years. Semiconductors remain a longerterm opportunity with several launches planned from 4Q26 and broader commercialization in FY27; mgmt. targets RMB1bn in annual semiconductor revenue in the next 10 years.
- OW rating with a Dec-27 PT of NT$1,600. Our Dec-27 PT of NT$1 600 is based on a target P/E of 22x and a 12M forward EPS of NT$72.7 implying 45% potential upside. Our target multiple reflects AirTAC's leading position in China's pneumatic components market and 20% FY25-28E EPS CAGR while taking a more conservative stance amid concerns over any potential cyclical downturn. Although the share price momentum has softened since mid-August we view this as a technical pause driven by seasonal weakness and sector rotation rather than a material change in fundamentals and expect the momentum to recover into the 2Q27 peak season. Key downside risks include: 1) faster-than-expected cycle normalization; 2) margin pressure from increased competition and higher raw material costs; 3) execution risk in ramping new growth engines; and 4) higher-than-expected opex.
Company Data
| Shares O/S (mn) | 200 |
|---|---|
| 52-week range (NT$) | 1,615.00-866.00 |
| Market cap ($ mn) | 6,784 |
| Exchange rate | 32.43 |
| Free float (%) | 69.1% |
| 3M ADV (mn) | 0.90 |
| 3M ADV ($ mn) | 36.9 |
| Volatilit (90 Da ) | 43 |
| Index | TAIEX |
| BBG ANR (Bu | Hold | Sell) | 22|0|0 |
ey Metrics (FYE Dec)
| NT$ in millions | FY25A | FY26E | FY27E | FY28E |
|---|---|---|---|---|
| Financial Estimates | ||||
| Revenue | 34,330 | 44,651 | 49,268 | 53,517 |
| Adj. EBITDA | 12,866 | 18,057 | 19,762 | 21,176 |
| Adj. EBIT | 10,288 | 15,204 | 16,872 | 18,276 |
| Adj. net income | 8,400 | 12,039 | 13,413 | 14,549 |
| Adj. EPS | 41.97 | 60.19 | 67.05 | 72.73 |
| BBG EPS | 40.50 | 59.54 | 69.05 | 76.32 |
| Cashflow from operations | 7,667 | 9,614 | 12,937 | 14,080 |
| FCFF | 4,852 | 6,565 | 9,937 | 11,080 |
| Margins and Growth | ||||
| Revenue Growth Y/Y (%) | 12.0% | 30.1% | 10.3% | 8.6% |
| EBITDA margin | 37.5% | 40.4% | 40.1% | 39.6% |
| EBITDA Growth Y/Y (%) | 11.0% | 40.3% | 9.4% | 7.2% |
| EBIT margin | 30.0% | 34.1% | 34.2% | 34.2% |
| Net margin | 24.5% | 27.0% | 27.2% | 27.2% |
| Adj. EPS growth | 10.2% | 43.4% | 11.4% | 8.5% |
| Ratios | ||||
| Adj. tax rate | 21.1% | 21.5% | 21.0% | 21.0% |
| Interest cover | NM | NM | NM | NM |
| Net debt/Equit | NM | NM | NM | NM |
| Net debt/EBITDA | NM | NM | NM | NM |
| ROCE | 15.3% | 22.2% | 23.2% | 22.8% |
| ROE | 16.7% | 22.6% | 23.7% | 23.4% |
| Valuation | ||||
| FCFF ield | 2.2% | 3.0% | 4.5% | 5.0% |
| Dividend ield | 2.7% | 3.6% | 4.0% | 4.3% |
| EV/Revenue | 6.3 | 4.9 | 4.4 | 4.0 |
| EV/EBITDA | 16.8 | 12.0 | 10.9 | 10.0 |
| Adj. P/E | 26.2 | 18.3 | 16.4 | 15.1 |
Summary Investment Thesis and Valuation
Investment Thesis
We rate AirTAC OW as a key beneficiary of China's automation upcycle with further market share gains and improving operating efficiency supporting earnings growth and resilience through downturns. New business lines offer incremental growth opportunities beyond core pneumatics while valuation remains attractive at 1-std below its 10-year average forward P/ E making AirTAC our quality pick in the current cycle.
Valuation
Our Dec-27 PT of NT$1 600 is based on 22x 12M forward EPS. Our target multiple reflects AirTAC's leading position in China's pneumatic components market and 20% FY25-28E EPS CAGR while taking a more conservative stance amid concerns over any potential cyclical downturn.
| Factors | 6M Corr | 1Y Corr |
|---|---|---|
| Market: MSCI Asia Pac ex JP | 0.58 | 0.57 |
| Region: Taiwan | 0.23 | 0.19 |
| Macro: | ||
| JPM Global Equity Sentiment | 0.42 | 0.36 |
| Generic 1st 'CO' Future | -0.31 | -0.24 |
| JPM China A-shares Sentiment | 0.12 | 0.18 |
| Quant Styles: | ||
| Momentum | 0.17 | 0.13 |
| Value | -0.09 | -0.06 |
| Quality | 0.10 | 0.06 |
Figure 52: Gross margins - AirTAC
Source: Compan report, J.P. Morgan estimates.
Investment Thesis
1. Continued market-share gains provide sustained growth
AirTAC is the second-largest pneumatic components supplier in China with 30% market share in 1H26 (vs. 33%/13% for SMC/Festo respectively). We believe AirTAC will continue to gain share as its brand image improves and greater internal efficiency helps sustain its price-performance advantage. Meanwhile its expanding product portfolio which includes linear guideways electrical controllers and semiconductor applications could also broaden its addressable market and drive cross-selling to its customer base. Management targets a 35% China pneumatic market share by 2030E but with potential upside depending on the mix profitability and competitive dynamics.
Figure 51: Pneumatic market share changes in China
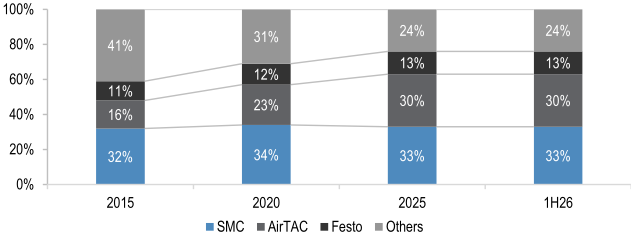
Source: Compan data.
2. igher utilization and efficiency support margin resilience
AirTAC has maintained a high margin profile with GM holding at 46-47% in FY22-25 before expanding to 48%/49.7% in 1Q26/2Q26 respectively. We forecast GM to remain c.49% in FY26-28E supported by continued efficiency improvement and higher utilization. In pneumatics utilization is currently above 100% and should remain full in 3Q26 as inventory stays lean driving better fixed-cost absorption and operating leverage. Moreover we believe linear guideway margins also have room to improve as utilization ramps with GM in the teens at 20% utilization in FY25 and potentially reaching c.30% at 50% utilization in FY26E.
Figure 53: Inventory days and YoY growth - AirTAC
Source: Compan report, J.P. Morgan estimates.
Table 21: Summary o gross margin vs utilization or linear guideways
| Utilization rate | Margin level | Notes |
|---|---|---|
| 20%-30% | Teens % | N/A |
| 50% | ~30% | FY26E target utilization mentioned is 50% |
| 80% | ~40% | N/A |
| 90% | N/A | At ~90% utilization, consider switching from 2 shifts to 3 shifts (capacit step-up; enables renewed pricing competition) |
Source: Compan data, J.P. Morgan.
4. Broadening product portfolio adds new growth drivers
Beyond its core pneumatic business AirTAC is broadening its product portfolio into linear guideways electrical controllers and semiconductor applications creating additional mid- to long-term growth drivers.
3. Solid pneumatic demand amid broad-based end-market tailwinds
Pneumatic demand remains healthy across major end markets. We believe the overall pneumatic market could grow mid-single digits YoY in FY26E with AirTAC growing c.10ppt above the market implying at least mid-teens YoY growth. Key tailwinds include AI-driven electronics demand and policy-supported battery capacity expansion along with AirTAC's share gains in automotive and subsidy-backed replacement demand in traditional industries. Solar and LED lighting remain a near-term headwind due to overcapacity issues but the conditions are showing signs of stabilization.
Table 22: Revenue breakdown and YoY growth by segment - 1H25 vs. 1H26
| 1H25 - Revenue % | 1H25 - YOY | 1H26 - Revenue % | 1H26 - YOY | |
|---|---|---|---|---|
| Electronic equipment | 28% | 7% | 27% | 20% |
| Batter | 14% | 91% | 19% | 69% |
| Automotive | 9% | 40% | 9% | 16% |
| Packaging | 8% | 5% | 7% | 13% |
| Machine tool | 7% | 8% | 7% | 28% |
| General machiner | 5% | 10% | 4% | 26% |
| Textile & Dresses machiner | 4% | -10% | 4% | 30% |
| Energ and Lighting | 4% | -46% | 3% | -5% |
| Other | 21% | 20% |
Source: Compan data.
Table 23: Summary o end-market guidance rom AirTac's 2Q26 earnings call
| End-market | Comments | FY26E growth outlook |
|---|---|---|
| Electronics | AI-related demand increasing pneumatic usage | Double-digit YoY |
| Batter | Supported b government polic , domestic capex, and incremental SSE demand, while easing restrictions on Chinese pla ers also enables overseas expansion | Double-digit YoY |
| Auto | AirTAC sees market share gains and brand/image improvement despite remaining weak auto market | Double-digit YoY |
| Traditional (e.g. machiner , textile) | 'Replace old with new' subsid supports replacement demand | Double-digit YoY |
| Solar / LED lighting | Demand remains sluggish but government is addressing the overcapacit issues | Narrowing decline YoY |
Source: Compan data, J.P. Morgan.
- Linear guideways' shipment volume grew >20% YoY in FY25 despite weak industry demand and aggressive pricing from peers followed by 26% YoY revenue growth in 2Q26. Management targets the annual revenue to reach RMB3bn over the next 10 years while cross-selling through its existing customer base should limit incremental opex and allow the business to scale without becoming a drag on group profitability.
- Electrical controllers were introduced 3-4 years ago with AirTAC's revenues reaching c.RMB400mn in FY25 (c.5% of revenues) alongside an attractive gross margin of c.60%. Looking ahead we expect the three new product launches this year to further support revenue growth from FY27E while AirTAC's focus on higher-yield categories should also help it reach management's annual revenue target of RMB3bn over the next decade.
- The semiconductor business provides a longer-term growth opportunity driven by China's ongoing localization push and attractive margins of up to c.70%. AirTAC plans to launch several products from 4Q26 with broader commercialization in FY27E. We see meaningful long-term upside as AirTAC expands its semiconductor products and customer base towards its RMB1bn annual revenue target over the next 10 years.
Table 24: Comparison between main power transmission sources
| Pneumatic | Hydraulics | Electric | |
|---|---|---|---|
| Power source | Compressed air | H draulic fluid | Electrical power |
| Relative cost | Low | Medium | High |
| Precision | Low-to-Mid | Low-to-Mid | High |
| Force | Low | High | Flexible |
| Operating speed | Fast | Slow | Fast |
| Main applications | Electronics and general machiner /automation | Construction, heav equipment and other high- load applications | Machine tools, electronics and precision automation |
| Ke components | C linder, valves and FRLs | Pumps, c linders and pistons | Linear guidewa s, ball screws and servo motors/drives |
Source: J.P. Morgan.
Investment Risks
1. Faster-than-expected cycle normalization
While the current pneumatic cycle remains solid supported by policy-driven industrial upgrade and a broad-based recovery across downstream markets pneumatic components usually have short lead times which limits order visibility and leaves room for demand uncertainty. In addition any shift in the policy stance (e.g. support intensity easing or priorities changing) may cause the cycle to slow and normalize faster-thanexpected. However AirTAC's continued share gains in China's pneumatic market provide organic growth beyond industry demand with shares rising from 30% in FY25 to 35%+ by 2030E implying at least c.RMB2bn in incremental revenue and a 4-6% five-year CAGR. Its ability to adjust production capacity quickly and diversified endmarket exposure also provides downside buffers as demonstrated by AirTAC's outperformance during the 2022-24 downturn. While pneumatic cycles typically normalize over c.2-3 years we believe the current upcycle could last longer with a more moderate recovery than prior V-shaped cycles. We would reassess this view if China's machine-tool indicators weaken further capex growth slows or AirTAC's monthly revenue growth decelerates meaningfully.
2. Margin pressure from increased competition and higher raw material costs
Pricing competition remains rational in the pneumatic market but AirTAC may face margin pressure if competition intensifies and leads to greater pricing concessions or if raw material costs rise further given that raw materials account for c.50% of COGS. Nevertheless we believe the risks could be mitigated by AirTAC's structural cost advantage from internal efficiency improvement and its demonstrated ability to raise prices such as in overseas markets.
3. Execution risk in ramping new growth engines
While AirTAC is growing its linear guideway electrical controller and semiconductor businesses potential execution risks include: 1) slower-than-expected progress in rebuilding client satisfaction and brand perception for linear guideways; 2) margin downside if utilization falls short of expectations; and 3) a slower revenue contribution from semiconductor applications if customer adoption takes longer-than-expected. That said we believe AirTAC's linear guideways offer solid quality at competitive pricing (c.20% lower for major customers vs. peers) while the ongoing recovery in the linear guideway cycle should support utilization and momentum into FY26/27E. For semiconductors AirTAC can leverage its existing product platforms limiting incremental opex and capex while accelerating execution.
4. igher-than-expected opex
AirTAC could face OPM pressure if opex increases more than expected driven by factors such as higher bonus payouts and incremental social security accrual requirements. Nevertheless we believe the risks should be manageable supported by management's ongoing internal efficiency initiatives which should reduce the relative impact of the social security program to c.1% OPM from c.1.8% in 2Q26. In addition improving operating leverage as revenue scales could help offset opex growth while bonus expense is also likely to normalize in 3Q26 from a 2Q26 peak given typical seasonality.
J PMORGAN
Company Background
Company Overview
Established in 1988 and listed on the TWSE in 2010 AirTAC is a leading supplier of pneumatic components. It offers a broad pneumatic product portfolio including actuators (47% of FY25 revenues) control components (21%) air preparation units (6%) and other products (26% such as linear guideways). Its end customer base is also diversified across industries including electronic equipment (27% of FY25 revenues) battery (14%) and automotive (10%).
The company sells its products under the proprietary 'AirTAC' brand through its own sales network (c.70%) and third-party agents/distributors (c.30%) with China being the major market accounting for nearly 95% of revenues. In FY25 AirTAC ranked as the second-largest pneumatic component supplier in China with a 30% market share (vs. 33%/13% for SMC/Festo respectively) while the company's manufacturing sites are mainly in Ningbo Guangdong and Tainan.
Figure 54: Revenue breakdown by product - AirTAC
Source: Compan data.
Figure 56: Direct sales as % o revenues - AirTAC
Source: Compan reports, J.P. Morgan.
Figure 55: Revenue breakdown by industry - AirTAC
Source: Compan data. Note: The breakdown is calculated based on sales revenue from direct customers and does not include distributor sales.
Figure 57: Revenue breakdown by region - AirTAC
Source: Compan data.
Table 25: Global manu acturing bases and sales branches - AirTAC
| Region | Comments |
|---|---|
| Mainland | Two manufacturing bases: Ningbo (largest production capacity) and Guangdong (valves). |
| Taiwan | One manufacturing base in Tainan (manufactures products such as linear guideways) and three offices. |
| Europe | One assembly and sales center in Italy. |
| Overseas | 300+ distributors providing a comprehensive sales network and service; one sales center each in Japan, Malaysia, Thailand, and the U.S. |
Source: Compan data, J.P. Morgan.
Figure 58: Shareholding structure - AirTAC
Source: Compan data.
Pneumatic Components Overview
Pneumatic systems use compressed air to generate and control mechanical motion offering low cost simple maintenance and high stability advantages. A typical pneumatic system consists of four key components: (1) Air compressors, which generate compressed air as the power source for the system; (2) Air Preparation Units (e.g. FRL units filter/regulator/lubricator) which remove moisture and impurities while regulating air pressure; (3) Control Components (e.g. valves) which control the direction and flow of compressed air; and (4) Actuators (e.g. cylinders) which convert pneumatic energy into linear mechanical motion.
Figure 59: Pneumatic operation o the process
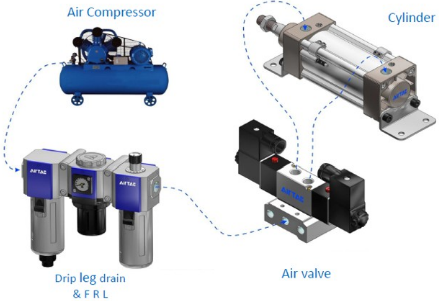
Figure 60: Product application by industry - automobile assembly
Source: Compan data.
Source: Compan data.
Financial Analysis
Revenue & Profitability
- We forecast revenue to increase from NT$34.3bn in FY25 to NT$53.5bn in FY28E representing a 16% CAGR.
- We forecast gross margin to increase from 46.0% in FY25 to 49.1% in FY26/27E before moderating to 48.7% by FY28E.
- We estimate opex to increase from NT$5.5bn in FY25 to NT$7.8bn in FY28E with CIR down from 16% to 14.6% due to better efficiency and operating leverage.
- We project EPS of NT$60.2/67.1/72.7 in FY26/27/28E up 43%/11%/8% YoY respectively with ROE remaining at 23-24% over FY26-28E.
Balance Sheet & Cash Flow
- We expect the company to maintain a net cash position throughout the forecast period with operating cash flow remaining positive and sustainable.
- We forecast capex to stay stable at NT$2.8-3bn in FY25-28E manageable at 6-8% of revenue.
- We also expect AirTAC's dividend payout ratio to reach 65% in FY26E consistent with mgmt's guidance implying a cash DPS of NT$39.1.
Table 26: Income statement summary - AirTAC
| Income statement (NT$m) | 2024 | 2025 | 2026E | 2027E | 2028E |
|---|---|---|---|---|---|
| Revenues | 30,660 | 34,330 | 44,651 | 49,268 | 53,517 |
| Cost of goods sold | (16,346) | (18,548) | (22,747) | (25,085) | (27,452) |
| Gross profit | 14,314 | 15,782 | 21,904 | 24,183 | 26,065 |
| SG&A expenses | (4,248) | (4,384) | (5,350) | (5,809) | (6,158) |
| R&D expenses | (1,040) | (1,111) | (1,351) | (1,502) | (1,631) |
| Operating profit | 9,026 | 10,288 | 15,204 | 16,872 | 18,276 |
| EBITDA | 11,586 | 12,866 | 18,057 | 19,762 | 21,176 |
| Non-operating income / loss | 608 | 358 | 126 | 106 | 140 |
| Profit before Tax | 9,634 | 10,645 | 15,329 | 16,978 | 18,417 |
| Income tax | (2,010) | (2,246) | (3,290) | (3,565) | (3,867) |
| Minority interest | (0) | (0) | (0) | (0) | (0) |
| Attributable Net Income | 7,624 | 8,400 | 12,039 | 13,413 | 14,549 |
| EPS (basic, NT$) | 38.1 | 42.0 | 60.2 | 67.1 | 72.7 |
| DPS (cash only, NT$) | 20.0 | 30.0 | 39.1 | 43.6 | 47.3 |
Source: Compan reports, J.P. Morgan estimates.
Table 27: Balance sheet summary - AirTAC
| Balance Sheet (NT$m) | 2024 | 2025 | 2026E | 2027E | 2028E |
|---|---|---|---|---|---|
| Cash and cash equivalents | 6,726 | 3,977 | 4,421 | 6,533 | 8,895 |
| Marketable Securities | 1,891 | 108 | 1,148 | 1,148 | 1,148 |
| Accounts/Notes receivable | 9,719 | 14,395 | 16,216 | 17,622 | 19,191 |
| Inventories | 6,803 | 6,292 | 7,402 | 9,515 | 11,443 |
| Total current assets | 25,419 | 25,047 | 29,596 | 35,226 | 41,085 |
| LT investments | 921 | 957 | 3 | 3 | 3 |
| Net fixed assets | 28,987 | 28,753 | 29,709 | 29,820 | 29,920 |
| Goodwill | 0 | 0 | 0 | 0 | 0 |
| Total assets | 57,561 | 57,540 | 62,164 | 67,905 | 73,865 |
| Short-term debts | 5,611 | 217 | 1,000 | 1,000 | 1,000 |
| Accounts/Notes payable | 1,129 | 1,307 | 1,468 | 1,631 | 1,760 |
| CPLTD | 0 | 0 | 0 | 0 | 0 |
| Total current liabilities | 9,103 | 4,630 | 8,058 | 8,221 | 8,350 |
| LT Debt & ECB | 0 | 0 | 0 | 0 | 0 |
| Total liabilities | 9,662 | 4,953 | 8,420 | 8,573 | 8,702 |
| Common stocks | 2,000 | 2,000 | 2,000 | 2,000 | 2,000 |
| Reserves | 14,846 | 14,847 | 14,847 | 14,847 | 14,847 |
| Retained earnings | 31,174 | 35,572 | 35,891 | 41,479 | 47,310 |
| Total equity | 47,899 | 52,587 | 53,745 | 59,332 | 65,163 |
Source: Compan reports, J.P. Morgan estimates.
Table 28: Cash low statement summary - AirTAC
| Cash Flow Statement (NT$m) | 2024 | 2025 | 2026E | 2027E | 2028E |
|---|---|---|---|---|---|
| Net Income | 7,623 | 8,400 | 12,039 | 13,413 | 14,549 |
| Depreciation & amortization | 2,561 | 2,578 | 2,853 | 2,889 | 2,900 |
| Change in receivables | 460 | (4,469) | (1,303) | (1,406) | (1,569) |
| Change in inventories | (91) | 496 | (869) | (2,112) | (1,928) |
| Change in payables | (81) | 631 | (178) | 163 | 129 |
| Other adjustments | 207 | 30 | (2,928) | (10) | 0 |
| Cash flow from operations | 10,678 | 7,667 | 9,614 | 12,937 | 14,080 |
| Purchase/Sale of investments | 0 | 0 | 0 | 0 | 0 |
| CAPEX | (2,653) | (2,815) | (3,049) | (3,000) | (3,000) |
| Other adjustments | (1,044) | 1,845 | 115 | 0 | 0 |
| Cash flow from investing | (3,696) | (969) | (2,934) | (3,000) | (3,000) |
| Free cash flow | 8,026 | 4,852 | 6,565 | 9,937 | 11,080 |
| Equity raised (buyback) | 0 | 0 | 0 | 0 | 0 |
| Debt/Bond issued (repaid) | (5,838) | (5,341) | 783 | 0 | 0 |
| Dividends paid | (3,595) | (4,002) | (6,002) | (7,825) | (8,718) |
| Other adjustments | (85) | (86) | (1,183) | 0 | 0 |
| Cash flow from financing | (9,518) | (9,429) | (6,402) | (7,825) | (8,718) |
| Beginning cash | 9,192 | 6,726 | 3,977 | 4,421 | 6,533 |
| Net change in cash | (2,466) | (2,749) | 444 | 2,112 | 2,362 |
| Ending cash | 6,726 | 3,977 | 4,421 | 6,533 | 8,895 |
Source: Compan reports, J.P. Morgan estimates.
Table 29: Quarterly inancial summary - AirTAC
| NT$mn, year-end Dec | 2026E - 1Q | 2026E - 2Q | 2026E - 3QE | 2026E - 4QE | 2027E - 1QE | 2027E - 2QE | 2027E - 3QE | 2027E - 4QE | 2028E - 1QE | 2028E - 2QE | 2028E - 3QE | 2028E - 4QE | 2025 | 2026E | 2027E | 2028E |
|---|---|---|---|---|---|---|---|---|---|---|---|---|---|---|---|---|
| Revenues | 10,014 | 12,164 | 11,512 | 10,961 | 11,414 | 13,374 | 12,390 | 12,090 | 12,525 | 14,658 | 13,362 | 12,972 | 34,330 | 44,651 | 49,268 | 53,517 |
| Cost of goods sold | (5,210) | (6,116) | (5,838) | (5,582) | (5,791) | (6,767) | (6,325) | (6,202) | (6,411) | (7,479) | (6,868) | (6,694) | (18,548) | (22,747) | (25,085) | (27,452) |
| Gross profit | 4,804 | 6,048 | 5,674 | 5,379 | 5,623 | 6,607 | 6,065 | 5,889 | 6,115 | 7,179 | 6,493 | 6,278 | 15,782 | 21,904 | 24,183 | 26,065 |
| SG&A expenses | (1,168) | (1,429) | (1,405) | (1,348) | (1,358) | (1,538) | (1,462) | (1,451) | (1,478) | (1,612) | (1,537) | (1,531) | (4,384) | (5,350) | (5,809) | (6,158) |
| R&D expenses | (311) | (354) | (357) | (329) | (354) | (401) | (384) | (363) | (388) | (440) | (414) | (389) | (1,111) | (1,351) | (1,502) | (1,631) |
| Operating profit | 3,325 | 4,265 | 3,913 | 3,702 | 3,911 | 4,668 | 4,219 | 4,075 | 4,248 | 5,127 | 4,542 | 4,359 | 10,288 | 15,204 | 16,872 | 18,276 |
| Profit before Tax | 3,424 | 4,238 | 3,937 | 3,730 | 3,918 | 4,694 | 4,250 | 4,116 | 4,262 | 5,159 | 4,585 | 4,411 | 10,645 | 15,329 | 16,978 | 18,417 |
| Income tax | (753) | (927) | (827) | (783) | (823) | (986) | (893) | (864) | (895) | (1,083) | (963) | (926) | (2,246) | (3,290) | (3,565) | (3,867) |
| Net income | 2,671 | 3,311 | 3,111 | 2,947 | 3,095 | 3,709 | 3,358 | 3,252 | 3,367 | 4,075 | 3,622 | 3,485 | 8,400 | 12,039 | 13,413 | 14,549 |
| EPS (basic, NT$) | 13.4 | 16.6 | 15.6 | 14.7 | 15.5 | 18.5 | 16.8 | 16.3 | 16.8 | 20.4 | 18.1 | 17.4 | 42.0 | 60.2 | 67.1 | 72.7 |
| Margins & Ratio | ||||||||||||||||
| Gross margin | 48.0% | 49.7% | 49.3% | 49.1% | 49.3% | 49.4% | 48.9% | 48.7% | 48.8% | 49.0% | 48.6% | 48.4% | 46.0% | 49.1% | 49.1% | 48.7% |
| Operating margin | 33.2% | 35.1% | 34.0% | 33.8% | 34.3% | 34.9% | 34.0% | 33.7% | 33.9% | 35.0% | 34.0% | 33.6% | 30.0% | 34.1% | 34.2% | 34.2% |
| Net margin | 26.7% | 27.2% | 27.0% | 26.9% | 27.1% | 27.7% | 27.1% | 26.9% | 26.9% | 27.8% | 27.1% | 26.9% | 24.5% | 27.0% | 27.2% | 27.2% |
| Cost to income ratio | 14.8% | 14.7% | 15.3% | 15.3% | 15.0% | 14.5% | 14.9% | 15.0% | 14.9% | 14.0% | 14.6% | 14.8% | 16.0% | 15.0% | 14.8% | 14.6% |
| YoY Growth (%) | ||||||||||||||||
| Revenues | 24% | 36% | 40% | 21% | 14% | 10% | 8% | 10% | 10% | 10% | 8% | 7% | 12% | 30% | 10% | 9% |
| Gross profit | 34% | 47% | 49% | 25% | 17% | 9% | 7% | 9% | 9% | 9% | 7% | 7% | 10% | 39% | 10% | 8% |
| Operating profit | 46% | 56% | 59% | 31% | 18% | 9% | 8% | 10% | 9% | 10% | 8% | 7% | 14% | 48% | 11% | 8% |
| Net income | 38% | 63% | 48% | 27% | 16% | 12% | 8% | 10% | 9% | 10% | 8% | 7% | 10% | 43% | 11% | 8% |
| EPS | 38% | 63% | 48% | 27% | 16% | 12% | 8% | 10% | 9% | 10% | 8% | 7% | 10% | 43% | 11% | 8% |
| QoQ Growth (%) | ||||||||||||||||
| Revenues | 11% | 21% | -5% | -5% | 4% | 17% | -7% | -2% | 4% | 17% | -9% | -3% | ||||
| Gross profit | 12% | 26% | -6% | -5% | 5% | 18% | -8% | -3% | 4% | 17% | -10% | -3% | ||||
| Operating profit | 18% | 28% | -8% | -5% | 6% | 19% | -10% | -3% | 4% | 21% | -11% | -4% | ||||
| Net income | 15% | 24% | -6% | -5% | 5% | 20% | -9% | -3% | 4% | 21% | -11% | -4% | ||||
| EPS | 15% | 24% | -6% | -5% | 5% | 20% | -9% | -3% | 4% | 21% | -11% | -4% |
Source: Compan reports, J.P. Morgan estimates.
Investment Thesis, Valuation an Risks
AirTAC(Overweight; Price Target: NT$1,600.00)
Investment Thesis
We rate AirTAC OW as a key beneficiary of China's automation upcycle with further market share gains and improving operating efficiency supporting earnings growth and resilience through downturns. New business lines offer incremental growth opportunities beyond core pneumatics while valuation remains attractive at 1-std below its 10-year average forward P/E making AirTAC our quality pick in the current cycle.
Valuation
Our Dec-27 PT of NT$1 600 is based on 22x 12M forward EPS. Our target multiple reflects AirTAC's leading position in China's pneumatic components market and 20% FY25-28E EPS CAGR while taking a more conservative stance amid concerns over any potential cyclical downturn.
Risks to Rating and Price Target
Key downside risks include: 1) faster-than-expected cycle normalization; 2) margin pressure from increased competition and higher raw material costs; 3) execution risk in ramping new growth engines; and 4) higher-than-expected opex.
AirTAC: Summary o Financials
| Income Statement | FY24A | FY25A | FY26E | FY27E | FY28E |
|---|---|---|---|---|---|
| Revenue | 30,660 | 34,330 | 44,651 | 49,268 | 53,517 |
| COGS | (16,346) | (18,548) | (22,747) | (25,085) | (27,452) |
| Gross pro it | 14,314 | 15,782 | 21,904 | 24,183 | 26,065 |
| SG&A | (4,248) | (4,384) | (5,350) | (5,809) | (6,158) |
| Adj. EBITDA | 11,586 | 12,866 | 18,057 | 19,762 | 21,176 |
| D&A | (2,561) | (2,578) | (2,853) | (2,889) | (2,900) |
| Adj. EBIT | 9,026 | 10,288 | 15,204 | 16,872 | 18,276 |
| Net Interest | 36 | 65 | 93 | 106 | 140 |
| Adj. PBT | 9,634 | 10,645 | 15,329 | 16,978 | 18,417 |
| Tax | (2,010) | (2,246) | (3,290) | (3,565) | (3,867) |
| Minorit Interest | 0 | 0 | 0 | 0 | 0 |
| Adj. Net Income | 7,624 | 8,400 | 12,039 | 13,413 | 14,549 |
| Reported EPS | 38.09 | 41.97 | 60.19 | 67.05 | 72.73 |
| Adj. EPS | 38.09 | 41.97 | 60.19 | 67.05 | 72.73 |
| DPS | 20.01 | 30.01 | 39.13 | 43.59 | 47.29 |
| Pa out ratio | 52.5% | 71.5% | 65.0% | 65.0% | 65.0% |
| Shares outstanding | 200 | 200 | 200 | 200 | 200 |
| Balance Sheet | FY24A | FY25A | FY26E | FY27E | FY28E |
| Cash and cash equivalents | 6,726 | 3,977 | 4,421 | 6,533 | 8,895 |
| Accounts receivable | 9,719 | 14,395 | 16,216 | 17,622 | 19,191 |
| Inventories | 6,803 | 6,292 | 7,402 | 9,515 | 11,443 |
| Other current assets | 2,171 | 383 | 1,556 | 1,556 | 1,556 |
| Current assets | 25,419 | 25,047 | 29,596 | 35,226 | 41,085 |
| PP&E | 28,987 | 28,753 | 29,709 | 29,820 | 29,920 |
| LT investments | 921 | 957 | 3 | 3 | 3 |
| Other non current assets | 2,234 | 2,782 | 2,856 | 2,856 | 2,856 |
| Total assets | 57,561 | 57,540 | 62,164 | 67,905 | 73,865 |
| Short term borrowings | 5,611 | 217 | 1,000 | 1,000 | 1,000 |
| Pa ables | 1,129 | 1,307 | 1,468 | 1,631 | 1,760 |
| Other short term liabilities | 2,364 | 3,106 | 5,589 | 5,589 | 5,589 |
| Current liabilities | 9,103 | 4,630 | 8,058 | 8,221 | 8,350 |
| Long-term debt | 0 | 0 | 0 | 0 | 0 |
| Other long term liabilities | 558 | 323 | 362 | 352 | 352 |
| Total liabilities | 9,662 | 4,953 | 8,420 | 8,573 | 8,702 |
| Shareholders' equit | 47,893 | 52,581 | 53,739 | 59,326 | 65,157 |
| Minorit interests | 6 | 6 | 6 | 6 | 6 |
| Total liabilities & equity | 57,561 | 57,540 | 62,164 | 67,905 | 73,865 |
| BVPS | 239.46 | 262.91 | 268.69 | 296.63 | 325.79 |
| y/y Growth | 12.5% | 9.8% | 2.2% | 10.4% | 9.8% |
| Net debt/(cash) | (1,115) | (3,760) | (3,421) | (5,533) | (7,895) |
| Cash Flow Statement | FY24A | FY25A | FY26E | FY27E | FY28E |
|---|---|---|---|---|---|
| Cash low rom operating activities | 10,678 | 7,667 | 9,614 | 12,937 | 14,080 |
| o/w Depreciation & amortization | 2,561 | 2,578 | 2,853 | 2,889 | 2,900 |
| o/w Changes in working capital | 275 | (3,323) | (2,342) | (3,355) | (3,368) |
| Cash low rom investing activities | (3,696) | (969) | (2,934) | (3,000) | (3,000) |
| o/w Capital expenditure | (2,653) | (2,815) | (3,049) | (3,000) | (3,000) |
| as % of sales | 8.7% | 8.2% | 6.8% | 6.1% | 5.6% |
| Cash low rom inancing activities | (9,518) | (9,429) | (6,402) | (7,825) | (8,718) |
| o/w Dividends paid | (3,595) | (4,002) | (6,002) | (7,825) | (8,718) |
| o/w Shares issued/(repurchased) | 0 | 0 | 0 | 0 | 0 |
| o/w Net debt issued/(repaid) | (5,838) | (5,341) | 783 | 0 | 0 |
| Net change in cash | (2,466) | (2,749) | 444 | 2,112 | 2,362 |
| Adj. Free cash low to irm | 8,026 | 4,852 | 6,565 | 9,937 | 11,080 |
| y/y Growth | 21.6% | (39.5% | 35.3% | 51.4% | 11.5% |
| Ratio Analysis | FY24A | FY25A | FY26E | FY27E | FY28E |
| Gross margin | 46.7% | 46.0% | 49.1% | 49.1% | 48.7% |
| EBITDA margin | 37.8% | 37.5% | 40.4% | 40.1% | 39.6% |
| EBIT margin | 29.4% | 30.0% | 34.1% | 34.2% | 34.2% |
| Net profit margin | 24.9% | 24.5% | 27.0% | 27.2% | 27.2% |
| ROE | 16.9% | 16.7% | 22.6% | 23.7% | 23.4% |
| ROA | 13.2% | 14.6% | 20.1% | 20.6% | 20.5% |
| ROCE | 13.3% | 15.3% | 22.2% | 23.2% | 22.8% |
| SG&A/Sales | 13.9% | 12.8% | 12.0% | 11.8% | 11.5% |
| Net debt/Equit | NM | NM | NM | NM | NM |
| Net debt/EBITDA | NM | NM | NM | NM | NM |
| Sales/Assets (x) | 0.5 | 0.6 | 0.7 | 0.8 | 0.8 |
| Assets/Equit (x) | 1.3 | 1.1 | 1.1 | 1.2 | 1.1 |
| Interest cover (x) | NM | NM | NM | NM | NM |
| Operating leverage | 71.4% | 116.8% | 158.9% | 106.1% | 96.5% |
| Tax rate | 20.9% | 21.1% | 21.5% | 21.0% | 21.0% |
| Revenue / Growth | 2.8% | 12.0% | 30.1% | 10.3% | 8.6% |
| EBITDA / Growth | 2.9% | 11.0% | 40.3% | 9.4% | 7.2% |
| EPS / Growth | 9.4% | 10.2% | 43.4% | 11.4% | 8.5% |
| Valuation | FY24A | FY25A | FY26E | FY27E | FY28E |
| P/E (x) | 28.9 | 26.2 | 18.3 | 16.4 | 15.1 |
| P/BV (x) | 4.6 | 4.2 | 4.1 | 3.7 | 3.4 |
| EV/EBITDA (x) | 18.9 | 16.8 | 12.0 | 10.9 | 10.0 |
| Dividend Yield | 1.8% | 2.7% | 3.6% | 4.0% | 4.3% |
Source: Compan reports and J.P. Morgan estimates.
Note: NT$ in millions (except per-share data).Fiscal ear ends Dec. o/w - out of which
▲Neutral
Previous: Un erweight
2049.TW, 2049 TT
Price (22 Oct 26):NT$299.00
▲Price Target (Dec-27):NT$310.00 Prior (Dec-26):NT$160.00
Taiwan Industrial
Amanda Chang AC
(886-2) 2725-9861 aman a.chang@jpmorgan.com J.P. Morgan Securities (Taiwan) Limite
| ey Changes (FYE Dec) | ey Changes (FYE Dec) | ey Changes (FYE Dec) | ey Changes (FYE Dec) |
| Prev | Cur | Δ | |
| Adj. EPS - 26E (NT$) | 5.46 | 9.03 | 65.5% |
| Adj. EPS - 27E (NT$) | 6.42 | 11.0972.7% |
Style Exposure
| uant - Factors | Current - %Rank | Hist %Rank (1=Top) - 6M | Hist %Rank (1=Top) - 1Y | Hist %Rank (1=Top) - 3Y | Hist %Rank (1=Top) - 5Y |
|---|---|---|---|---|---|
| Value | 78 | 89 | 83 | 55 | 75 |
| Growth | 88 | 90 | 82 | 83 | 27 |
| Momentum | 48 | 43 | 76 | 84 | 72 |
| Quality | 98 | 86 | 86 | 67 | 67 |
| Low Vol | 51 | 64 | 65 | 52 | 61 |
Hiwin
Solid visibility but valuation and margin cyclicality limit upside
We assume coverage of Hiwin with a Neutral rating and a Dec-27 PT of NT$310. While Hiwin has benefited from rising demand for precision motion components across industrial automation AI/semis and robotics we believe its current valuation already reflects much of the recovery. Tight supply-demand conditions should support pricing and order visibility but incremental demand from semiconductors and robotics is likely to materialize gradually rather than drive a meaningful near-term earnings upgrade. At 27x FY27E P/E Hiwin trades at a 30-40% premium to domestic peer average despite structurally lower profitability and greater margin downside in a cyclical downturn. This limits the scope for further multiple expansion and leaves the risk-reward less compelling supporting our Neutral rating.
- Extended lead times support visibility, but with limited earnings upside. Hiwin's lead times have extended to 4-6M for linear guideways and 6M for ball screws reflecting healthy demand across industrial automation AI/semis and precision machinery. Advance orders and disciplined capacity expansion should sustain a high backlog and support earnings visibility into 1H27E. However with the share price already reflecting the near-term recovery we see limited room for further re-rating or material earnings upside from current levels unless demand proves more durable than expected.
- Robotics and semiconductor expansion remain gradual, longer-term opportunities. Hiwin is expanding into semiconductor equipment (e.g. EFEM and wafer robots) logistics automation and CPO-related solutions which could benefit from rising AI/ semis capex though meaningful revenue contribution would likely take time. Dexterity's logistics robots remain at an early stage with deployment dependent on customer adoption schedules. Longer-term opportunities in humanoid robotics also await clearer commercialization roadmaps while harmonic drives remain immaterial to revenue despite ongoing shipments. We estimate robotics will account for 13% of revenue by FY28E up from 9% in FY25 but expect the ramp to be gradual limiting the likelihood of significant near-term earnings upgrades.
- Competition and margin cyclicality remain key concerns. We see Hiwin as more exposed than peers to competition from Chinese domestic players particularly in linear guideways where higher product standardization increases the risk of local substitution. Pricing pressure also tends to intensify during downcycles as weaker demand and lower utilization prompt local suppliers to compete more aggressively on price. As a result Hiwin's gross margin is likely to remain cyclical and vulnerable during demand downturns with recovery dependent on a demand improvement or a richer product mix toward semiconductor equipment robotics applications and system-level solutions.
- Neutral with a Dec-27 PT of NT$310. Our PT of NT$310 is based on 27x target P/E and 12M forward EPS of NT$11.5 implying 4% upside as the target multiple reflects no re-rating/de-rating impulse from here to our PT horizon. However relative to peers we see a less attractive risk-reward given Hiwin's structurally lower profitability greater exposure to domestic competition and more cyclical margin profile. We would revisit our fair value and rating if there is clearer evidence that earnings growth can remain above trend into FY28E or if Hiwin's valuation premium to peers narrows. Key upside risks include faster semiconductor/robotics growth and stronger margin expansion with sustained order momentum; downside risks include a slowdown in automation cycle intensifying competition rising raw material costs and FX fluctuations.
— 2049.TW Price (NT$)
—TSE (rebased)
YTD
1m
3m
12m
Abs
54.1%
-9.7%
-6.7%
35.6%
Rel
-4.9%
-6.0%
-9.4%
-30.9%
Company Data
| Shares O/S (mn) | 354 |
|---|---|
| 52-week range (NT$) | 426.00-180.50 |
| Market cap ($ mn) | 3,262 |
| Exchange rate | 32.43 |
| Free float (%) | 75.8% |
| 3M ADV (mn) | 4.16 |
| 3M ADV ($ mn) | 45.5 |
| Volatilit (90 Da ) | 58 |
| Index | TAIEX |
| BBG ANR (Bu | Hold | Sell) | 15|4|2 |
ey Metrics (FYE Dec)
| NT$ in millions | FY25A | FY26E | FY27E | FY28E |
|---|---|---|---|---|
| Financial Estimates | ||||
| Revenue | 24,263 | 30,046 | 35,072 | 37,048 |
| Adj. EBITDA | 4,001 | 6,345 | 7,380 | 7,562 |
| Adj. EBIT | 1,643 | 3,833 | 4,850 | 5,010 |
| Adj. net income | 1,526 | 3,199 | 3,928 | 4,067 |
| Adj. EPS | 4.30 | 9.03 | 11.09 | 11.48 |
| BBG EPS | 4.21 | 9.27 | 11.86 | 11.35 |
| Cashflow from operations | 4,277 | 5,612 | 4,906 | 5,865 |
| FCFF | 1,511 | 3,134 | 2,106 | 3,065 |
| Margins and Growth | ||||
| Revenue Growth Y/Y (%) | (0.5%) | 23.8% | 16.7% | 5.6% |
| EBITDA margin | 16.5% | 21.1% | 21.0% | 20.4% |
| EBITDA Growth Y/Y (%) | (8.9%) | 58.6% | 16.3% | 2.5% |
| EBIT margin | 6.8% | 12.8% | 13.8% | 13.5% |
| Net margin | 6.3% | 10.6% | 11.2% | 11.0% |
| Adj. EPS growth | (22.6%) | 109.8% | 22.8% | 3.5% |
| Ratios | ||||
| Adj. tax rate | 20.1% | 23.2% | 23.3% | 23.3% |
| Interest cover | 31.1 | 52.0 | 70.2 | 82.2 |
| Net debt/Equit | 0.0 | NM | NM | NM |
| Net debt/EBITDA | 0.3 | NM | NM | NM |
| ROCE | 2.9% | 6.2% | 7.4% | 7.3% |
| ROE | 4.1% | 8.2% | 9.5% | 9.3% |
| Valuation | ||||
| FCFF ield | 1.4% | 3.0% | 2.0% | 2.9% |
| Dividend ield | 0.7% | 1.4% | 1.7% | 1.7% |
| EV/Revenue | 4.4 | 3.5 | 3.0 | 2.8 |
| EV/EBITDA | 26.7 | 16.5 | 14.1 | 13.6 |
| Adj. P/E | 69.5 | 33.1 | 27.0 | 26.0 |
Summary Investment Thesis and Valuation
Investment Thesis
We rate Hiwin Neutral as the automation recovery and rising AI/semiconductor and robotics demand should support solid growth. However the stock trades at a premium to peers despite structurally lower profitability while it also faces greater margin downside in a cyclical downturn. With semiconductor and robotics contributions expected to ramp up gradually we see limited room for material earnings upgrades and further rerating potential leaving a less compelling risk-reward profile than peers.
Valuation
Our Dec-27 PT of NT$310 is based on 27x 12M forward EPS reflecting limited downside from its discount to historical valuation and clear order visibility but also limited upside given its premium to peers relative to its weaker profitability.
Performance Drivers
Market
18%
Region
%9
Macro
13%
Style
3%
Idiosyn.
60%
| Factors | 6M Corr | 1Y Corr |
|---|---|---|
| Market: MSCI Asia Pac ex JP | 0.37 | 0.42 |
| Region: Taiwan | 0.16 | 0.24 |
| Macro: | ||
| US 10 Year Yield | 0.38 | 0.35 |
| JP Morgan GBI-EM Global Div | -0.22 | -0.21 |
| Citi Economic Surprise - EM | -0.30 | -0.19 |
| Quant Styles: | ||
| Growth | 0.19 | 0.22 |
| DivYld | -0.17 | -0.21 |
| Value | -0.17 | -0.19 |
Table 30: Product lead time trend o Hiwin
| Period | Ball screw lead time | Linear guideway lead time | Note |
|---|---|---|---|
| Ma -25 | 2-2.5 months | 2-2.5 months | 1Q25 earnings call: lead times c.2-2.5 months; some overtime production ma be needed to avoid dela s and customer order shifts. |
| Nov-25 | 2-2.5 months | 2-2.5 months | 3Q25 earnings call: management noted customer inventories were low. |
| Mar-26 | 4 months | 3-3.5 months | Extended b 0.5-1 month vs. pre-Lunar New Year |
| Ma -26 | 4.5-5 months | 3.5 months | 1Q26 earnings call: order visibilit c.4-5 months; demand exceeds production capacit . |
| Aug-26 | 6 months | 4-6 months | Order visibilit extends into 1Q27 |
Source: Compan data, News summar , J.P. Morgan.
Investment Thesis
1. Extended lead times support visibility, but with limited earnings upside
Hiwin continues to see tight supply-demand conditions with lead times at 4-6 months for linear guideways and 6 months for ball screws reflecting strong demand across automation AI/semiconductor equipment and other precision machinery. Customers are also placing orders ahead of actual production requirements to secure capacity keeping Hiwin's backlog elevated and extending demand visibility into 1H27E. Meanwhile Hiwin is taking a disciplined approach to capacity expansion; as a result we believe the supply-demand conditions are likely to remain tight supporting higher utilization and pricing. With price increases implemented after Lunar New Year starting to flow through from June we expect a full pricing benefit in 3Q26. That said while these factors support solid near-term earnings visibility we believe much of the recovery is already reflected in the share price. As such incremental upside may be limited unless demand proves more durable than expected or Europe's recovery accelerates given the region accounts for c.25-30% of Hiwin's revenue and carries higher margins.
2. Robotics & semiconductor expansion remain gradual, longer-term opportunities
Hiwin is expanding beyond motion-control components into integrated robotics solutions with robotics revenue mix rising from 9% in FY25 to 12% in 1H26. We see further growth potential from existing revenue drivers emerging projects and longerterm humanoid opportunities with our forecasts implying 21%/13% YoY growth in robotics revenue in FY27/28E. However we expect the ramp to remain gradual with near-term contribution still led by existing applications rather than a step-change from new robotics projects.
- Single-axis and semis robots are the key revenue drivers: Hiwin's robotics business is currently driven mainly by single-axis robots and semiconductor-related applications such as EFEM (Equipment Front End Module) load ports and wafer robots. Single-axis robots serve a broad range of industries while semiconductor robotics continues to benefit from AI and advanced semis capex. We see these applications remaining the major contributors to robotics revenue in the near-term.
- Emerging projects from multi-axis robots and CPO should scale gradually: Hiwin is developing several new projects such as welding robots and Dexterity's eight-axis logistics robot. The welding robot project could serve customers across diversified industries potentially generating low-volume revenue in FY27E while the Dexterity project remains dependent on customer deployment schedules. For CPO Hiwin's direct exposure is mainly through component shipments (e.g. small ball screws) while system-level revenue (e.g. test equipment) is largely recognized at Hiwin Mikrosystem. Thus the direct earnings uplift for Hiwin is likely to be more moderate although CPO should still provide incremental upside over time.
Figure 61: Robot revenue mix - Hiwin
Source: Compan data, J.P. Morgan estimates.
- umanoid robotics offers a long-term opportunity, but commercialization remains uncertain: Humanoid robotics represents a longer-term opportunity leveraging Hiwin's capabilities in harmonic drives planetary roller screws and integrated joint modules. Hiwin has begun shipping harmonic drives though the contribution remains limited while planetary roller screws may start to generate revenue from FY27E subject to ramp-up schedules. Overall Hiwin's exposure to humanoid robotics remains at an early stage with the timing of project commercialization still uncertain.
Figure 62: Robot revenue YoY growth - Hiwin
Source: Compan data, J.P. Morgan estimates.
3. Competition and margin cyclicality remain key concerns
We believe Hiwin's margins are more exposed to cyclical pressure than peers given its relatively high exposure to standardized motion-control products particularly linear guideways where local substitution risk is higher. Historical ASP trends for linear guideways suggest pricing pressure tends to intensify during downcycles as weaker demand and lower utilization prompt local suppliers to compete more aggressively on price. This pricing sensitivity is also reflected in Hiwin's margin profile which is at a lower level experiencing larger margin swings than automation peers. Thus Hiwin's gross margin is likely to be cyclical and vulnerable during demand downturns with recovery dependent on a demand improvement or a favorable product mix toward semiconductor equipment robotics applications and system-level solutions.
Figure 63: Linear guideway ASP is exposed to cycle-driven pricing pressure
Source: Taiwan Customs.
Figure 64: Hiwin's margins are lower and more cyclical than peers
Source: Compan data.
Investment Risks
Upside Risks
- Faster ramp-up in semiconductor equipment and robotics. Our base case assumes a gradual contribution from these segments rather than seeing material near-term earnings upgrades. However stronger-than-expected demand from advanced packaging AI-related semiconductor applications or robotics could accelerate Hiwin's revenue growth and drive earnings upside risks. Key milestones we are tracking include: (1) whether wafer robot and semiconductor subsystem shipments keep ramping beyond 2Q27; (2) whether Dexterity's logistics-related orders transition from sampling into confirmed meaningful orders in FY27E; (3) whether Hiwin secures commercial humanoid projects and the contribution progress of its harmonic drives and planetary roller screws.
- Stronger-than-expected margin expansion. We expect Hiwin's margins to face greater downside risks in a downturn given lower utilization and increased price competition. However more resilient demand a favorable product mix or better cost efficiencies could support stronger gross and operating margins providing upside to earnings estimates.
- Sustained order momentum. A stronger automation recovery particularly in machine tools and China's manufacturing upgrades could extend lead times and improve order visibility. In addition a faster-than-expected rebound in Europe would reinforce the durability of the recovery as the region's demand has so far lagged prior upcycles. Sustained demand would support capacity utilization and raise the likelihood of upward earnings revisions.
Downside Risks
- A slowdown in the automation cycle. Hiwin remains exposed to cyclical demand in industrial automation machine tools and China automation capex. A slowdown in manufacturing activity or automation investment could dampen demand for linear guideways and ball screws leading to earnings downside risks.
- Intensifying competition pressuring market share and pricing. Japanese suppliers in high-end applications and Chinese suppliers in lower-end segments could erode Hiwin's market share or force price concessions weighing on revenue growth and margins.
- Rising raw material costs. As raw material costs (especially steel) account for the largest share of Hiwin's COGS a significant increase in material prices could weigh on gross margins particularly when price adjustments lag cost inflation or when customer pass-through becomes more difficult.
- Adverse FX volatility and movements. Unfavorable movements in major currencies such as the USD EUR RMB or TWD could pressure reported revenue and gross margins especially during periods of TWD appreciation. For example Hiwin's 3Q25 gross margin declined 1.1ppt QoQ partly due to TWD appreciation. Continued FX volatility could increase earnings volatility and reduce margin visibility.
Figure 65: Revenue by product - Hiwin
Source: Compan data, J.P. Morgan.
Table 31: M&A history - Hiwin
| Time | Company Name | Country | Product | Purpose |
|---|---|---|---|---|
| 1993 | Holzer | German | Ball screw | To improve ball screw manufacturing |
| 1996 | Yuan Yin Precision | Taiwan | Ball screw | To improve ball screw manufacturing |
| 2009 | Mega Fabs Motion s stem | Israel | Motor and control s stem | To improve manufacturing in high-end motor, a ke part in industrial robot. |
| 2010 | Matrix | British | Screw grinder | To improve vertical integration |
| 2015 | Luren | Taiwan | Gear cutting tools | To improve vertical integration |
Source: Compan reports.
Company Background
Company Overview
Established in 1989 and listed on the TWSE in 2009 Hiwin is a leading manufacturer of linear motion components. Its core products include linear guideways (62% of FY25 sales) ball screws (20%) and robots (9%) while also serving a broad range of end markets such as machine tools semiconductor equipment electronics and medical devices.
The company has expanded its manufacturing and sales network through previous M&As with Taiwan being its largest market (44% of FY25 sales) followed by China (21%) Germany (16%) the U.S. (5%) and Japan (4%). Its major production bases are located in Taiwan such as Taichung and Yunlin accounting for 80-90% of the production capacity while the overseas subsidiaries mainly handle downstream customization/assembly and also serve as sales hubs. In addition Hiwin's 8%-owned affiliate company Hiwin Mikrosystem (4576 TT NC) complements the group's mechanical transmission products by providing motors encoders drives and motion control systems enabling Hiwin to offer integrated motion solutions for automation and robotics applications.
Figure 66: Revenue by region - Hiwin
Source: Compan reports.
Table 32: Major shareholder list - Hiwin
| Major Shareholders | Holding % |
|---|---|
| Hiwin Investment | 8.15% |
| New Labor Pension Fund | 3.41% |
| Fidelity Advisor Emerging Markets Fund (custodied by HSBC Bank Taiwan) | 3.34% |
| Eric Y.T. Chuo | 2.68% |
| Eddie W.H. Chuo | 1.93% |
| Nan Shan Life | 1.92% |
| Fidelity Emerging Markets Fund (custodied by Deutsche Bank Taipei) | 1.68% |
| Shun-Chin Lee | 1.67% |
| Olivia S.Y. Chuo | 1.53% |
| Yongqiang Investment | 1.53% |
Source: Compan reports. Note: data as of March 31, 2026.
Figure 68: Linear guideways
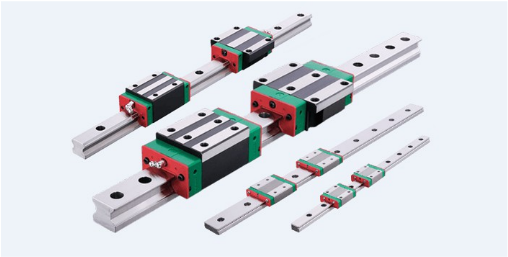
Source: Compan data.
Table 33: Robotics product port olio o Hiwin
| Category | Series |
|---|---|
| General industr | Single-axis robot, articulated robotic-arm, SCARA robotic-arm, electric gripper |
| Semiconductor industr | Wafer transfer s stem, wafer robotic-arm, wafer edge finder, load port |
| Medical industr | Robotic gait training s stem |
| Strain Wave Gear | Datorker robot strain wave gear |
| Precision Bearing | Crossed roller bearing, ball screw bearing, support unit |
Source: Compan reports.
Figure 67: QFII holding - Hiwin
Source: TEJ.
Linear Motion & Robotics Product Overview
Linear motion components are precision mechanical transmission products that enable accurate and efficient linear movement in automated equipment such as machine tools semiconductor equipment robotics etc. The two core products are: (1) linear guideways which provide smooth low-friction linear guidance; and (2) ball screws which convert rotary motion into precise linear motion. Together they form the foundation of a high-precision motion control system. Building on its motion-control expertise Hiwin also offers robotics solutions such as single-axis multi-axis and wafer robots for semiconductor medical and other industrial applications.
Figure 69: Ball screws
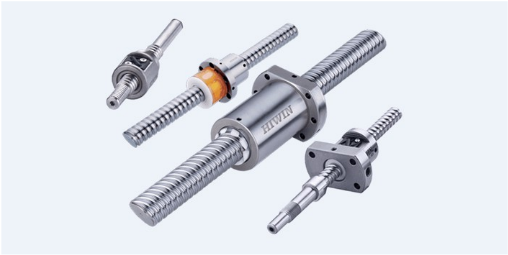
Source: Compan data.
Financial Analysis
Revenue & Profitability
- We forecast revenue to increase from NT$24.3bn in FY25 to NT$37bn in FY28E representing a 15% CAGR.
- We forecast gross margin to increase from 28.8% in FY25 to 34.2% in FY27E before easing to 33.6% by FY28E.
- We estimate opex to increase from NT$5.3bn in FY25 to NT$7.5bn in FY28E while the cost-income ratio improves from 22% to 20.1% under better operating leverage.
- We project EPS of NT$9.0/11.1/11.5 in FY26/27/28E up 110%/23%/4% YoY respectively with ROE sustained at 8-9% over FY26-28E.
Balance Sheet & Cash Flow
- We forecast Hiwin's OCF to improve from NT$4.3bn in FY25 to NT$5.9bn in FY28E with FCF rising from NT$1.5bn to NT$3.1bn despite a low ROE and annual CAPEX of NT2.5-2.8bn (c.8-11% of revenue). This supports cash balance growth suggesting investments are increasingly funded by cash generation.
- We also expect Hiwin's dividend payout ratio to reach 45% in FY26E largely in line with its 5-year average implying a cash DPS of NT$4.1.
Table 34: Income statement summary - Hiwin
| Income statement (NT$m) | 2024 | 2025 | 2026E | 2027E | 2028E |
|---|---|---|---|---|---|
| Revenues | 24,392 | 24,263 | 30,046 | 35,072 | 37,048 |
| Cost of goods sold | (17,174) | (17,285) | (19,882) | (23,080) | (24,588) |
| Gross profit | 7,218 | 6,978 | 10,164 | 11,993 | 12,460 |
| SG&A expenses | (4,196) | (4,310) | (5,129) | (5,740) | (5,968) |
| R&D expenses | (963) | (1,025) | (1,202) | (1,403) | (1,482) |
| Operating profit | 2,059 | 1,643 | 3,833 | 4,850 | 5,010 |
| EBITDA | 4,393 | 4,001 | 6,345 | 7,380 | 7,562 |
| Non-operating income / loss | 191 | 121 | 165 | 73 | 88 |
| Profit before Tax | 2,250 | 1,764 | 3,998 | 4,923 | 5,098 |
| Income tax | (387) | (354) | (929) | (1,146) | (1,187) |
| Minority interest | (109) | (116) | (130) | (151) | (156) |
| Attributable Net Income | 1,972 | 1,526 | 3,199 | 3,928 | 4,067 |
| EPS (basic, NT$) | 5.6 | 4.3 | 9.0 | 11.1 | 11.5 |
| DPS (cash only, NT$) | 2.4 | 2.0 | 4.1 | 5.0 | 5.2 |
Source: Compan reports, J.P. Morgan estimates.
Table 35: Balance sheet summary - Hiwin
| Balance Sheet (NT$m) | 2024 | 2025 | 2026E | 2027E | 2028E |
|---|---|---|---|---|---|
| Cash and cash equivalents | 7,354 | 7,624 | 9,649 | 10,316 | 11,613 |
| Marketable Securities | 0 | 0 | 1 | 1 | 1 |
| Accounts/Notes receivable | 4,467 | 4,418 | 4,675 | 5,331 | 5,570 |
| Inventories | 7,407 | 7,094 | 7,885 | 9,189 | 9,702 |
| Total current assets | 19,983 | 19,864 | 22,974 | 25,601 | 27,650 |
| LT investments | 1,907 | 1,490 | 2,619 | 2,678 | 2,737 |
| Net fixed assets | 29,367 | 29,836 | 29,845 | 30,114 | 30,362 |
| Goodwill | 357 | 294 | 294 | 294 | 294 |
| Total assets | 54,418 | 54,176 | 58,337 | 61,292 | 63,648 |
| Short-term debts | 1,397 | 2,033 | 2,000 | 2,000 | 2,000 |
| Accounts/Notes payable | 3,318 | 3,251 | 3,711 | 4,328 | 4,541 |
| CPLTD | 1,067 | 977 | 811 | 811 | 811 |
| Total current liabilities | 8,322 | 8,530 | 10,028 | 10,646 | 10,859 |
| LT Debt & ECB | 7,563 | 6,712 | 6,601 | 6,601 | 6,601 |
| Total liabilities | 17,343 | 16,702 | 18,104 | 18,721 | 18,934 |
| Common stocks | 3,538 | 3,538 | 3,538 | 3,538 | 3,538 |
| Reserves | 11,509 | 11,693 | 11,839 | 11,839 | 11,839 |
| Retained earnings | 20,520 | 20,949 | 22,587 | 25,075 | 27,375 |
| Total equity | 37,074 | 37,474 | 40,233 | 42,571 | 44,714 |
Source: Compan reports, J.P. Morgan estimates.
Table 36: Cash low statement summary - Hiwin
| Cash Flow Statement (NT$m) | 2024 | 2025 | 2026E | 2027E | 2028E |
|---|---|---|---|---|---|
| Net Income | 1,863 | 1,410 | 3,069 | 3,777 | 3,911 |
| Depreciation & amortization | 2,334 | 2,358 | 2,513 | 2,531 | 2,552 |
| Change in receivables | (834) | 196 | (201) | (657) | (239) |
| Change in inventories | 254 | 780 | (616) | (1,304) | (513) |
| Change in payables | 330 | (190) | 687 | 617 | 213 |
| Other adjustments | (328) | (277) | 159 | (58) | (60) |
| Cash flow from operations | 3,619 | 4,277 | 5,612 | 4,906 | 5,865 |
| Purchase/Sale of investments | 11 | 0 | 0 | 0 | 0 |
| CAPEX | (3,714) | (2,766) | (2,477) | (2,800) | (2,800) |
| Other adjustments | (180) | (52) | (87) | 0 | 0 |
| Cash flow from investing | (3,883) | (2,818) | (2,565) | (2,800) | (2,800) |
| Free cash flow | (96) | 1,511 | 3,134 | 2,106 | 3,065 |
| Equity raised (buyback) | 0 | 0 | 0 | 0 | 0 |
| Debt/Bond issued (repaid) | 1,003 | (317) | (298) | 0 | 0 |
| Dividends paid | (884) | (849) | (708) | (1,439) | (1,768) |
| Other adjustments | (138) | (112) | (73) | 0 | 0 |
| Cash flow from financing | (19) | (1,278) | (1,079) | (1,439) | (1,768) |
| Beginning cash | 7,564 | 7,354 | 7,624 | 9,649 | 10,316 |
| Net change in cash | (210) | 270 | 2,025 | 667 | 1,298 |
| Ending cash | 7,354 | 7,624 | 9,649 | 10,316 | 11,613 |
Source: Compan reports, J.P. Morgan estimates.
Table 37: Quarterly inancial summary - Hiwin
| NT$mn, year-end Dec | 2026E - 1Q | 2026E - 2Q | 2026E - 3QE | 2026E - 4QE | 2027E - 1QE | 2027E - 2QE | 2027E - 3QE | 2027E - 4QE | 2028E - 1QE | 2028E - 2QE | 2028E - 3QE | 2028E - 4QE | 2025 | 2026E | 2027E | 2028E |
|---|---|---|---|---|---|---|---|---|---|---|---|---|---|---|---|---|
| Revenues | 6,379 | 7,508 | 8,110 | 8,049 | 7,776 | 8,826 | 9,291 | 9,179 | 8,548 | 9,397 | 9,691 | 9,412 | 24,263 | 30,046 | 35,072 | 37,048 |
| Cost of goods sold | (4,342) | (4,943) | (5,307) | (5,291) | (5,120) | (5,769) | (6,115) | (6,076) | (5,681) | (6,187) | (6,442) | (6,279) | (17,285) | (19,882) | (23,080) | (24,588) |
| Gross profit | 2,038 | 2,565 | 2,803 | 2,758 | 2,656 | 3,057 | 3,176 | 3,103 | 2,868 | 3,210 | 3,249 | 3,134 | 6,978 | 10,164 | 11,993 | 12,460 |
| SG&A expenses | (1,155) | (1,244) | (1,338) | (1,392) | (1,299) | (1,394) | (1,487) | (1,560) | (1,428) | (1,466) | (1,521) | (1,553) | (4,310) | (5,129) | (5,740) | (5,968) |
| R&D expenses | (252) | (288) | (324) | (338) | (311) | (353) | (372) | (367) | (342) | (376) | (388) | (376) | (1,025) | (1,202) | (1,403) | (1,482) |
| Operating profit | 631 | 1,034 | 1,141 | 1,028 | 1,047 | 1,309 | 1,318 | 1,175 | 1,098 | 1,368 | 1,339 | 1,204 | 1,643 | 3,833 | 4,850 | 5,010 |
| Profit before Tax | 719 | 1,080 | 1,157 | 1,042 | 1,063 | 1,329 | 1,339 | 1,192 | 1,117 | 1,391 | 1,365 | 1,225 | 1,764 | 3,998 | 4,923 | 5,098 |
| Income tax | (170) | (263) | (307) | (189) | (252) | (324) | (355) | (216) | (264) | (339) | (362) | (222) | (354) | (929) | (1,146) | (1,187) |
| Net income | 579 | 848 | 884 | 888 | 844 | 1,045 | 1,023 | 1,016 | 887 | 1,094 | 1,043 | 1,043 | 1,526 | 3,199 | 3,928 | 4,067 |
| EPS (basic, NT$) | 1.6 | 2.4 | 2.5 | 2.5 | 2.4 | 3.0 | 2.9 | 2.9 | 2.5 | 3.1 | 2.9 | 2.9 | 4.3 | 9.0 | 11.1 | 11.5 |
| Margins & Ratio | ||||||||||||||||
| Gross margin | 31.9% | 34.2% | 34.6% | 34.3% | 34.2% | 34.6% | 34.2% | 33.8% | 33.5% | 34.2% | 33.5% | 33.3% | 28.8% | 33.8% | 34.2% | 33.6% |
| Operating margin | 9.9% | 13.8% | 14.1% | 12.8% | 13.5% | 14.8% | 14.2% | 12.8% | 12.8% | 14.6% | 13.8% | 12.8% | 6.8% | 12.8% | 13.8% | 13.5% |
| Net margin | 9.1% | 11.3% | 10.9% | 11.0% | 10.9% | 11.8% | 11.0% | 11.1% | 10.4% | 11.6% | 10.8% | 11.1% | 6.3% | 10.6% | 11.2% | 11.0% |
| Cost to income ratio | 22.1% | 20.4% | 20.5% | 21.5% | 20.7% | 19.8% | 20.0% | 21.0% | 20.7% | 19.6% | 19.7% | 20.5% | 22.0% | 21.1% | 20.4% | 20.1% |
| YoY Growth (%) | ||||||||||||||||
| Revenues | 9% | 27% | 35% | 24% | 22% | 18% | 15% | 14% | 10% | 6% | 4% | 3% | -1% | 24% | 17% | 6% |
| Gross profit | 17% | 46% | 63% | 57% | 30% | 19% | 13% | 13% | 8% | 5% | 2% | 1% | -3% | 46% | 18% | 4% |
| Operating profit | 51% | 107% | 178% | 226% | 66% | 27% | 16% | 14% | 5% | 4% | 2% | 2% | -20% | 133% | 27% | 3% |
| Net income | 20% | 527% | 98% | 92% | 46% | 23% | 16% | 14% | 5% | 5% | 2% | 3% | -23% | 110% | 23% | 4% |
| EPS | 20% | 527% | 98% | 92% | 46% | 23% | 16% | 14% | 5% | 5% | 2% | 3% | -23% | 110% | 23% | 4% |
| QoQ Growth (%) | ||||||||||||||||
| Revenues | -2% | 18% | 8% | -1% | -3% | 13% | 5% | -1% | -7% | 10% | 3% | -3% | ||||
| Gross profit | 16% | 26% | 9% | -2% | -4% | 15% | 4% | -2% | -8% | 12% | 1% | -4% | ||||
| Operating profit | 100% | 64% | 10% | -10% | 2% | 25% | 1% | -11% | -7% | 25% | -2% | -10% | ||||
| Net income | 25% | 46% | 4% | 0% | -5% | 24% | -2% | -1% | -13% | 23% | -5% | 0% | ||||
| EPS | 25% | 46% | 4% | 0% | -5% | 24% | -2% | -1% | -13% | 23% | -5% | 0% |
Source: Compan reports, J.P. Morgan estimates.
Investment Thesis, Valuation an Risks
Hiwin(Neutral; Price Target: NT$310.00)
Investment Thesis
We rate Hiwin Neutral as the automation recovery and rising AI/semiconductor and robotics demand should support solid growth. However the stock trades at a premium to peers despite structurally lower profitability while it also faces greater margin downside in a cyclical downturn. With semiconductor and robotics contributions expected to ramp up gradually we see limited room for material earnings upgrades and further re-rating potential leaving a less compelling risk-reward profile than peers.
Valuation
Our Dec-27 PT of NT$310 is based on 27x 12M forward EPS reflecting limited downside from its discount to historical valuation and clear order visibility but also limited upside given its premium to peers relative to its weaker profitability.
Risks to Rating and Price Target
Key upside risks include a faster ramp-up in semiconductor equipment and robotics stronger-than-expected margin expansion and sustained order momentum; downside risks include a slowdown in the automation cycle intensifying competition rising raw material costs and adverse FX fluctuations.
Hiwin: Summary o Financials
| Income Statement | FY24A | FY25A | FY26E | FY27E | FY28E |
|---|---|---|---|---|---|
| Revenue | 24,392 | 24,263 | 30,046 | 35,072 | 37,048 |
| COGS | (17,174) | (17,285) | (19,882) | (23,080) | (24,588) |
| Gross pro it | 7,218 | 6,978 | 10,164 | 11,993 | 12,460 |
| SG&A | (4,196) | (4,310) | (5,129) | (5,740) | (5,968) |
| Adj. EBITDA | 4,393 | 4,001 | 6,345 | 7,380 | 7,562 |
| D&A | (2,334) | (2,358) | (2,513) | (2,531) | (2,552) |
| Adj. EBIT | 2,059 | 1,643 | 3,833 | 4,850 | 5,010 |
| Net Interest | (83) | (128) | (122) | (105) | (92) |
| Adj. PBT | 2,250 | 1,764 | 3,998 | 4,923 | 5,098 |
| Tax | (387) | (354) | (929) | (1,146) | (1,187) |
| Minorit Interest | 109 | 116 | 130 | 151 | 156 |
| Adj. Net Income | 1,972 | 1,526 | 3,199 | 3,928 | 4,067 |
| Reported EPS | 5.56 | 4.30 | 9.03 | 11.09 | 11.48 |
| Adj. EPS | 5.56 | 4.30 | 9.03 | 11.09 | 11.48 |
| DPS | 2.40 | 2.00 | 4.07 | 5.00 | 5.17 |
| Pa out ratio | 43.1% | 46.5% | 45.0% | 45.0% | 45.0% |
| Shares outstanding | 354 | 354 | 354 | 354 | 354 |
| Balance Sheet | FY24A | FY25A | FY26E | FY27E | FY28E |
| Cash and cash equivalents | 7,354 | 7,624 | 9,649 | 10,316 | 11,613 |
| Accounts receivable | 4,467 | 4,418 | 4,675 | 5,331 | 5,570 |
| Inventories | 7,407 | 7,094 | 7,885 | 9,189 | 9,702 |
| Other current assets | 755 | 727 | 765 | 765 | 765 |
| Current assets | 19,983 | 19,864 | 22,974 | 25,601 | 27,650 |
| PP&E | 29,367 | 29,836 | 29,845 | 30,114 | 30,362 |
| LT investments | 1,907 | 1,490 | 2,619 | 2,678 | 2,737 |
| Other non current assets | 3,160 | 2,986 | 2,899 | 2,899 | 2,899 |
| Total assets | 54,418 | 54,176 | 58,337 | 61,292 | 63,648 |
| Short term borrowings | 1,397 | 2,033 | 2,000 | 2,000 | 2,000 |
| Pa ables | 3,318 | 3,251 | 3,711 | 4,328 | 4,541 |
| Other short term liabilities | 3,607 | 3,246 | 4,318 | 4,318 | 4,318 |
| Current liabilities | 8,322 | 8,530 | 10,028 | 10,646 | 10,859 |
| Long-term debt | 7,563 | 6,712 | 6,601 | 6,601 | 6,601 |
| Other long term liabilities | 1,459 | 1,461 | 1,474 | 1,474 | 1,474 |
| Total liabilities | 17,343 | 16,702 | 18,104 | 18,721 | 18,934 |
| Shareholders' equit | 36,929 | 37,346 | 40,235 | 42,724 | 45,023 |
| Minorit interests | 145 | 128 | (2) | (153) | (309) |
| Total liabilities & equity | 54,418 | 54,176 | 58,337 | 61,292 | 63,648 |
| BVPS | 104.38 | 105.56 | 113.73 | 120.76 | 127.26 |
| y/y Growth | 5.5% | 1.1% | 7.7% | 6.2% | 5.4% |
| Net debt/(cash) | 1,606 | 1,121 | (1,048) | (1,715) | (3,012) |
| Cash Flow Statement | FY24A | FY25A | FY26E | FY27E | FY28E |
|---|---|---|---|---|---|
| Cash low rom operating activities | 3,619 | 4,277 | 5,612 | 4,906 | 5,865 |
| o/w Depreciation & amortization | 2,334 | 2,358 | 2,513 | 2,531 | 2,552 |
| o/w Changes in working capital | (248) | 702 | (95) | (1,343) | (538) |
| Cash low rom investing activities | (3,883) | (2,818) | (2,565) | (2,800) | (2,800) |
| o/w Capital expenditure | (3,714) | (2,766) | (2,477) | (2,800) | (2,800) |
| as % of sales | 15.2% | 11.4% | 8.2% | 8.0% | 7.6% |
| Cash low rom inancing activities | (19) | (1,278) | (1,079) | (1,439) | (1,768) |
| o/w Dividends paid | (884) | (849) | (708) | (1,439) | (1,768) |
| o/w Shares issued/(repurchased) | 0 | 0 | 0 | 0 | 0 |
| o/w Net debt issued/(repaid) | 1,003 | (317) | (298) | 0 | 0 |
| Net change in cash | (210) | 270 | 2,025 | 667 | 1,298 |
| Adj. Free cash low to irm | (96) | 1,511 | 3,134 | 2,106 | 3,065 |
| y/y Growth | (105.2% (1677.8% | 107.4% | (32.8% | 45.5% | |
| Ratio Analysis | FY24A | FY25A | FY26E | FY27E | FY28E |
| Gross margin | 29.6% | 28.8% | 33.8% | 34.2% | 33.6% |
| EBITDA margin | 18.0% | 16.5% | 21.1% | 21.0% | 20.4% |
| EBIT margin | 8.4% | 6.8% | 12.8% | 13.8% | 13.5% |
| Net profit margin | 8.1% | 6.3% | 10.6% | 11.2% | 11.0% |
| ROE | 5.5% | 4.1% | 8.2% | 9.5% | 9.3% |
| ROA | 3.7% | 2.8% | 5.7% | 6.6% | 6.5% |
| ROCE | 3.8% | 2.9% | 6.2% | 7.4% | 7.3% |
| SG&A/Sales | 17.2% | 17.8% | 17.1% | 16.4% | 16.1% |
| Net debt/Equit | 0.0 | 0.0 | NM | NM | NM |
| Net debt/EBITDA | 0.4 | 0.3 | NM | NM | NM |
| Sales/Assets (x) | 0.5 | 0.4 | 0.5 | 0.6 | 0.6 |
| Assets/Equit (x) | 1.5 | 1.5 | 1.5 | 1.4 | 1.4 |
| Interest cover (x) | 53.0 | 31.1 | 52.0 | 70.2 | 82.2 |
| Operating leverage | 2282.3%3815.2% | 559.0% | 158.6% | 58.6% | |
| Tax rate | 17.2% | 20.1% | 23.2% | 23.3% | 23.3% |
| Revenue / Growth | (1.0%) | (0.5%) | 23.8% | 16.7% | 5.6% |
| EBITDA / Growth | (11.7%) | (8.9%) | 58.6% | 16.3% | 2.5% |
| EPS / Growth | (3.0%) | (22.6%) | 109.8% | 22.8% | 3.5% |
| Valuation | FY24A | FY25A | FY26E | FY27E | FY28E |
| P/E (x) | 53.7 | 69.5 | 33.1 | 27.0 | 26.0 |
| P/BV (x) | 2.9 | 2.8 | 2.6 | 2.5 | 2.3 |
| EV/EBITDA (x) | 24.4 | 26.7 | 16.5 | 14.1 | 13.6 |
| Dividend Yield | 0.8% | 0.7% | 1.4% | 1.7% | 1.7% |
Source: Compan reports and J.P. Morgan estimates.
Note: NT$ in millions (except per-share data).Fiscal ear ends Dec. o/w - out of which
Initiation
Overweight
7750.TW, 7750 TT
Price (22 Oct 26):NT$1,810.00 Price Target (Dec-27):NT$2,580.00
Taiwan Industrial
Amanda Chang AC
(886-2) 2725-9861 aman a.chang@jpmorgan.com J.P. Morgan Securities (Taiwan) Limite
Style Exposure
| Quant - Factors | Current - %Rank | Hist %Rank (1=Top) - 6M | Hist %Rank (1=Top) - 1Y | Hist %Rank (1=Top) - 3Y 5Y |
|---|---|---|---|---|
| Value | 36 | 67 | 59 | 76 |
| Growth | 11 | 22 | 19 | 100 |
| Momentum | 36 | 17 | 11 | |
| Quality | 14 | 25 | 4 | 49 |
| Low Vol | 75 | 90 | 66 |
Syntec
A Rising Share Gainer from Controllers to Smart Factories
We initiate coverage on Syntec with an OW rating and a Dec-27 PT of NT$2 580. Syntec provides CNC controllers (48% of FY25 revenue) and servo products (47%) with over 90% of revenue from China. Following 104% YoY revenue growth in 9M26 we expect Syntec to sustain above-industry growth supported by continued share gains in China's CNC controller market product mix upgrades toward higher-value applications and expanding robotics/cloud opportunities. Despite outperforming TAIEX by 54% YTD valuation remains undemanding at 15x FY27E P/E given our EPS CAGR of 54% in FY25-28E. We forecast FY26/27E revenue growth of 106%/25% YoY with momentum likely to recover in 4Q26 after a seasonally softer 3Q26. This should support stronger revenue in 2H26 vs. 1H26 and drive FY26/27E EPS growth of 167%/27% YoY.
- Continued share gains in China's CNC controller market. Syntec is gaining share from global competitors including FANUC Mitsubishi and Siemens initially helped by shorter lead times during competitors' DRAM/component supply disruptions but increasingly supported by more sustainable competitive advantages. We forecast Syntec's market share in China to rise from c.20% in FY24 to over 25% in FY26E driven by price-performance advantage responsive local service open-platform flexibility and integrated control-and-servo solutions. While supply disruptions provide an entry point we believe customer familiarity with Syntec's workflow interface and ecosystem should increase switching costs over time especially when CNC acts as the core control system. Mgmt. targets 33% share by 2030E and expects controller revenue growth to outpace the industry by 10-15ppt annually.
- Product mix upgrades and rising turnkey adoption lift ASPs and content per machine. Syntec's product mix is shifting toward higher-value controller applications including multi-axis turning/milling and liquid cooling components for AI-related products. Rising turnkey adoption should also increase content per machine with c.90% of controllers sold together with servo products strengthening its integrated-solution positioning and deepening customer engagement. We forecast controller revenue growth of 97%/24% YoY and servo revenue growth of 116%/23% YoY in FY26/27E.
- Robotics and smart manufacturing as a second growth engine. Beyond controllers and servos Syntec is expanding into smart manufacturing via Leantec in robotics/cloud and Jumbo in smart factories. Its collaboration with Huayan Robotics (1021 HK NC) supports its CNC-cobot solutions with mgmt. targeting >10k cobot orders in FY2628E. While smart manufacturing was only 3% of FY25 revenue Syntec can leverage its controller/servo installed base to cross-sell robotics cloud and factory-automation solutions. Mgmt expects robotic-arm and cloud revenue to double in FY26E and we forecast smart manufacturing revenue to show a 56% CAGR in FY25-28E.
- OW rating with a Dec-27 PT of NT$2,580. Our Dec-27 PT of NT$2 580 is based on a P/E of 20x and 12M forward EPS of NT$129.0 implying 43% upside. We believe our target multiple is justified by Syntec's 54% FY25-28E EPS CAGR. Despite strong YTD performance the stock still trades at an attractive 15x FY27E P/E which in our view does not fully reflect its earnings growth potential mix upgrade and emerging smartmanufacturing opportunity. Key risks include: 1) share gains failing to materialize or persist after memory/component supply disruptions ease; 2) margin pressure from component cost inflation or supply constraints; 3) China revenue concentration and cyclicality; and 4) higher-than-expected opex.
— 7750.TW Price (NT$) — TSE (rebased)
| YTD | 1m | 3m | 12m | |
|---|---|---|---|---|
| Abs | 110.0% | -6.9% | -10.8% | 115.5% |
| Rel | 51.0% | -3.3% | -13.5% | 49.0% |
Company Data
| Shares O/S (mn) | 72 |
|---|---|
| 52-week range (NT$) | 3,070.00-698.00 |
| Market cap ($ mn) | 4,010 |
| Exchange rate | 32.43 |
| Free float (%) | 59.4% |
| 3M ADV (mn) | 0.28 |
| 3M ADV ($ mn) | 19.5 |
| Volatilit (90 Da ) | 69 |
| Index | TAIEX |
| BBG ANR (Bu | Hold | Sell) | 3|1|0 |
ey Metrics (FYE Dec)
| NT$ in millions | FY25A | FY26E | FY27E | FY28E |
|---|---|---|---|---|
| Financial Estimates | ||||
| Revenue | 13,960 | 28,781 | 35,883 | 38,807 |
| Adj. EBITDA | 3,026 | 8,463 | 11,065 | 11,971 |
| Adj. EBIT | 2,822 | 8,248 | 10,787 | 11,671 |
| Adj. net income | 2,283 | 6,536 | 8,315 | 9,008 |
| Adj. EPS | 33.83 | 91.09 | 115.87 | 125.52 |
| BBG EPS | 28.46 | 85.53 | 115.21 | - |
| Cashflow from operations | 2,768 | 3,511 | 4,968 | 7,911 |
| FCFF | 2,031 | 2,775 | 4,368 | 7,671 |
| Margins and Growth | ||||
| Revenue Growth Y/Y (%) | 29.2% | 106.2% | 24.7% | 8.1% |
| EBITDA margin | 21.7% | 29.4% | 30.8% | 30.8% |
| EBITDA Growth Y/Y (%) | 64.3% | 179.6% | 30.7% | 8.2% |
| EBIT margin | 20.2% | 28.7% | 30.1% | 30.1% |
| Net margin | 16.4% | 22.7% | 23.2% | 23.2% |
| Adj. EPS growth | 59.2% | 169.3% | 27.2% | 8.3% |
| Ratios | ||||
| Adj. tax rate | 23.3% | 23.5% | 23.4% | 23.4% |
| Interest cover | NM | NM | NM | NM |
| Net debt/Equit | NM | NM | NM | NM |
| Net debt/EBITDA | NM | NM | NM | NM |
| ROCE | 25.9% | 44.0% | 41.9% | 36.3% |
| ROE | 28.1% | 46.1% | 42.6% | 36.8% |
| Valuation | ||||
| FCFF ield | 1.7% | 2.1% | 3.4% | 5.9% |
| Dividend ield | 0.9% | 2.5% | 3.2% | 3.5% |
| EV/Revenue | 8.8 | 4.2 | 3.3 | 3.0 |
| EV/EBITDA | 40.5 | 14.3 | 10.8 | 9.7 |
| Adj. P/E | 53.5 | 19.9 | 15.6 | 14.4 |
Summary Investment Thesis and Valuation
Investment Thesis
We rate Syntec OW as we expect continued share gains in China's CNC controller market and product mix upgrades toward higher-value applications to support above-industry growth. Together with emerging robotics/cloud opportunities these drivers underpin our forecast of a 54% FY25-28E EPS CAGR while valuation remains undemanding at 15x FY27E P/ E despite strong performance YTD.
Valuation
Our Dec-27 PT of NT$2 580 is based on 20x 12M forward EPS. The target multiple is above Syntec's average forward P/E since listing on TWSE which we view as appropriate given its structurally higher growth and improving earnings trajectory vs. its own history.
Investment Thesis
1. Continued share gains in China's CNC controller market
We see continued market share gains in China's CNC controller market as a key growth driver for Syntec. The current DRAM and component shortages have created an opportunity for Syntec to win orders from global peers by offering much shorter lead times (c.30 days vs. >90 days for certain peers) supported by proactive component procurement since 4Q25. Based on our unit shipment estimates FANUC and Syntec each held c.20-25% market share in FY25 followed by Siemens and Mitsubishi Electric at c.10-15%. We forecast Syntec's share will rise from 23% in FY25 to 26.5% in FY26E with management targeting 33% by 2030E and expecting controller revenue growth to outpace the industry by 10-15ppt annually.
We believe Syntec can retain these gains beyond the current supply shortage supported by competitive price-performance (pricing c.20% below global peers) an open-platform architecture that allows customization/integration and strong local service coverage. Switching costs are also high once a CNC controller is qualified and integrated into a machine's core control system. Compared with local peers GSK is more focused on the lower end segment whereas Syntec is better positioned in mid-to-high-end applications; meanwhile HCNC's weaker service capabilities may also limit its ability to compete with Syntec.
Figure 70: China CNC industry shipments and YoY growth
Source: MIR databank, J.P. Morgan estimates.
Figure 71: Syntec's CNC market shares in China
Source: Compan data, J.P. Morgan estimates.
2. Product mix upgrades and rising turnkey adoption lift ASPs and content per machine
Syntec's revenue is closely linked to China's metal-cutting machine tools market (industry revenue +19% YoY in 8M26) but we see incremental upside from a mix upgrade that is allowing revenue to outgrow underlying unit volumes. Sales are shifting toward higher-value applications such as multi-axis turning/milling machines machining centers and five-axis systems where system specifications and value-added content are typically higher. Within these segments Syntec's share in turning/milling machines and machining centers is likely to be c.50% in our view supported by close customer engagement and fast product iteration that keeps pace with evolving application needs. AI-related solutions are also contributing with liquid-cooling applications rising from <5% of revenue in 1Q26 to c.8% in 1H26 supporting both ASP and margin mix.
At the same time rising turnkey adoption should structurally lift content per machine and deepen customer engagement. With c.90% of controllers sold alongside servos Syntec is increasingly selling an integrated control-and-servo package rather than a standalone controller which should improve solution attach rates over time. Moreover the company's VIP program provides an additional lever to accelerate this trend by deepening penetration within key accounts and pulling through higher value-added products and integrated solutions. These mix and content tailwinds underpin our forecasts of 97%/24% YoY controller revenue growth and 116%/23% YoY servo revenue growth in FY26/27E.
Figure 72: Cumulative revenue growth o China machine tools vs. Syntec
Source: CMTBA, Compan report.
Figure 73: Syntec's revenue growth by controller and servo products
Source: Compan data, J.P. Morgan estimates.
3. Robotics and smart manufacturing as a second growth engine
Syntec is expanding beyond CNC controllers into factory automation solutions through Leantec's robotic arms/cloud services and Jumbo's laser/automation system integration. This broader offering allows Syntec to address automation needs from individual machine tools to entire production lines creating cross-selling opportunities to capture more spending per customer. Management targets 2x growth in both robotic-arm and cloud revenue in FY26E with 1H26 robotic-arm sales on track to reach 1-1.2k units.
Moreover partnerships further extend Syntec's robotics offering. Its April 2026 MOU with Huayan Robotics (1021 HK NC) combines Huayan's robotic-arm manufacturing capabilities with Syntec's control technologies to develop CNC and cobot solutions (link) targeting over 10k cobot shipments in FY26-28E. Syntec also collaborates with Rokae Robotics Group (3752 HK NC) on industrial robots. While smart manufacturing accounted for only 3% of FY25 revenue we forecast a 56% CAGR in FY25-28E making it an additional growth contributor over time.
Table 38: Overview o Syntec's robotics solutions
| Solutions | Details |
|---|---|
| One machine, one robotic-arm | Leantec's robotic arms work directl with S ntec-controlled CNC machines on tasks such as material handling. The can also transmit equipment data to a central control platform, enabling centralized monitoring and management. |
| Pick-and-place machines | For equipment that is not suitable for direct robotic-arm integration, Leantec offers smart units, such as mobile/AMR-based solutions, to help pick-and-place and support the automation across different t pes of machines. |
| Robot cell to onsite factor integration | Leantec's robot-cell control platform connects machines, robots, material handling and warehouse s stems with MES/ERP s stems, while the S nFactor platform extends this integration to factor -wide IIoT data collection and equipment management. |
Source: Compan data, J.P. Morgan.
Figure 74: Operating results o Leantec and Jumbo in FY24-25
Source: Compan reports.
Figure 75: Syntec's smart manu acturing revenue and YoY growth
Source: Compan data, J.P. Morgan estimates.
4. Overseas expansion to diversify footprint and strengthen supply chain resilience
We view Syntec's overseas expansion as a strategic move to diversify its China-centric business and build an additional growth curve. Malaysia's SIST is central to this strategy serving as the company's overseas operations hub and the group's third manufacturing base with completion targeted in 1Q27. Initial operations will focus on assembly of CNC controllers while it has already secured a Certificate of Origin (COO) for shipments to India which should lower the company's tariff burden and enhance supply flexibility.
India represents a meaningful long-term growth opportunity. Despite being the world's fifth-largest machine tools consumption market in 2025 India has limited domestic CNC controller supply and over 90% of the market is dominated by FANUC Siemens and Mitsubishi. Geopolitical friction also creates additional barriers for Chinese suppliers giving Syntec an opportunity to compete through its 'Taiwan-Malaysia-India' supply chain. By leveraging its fully direct sales model for deeper customer engagement and cost-performance advantages the company has secured orders from major Indian machine tool OEMs and is targeting at least 10% market share by 2030E. While China remains the major earnings contributor in the near-term we expect overseas expansion to gradually become more meaningful supporting business growth while diversifying Syntec's geographic and supply chain exposure.
Figure 76: Total consumption o machine tools in India
Source: The Indian Machine Tool Manufacturers Association (IMTMA).
Figure 77: Indian machine tool industry continued its upward trend, with production in FY2025-26 increasing by 19%
Source: IMTMA.
Investment Risks
1. Share-gain sustainability risk
A key downside risk is that Syntec's recent share gains prove less durable once DRAM/ component supply disruptions ease and global competitors normalize lead times and product availability. In that scenario customers that adopted Syntec mainly for delivery certainty could revert to FANUC/Mitsubishi/Siemens slowing controller/servo growth reducing operating leverage and potentially compressing margins if competition intensifies through pricing or channel incentives. However we believe Syntec's competitive pricing platform flexibility and local support should help sustain retention as supply conditions normalize. We would monitor for evidence of deeper account penetration including repeat orders broader model qualification and a rising controllerservo attach rate which would signal Syntec is becoming embedded in customers' production workflows rather than winning one-off substitution orders.
2. Component cost inflation and supply constraints
Syntec's CNC controllers use DRAM ICs and other electronic components leaving margins exposed to rising component costs amid broader supply constraints. This was evident in 2Q26 when gross margin declined to 44.1% (-4.7ppt QoQ) as the company turned to spot-market purchases to secure component supply. Over the longer-term management is building a dual-source strategy and maintaining safety stock to strengthen supply resilience while signing supply contracts to ensure component availability and improve cost visibility. We therefore view the margin pressure to remain manageable with gross margin broadly maintained within the company's 45%±2% target range.
3. China revenue concentration and cyclicality
Syntec derives over 90% of its revenue from China leaving its earnings highly sensitive to Chinese industrial capex and machine tools demand. The concentration risk for example is evident in end-markets such as woodworking equipment where demand is closely related to the China property cycle leading to a sales trough before the recent recovery. To diversify its revenue base management is expanding its overseas footprint across countries such as Turkey Malaysia and India. Turkey has delivered a relatively stable performance as a base serving Europe while Malaysia has remained resilient and could provide incremental capacity to support India following the completion of its new facility in 1Q27. In India Syntec is leveraging its 100% direct-sales model and competitive pricing to win orders from leading machine tool customers. We see the overseas expansion as a way to gradually reduce China concentration and earnings volatility over time.
4. igher-than-expected opex
FY26 marks the first year of Syntec's new five-year plan with continued R&D investment in AI and smart-factory/automation features along with overseas expansion potentially driving higher-than-expected opex growth. The opex growth in 1H26 has reached 30% YoY above the 14-27% YoY in FY23-25 highlighting the upfront investment required to support the company's new growth initiatives. Nevertheless we believe this risk is manageable given the solid revenue outlook with top-line growth already reaching 104% YoY in 9M26 and cost-income ratio down to 18% in 1H26 (vs. 26-31% in FY23-25). We forecast a cost-income ratio of 17%/16% in FY26/27E respectively as the revenue growth should continue to outpace opex growth and support favorable operating leverage as the business scales.
J PMORGAN
Company Background
Company Overview
Founded in 1995 Syntec was listed on the Emerging Board in Jun 2024 and transferred to the TWSE in Sep 2025. The company provides industrial automation and smart manufacturing solutions specializing in CNC controllers (48% of FY25 revenues) and servo products (47%). Syntec generates c.95% of its revenues from China supported by 24 local branch offices while it continues to expand overseas in countries such as Malaysia and India etc. Its manufacturing bases are mainly located in Taiwan (Hsinchu) China (Suzhou) and Malaysia with Suzhou equipped with the largest production capacity.
Syntec also operates two wholly owned Taiwan subsidiaries that support its smart automation roadmap: 1) Leantec, focused on robotics (e.g. robotic arms) automation and cloud solutions; and 2) Jumbo which operates in laser applications (e.g. engraving welding cutting) and is expanding into semiconductor-related services such as wafer film removal. Jumbo also serves as a system integrator for smart factory implementations for EMS customers.
Figure 78: Revenue breakdown by product - Syntec
Source: Compan reports.
Table 39: Global manu acturing bases and sales branches - Syntec
| Location | Note |
|---|---|
| China | Suzhou (2 factories); 24 branch offices |
| Taiwan | Hsinchu (headquarter and factories); Taichung (Leantech); Tainan (Jumbo) |
| Malaysia | Machinery and equipment sales; manufacturing (new factory in 1Q27) |
| India | Machinery and equipment sales; new office planned for 2027 |
| Thailand / Vietnam / Turkey / U.S. | Machinery and equipment sales |
Figure 79: Revenue breakdown by region - Syntec
Source: Compan reports.
Figure 80: Organization chart - Syntec
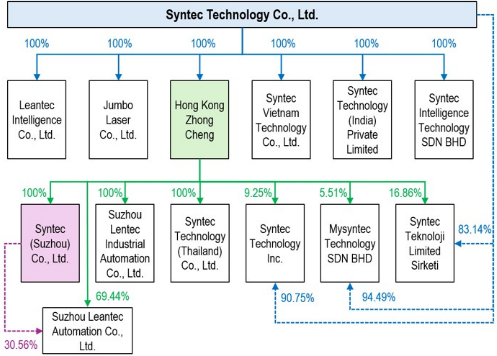
Source: Compan reports, J.P. Morgan. Note : data as of Dec 31, 2025.
Table 40: Major shareholder list - Syntec
| Shareholder | Holding % |
|---|---|
| Tsai, You-Kung | 9.08 |
| Huang, Wei-Sheng | 5.72 |
| RealHunt Ltd. | 5.00 |
| Songbao Engineering Consulting Co., Ltd. | 4.31 |
| Chen, Heng-Jen | 4.10 |
| Tsai, Pei-Hsin | 3.99 |
| Tsai, Chang-Wei | 3.93 |
| Huang, Fang-Chih | 3.91 |
| RealCrown Ltd. | 3.25 |
| Tsai, Hui-Chen | 3.08 |
Source: Compan reports. Note: data as of April 6, 2026.
Figure 81: QFII holding - Syntec
Source: TEJ.
Controller & Servo Overview
Controllers and servo systems are key components of automated machinery working together to control how a machine moves and operates. Syntec's two core product lines are: (1) Controllers, which act as the 'brain' of the machine by interpreting instructions and coordinating its movements; and (2) Servos, which mainly include servo motors drives and encoders acting as the 'muscle' by controlling the speed position and force of each movement. Syntec's solutions are mainly used in machine tools with growing applications in semiconductor equipment electronics robotics and other industrial automation.
Figure 82: Controller and servo products - Syntec
Figure 83: Group product line overview - Syntec
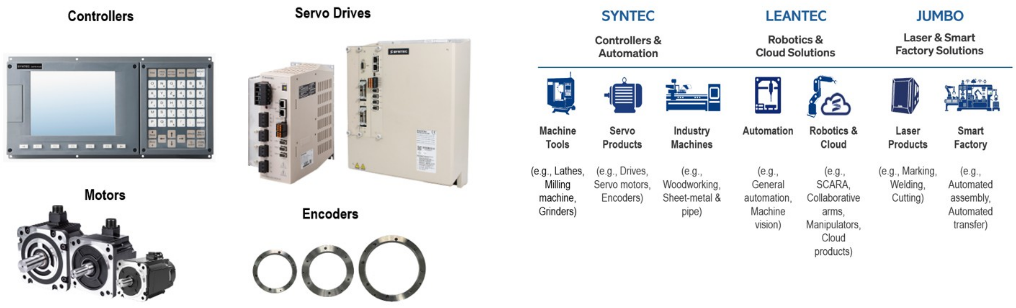
Source: Compan data.
Source: Compan data, J.P. Morgan.
Financial Analysis
Revenue & Profitability
- We forecast revenue to increase from NT$14bn in FY25 to NT$38.8bn in FY28E representing a 41% CAGR.
- We forecast gross margin to remain relatively stable at 45.7% in FY26E vs. 45.8% in FY25 before slightly declining to 45.6% in FY28E.
- We estimate opex to increase from NT$3.6bn in FY25 to NT$6.0bn in FY28E while the cost-income ratio improves from 25.5% to 15.5% under decent revenue growth and better operating leverage.
- We project EPS of NT$93.6/119.1/129.0 in FY26/27/28E up 167%/27%/8% YoY respectively with ROE registering at 37-46% over FY26-28E.
Balance Sheet & Cash Flow
- We expect the company to maintain a net cash position throughout the forecast period with operating cash flow remaining positive and sustainable.
- We forecast capex of NT$0.7bn in FY26E normalizing to NT$0.2bn in FY28E (representing 1-3% of revenues) as most new plants/offices in Suzhou Malaysia and India are gradually completed.
- We also expect Syntec's dividend payout ratio to stay at 50% in FY26E implying a cash DPS of NT$45.5.
J PMORGAN
Table 41: Income statement summary - Syntec
| Income statement (NT$m) | 2024 | 2025 | 2026E | 2027E | 2028E |
|---|---|---|---|---|---|
| Revenues | 10,808 | 13,960 | 28,781 | 35,883 | 38,807 |
| Cost of goods sold | (6,068) | (7,573) | (15,618) | (19,418) | (21,128) |
| Gross profit | 4,739 | 6,387 | 13,163 | 16,464 | 17,679 |
| SG&A expenses | (1,818) | (2,091) | (2,801) | (3,318) | (3,558) |
| R&D expenses | (1,275) | (1,474) | (2,114) | (2,360) | (2,450) |
| Operating profit | 1,646 | 2,822 | 8,248 | 10,787 | 11,671 |
| EBITDA | 1,842 | 3,026 | 8,463 | 11,065 | 11,971 |
| Non-operating income / loss | 119 | 154 | 291 | 73 | 92 |
| Profit before Tax | 1,764 | 2,976 | 8,539 | 10,859 | 11,763 |
| Income tax | (392) | (693) | (2,003) | (2,545) | (2,756) |
| Minority interest | 0 | 0 | 0 | 0 | 0 |
| Attributable Net Income | 1,373 | 2,283 | 6,536 | 8,315 | 9,008 |
| EPS (basic, NT$) | 22.3 | 35.1 | 93.6 | 119.1 | 129.0 |
| DPS (cash only, NT$) | 11.0 | 16.0 | 45.5 | 57.9 | 62.7 |
Source: Compan reports, J.P. Morgan estimates.
Table 42: Balance sheet summary - Syntec
| Balance Sheet (NT$m) | 2024 | 2025 | 2026E | 2027E | 2028E |
|---|---|---|---|---|---|
| Cash and cash equivalents | 1,873 | 7,707 | 9,474 | 10,573 | 14,087 |
| Marketable Securities | 0 | 0 | 0 | 0 | 0 |
| Accounts/Notes receivable | 4,405 | 5,945 | 11,444 | 15,223 | 16,084 |
| Inventories | 1,311 | 1,369 | 2,663 | 3,452 | 4,019 |
| Total current assets | 7,677 | 15,136 | 24,094 | 29,762 | 34,704 |
| LT investments | 158 | 288 | 461 | 468 | 476 |
| Net fixed assets | 983 | 1,602 | 2,195 | 2,517 | 2,457 |
| Goodwill | 0 | 0 | 0 | 0 | 0 |
| Total assets | 9,432 | 17,660 | 27,431 | 33,428 | 38,319 |
| Short-term debts | 10 | 26 | 54 | 54 | 54 |
| Accounts/Notes payable | 2,019 | 3,059 | 6,120 | 7,071 | 7,111 |
| CPLTD | 71 | 25 | 32 | 32 | 32 |
| Total current liabilities | 3,394 | 4,974 | 8,749 | 9,699 | 9,739 |
| LT Debt & ECB | 264 | 127 | 108 | 108 | 108 |
| Total liabilities | 4,529 | 6,287 | 10,419 | 11,370 | 11,410 |
| Common stocks | 655 | 718 | 718 | 718 | 718 |
| Reserves | 1,372 | 6,270 | 6,497 | 6,497 | 6,497 |
| Retained earnings | 2,968 | 4,395 | 9,555 | 14,601 | 19,451 |
| Total equity | 4,903 | 11,373 | 17,012 | 22,058 | 26,909 |
Source: Compan reports, J.P. Morgan estimates.
Table 43: Cash low statement summary - Syntec
| Cash Flow Statement (NT$m) | 2024 | 2025 | 2026E | 2027E | 2028E |
|---|---|---|---|---|---|
| Net Income | 1,373 | 2,283 | 6,536 | 8,315 | 9,008 |
| Depreciation & amortization | 196 | 204 | 214 | 278 | 299 |
| Change in receivables | (1,048) | (1,553) | (5,542) | (3,779) | (862) |
| Change in inventories | (53) | (58) | (1,294) | (789) | (567) |
| Change in payables | 712 | 1,487 | 3,297 | 950 | 40 |
| Other adjustments | 214 | 404 | 299 | (7) | (8) |
| Cash flow from operations | 1,394 | 2,768 | 3,511 | 4,968 | 7,911 |
| Purchase/Sale of investments | 7 | 4 | 3 | 0 | 0 |
| CAPEX | (172) | (737) | (735) | (600) | (240) |
| Other adjustments | (40) | (110) | (92) | 0 | 0 |
| Cash flow from investing | (205) | (843) | (825) | (600) | (240) |
| Free cash flow | 1,222 | 2,031 | 2,775 | 4,368 | 7,671 |
| Equity raised (buyback) | 525 | 4,791 | 0 | 0 | 0 |
| Debt/Bond issued (repaid) | (669) | (165) | 15 | 0 | 0 |
| Dividends paid | (360) | (720) | (1,148) | (3,268) | (4,157) |
| Other adjustments | 113 | (62) | (29) | 0 | 0 |
| Cash flow from financing | (391) | 3,843 | (1,162) | (3,268) | (4,157) |
| Beginning cash | 982 | 1,873 | 7,707 | 9,474 | 10,573 |
| Net change in cash | 891 | 5,834 | 1,767 | 1,099 | 3,513 |
| Ending cash | 1,873 | 7,707 | 9,474 | 10,573 | 14,087 |
Source: Compan reports, J.P. Morgan estimates.
Table 44: Quarterly inancial summary - Syntec
| NT$mn, year-end Dec | 2026E - 1Q | 2026E - 2Q | 2026E - 3QE | 2026E - 4QE | 2027E - 1QE | 2027E - 2QE | 2027E - 3QE | 2027E - 4QE | 2028E - 1QE | 2028E - 2QE | 2028E - 3QE | 2028E - 4QE | 2025 | 2026E | 2027E | 2028E |
|---|---|---|---|---|---|---|---|---|---|---|---|---|---|---|---|---|
| Revenues | 4,865 | 8,260 | 7,805 | 7,851 | 7,390 | 10,497 | 8,609 | 9,386 | 7,867 | 11,186 | 9,418 | 10,336 | 13,960 | 28,781 | 35,883 | 38,807 |
| Cost of goods sold | (2,492) | (4,618) | (4,245) | (4,263) | (4,007) | (5,640) | (4,691) | (5,080) | (4,287) | (6,041) | (5,158) | (5,642) | (7,573) | (15,618) | (19,418) | (21,128) |
| Gross profit | 2,372 | 3,642 | 3,561 | 3,588 | 3,383 | 4,857 | 3,919 | 4,305 | 3,580 | 5,145 | 4,261 | 4,694 | 6,387 | 13,163 | 16,464 | 17,679 |
| SG&A expenses | (624) | (729) | (734) | (714) | (665) | (945) | (835) | (873) | (708) | (984) | (904) | (961) | (2,091) | (2,801) | (3,318) | (3,558) |
| R&D expenses | (495) | (524) | (546) | (550) | (517) | (630) | (603) | (610) | (527) | (649) | (640) | (634) | (1,474) | (2,114) | (2,360) | (2,450) |
| Operating profit | 1,254 | 2,389 | 2,281 | 2,324 | 2,201 | 3,282 | 2,481 | 2,822 | 2,345 | 3,511 | 2,716 | 3,099 | 2,822 | 8,248 | 10,787 | 11,671 |
| Profit before Tax | 1,395 | 2,513 | 2,295 | 2,337 | 2,220 | 3,304 | 2,497 | 2,839 | 2,366 | 3,538 | 2,737 | 3,122 | 2,976 | 8,539 | 10,859 | 11,763 |
| Income tax | (321) | (618) | (562) | (502) | (510) | (812) | (612) | (610) | (544) | (870) | (670) | (671) | (693) | (2,003) | (2,545) | (2,756) |
| Net income | 1,074 | 1,895 | 1,732 | 1,834 | 1,709 | 2,492 | 1,885 | 2,229 | 1,822 | 2,668 | 2,066 | 2,451 | 2,283 | 6,536 | 8,315 | 9,008 |
| EPS (basic, NT$) | 15.4 | 27.1 | 24.8 | 26.3 | 24.5 | 35.7 | 27.0 | 31.9 | 26.1 | 38.2 | 29.6 | 35.1 | 35.1 | 93.6 | 119.1 | 129.0 |
| Margins & Ratio | ||||||||||||||||
| Gross margin | 48.8% | 44.1% | 45.6% | 45.7% | 45.8% | 46.3% | 45.5% | 45.9% | 45.5% | 46.0% | 45.2% | 45.4% | 45.8% | 45.7% | 45.9% | 45.6% |
| Operating margin | 25.8% | 28.9% | 29.2% | 29.6% | 29.8% | 31.3% | 28.8% | 30.1% | 29.8% | 31.4% | 28.8% | 30.0% | 20.2% | 28.7% | 30.1% | 30.1% |
| Net margin | 22.1% | 22.9% | 22.2% | 23.4% | 23.1% | 23.7% | 21.9% | 23.7% | 23.2% | 23.9% | 21.9% | 23.7% | 16.4% | 22.7% | 23.2% | 23.2% |
| Cost to income ratio | 23.0% | 15.2% | 16.4% | 16.1% | 16.0% | 15.0% | 16.7% | 15.8% | 15.7% | 14.6% | 16.4% | 15.4% | 25.5% | 17.1% | 15.8% | 15.5% |
| YoY Growth (%) | ||||||||||||||||
| Revenues | 49% | 107% | 158% | 112% | 52% | 27% | 10% | 20% | 6% | 7% | 9% | 10% | 29% | 106% | 25% | 8% |
| Gross profit | 63% | 92% | 164% | 112% | 43% | 33% | 10% | 20% | 6% | 6% | 9% | 9% | 35% | 106% | 25% | 7% |
| Operating profit | 121% | 152% | 440% | 163% | 75% | 37% | 9% | 21% | 7% | 7% | 9% | 10% | 71% | 192% | 31% | 8% |
| Net income | 123% | 217% | 375% | 119% | 59% | 31% | 9% | 21% | 7% | 7% | 10% | 10% | 66% | 186% | 27% | 8% |
| EPS | 100% | 185% | 339% | 104% | 59% | 31% | 9% | 21% | 7% | 7% | 10% | 10% | 57% | 167% | 27% | 8% |
| QoQ Growth (%) | ||||||||||||||||
| Revenues | 32% | 70% | -6% | 1% | -6% | 42% | -18% | 9% | -16% | 42% | -16% | 10% | ||||
| Gross profit | 40% | 54% | -2% | 1% | -6% | 44% | -19% | 10% | -17% | 44% | -17% | 10% | ||||
| Operating profit | 42% | 91% | -5% | 2% | -5% | 49% | -24% | 14% | -17% | 50% | -23% | 14% | ||||
| Net income | 28% | 76% | -9% | 6% | -7% | 46% | -24% | 18% | -18% | 46% | -23% | 19% | ||||
| EPS | 19% | 76% | -9% | 6% | -7% | 46% | -24% | 18% | -18% | 46% | -23% | 19% |
Source: Compan reports, J.P. Morgan estimates.
Investment Thesis, Valuation an Risks
Syntec(Overweight; Price Target: NT$2,580.00)
Investment Thesis
We rate Syntec OW as we expect continued share gains in China's CNC controller market and product mix upgrades toward higher-value applications to support above-industry growth. Together with emerging robotics/cloud opportunities these drivers underpin our forecast of a 54% FY25-28E EPS CAGR while valuation remains undemanding at 15x FY27E P/E despite strong performance YTD.
Valuation
Our Dec-27 PT of NT$2 580 is based on 20x 12M forward EPS. The target multiple is above Syntec's average forward P/E since listing on TWSE which we view as appropriate given its structurally higher growth and improving earnings trajectory vs. its own history.
Risks to Rating and Price Target
Key risks include: 1) share gains failing to materialize or persist after memory/component supply disruptions ease; 2) margin pressure from component cost inflation or supply constraints; 3) China revenue concentration and cyclicality; and 4) higher-than-expected opex.
Syntec: Summary o Financials
| Income Statement | FY24A | FY25A | FY26E | FY27E | FY28E |
|---|---|---|---|---|---|
| Revenue | 10,808 | 13,960 | 28,781 | 35,883 | 38,807 |
| COGS | (6,068) | (7,573) | (15,618) | (19,418) | (21,128) |
| Gross pro it | 4,739 | 6,387 | 13,163 | 16,464 | 17,679 |
| SG&A | (1,818) | (2,091) | (2,801) | (3,318) | (3,558) |
| Adj. EBITDA | 1,842 | 3,026 | 8,463 | 11,065 | 11,971 |
| D&A | (196) | (204) | (214) | (278) | (299) |
| Adj. EBIT | 1,646 | 2,822 | 8,248 | 10,787 | 11,671 |
| Net Interest | (9) | 16 | 67 | 65 | 84 |
| Adj. PBT | 1,764 | 2,976 | 8,539 | 10,859 | 11,763 |
| Tax | (392) | (693) | (2,003) | (2,545) | (2,756) |
| Minorit Interest | 0 | 0 | 0 | 0 | 0 |
| Adj. Net Income | 1,373 | 2,283 | 6,536 | 8,315 | 9,008 |
| Reported EPS | 21.25 | 33.83 | 91.09 | 115.87 | 125.52 |
| Adj. EPS | 21.25 | 33.83 | 91.09 | 115.87 | 125.52 |
| DPS | 10.99 | 15.98 | 45.49 | 57.87 | 62.69 |
| Pa out ratio | 51.7% | 47.2% | 49.9% | 49.9% | 49.9% |
| Shares outstanding | 65 | 67 | 72 | 72 | 72 |
| Balance Sheet | FY24A | FY25A | FY26E | FY27E | FY28E |
| Cash and cash equivalents | 1,873 | 7,707 | 9,474 | 10,573 | 14,087 |
| Accounts receivable | 4,405 | 5,945 | 11,444 | 15,223 | 16,084 |
| Inventories | 1,311 | 1,369 | 2,663 | 3,452 | 4,019 |
| Other current assets | 5,804 | 7,428 | 14,620 | 19,188 | 20,617 |
| Current assets | 7,677 | 15,136 | 24,094 | 29,762 | 34,704 |
| PP&E | 983 | 1,602 | 2,195 | 2,517 | 2,457 |
| LT investments | 158 | 288 | 461 | 468 | 476 |
| Other non current assets | 753 | 901 | 1,120 | 1,128 | 1,135 |
| Total assets | 9,432 | 17,660 | 27,431 | 33,428 | 38,319 |
| Short term borrowings | 10 | 26 | 54 | 54 | 54 |
| Pa ables | 2,019 | 3,059 | 6,120 | 7,071 | 7,111 |
| Other short term liabilities | 1,366 | 1,889 | 2,574 | 2,574 | 2,574 |
| Current liabilities | 3,394 | 4,974 | 8,749 | 9,699 | 9,739 |
| Long-term debt | 264 | 127 | 108 | 108 | 108 |
| Other long term liabilities | 1,059 | 1,248 | 1,608 | 1,608 | 1,608 |
| Total liabilities | 4,529 | 6,287 | 10,419 | 11,370 | 11,410 |
| Shareholders' equit | 4,903 | 11,373 | 17,012 | 22,058 | 26,909 |
| Minorit interests | 0 | 0 | 0 | 0 | 0 |
| Total liabilities & equity | 9,432 | 17,660 | 27,431 | 33,428 | 38,319 |
| BVPS | 74.83 | 158.30 | 236.80 | 307.04 | 374.55 |
| y/y Growth | 44.5% | 111.6% | 49.6% | 29.7% | 22.0% |
| Net debt/(cash) | (1,600) | (7,554) | (9,312) | (10,411) | (13,925) |
| Cash Flow Statement | FY24A | FY25A | FY26E | FY27E | FY28E |
|---|---|---|---|---|---|
| Cash low rom operating activities | 1,394 | 2,768 | 3,511 | 4,968 | 7,911 |
| o/w Depreciation & amortization | 196 | 204 | 214 | 278 | 299 |
| o/w Changes in working capital | (397) | (128) | (3,786) | (3,618) | (1,389) |
| Cash low rom investing activities | (205) | (843) | (825) | (600) | (240) |
| o/w Capital expenditure | (172) | (737) | (735) | (600) | (240) |
| as % of sales | 1.6% | 5.3% | 2.6% | 1.7% | 0.6% |
| Cash low rom inancing activities | (391) | 3,843 | (1,162) | (3,268) | (4,157) |
| o/w Dividends paid | (360) | (720) | (1,148) | (3,268) | (4,157) |
| o/w Shares issued/(repurchased) | 525 | 4,791 | 0 | 0 | 0 |
| o/w Net debt issued/(repaid) | (669) | (165) | 15 | 0 | 0 |
| Net change in cash | 891 | 5,834 | 1,767 | 1,099 | 3,513 |
| Adj. Free cash low to irm | 1,222 | 2,031 | 2,775 | 4,368 | 7,671 |
| y/y Growth | 12.3% | 66.2% | 36.7% | 57.4% | 75.6% |
| Ratio Analysis | FY24A | FY25A | FY26E | FY27E | FY28E |
| Gross margin | 43.9% | 45.8% | 45.7% | 45.9% | 45.6% |
| EBITDA margin | 17.0% | 21.7% | 29.4% | 30.8% | 30.8% |
| EBIT margin | 15.2% | 20.2% | 28.7% | 30.1% | 30.1% |
| Net profit margin | 12.7% | 16.4% | 22.7% | 23.2% | 23.2% |
| ROE | 34.3% | 28.1% | 46.1% | 42.6% | 36.8% |
| ROA | 16.4% | 16.9% | 29.0% | 27.3% | 25.1% |
| ROCE | 27.8% | 25.9% | 44.0% | 41.9% | 36.3% |
| SG&A/Sales | 16.8% | 15.0% | 9.7% | 9.2% | 9.2% |
| Net debt/Equit | NM | NM | NM | NM | NM |
| Net debt/EBITDA | NM | NM | NM | NM | NM |
| Sales/Assets (x) | 1.3 | 1.0 | 1.3 | 1.2 | 1.1 |
| Assets/Equit (x) | 2.1 | 1.7 | 1.6 | 1.6 | 1.5 |
| Interest cover (x) | 209.1 | NM | NM | NM | NM |
| Operating leverage | 288.7% | 245.0% | 181.1% | 124.7% | 100.7% |
| Tax rate | 22.2% | 23.3% | 23.5% | 23.4% | 23.4% |
| Revenue / Growth | 37.3% | 29.2% | 106.2% | 24.7% | 8.1% |
| EBITDA / Growth | 86.3% | 64.3% | 179.6% | 30.7% | 8.2% |
| EPS / Growth | 104.3% | 59.2% | 169.3% | 27.2% | 8.3% |
| Valuation | FY24A | FY25A | FY26E | FY27E | FY28E |
| P/E (x) | 85.2 | 53.5 | 19.9 | 15.6 | 14.4 |
| P/BV (x) | 24.2 | 11.4 | 7.6 | 5.9 | 4.8 |
| EV/EBITDA (x) | 69.7 | 40.5 | 14.3 | 10.8 | 9.7 |
| Dividend Yield | 0.6% | 0.9% | 2.5% | 3.2% | 3.5% |
Source: Compan reports and J.P. Morgan estimates.
Note: NT$ in millions (except per-share data).Fiscal ear ends Dec. o/w - out of which
Analyst Certification: The Research Analyst(s) denoted by an 'AC' on the cover of this report certifies (or where multiple Research Analysts are primarily responsible for this report the Research Analyst denoted by an 'AC' on the cover or within the document individually certifies with respect to each security or issuer that the Research Analyst covers in this research) that: (1) all of the views expressed in this report accurately reflect the Research Analyst's personal views about any and all of the subject securities or issuers; and (2) no part of any of the Research Analyst's compensation was is or will be directly or indirectly related to the specific recommendations or views expressed by the Research Analyst(s) in this report. For all Korea-based Research Analysts listed on the front cover if applicable they also certify as per KOFIA requirements that the Research Analyst's analysis was made in good faith and that the views reflect the Research Analyst's own opinion without undue influence or intervention.
All authors named within this report are Research Analysts who produce independent research unless otherwise specified. In Europe Sector Specialists (Sales and Trading) may be shown on this report as contacts but are not authors of the report or part of the Research Department.