PDF 原檔:報告_GS_金像電2368_20260811_original.pdf
圖片清單(已驗證 2026-08-13)
| 檔名 | size | 分類 | 親眼所見內容 |
|---|---|---|---|
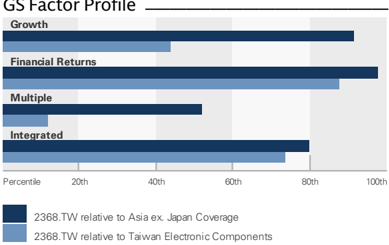
260811_gs_GCE_001.png |
22KB | 真資料圖 | GS Factor Profile:Growth/Financial Returns/Multiple/Integrated 四象限百分位排名(相對 Asia ex. Japan/台灣電子零組件) |
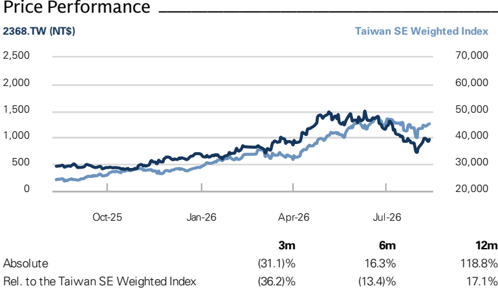
260811_gs_GCE_002.png |
42KB | 真資料圖 | Price Performance:GCE 股價 vs Taiwan SE Weighted Index,含 3m/6m/12m 絕對與相對報酬 |
260811_gs_GCE_003.png |
85KB | 真資料圖 | Goldman Sachs 評等與目標價沿革圖(2023-2026),標示歷次目標價數字(160→1,810)與 Rating 變動點 |
圖片清單已於 2026-08-13 逐張 Read 驗證,本份報告 3 張候選圖全數為真資料圖,無裝飾/文字卡。
原始內容
For the exclusive use of KEVINLU@LENOVO.COM
GCE (2368.TW)
Better pricing outlook and fast yield rate ramp up progress point to solid 2H26 earnings; improving HDI yield rate suggests P/E re-rating opportunity; Buy with new TP at NT$1,800
2368.TW
12m Pri c e Target:
NT$1,800.00
Pri c e:
NT$964.00
Upside:
86.7%
GCE's 2Q26 core business (OPI) was 6%/2% lower than GSe/BBG consensus, mainly due to the less favorable than expected GM (was 2.2%/1.4ppt below GSe/BBG consensus) resulting from the mismatch on component cost hike vs. GCE's product pricing hike and the increasing ramp up cost in its new Thailand plant (the cost-pricing mismatch and high ramping up cost will both be solved in 3Q26) . However, the company's net income was 3/8% higher than GSe/BBG consensus, thanks to the more favorable tax rate (24% vs. GSe/BBG consensus at 32%/32%) driven mainly by its increasing earnings contribution from its new Thailand plant (Thailand plant tax rate is signi fi cantly lower than Taiwan and mainland China plants).
For 3Q26, we expect the company's revenue to grow by 26% QoQ (in-line with 2Q revenue growth) with (1) the 12% more capacity value in 3Q vs. 2Q, (2) the increasing contribution from high ASP ASIC products, and (3) the much better pricing in 3Q vs. 2Q (we expect the company's overall product pricing to go up by 10-15%+ in 3Q). In terms of GM/OPM, we expect the company's GM/OPM to increase to 37.9%/30.3% (up 3.2ppt/3.9ppt QoQ) thanks to the much better product mix and pricing condition for its PCB products.
Investment view - GCE continues to be the most competitive AI ASIC PCB supplier, with easing yield rate risk on ASIC HDI
We continue to expect GCE will hold the major share for Trainium 3 (70%+ from 3Q26) with its smooth ramp up in its new Thailand capacity, which we believe will start to gain share in the TPU supply chain from the end of 2026 and should see signi fi cant improvement on the market share (<5% in 2026 to 20-30%+ in 2027), leading to a fast capacity expansion speed in coming years (we believe capacity volume will grow by ~30% 2025-28E CAGR vs. 7% 2021-25 CAGR). Based on our calculation, GCE could hold 15-17% of global AI PCB
BUY
Chao Wang
+886(2)2730-4195 | kuan-chao.wang@gs.com Goldman Sachs (Asia) L.L.C., Taipei Branch
Allen Chang
+852-2978-2930 | allen.k.chang@gs.com Goldman Sachs (Asia) L.L.C.
Al Wang
+886(2)2730-4081 | al.wang@gs.com Goldman Sachs (Asia) L.L.C., Taipei Branch
Key Data _____________________________________
Market cap: NT$521.3bn / $16.2bn
Enterprise value: NT$531.1bn / $16.5bn
3m ADTV: NT$7.7bn / $242.0mn
Taiwan
Taiwan Electronic Components
M&A Rank: 3
Leases incl. in net debt & EV?: Yes
| GS Forecast | 12/25 | __________ 12/26E | 12/27E 197,073.8 | 12/28E 269,434.4 |
|---|---|---|---|---|
| Revenue(NT$mn) New Revenue (NT$ mn) Old | 60,003.8 60,003.8 | 112,103.0 108,823.2 | 184,735.5 | 253,129.2 |
| EBIT D A(NT$ mn) | 15,359.3 | 34,558.9 | 69,958.6 | 98,090.6 |
| EPS(NT$) New | 19.48 | 46.54 | 90.00 | 135.45 |
| EPS (NT$) Old | 19.48 | 43.17 | 80.51 | 122.36 |
| P/E (X) | 18.0 | 20.7 | 10.7 | 7.1 |
| P/B (X) | 5.3 | 10.9 | 7.2 | 4.8 |
| D ividend yield (%) | 2.9 | 2.4 | 4.7 | 7.0 |
| CROCI (%) | 31.9 | 38.6 | 51.0 | 55.9 |
| 9/26E | 12/26E | 3/27E | ||
| EPS (NT$) | 6/26 9.27 | 12.97 | 17.43 | 15.16 |
Source: Company data, Goldman Sachs Research estimates. See disclosures for details.
Goldman Sachs does and seeks to do business with companies covered in its research reports. As a result, investors should be aware that the fi rm may have a con fl ict of interest that could a ff ect the objectivity of this report. Investors should consider this report as only a single factor in making their investment decision. For Reg AC certi fi cation and other important disclosures, see the Disclosure Appendix, or go to ed as research www.gs.com/research/hedge.html. Analysts employed by non-US a ffi liates are not registered/quali fi analysts with FINRA in the U.S.
e92c7a75ab8b4efbba794e6b187208c8
For the exclusive use of KEVINLU@LENOVO.COM
BUY
GCE (2368.TW)
Rating since Nov 13, 2023
Ratios & Valuation __________________________________________
| 12/25 | 12/26E | 12/27E | 12/28E | |
|---|---|---|---|---|
| P/E (X) | 18.0 | 20.7 | 10.7 | 7.1 |
| P/B (X) | 5.3 | 10.9 | 7.2 | 4.8 |
| FCF yield (%) | (2.6) | (1.0) | 0.4 | 5.3 |
| EV/EBIT D AR(X) | 11.3 | 14.6 | 7.4 | 5.2 |
| EV/EBIT D A(excl. leases) (X) | 11.3 | 14.6 | 7.4 | 5.2 |
| CROCI (%) | 31.9 | 38.6 | 51.0 | 55.9 |
| ROE (%) | 35.1 | 60.7 | 81.4 | 81.1 |
| Net debt/equity (%) | (0.4) | 21.5 | 28.7 | 16.0 |
| Net debt/equity (excl. leases) (%) | (0.4) | 21.5 | 28.7 | 16.0 |
| Inte r est c ov e r (X) | 51.5 | 72.8 | 123.7 | 149.5 |
| D ays in v ent or y o utst , sales | 53.7 | 37.2 | 32.1 | 34.1 |
| Recei v able days | 124.9 | 99.5 | 86.3 | 95.2 |
| D ays p ayable o utstandin g | 87.3 | 68.6 | 64.4 | 69.8 |
| D uP o nt ROE (%) | 28.7 | 52.7 | 67.6 | 67.4 |
| Tu r n ov e r (X) | 0.8 | 1.1 | 1.3 | 1.3 |
| L e v e r a g e (X) | 2.3 | 2.2 | 2.2 | 2.0 |
| Gro ss cas h in v ested (ex cas h ) (NT $ ) | 53 , 996.0 | 77 , 393.5 | 112 , 273.6 | 146 , 056.9 |
| A v e r a g e ca p ital e mp l o yed (NT $ ) | 26 , 369.3 | 44 , 301.9 | 71 , 821.2 | 104 , 295.4 |
| BVP S (NT $ ) | 65.58 | 88.32 | 133.10 | 200.82 |
Growth & Margins (%) ______________________________________
| 12/25 | 12/26E | 12/27E | 12/28E | |
|---|---|---|---|---|
| Total revenue growth | 54 . 0 | 86 . 8 | 75 . 8 | 36 . 7 |
| E BITDA growth | 67 . 8 | 125 . 0 | 102 . 4 | 40 . 2 |
| E PS growth | 68 . 9 | 138 . 9 | 93 . 4 | 50 . 5 |
| DPS growth | 66 . 7 | 132 . 7 | 93 . 4 | 50 . 5 |
| E BIT margin | 23 . 4 | 29 . 5 | 34 . 6 | 35 . 7 |
| E BITDA margin | 25 . 6 | 30 . 8 | 35 . 5 | 36 . 4 |
| Net income margin | 16 . 0 | 21 . 4 | 23 . 6 | 25 . 9 |
Source: FactSet. Price as of 11 Aug 2026 close.
Income Statement (NT$ mn) ________________________________
| 12/25 | 12/26E | 12/27E | 12/28E | |
|---|---|---|---|---|
| To t a l r e v e nu e | 60,003.8 | 112,103.0 | 197,073.8 | 269,434.4 |
| Cost of goods sold | (40,321.0) | (70,350.5) | (115,456.2) | (154,979.9) |
| SG&A | (4,383.1) | (6,626.6) | (9,841.9) | (13,499.1) |
| R&D | (1,256.4) | (2,075.8) | (3,547.3) | (4,849.8) |
| Other operating inc./(exp.) | -- | -- | -- | -- |
| E BITDA | 15 ,3 5 9.3 | 34, 558 .9 | 6 9,9 58 . 6 | 9 8 ,090. 6 |
| Depreciation& amortization | (1,316.1) | (1,508.7) | (1,730.2) | (1,985.0) |
| E BIT | 1 4,043. 2 | 33,0 5 0. 2 | 68 , 228 .4 | 9 6 , 1 0 5 . 6 |
| Net interest inc./(exp.) | 0.9 | 116.6 | (259.4) | (498.0) |
| Income/(loss) from associates | -- | -- | -- | -- |
| Pre-tax pro fi t | 1 4, 17 3.3 | 3 2 , 8 3 5 . 1 | 6 3, 728 .4 | 9 5 , 655 . 6 |
| Provision for taxes | (4,566.8) | (8,882.4) | (17,286.6) | (25,764.7) |
| Minority interest | -- | -- | -- | -- |
| Preferred dividends | -- | -- | -- | -- |
| N et inc . ( pre-ex c ept i o n a ls) | 9, 6 0 6 . 5 | 2 3,9 52 . 6 | 4 6 ,44 1 . 8 | 6 9, 8 90.9 |
| Post-tax exceptionals | -- | -- | -- | -- |
| N et inc . ( po s t-ex c ept i o n a ls) | 9, 6 0 6 . 5 | 2 3,9 52 . 6 | 4 6 ,44 1 . 8 | 6 9, 8 90.9 |
| E P S(b a sic , pre-ex c ept ) (N T $) | 1 9.4 8 | 4 6 . 5 4 | 90.00 | 1 3 5 .4 5 |
| E P S(dilu te d , pre-ex c ept ) (N T $) | 1 9.4 8 | 4 6 . 5 4 | 90.00 | 1 3 5 .4 5 |
| E P S(b a sic , po s t-ex c ept ) (N T $) | 1 9.4 8 | 4 6 . 5 4 | 90.00 | 1 3 5 .4 5 |
| E P S(dilu te d , po s t-ex c ept ) (N T $) | 1 9.4 8 | 4 6 . 5 4 | 90.00 | 1 3 5 .4 5 |
| DPS (NT$) | 10.00 | 23.27 | 45.00 | 67.72 |
| Div. payout ratio (%) | 51.3 | 50.0 | 50.0 | 50.0 |
| Balance Sheet (NT$ mn) | 12/25 | ______ 12/26E | 12/27E | 12/28E |
| C a sh& c a sh equiv a lents | 1 8, 11 4.5 | 9,4 1 7.0 | 4,703.0 | 1 3,065. 1 |
| Accounts receiv a ble | 27,309.7 | 33,784.5 | 59,392. 1 | 8 1 , 1 99.4 |
| Inventory | 9,747. 1 | 1 3, 1 06.4 | 2 1 ,509.6 | 28,873.0 |
| Other current a ssets | 1 , 1 66.2 | 1 , 1 66.2 | 1 , 1 66.2 | 1 , 1 66.2 |
| Total current assets | 56 ,33 7 . 5 | 57 ,4 7 4.0 | 86 , 771 .0 | 12 4,303. 7 |
| Net PP&E | 1 7,840.3 | 4 1 ,363.5 | 6 1 ,665. 1 | 84,7 1 2.0 |
| Net int a ngibles | 77.6 | 45.7 | 1 3.9 | ( 1 8.0) |
| Tot a l investments | 85 1 .3 | 85 1 .3 | 85 1 .3 | 85 1 .3 |
| Other long-term a ssets | 639.7 | 639.7 | 639.7 | 639.7 |
| Total assets | 75 , 7 4 6 .3 | 1 00,3 7 4. 2 | 1 4 9 , 9 4 1 .0 | 21 0,4 88 . 7 |
| Accounts p a y a ble | 11 ,028.5 | 1 5,4 1 9.3 | 25,305.5 | 33,968.2 |
| Short-term debt | 6, 11 5.9 | 6,330.9 | 6,545.9 | 6,760.9 |
| Short-term le a se li a bilities | -- | -- | -- | -- |
| Other current li a bilities | 1 0,409.4 | 1 7,455.2 | 28,699.8 | 40,424.4 |
| Total current liabilities | 27 , 55 3. 8 | 3 9 , 2 0 5 .4 | 6 0, 551 . 2 | 81 , 15 3. 5 |
| Long-term debt | 11 ,874.9 | 1 2,874.9 | 1 7,874.9 | 22,874.9 |
| Long-term le a se li a bilities | -- | -- | -- | -- |
| Other long-term li a bilities | 2,836.5 | 2,836.5 | 2,836.5 | 2,836.5 |
| Total long-term liabilities | 1 4, 711 .4 | 15 , 711 .4 | 2 0, 711 .4 | 25 , 711 .4 |
| Total liabilities | 4 2 , 265 . 2 | 5 4, 916 . 8 | 81 , 262 . 6 | 1 0 6 , 86 4. 8 |
| Preferred sh a res | -- | -- | -- | -- |
| Tot a l commonequity | 33,48 1 .2 | 45,457.5 | 68,678.4 | 1 03,623.9 |
| Minority interest | -- | -- | -- | -- |
| Total liabilities &equity | 75 , 7 4 6 .3 | 1 00,3 7 4. 2 9,788.8 | 1 4 9 , 9 4 1 .0 1 9,7 1 7.8 | 21 0,4 88 . 7 1 6,570.7 |
| Net debt, a djusted | ( 1 23.7) |
Cash Flow (NT$ mn) ________________________________________
| 12/25 | 12/26E | 12/27E | 12/28E | |
|---|---|---|---|---|
| Net income | 9,606.5 | 23,952.6 | 46,441.8 | 69,890.9 |
| D&Aadd-back | 1,316.1 | 1,508.7 | 1,730.2 | 1,985.0 |
| Minority interest add-back | -- | -- | -- | -- |
| Net (inc)/dec working capital | (12,581.2) | (5,443.3) | (24,124.7) | (20,507.9) |
| Other operating cash flow | 3,917.4 | -- | -- | -- |
| Cash flow fro m operations | 2 , 258 . 8 | 2 0,0 18 .0 | 2 4,04 7 .3 | 51 ,3 68 .0 |
| Capital expenditures | (6,733.3) | (25,000.0) | (22,000.0) | (25,000.0) |
| Acquisitions | (261.8) | -- | -- | -- |
| Divestitures | -- | -- | -- | -- |
| Others | (38.1) | -- | -- | -- |
| Cash flow fro m investing | ( 7 ,033.3) | ( 25 ,000.0) | ( 22 ,000.0) | ( 25 ,000.0) |
| Repayment of lease liabilities | -- | -- | -- | -- |
| Dividends paid(common& pref) | (2,920.1) | (4,930.5) | (11,976.3) | (23,220.9) |
| Inc/(dec) in debt | 8,924.0 | 1,215.0 | 5,215.0 | 5,215.0 |
| Other financing cash flows | 7,700.5 | 0.0 | 0.0 | 0.0 |
| Cash flow fro m finan c ing | 1 3, 7 04.4 | (3, 715 . 5 ) | ( 6 , 761 .3) | ( 18 ,00 5 .9) |
| Total c ash flow | 8 ,9 2 9.9 | ( 8 , 6 9 7 . 5 ) | (4, 71 4.0) | 8 ,3 62 . 1 |
| Free cash flow | (4,474.5) | (4,982.0) | 2,047.3 | 26,368.0 |
Source: Company data, Goldman Sachs Research estimates.
e92c7a75ab8b4efbba794e6b187208c8
Exmon 1. 0er 94240 resul comp labie
GCE (2368.TW)
Revenue
Gross profits
Operating profits
Pre-tax income
Net earnings
EPS, NT$
Gross margin (%)
EBIT margin (%)
Net margin (%)
For the exclusive use of KEVINLU@LENOVO.COM
2Q26
GS est.
23,947
Diff (%)
1%
QoQ
1Q26
19,313
QoQ
26%
YoY
2Q25
13,853
YoY
75%
Bloomberg consensus
Consensus
23,182
5%
market share in 2026-28E while its ASIC PCB market share should be consistently higher than 25% from 2026 (to 30-32% in 2027-28E), suggesting not only a solid revenue growth outlook, but also imply better pro fi tability in the long term (we believe AI grade PCB GM is and will continue to be 45-50%+ vs. GCE 2Q GM at only at ~35%).
Moreover, the company mentioned its progress on ramping up thick-copper HDI (for AI server) capacity is smooth now and management believe the di ffi culty on producing AI HDI products should be similar to 800G switches (we believe the yield rate should be at least 70-80%), and we believe the positive comment on AI HDI yield rate suggests more opportunity for the company to enjoy an even better market share and pro fi tability in coming quarters/years.
We suggest investors to build position on GCE after a signi fi cant de-rating on P/E multiple, before the yield rate ramp up on its new AI ASIC MLB/RPCB capacity, as we have already seen the company's stock price de-rate by 5-10x (was 20-25x in 2024-25, but the company only traded at 10-11x of 2027E EPS based on our estimate) due to (1) investors' concern on GCE's AI HDI yield rate (which could impact the company's market share and pro fi tability in the LT), and (2) the relatively slow GM expansion speed especially in 1H26. We believe investors' concern on GCE AI HDI yield rate will gradually ease in coming quarters after the company ramps up all of its new high-end HDI capacity; also, considering the much better pricing condition and product mix in 3Q, we believe investors will start to revisit GCE's business once they realize the 2Q GM miss is only a one-time issue driven by the pricing/cost hike timing mismatch. As such, we see attractive upside on GCE (87% implied upside vs. today) with limited risk in the short term to long term.
Maintain Buy on GCE, with a new 12-m TP of NT$1,800 (from NT$1,585).
Exhibit 1: GCE's 2Q26 result comp table
Source: Company data, Bloomberg, Goldman Sachs Global Investment Research
Earning and TP revision
Earnings revision
We revise up our 2026/27/28E earnings estimate by 9/14/13% to factor in the faster than expected ASP hike from high-end AI server, as well as the much faster than originally expected capacity expansion plans (revise up 2026/27/28E revenue estimate by 3/7/6%), despite our less positive view on the GM outlook (due to the unfavorable FX movement).
24,279
8,413
6,418
6,299
4,783
9.27
34.7%
26.4%
19.7%
e92c7a75ab8b4efbba794e6b187208c8
exmons. aer ral lavie
Camoll & calligs levision lavte
NT$mn
1Q25
Revenue
GCE P&L (NT$ mn)
Sales
Gross Profit
Gross profit
Operating expense
Operating income
EBIT
Pretax income
Net Income
Taxes expense
(1.233)
2,543
2Q25
(1.228)
2,868
3Q25
4Q25
17,680
2026E New
112,103
16,408
6,288
5,524
(1,641)
41,753
33,050
4,647
(1,538)
3,986
2026E Old
1Q26
2Q26
19,313
24,279
6.722
108.823
41,542
8.413
(1,538)
33,256
(1,996)
5,185
2,509
4,730
EPS(NTS)
23,953
Net income
4,281
21.893
6.418
5.088
Exhibit 2: Earnings revision table
EPS, NTS
Gross margin
3.60
3.48
6.53
Ratio analysis and assumption
EBIT margin
As % of sales
Gross margin
Net margin
Operating expense ratio
Operating margin
Net margin
QoQ growth (%)
Revenue
Gross profit
Operating income
Net in come
Yor growth (%)
2027E Old
2Q27E
3Q27E
45,436
54,318
18.676
184.736
76,086
22,501
(3,099)
(3,704)
15,577
63,535
18,797
14,077
17,297
(3,942)
10,136
19.64
(4.497)
40,824
12,799
80.51
24.80
3Q26E
Diff.
30,645
11.624
3%
(2,329)
1%
4Q26E
37,866
2027E New
14.993
1Q27E
35,855
14.589
197,074
(2,840)
9.295
-1%
9.295
12.153
9%
(2,603)
12.153
(3,160)
6,693
8%
12.97
81,618
68,228
(2,517)
12,072
10,572
46.442
(2,749)
7.823
90.00
15.16
8.993
17.43
Diff.
4Q27E
61,465
25.851
7%
7%
(4,069)
21,782
21,782
7%
(6.099)
14%
15,683
12%
30.39
6,299
(1,516)
4.783
43.17
9.27
Diff.
2028E
269,434
(18,349)
96,106
95,656
7%
(25,765)
11%
13%
69.891
135.45
2028E Old
2026E
2027E
112,103
197.074
41.753
253,129
106,880
81.618
(8,702)
89,642
33.050
(13,389)
68,228
32,835
63,728
(8,882)
62,046
23,953
122.36
(17,287)
46.442
46.54
2028E New
2024
2025
38,952
60.004
11,396
269,434
19.683
(3,329)
114,455
(5,640)
8,067
96,106
14,043
8,490
14,173
(2,875)
69,891
5,616
11.54
135.45
(4,567)
9.607
19.48
| 37.2% 29.5% 38.2% | -0.9pp | 41.4% | 41.2% | 0.2pp | 42.5% | 42.2% | 0.3pp | |
|---|---|---|---|---|---|---|---|---|
| 30.6% | - 1. 1pp | 34.6% | 34.4% | 0.2pp | 35.7% | 35.4% | 0.3pp | |
| 31.3% | 21.4% 20.1% 33.7% | 1.2pp 39.6% | 23.6% | 22.1% | 1.5pp | 25.9% | 24.5% 41.4% | 1.4pR |
| 34.8% 8.0% 34.7% | 37.9% 7.6% | 40.7% 7.0% | 41.1% 6.8% 41.4% | 42.1% 6.6% | 32.8% 9.4% | 37.2% 7.8% | 42.5% 6.8% | |
| 10.2% 21.1% | 9.4% 24.3% 26.8% 8.2% 26.4% | 30.3% | 7.5% 33.7% | 34.3% 6.8% 34.6% | 35.4% | 23.4% | 29.5% 6.8% | 35.7% |
| 14.5% | 17.9% 18.0% 19.7% | 21.8% 32.1% 23.7% | 21.8% | 22.3% 23.6% | 25.5% | 16.0% | 21.4% 34.6% 23.6% | 25.9% |
| 22.4% | -7.2% 17.7% 25.7% | 26.2% 23.6% | -5.3% | 26.7% 19.5% | 13.2% | |||
| 47.7% 55.5% | -12.1% -14.2% 21.7% 30.1% 25.2% 23.8% | 38.2% 44.8% 29.0% 30.7% | -2.7% -0.7% | 28.0% 29.0% 20.5% 20.7% | 14.9% 15.9% | |||
| -9.3% 18.9% 37.3% | 39.9% | 34.4% -13.0% | 29.6% 26.3% | 22.5% |
Revenue
Source: Company data, Goldman Sachs Global Investment Research
Gross profit
Operating income
Net income
35.3%
30.3%
55.0%
47.3%
86.2%
85.5%
44.0%
102.5%
11.4%
Exhibit 3: GCE P&L table
Source: Company data, Goldman Sachs Global Investment Research
Investment thesis and Valuation & Risks
GCE is a key cloud (server+switch) PCB supplier globally with 20%+ market share in 2022. We expect cloud PCB market demand to grow at a 15% 2024-26E CAGR (far stronger than the overall RPCB+HDI market demand growth rate at 5% 2024-26E CAGR). We believe GCE's proactive capacity expansion plan (33% in 2026) and high annualized ROI (300%+) will continue to drive the company's revenue/margin level in the coming quarters/years. Additionally, we believe GCE can continue to see strong demand from the increasing content per server/switch, as we expect both markets to see a 20-50%+ layer count increase after the generation upgrade (upgrade to 400G/Eagle Stream). We are constructive on GCE's long-term growth opportunity given its solid position in the rapidly growing cloud PCB market, and we are Buy rated on the stock. GCE is trading higher than its historical P/E average level driven by strong AI server demand, but lower than the TW AI server players' average.
116.1%
105.4%
78.0%
TP revision
87.1%
122.0%
142.7%
111.9%
77.2%
93.6%
102.2%
91.2%
85.7%
117.0%
132.9%
124.6%
171.4%
204.9%
206.9%
84.9%
100.0%
107.2%
62.3%
72.4%
79.2%
74.4%
30%
48%
57%
59%
54%
73%
74%
71%
90.00
87%
112%
135%
149%
76%
95%
106%
94%
37%
40%
41%
50%
Maintain Buy with a new TP of NT$1,800 (from NT$1,585), based on the new 20x P/E (revise down from 22x, to factor in investors' concern on GCE's AI HDI yield rate; 20x P/E is in-line with the AI PCB industry average valuation in the past 3 years), also rollover of our valuation base from 4Q26-3Q27E to 2027E, and factoring in our earnings revision.
5.86
6.87
For the exclusive use of KEVINLU@LENOVO.COM
e92c7a75ab8b4efbba794e6b187208c8
For the exclusive use of KEVINLU@LENOVO.COM
Price Target Risks and Methodology
Valuation methodology: Our 12m TP of NT$1,800 is based on a 20x 2027E P/E (in-line with the AI PCB leaders valuation in the past 3 years).
Key downside risks: (1) weaker-than-expected AI server market demand; (2) delays in the company's Nvidia OAM/UBB product quali fi cation, (3) weaker-than-expected HDI demand, and (4) higher-than-expected ramp up cost for new capacity e92c7a75ab8b4efbba794e6b187208c8
For the exclusive use of KEVINLU@LENOVO.COM