PDF 原檔:報告_GS_台積電2330_20261015_original.pdf
圖片清單(已驗證 2026-10-16)
僅列 ≥40KB 並逐張 Read 者(另列已 Read 的 <40KB 產能類小圖);其餘抽圖預設為小圖,lib 不嵌。
| 檔名 | size | 分類 | 親眼所見內容 |
|---|---|---|---|
報告_GS_台積電2330_20261015_005.png |
29KB | 真資料圖 | Exhibit 4:2023–2028E 年度 CoWoS 出貨(千片晶圓)118/322/630/1,197/2,567/3,306 與 YoY(<40KB 但含產能資料,已 Read) |
報告_GS_台積電2330_20261015_006.png |
28KB | 真資料圖 | Exhibit 5:2023–2028E 年度 CoWoS 產能(千片晶圓)144/322/675/1,275/2,730/3,480 與 YoY(<40KB,已 Read) |
報告_GS_台積電2330_20261015_007.png |
25KB | 真資料圖 | Exhibit 6:1Q24–4Q28E 季度 CoWoS 月產能(kwpm):4Q25 75、2Q26 95、3Q26E 115、4Q26E 135、1Q27E 180、2Q27E 210、3Q27E 240、4Q27E 280、1Q28E–2Q28E 280、3Q28E 290、4Q28E 310(<40KB,已 Read) |
報告_GS_台積電2330_20261015_008.png |
33KB | 真資料圖 | Exhibit 7:2013–2028E capex(US$bn)與資本密度;2025 40.9、2026E 64.0、2027E 85.0、2028E 98.0(<40KB,已 Read) |
報告_GS_台積電2330_20261015_013.png |
63KB | 真資料圖 | GS 對 2330.TW 的評等與目標價沿革圖(2023–2026,標記含 725、1,160、1,600、2,330、2,600、3,000、3,100 等) |
報告_GS_台積電2330_20261015_014.png |
61KB | 真資料圖 | GS 對 TSM ADR 的評等與目標價沿革圖(美元,標記含 115、222、344、466、520、550、600、620 等) |
原始內容
[讀者資訊已遮蔽]
TSMC (2330.TW)
Earnings review: 3Q26 inline but 4Q26 GM came in slightly softer; AI demand outlook shows no signs of slowdown; reiterate Buy
| 2330.TW | 12m Price Target: NT$3,300.00 | Price: NT$2,440.00 | Upside: 35.2% |
|---|---|---|---|
| TSM | 12m Price Target: $660.00 | Price: $430.00 | Upside: 53.5% |
Stronger revenue momentum while GM guidance came in softer
TSMC hosted its 3Q26 analyst meeting on October 15. While we view the higher full-year 2026 revenue guidance and the further acceleration in capacity buildout as the key positives, the GM guidance could be the softer spot. In the meeting, management further raised its 2026 revenue growth outlook to grow by around 44% YoY (from slightly above 40%; USD term), supported by continued strong demand especially for AI/HPC. However, both 3Q26 GM result and 4Q26 GM guidance came in lower than our expectations; we believe this is to reflect a steeper N2 ramp and overseas fab dilution in the near term.
AI demand still ahead of supply, with no sign of slowdown
Key questions among investors largely surrounded demand outlook. Overall, we think that management's tone on AI demand remained very bullish. While TSMC did not formally update its long-term AI accelerator revenue CAGR, management indicated the CAGR will probably be higher, noting demand is extremely robust with no sign of slowdown and still far exceeds supply, with multiple drivers reinforcing this view, including - 1) agentic AI driving incremental CPU demand, which is excluded from TSMC's AI accelerator definition and implies upside beyond the headline CAGR; 2) broader adoption of open-source models lowering the barrier to AI usage and lifting leading-edge silicon demand; 3) continued demand for networking chips alongside AI accelerators; and 4) TSMC's own checks on US data center build progress and power supply, where management sees CSPs as very well prepared.
Capacity build-out accelerating again: N2 capacity more than double in 2027; additional N3 fab addition; Texas under evaluation On N2, management for the first time guided its N2 capacity will be
BUY
Evelyn Yu
+886(2)2730-4187 | evelyn.yu@gs.com Goldman Sachs (Asia) L.L.C., Taipei Branch
Allen Chang
+852-2978-2930 | allen.k.chang@gs.com Goldman Sachs (Asia) L.L.C.
James Schneider, Ph.D.
+1(212)357-2929 | jim.schneider@gs.com Goldman Sachs & Co. LLC
Key Data _____________________________________
Market cap: NT$63.3tr / $2.0tr
Enterprise value: NT$60.4tr / $1.9tr
3m ADTV: NT$63.8bn / $2.0bn
Taiwan
Taiwan Semiconductor
M&A Rank: 3
Leases incl. in net debt & EV?: Yes
| GS Forecast | 12/25 | __________ 12/26E | 12/27E | 12/28E |
|---|---|---|---|---|
| Revenue (NT$ mn) New | 3,809,054.35,620,115.77,683,481.69,941,180.4 | |||
| Revenue (NT$ mn) Old | 3,809,054.3 | 5,533,119.0 | 7,616,958.4 | 9,935,012.5 |
| EBITDA (NT$ mn) | 2,624,188.0 | 4,148,113.5 | 5,795,566.1 | 7,648,573.7 |
| EPS (NT$) New EPS (NT$) Old | 66.26 66.26 | 112.35 110.77 | 150.01 150.00 | 196.90 195.67 |
| P/E (X) | 17.6 | 21.7 | 16.3 | 12.4 |
| P/B (X) | 5.6 | 8.2 | 5.8 | 4.2 |
| Dividend yield (%) | 1.9 | 1.2 | 1.4 | 1.5 |
| CROCI (%) | 24.3 | 34.1 | 39.5 | 42.6 |
| 6/26 | 9/26E | 12/26E | 3/27E | |
| EPS (NT$) | 27.25 | 29.43 | 33.61 | 34.26 |
Source: Company data, Goldman Sachs Research estimates. See disclosures for details.
Goldman Sachs does and seeks to do business with companies covered in its research reports. As a result, investors should be aware that the firm may have a conflict of interest that could affect the objectivity of this report. Investors should consider this report as only a single factor in making their investment decision. For Reg AC certification and other important disclosures, see the Disclosure Appendix, or go to
www.gs.com/research/hedge.html. Analysts employed by non-US affiliates are not registered/qualified as research analysts with FINRA in the U.S.
e92c7a75ab8b4efbba794e6b187208c8
[讀者資訊已遮蔽]
BUY
TSMC (2330.TW)
Rating since May 7, 2019
Ratios & Valuation __________________________________________
| 12/25 | 12/26E | 12/27E | 12/28E | |
|---|---|---|---|---|
| P/E (X) | 17.6 | 21.7 | 16.3 | 12.4 |
| P/B (X) | 5.6 | 8.2 | 5.8 | 4.2 |
| FCF yield (%) | 3.3 | 2.6 | 3.9 | 5.8 |
| EV/EBITDAR (X) | 10.8 | 14.6 | 10.1 | 7.3 |
| EV/EBITDA (excl. leases) (X) | 10.8 | 14.6 | 10.1 | 7.3 |
| CROCI (%) | 24.3 | 34.1 | 39.5 | 42.6 |
| ROE (%) | 35.4 | 44.3 | 41.9 | 39.4 |
| Net debt/equity (%) | (34.3) | (37.7) | (42.3) | (49.0) |
| Net debt/equity (excl. leases) (%) | (34.3) | (37.7) | (42.3) | (49.0) |
| Interest cover (X) | 99.1 | 159.9 | 350.7 | 1,021.0 |
| Days inventory outst, sales | 27.6 | 24.8 | 25.7 | 24.5 |
| Receivable days | 26.6 | 27.4 | 27.6 | 24.6 |
| Days payable outstanding | 157.7 | 193.6 | 200.5 | 197.4 |
| DuPont ROE (%) | 31.5 | 37.5 | 35.7 | 33.8 |
| Turnover (X) | 0.5 | 0.5 | 0.6 | 0.5 |
| Leverage (X) | 1.5 | 1.4 | 1.3 | 1.2 |
| Gross cash invested (ex cash) (NT$) | 9,199,168.9 | 11,312,090.4 | 13,935,574.6 | 16,893,345.7 |
| Average capital employed (NT$) | 3,371,689.3 | 4,215,069.1 | 5,565,337.1 | 6,999,414.8 |
| BVPS (NT$) | 208.99 | 298.08 | 418.09 | 580.99 |
Growth & Margins (%) ______________________________________
| 12/25 | 12/26E | 12/27E | 12/28E | |
|---|---|---|---|---|
| Total revenue growth | 31.6 | 47.5 | 36.7 | 29.4 |
| EBITDA growth | 32.2 | 58.1 | 39.7 | 32.0 |
| EPS growth | 46.4 | 69.6 | 33.5 | 31.3 |
| DPS growth | 29.4 | 31.8 | 13.8 | 12.1 |
| EBIT margin | 50.8 | 59.1 | 60.1 | 61.5 |
| EBITDA margin | 68.9 | 73.8 | 75.4 | 76.9 |
| Net income margin | 45.1 | 51.8 | 50.6 | 51.4 |
Price Performance __________________________________________
Source: FactSet. Price as of 15 Oct 2026 close.
Income Statement (NT$ mn) ________________________________
| 12/25 | 12/26E | 12/27E | 12/28E | |
|---|---|---|---|---|
| Total revenue | 3,809,054.3 | 5,620,115.7 | 7,683,481.6 | 9,941,180.4 |
| Cost of goods sold | (1,527,760.3) | (1,874,702.8) | (2,550,456.2) | (3,208,678.0) |
| SG&A | (98,775.0) | (103,546.5) | (124,628.0) | (142,028.0) |
| R&D | (246,427.3) -- | (321,860.8) -- | (387,916.0) -- | (479,916.0) |
| Other operating inc./(exp.) EBITDA | 2,624,188.0 | 4,148,113.5 | 5,795,566.1 | -- 7,648,573.7 |
| Depreciation & amortization | (688,096.4) | (828,107.9) | (1,175,084.7) | (1,538,015.2) |
| EBIT | 1,936,091.7 | 3,320,005.6 | 4,620,481.4 | 6,110,558.5 |
| Net interest inc./(exp.) | 86,206.5 | 91,497.7 | 97,520.8 | 104,678.2 |
| Income/(loss) from associates | 5,496.6 | 3,123.4 | 0.0 | 0.0 |
| Pre-tax profit | 2,041,662.8 | 3,501,713.8 | 4,718,002.1 | 6,215,236.6 |
| Provision for taxes | (326,266.1) | (587,022.9) | (826,845.9) | (1,107,976.6) |
| Minority interest | 2,485.8 | (1,094.5) | (1,108.0) | (1,108.0) |
| Preferred dividends | -- | -- | ||
| Net inc. (pre-exceptionals) | -- 1,717,882.6 | 2,913,596.4 | 3,890,048.2 | -- 5,106,152.1 |
| Post-tax exceptionals Net inc. (post-exceptionals) EPS (basic, pre-except) (NT$) | -- 1,717,882.6 66.26 | -- 2,913,596.4 112.35 | -- 3,890,048.2 150.01 | -- 5,106,152.1 |
| EPS (basic, post-except) EPS (diluted, post-except) DPS (NT$) Div. payout ratio (%) | 66.26 | ______ 112.35 29.00 25.8 12/26E | 150.01 33.00 22.0 | 196.90 196.90 |
| EPS (diluted, pre-except) (NT$) (NT$) | 33.2 | 196.90 37.00 | ||
| (NT$) | 66.26 | 112.35 | 196.90 | |
| 66.26 22.00 | 112.35 | 150.01 150.01 | ||
| 18.8 | ||||
| Balance Sheet (NT$ mn) | ||||
| Cash & cash equivalents | 12/25 2,767,856.4 | 3,498,381.5 | 12/27E 4,868,723.0 600,545.0 | 12/28E 7,480,069.9 737,328.5 |
| Accounts receivable Inventory | 282,059.2 288,109.5 | 560,521.2 474,146.2 | 608,341.7 | 726,932.3 |
| Other current assets | 479,105.8 | 603,826.0 | 603,826.0 | 603,826.0 |
| Total current assets | 3,817,130.8 | 5,136,874.8 | 6,681,435.7 | 9,548,156.6 |
| Net PP&E | 3,691,840.9 | 5,028,894.0 | 6,565,521.7 | 8,152,618.9 1,968.4 |
| Net intangibles | 24,952.6 | 19,393.2 | 10,680.8 | |
| Total investments | 172,370.4 | 227,935.7 | 227,935.7 255,063.0 | 227,935.7 255,063.0 |
| Other long-term assets | 226,729.2 7,933,023.9 | 255,063.0 | 13,740,636.8 | 18,185,742.6 |
| Total assets | 714,546.9 | 10,668,160.7 1,274,278.1 | 1,528,013.1 | 1,942,016.1 |
| Accounts payable Short-term debt | 0.0 | -- | ||
| Short-term lease liabilities | -- | -- -- | -- -- | -- |
| Other current liabilities Total current liabilities | 743,472.4 | 875,205.6 | 875,205.6 2,403,218.7 | 875,205.6 2,817,221.7 |
| 1,458,019.3 | 2,149,483.7 | |||
| Long-term debt | 896,062.0 | 564,263.7 | 264,263.7 | 64,263.7 -- |
| Long-term lease liabilities Other long-term liabilities | -- 118,147.3 1,014,209.3 | -- 179,158.2 | -- 179,158.2 | 179,158.2 243,421.9 |
| Total long-term liabilities | 743,421.9 | 443,421.9 | 3,060,643.6 | |
| Total liabilities | 2,472,228.6 -- | 2,892,905.6 -- | 2,846,640.6 -- | -- 15,066,390.7 |
| Preferred shares Total common equity | 7,729,951.3 45,303.8 | 10,841,990.2 52,006.0 | 58,708.3 18,185,742.6 | |
| Minority interest | 5,419,596.0 41,199.3 7,933,023.9 | |||
| Total liabilities & equity | 10,668,160.7 | 13,740,636.8 | (7,415,806.2) | |
| Net debt, adjusted | (1,871,794.4) | (2,934,117.8) | ||
| (4,604,459.3) | __________ | |||
| Cash Flow (NT$ mn) Net income | 12/25 1,717,882.6 688,096.4 | 12/26E 2,913,596.4 828,107.9 | 12/27E 3,890,048.2 1,175,084.7 | 12/28E 5,106,152.1 1,538,015.2 |
| D&A add-back Minority interest add-back Net (inc)/dec working capital | 1,094.5 | 1,108.0 79,515.7 | 1,108.0 158,628.9 | |
| (2,485.8) | ||||
| Other operating cash flow | 98,731.8 | 95,232.4 (171,751.0) | 0.0 | 0.0 |
| Cash flow from | (227,249.3) 2,274,975.6 | |||
| operations | 3,666,280.3 | 6,803,904.2 | ||
| 5,145,756.7 | ||||
| Capital expenditures Acquisitions Divestitures | (1,272,410.5) -- -- | (2,032,215.9) -- -- | (2,703,000.0) -- -- | (3,116,400.0) -- -- |
| Others Cash flow from | 128,017.1 | (2,899.4) | -- | -- |
| investing | ||||
| (1,144,393.4) | (2,035,115.4) | (2,703,000.0) | ||
| -- | -- | (3,116,400.0) -- | ||
| Repayment of lease liabilities Dividends paid (common & pref) | (440,851.8) 40,448.1 | (622,379.8) (307,998.9) | -- (778,009.3) (300,000.0) | (881,751.6) (200,000.0) 5,594.2 |
| Inc/(dec) in debt Other financing cash flows Cash flow from financing | (89,949.1) (490,352.9) 640,229.4 | 29,738.9 (900,639.9) | 5,594.2 (1,072,415.1) | (1,076,157.3) 2,611,346.8 |
| Total cash flow | 730,525.1 | 1,370,341.6 | ||
| Free cash flow | 1,002,565.1 | 1,634,064.4 | 2,442,756.7 | 3,687,504.2 |
Source: Company data, Goldman Sachs Research estimates.
e92c7a75ab8b4efbba794e6b187208c8
[讀者資訊已遮蔽]
more than double in 2027. As for N3, management announced an additional 3nm fab expansion in Tainan on strong customer demand, with volume production in 1H28. This comes on top of 1) the ongoing N3 fab expansion in Tainan (ramp in 1H27), 2) Arizona fab 2 (ramp in 3Q27, slightly ahead of its prior schedule), 3) Japan fab 2 (ramp in 2028), and 4) continued N5-to-N3 tool conversion. Beyond Arizona, TSMC confirmed it is evaluating Texas as a potential additional US site, and is in discussion with one customer building Terafab on utilizing that capacity; while the business model and structure remains under discussion, TSMC highlighted that its principle is to run the fab by itself.
GM: steeper N2 dilution near term, but 'no ceiling' long term
3Q26 GM declined 1.3ppt QoQ to 66.4%, primarily on dilution from the initial N2 ramp, and 4Q26 GM is guided down a further 40bps to 66.0% at the mid-point on continued N2 dilution and overseas fabs. Management now expects overseas fab dilution to be closer to 2% for full-year 2026 (vs. 2-3% previously), helped by larger scale and cost improvement, but reiterated it will widen to 3-4% in the latter part of the five-year period as more US fabs ramp. Longer term, management stated there is 'no ceiling' for TSMC's profitability, though any dramatic increase will not happen overnight. On pricing, management reiterated a strategic approach by segment, location and technology, with US production priced differently from Taiwan. Overall, we slightly lower our GM to 66.6%/66.8%/67.7% in 2026-2028E (vs. 67.2%/67.5%/67.8% previously).
CapEx: 2026 unchanged, multi-year step-up reiterated
2026 CapEx guidance was unchanged at US$60-64bn. While management did not provide numeric guidance beyond 2026, but reiterated that 2026-2028 CapEx will be significantly higher than the prior three years, and that revenue growth should continue to outpace CapEx growth. Management acknowledged the tools, material and labor inflation, but said the majority of CapEx is driven by long-term demand. Net net, we maintain our 2026E/2027E/2028E CapEx at US$64bn/US$85bn/US$98bn.
High confidence in its structural lead
Addressing questions regarding rising competition, management remains confident in its technology lead for both front end wafer and advanced packaging technology. Despite the later adoption timeframe (planned for in 2030) vs peers on High NA EUV, TSMC does not see the later adoption than peers as a disadvantage. In advanced packaging, TSMC is in volume production at 5x reticle size, which management believes no peer can match today, with 9x and 14x in development and CoPoS for future cost reduction. In addition, management also highlighted that it expects A14 (volume production in 2028) to be a bigger node than N2, with customer engagement already exceeding N2's at the same stage.
e92c7a75ab8b4efbba794e6b187208c8
[讀者資訊已遮蔽]
Key tables and charts
Exhibit 1: TSMC financial snapshot
| TSMC (2330.TW) | 2019 | 2020 | 2021 | 2022 | 2023 | 2024 | 2025 | 2026E | 2027E | 2028E | 25-28E CAGR |
|---|---|---|---|---|---|---|---|---|---|---|---|
| P&L (NT$bn) | |||||||||||
| Revenue (US$bn) | 34.7 | 45.6 | 56.9 | 75.9 | 69.3 | 90.1 | 122.4 | 177.0 | 241.6 | 312.6 | 36.7% |
| %YoY | 1.9% | 31.6% | 24.7% | 33.3% | -8.7% | 30.0% | 35.9% | 44.5% | 36.5% | 29.4% | |
| Revenue | 1,070 | 1,339 | 1,587 | 2,264 | 2,162 | 2,894 | 3,809 | 5,620 | 7,683 | 9,941 | 37.7% |
| %YoY | 3.7% | 25.2% | 18.5% | 42.6% | -4.5% | 33.9% | 31.6% | 47.5% | 36.7% | 29.4% | |
| Gross profit | 493 | 711 | 820 | 1,348 | 1,175 | 1,624 | 2,281 | 3,745 | 5,133 | 6,733 | 43.4% |
| %GM | 46.0% | 53.1% | 51.6% | 59.6% | 54.4% | 56.1% | 59.9% | 66.6% | 66.8% | 67.7% | |
| EBIT | 373 | 567 | 650 | 1,121 | 921 | 1,322 | 1,936 | 3,320 | 4,620 | 6,111 | 46.7% |
| %OpM | 34.8% | 42.3% | 40.9% | 49.5% | 42.6% | 45.7% | 50.8% | 59.1% | 60.1% | 61.5% | |
| Net income | 345 | 518 | 597 | 1,017 | 838 | 1,173 | 1,718 | 2,914 | 3,890 | 5,106 | 43.8% |
| %YoY | -1.7% | 50.0% | 15.2% | 70.4% | -17.5% | 39.9% | 46.4% | 69.6% | 33.5% | 31.3% | |
| EPS (NT$) | 13.3 | 20.0 | 23.0 | 39.2 | 32.3 | 45.3 | 66.3 | 112.4 | 150.0 | 196.9 | 43.8% |
Source: Company data, Goldman Sachs Global Investment Research, Bloomberg
Exhibit 2: TSMC's revenue growth outlook
Exhibit 3: TSMC's margin outlook
Source: Company data, Goldman Sachs Global Investment Research
Source: Company data, Goldman Sachs Global Investment Research
Exhibit 4: TSMC's annual CoWoS shipment growth trend
Exhibit 5: TSMC's annual CoWoS capacity growth trend
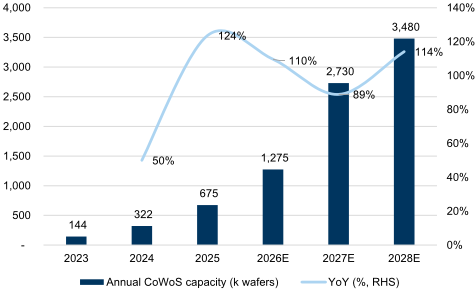
Source: Company data, Goldman Sachs Global Investment Research
Source: Company data, Goldman Sachs Global Investment Research
e92c7a75ab8b4efbba794e6b187208c8
[讀者資訊已遮蔽]
Exhibit 6: TSMC's quarterly CoWoS capacity ramp (kwpm)
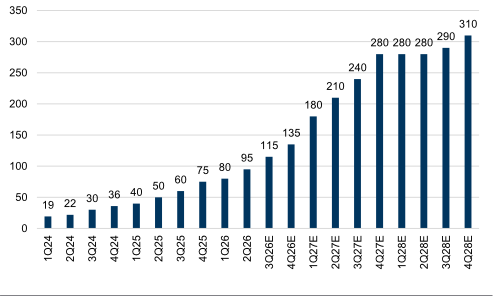
Exhibit 7: TSMC's capex and capital intensity trend
Source: Company data, Goldman Sachs Global Investment Research
Source: Company data, Goldman Sachs Global Investment Research
3Q26 results and 4Q26 guidance recap
4Q26 guidance: revenue well above expectations, GM below GSe
For 4Q26, management guided revenue to US$52.3-54.3bn (+14% QoQ at the mid-point; based on FX [TWD/USD] of 31.8), GM to 65-67% and OpM to 56.5-58.5%. Revenue guidance came in well above GSe of +11.0% QoQ, supported by continued strong leading-edge demand including the steep N2 ramp. However, the GM mid-point of 66.0% is 1.3ppt below GSe of 67.3% and broadly in line with consensus of 66.1%, as continued N2 dilution and overseas fabs are only partly offset by productivity gains and cross-node capacity optimization.
3Q26 results: revenue and EPS beat, GM below GSe
3Q26 revenue of NT$1,494.2bn (US$46.72bn) was up 17.6% QoQ and 50.9% YoY, above the high end of guidance in USD terms and above GSe/consensus by 0.8%/2.1%. EPS of NT$29.43 was up 8.0% QoQ and 68.7% YoY, above GSe/consensus by 1.2%/3.7%; excluding the NT$2.24 one-off gain from the VIS disposal in 2Q26, EPS grew 18% QoQ. GM of 66.4% (-1.3ppt QoQ) landed in the upper half of guidance (65-67%) but 1.1ppt below GSe, while OpM of 58.7% beat the high end of guidance (56-58%) on stable OpEx at 7.8% of revenue.
By technology, N2 contributed 8% of wafer revenue (vs. 3% in 2Q26) and N3 33% (vs. 30%), taking advanced nodes (7nm and below) to 79% (vs. 77%). By platform, HPC rose 22% QoQ to 68% of revenue (vs. 66%), with smartphone +10% QoQ at 21%. Inventory days fell 5 days QoQ to 82 days on higher wafer shipments.
e92c7a75ab8b4efbba794e6b187208c8
[讀者資訊已遮蔽]
Exhibit 8: 3Q26 results summary
| 3Q26 | 2Q26 | 3Q25 | %QoQ | %YoY | GS prev. | %Diff | Consensus | %Diff | |
|---|---|---|---|---|---|---|---|---|---|
| (NT$mn) | |||||||||
| Revenue | 1,494,243 | 1,270,380 | 989,918 | 17.6% | 50.9% | 1,482,698 | 0.8% | 1,463,320 | 2.1% |
| Gross profit | 992,379 | 860,311 | 588,543 | 15.4% | 68.6% | 1,000,438 | -0.8% | 972,771 | 2.0% |
| Op. income | 876,445 | 766,603 | 500,685 | 14.3% | 75.0% | 892,956 | -1.8% | 854,354 | 2.6% |
| Net income | 763,064 | 706,562 | 452,301 | 8.0% | 68.7% | 753,824 | 1.2% | 738,565 | 3.3% |
| EPS (NT$) | 29.43 | 27.25 | 17.44 | 8.0% | 68.7% | 29.07 | 1.2% | 28.38 | 3.7% |
| GM | 66.4% | 67.7% | 59.5% | -1.3% | 7.0% | 67.5% | -1.1% | 66.5% | -0.1% |
| OpM | 58.7% | 60.3% | 50.6% | -1.7% | 8.1% | 60.2% | -1.6% | 58.4% | 0.5% |
| NM | 51.1% | 55.6% | 45.7% | -4.6% | 5.4% | 50.8% | 0.2% | 50.5% | 1.2% |
Source: Bloomberg, Company data, Goldman Sachs Global Investment Research
Earnings revisions, valuation and key risks
Forecast changes
Post its earnings results, we tweak our 2026/2027/2028E EPS by 1.4%/0.0%/0.6% to reflect: 1) stronger 4Q26 revenue guidance and the higher 2026 growth outlook, but partly offset by 2) lower GM assumptions on steeper N2 ramp and overseas fab dilution.
Exhibit 9: Earnings revisions
| (NT$mn) | 2026E - Old | 2026E - New | 2026E - Diff (%) | 2027E - Old | 2027E - New | 2027E - Diff (%) | 2028E - Old | 2028E - New | 2028E - Diff (%) |
|---|---|---|---|---|---|---|---|---|---|
| Revenue | 5,533,119 | 5,620,116 | 1.6% | 7,616,958 | 7,683,482 | 0.9% | 9,935,012 | 9,941,180 | 0.1% |
| Gross profit | 3,720,174 | 3,745,413 | 0.7% | 5,140,114 | 5,133,025 | -0.1% | 6,739,653 | 6,732,502 | -0.1% |
| Op. income | 3,314,172 | 3,320,006 | 0.2% | 4,645,886 | 4,620,481 | -0.5% | 6,105,525 | 6,110,558 | 0.1% |
| Net income | 2,872,580 | 2,913,596 | 1.4% | 3,889,923 | 3,890,048 | 0.0% | 5,074,175 | 5,106,152 | 0.6% |
| EPS (NT$) | 110.77 | 112.35 | 1.4% | 150.00 | 150.01 | 0.0% | 195.67 | 196.90 | 0.6% |
| GM | 67.2% | 66.6% | -0.6% | 67.5% | 66.8% | -0.7% | 67.8% | 67.7% | -0.1% |
| OpM | 59.9% | 59.1% | -0.8% | 61.0% | 60.1% | -0.9% | 61.5% | 61.5% | 0.0% |
| NM | 51.9% | 51.8% | -0.1% | 51.1% | 50.6% | -0.4% | 51.1% | 51.4% | 0.3% |
| (NT$mn) | 4Q26E - Old | 4Q26E - New | 4Q26E - Diff (%) | 1Q27E - Old | 1Q27E - New | 1Q27E - Diff (%) | 2Q27E - Old | 2Q27E - New | 2Q27E - Diff (%) |
|---|---|---|---|---|---|---|---|---|---|
| Revenue | 1,645,937 | 1,721,389 | 4.6% | 1,711,413 | 1,778,044 | 3.9% | 1,846,140 | 1,865,007 | 1.0% |
| Gross profit | 1,108,130 | 1,141,428 | 3.0% | 1,155,117 | 1,178,067 | 2.0% | 1,248,183 | 1,245,106 | -0.2% |
| Op. income | 995,648 | 1,017,992 | 2.2% | 1,040,535 | 1,053,531 | 1.2% | 1,128,701 | 1,118,170 | -0.9% |
| Net income | 839,714 | 871,491 | 3.8% | 880,339 | 888,340 | 0.9% | 938,351 | 926,864 | -1.2% |
| EPS (NT$) | 32.38 | 33.61 | 3.8% | 33.95 | 34.26 | 0.9% | 36.18 | 35.74 | -1.2% |
| GM | 67.3% | 66.3% | -1.0% | 67.5% | 66.3% | -1.2% | 67.6% | 66.8% | -0.8% |
| OpM | 60.5% | 59.1% | -1.4% | 60.8% | 59.3% | -1.5% | 61.1% | 60.0% | -1.2% |
| NM | 51.0% | 50.6% | -0.4% | 51.4% | 50.0% | -1.5% | 50.8% | 49.7% | -1.1% |
Source: Goldman Sachs Global Investment Research
e92c7a75ab8b4efbba794e6b187208c8
[讀者資訊已遮蔽]
Exhibit 10: TSMC's P&L summary
| 1Q26 | 2Q26 | 3Q26E | 4Q26E | 1Q27E | 2Q27E | 3Q27E | 4Q27E | 2026E | 2027E | 2028E | |
|---|---|---|---|---|---|---|---|---|---|---|---|
| P&L (NT$mn) | |||||||||||
| Revenue | 1,134,103 | 1,270,380 | 1,494,243 | 1,721,389 | 1,778,044 | 1,865,007 | 1,954,437 | 2,085,994 | 5,620,116 | 7,683,482 | 9,941,180 |
| Gross profit | 751,295 | 860,311 | 992,379 | 1,141,428 | 1,178,067 | 1,245,106 | 1,310,056 | 1,399,797 | 3,745,413 | 5,133,025 | 6,732,502 |
| Operating profit | 658,966 | 766,603 | 876,445 | 1,017,992 | 1,053,531 | 1,118,170 | 1,180,720 | 1,268,061 | 3,320,006 | 4,620,481 | 6,110,558 |
| Net income | 572,480 | 706,562 | 763,064 | 871,491 | 888,340 | 926,864 | 1,000,360 | 1,074,484 | 2,913,596 | 3,890,048 | 5,106,152 |
| EPS (NT$) | 22.08 | 27.25 | 29.43 | 33.61 | 34.26 | 35.74 | 38.58 | 41.43 | 112.35 | 150.01 | 196.90 |
| Margins (%) | |||||||||||
| Gross margin | 66.2% | 67.7% | 66.4% | 66.3% | 66.3% | 66.8% | 67.0% | 67.1% | 66.6% | 66.8% | 67.7% |
| Operating profit margin | 58.1% | 60.3% | 58.7% | 59.1% | 59.3% | 60.0% | 60.4% | 60.8% | 59.1% | 60.1% | 61.5% |
| Net margin | 50.5% | 55.6% | 51.1% | 50.6% | 50.0% | 49.7% | 51.2% | 51.5% | 51.8% | 50.6% | 51.4% |
| YoY (%) | |||||||||||
| Revenue | 35.1% | 36.0% | 50.9% | 64.6% | 56.8% | 46.8% | 30.8% | 21.2% | 47.5% | 36.7% | 29.4% |
| Gross profit | 52.3% | 57.2% | 68.6% | 75.1% | 56.8% | 44.7% | 32.0% | 22.6% | 64.2% | 37.0% | 31.2% |
| Operating profit | 61.9% | 65.4% | 75.0% | 80.2% | 59.9% | 45.9% | 34.7% | 24.6% | 71.5% | 39.2% | 32.2% |
| Net income | 58.3% | 77.4% | 68.7% | 72.3% | 55.2% | 31.2% | 31.1% | 23.3% | 69.6% | 33.5% | 31.3% |
| EPS | 58.3% | 77.4% | 68.7% | 72.3% | 55.1% | 31.2% | 31.1% | 23.3% | 69.6% | 33.5% | 31.3% |
| QoQ (%) | |||||||||||
| Revenue | 8.4% | 12.0% | 17.6% | 15.2% | 3.3% | 4.9% | 4.8% | 6.7% | |||
| Gross profit | 15.2% | 14.5% | 15.4% | 15.0% | 3.2% | 5.7% | 5.2% | 6.9% | |||
| Operating profit | 16.7% | 16.3% | 14.3% | 16.2% | 3.5% | 6.1% | 5.6% | 7.4% | |||
| Net income | 13.2% | 23.4% | 8.0% | 14.2% | 1.9% | 4.3% | 7.9% | 7.4% | |||
| EPS | 13.2% | 23.4% | 8.0% | 14.2% | 1.9% | 4.3% | 7.9% | 7.4% |
Source: Company data, Goldman Sachs Global Investment Research
Reiterate Buy; 12m TP maintain at NT$3,300
We maintain our 12m TP at NT$3,300 based on a target P/E of 22x (unchanged, benchmarked to 1.0stdv above 5-year avg. forward P/E) applied to our 2027E EPS. Accordingly, we maintain our 12 month TP for the ADR at US$660, based on an unchanged FX conversion of USD/TWD of 30.0 and unchanged ADR premium of 20%. Our 22x target P/E multiple is also benchmarked to TSMC's trading average of 22x during its previous revenue upcycle where its 3-year revenue CAGR (2019-2021) was 28%, vs. our 3-year revenue CAGR at 38% during 2025-2028E.
Our TP implies 35% (ADR 54%) upside to the last close. As a result, we reiterate our Buy ratings for TSMC/ADR. We maintain our constructive view on TSMC's long-term growth outlook as we believe the company's solid technology leadership and execution better positions it vs. peers to capture the industry's long-term structural growth opportunities, especially in AI.
Source: Bloomberg
Exhibit 11: Taiex vs. TSMC
Source: Bloomberg
e92c7a75ab8b4efbba794e6b187208c8
[讀者資訊已遮蔽]
Exhibit 13: Forward P/B
Exhibit 14: P/B vs. ROE
Source: Bloomberg
Source: Bloomberg, Data compiled by Goldman Sachs Global Investment Research e92c7a75ab8b4efbba794e6b187208c8
[讀者資訊已遮蔽]
Investment Thesis, Price Target Risks and Methodology
Investment Thesis - TSMC (2330.TW/TSM)
TSMC is a leading global foundry company specializing in cutting-edge nodes. Its leading technology stance enables it to enjoy more than 60% revenue share in the global foundry market. We like TSMC as we believe its solid technology leadership and execution better position it vs. peers to capture the industry's long-term structural growth opportunities, particularly in areas such as AI/5G/HPC/EV. In addition, valuation looks attractive in our view, with the shares trading at the mid-range of their 10-year trading history (P/E: 10-29x). Furthermore, we view TSMC as the key AI enabler among our Taiwan Semis coverage, thanks to its leadership stance in leading edge nodes and advanced packaging technology - CoWoS (chip on wafer on substrate). We believe TSMC will achieve its 25% revenue CAGR target for the next several years, driven primarily by increasing silicon content growth and AI/HPC demand, with LT GM to remain at 56%+. We are Buy rated.
Price Target Risks and Methodology - TSMC (2330.TW/TSM)
Valuation methodology: We have a 12m TP of NT$3,300, which is derived by applying a target P/E multiple of 22x to our 2027E EPS. Our 22x target P/E is benchmarked against 1.0stdv above its 5-year trading average. For the ADR (TSM), we have a 12m TP of US$660, based on a USD/TWD rate of 30.0 and an ADR premium of 20%.
Key downside risks to our views: (1) further deterioration in end-demand recovery impacting capacity utilization; (2) slower customer node migrations; (3) slowdown in AI investment resulting in lower long-term semiconductor content growth; (4) poor yields/execution resulting in worse-than-expected profitability; (5) stronger competition resulting in ASP/profitability erosion; and (6) unfavorable FX trend or higher-than-expected cost increase weighing on the margin outlook.
e92c7a75ab8b4efbba794e6b187208c8
[讀者資訊已遮蔽]