PDF 原檔:報告_GS_CCL產業_20260729_original.pdf
圖片清單(已驗證 2026-07-31)
| 檔名 | size | 分類 | 親眼所見內容 |
|---|---|---|---|
260729_gs_CCL_001.png |
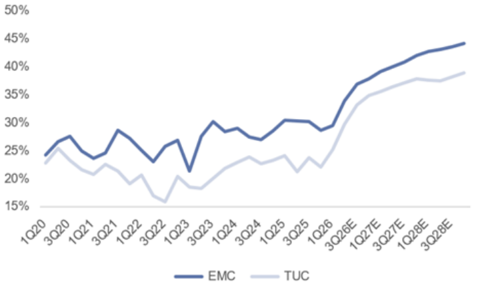
44.6KB | 真資料圖 | EMC(深藍)與 TUC(淺藍)毛利率趨勢折線圖,橫軸 1Q20-4Q28E,顯示 2Q26 起結構性上揚,2028E 末端 EMC 約 44%、TUC 約 39% |
260729_gs_CCL_002.png |
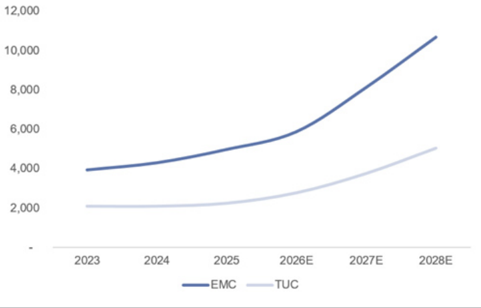
31.7KB | 真資料圖 | EMC(深藍)與 TUC(淺藍)月均 CCL 產能成長折線圖,橫軸 2023-2028E,EMC 由約 4,000 升至 2028E 約 10,700+,TUC 由約 2,000 升至 2028E 約 5,000 |
260729_gs_CCL_003.png |
86.9KB | 真資料圖 | 台燿(6274.TWO)Goldman Sachs 評等與目標價沿革圖(2023-2026),標示歷次 rating/price target 數值點 |
260729_gs_CCL_004.png |
86.0KB | 真資料圖 | 台光電(Elite Material, 2383.TW)Goldman Sachs 評等與目標價沿革圖(2023-2026),標示歷次 rating/price target 數值點 |
原始內容
For the exclusive use of KEVINLU@LENOVO.COM
TAIWAN CCL
High-end CCL GM expansion on the way with potential pricing hike in 2H26 + customers booking new capacity after 2028; recommend high quality CCL names; Buy on EMC & TUC
2Q26 overview
EMC's 2Q26 core business (OPI) was in-line with our estimate (the most bullish on the street; only 2% below our estimate) and was 18% higher than BBG consensus , thanks to the faster than expected pricing hike in 2Q (see here) and product mix improvement speed (revenue was 10% higher than BBG consensus and was 20-25% higher than the company's revenue target, but was in-line with our estimate; GM/OPM jumped 4.4/5.4ppt QoQ in 2Q26, which was 1.4/1.8ppt higher than the BBG consensus, but in-line with GSe). For earnings, EMC's 2Q26 EPS was 3% below our estimate due to some non-op loss, but was 16% higher than the BBG consensus.
TUC's 2Q26 core business (OPI) was also in-line with our estimate (the most bullish on the street; also 2% below GSe), and was 7% higher than BBG consensus , mainly driven by the solid GM expansion speed (4.6ppt QoQ and was 1.8ppt higher than BBG consensus, but was in-line with GSe), thanks to the solid demand from high-end AI customers' new projects ramp and 10-60% pricing hike across all product lines. EPS in 2Q was 12%/4% below GSe/BBG consensus due to the higher than expected tax rate (32% in 2Q vs. GSe/BBG consensus at 22%/23%) resulting from the loss making Thailand plant (which could be breakeven in 3Q26, leading to a much more stable tax rate).
3Q26 outlook
For EMC, considering the product mix improvement (Trainium 3 / Rubin / TPU v8 etc. new AI server projects with solid M8/9 grade CCL demand will ramp up more signi fi cantly from 3Q26) and potential pricing hike (we expect overall pricing will further go up by 0-10% QoQ in 3Q), we expect the company revenue to further go up by 21% QoQ, and GM should further expand from 33.9% in 2Q to 36.8% in 3Q26. Moreover, we expect EMC's substrate CCL business to pass quali fi cation in 3Q, which should start to contribute more earnings from 4Q26 with a much higher than company average GM level (we expect substrate CCL GM can easily reach 40-50% or even higher after mass production).
For TUC , with the faster than expected new Thailand plant capacity ramp up (July already starts some early contribution) and the faster demand from Trainium 3/Rubin projects, we believe the company will enjoy a 23% QoQ growth on revenue, with a solid GM expansion (+3.4ppt QoQ) . We continue to believe TUC's
Goldman Sachs does and seeks to do business with companies covered in its research reports. As a result, investors should be aware that the fi rm may have a con fl ict of interest that could a ff ect the objectivity of this report. Investors should consider this report as only a single factor in making their investment decision. For Reg AC certi fi cation and other important disclosures, see the Disclosure Appendix, or go to www.gs.com/research/hedge.html. Analysts employed by non-US a ffi liates are not registered/quali fi ed as research analysts with FINRA in the U.S.
Chao Wang
+886(2)2730-4195 | kuanchao.wang@gs.com Goldman Sachs (Asia) L.L.C., Taipei Branch
Allen Chang
+852-2978-2930 | allen.k.chang@gs.com Goldman Sachs (Asia) L.L.C.
Al Wang
+886(2)2730-4081 | al.wang@gs.com Goldman Sachs (Asia) L.L.C., Taipei Branch e92c7a75ab8b4efbba794e6b187208c8
For the exclusive use of KEVINLU@LENOVO.COM
Trainium 3 market share will increase from 10-20% in 1H26 to 30-40% in 2H26, considering its new Thailand plant will start ramping up new capacity with nothing to suggest quality issues per our checks , and EMC's limited capacity expansion in 2H (most of the new capacity will only come on stream from late 4Q26).
Investment view - Pricing to further go up in 2H26 and beyond suggesting further upside on GM + new capacity expansion plans after 2028 are fully booked by AI/LEO/Switching customers
As discussed in our latest CCL industry report (see here), we have already started to see high-end CCL players' GM expansion in 2Q26 thanks to (1) the solid demand from the high end M8 CCL driven by early ramp up of new AI server projects, and (2) 10-60% pricing hike across di ff erent products. As we mentioned in the industry report, we expect the high-end CCL players' pricing/GM outlook to be more favorable than the pure mid-to-low end CCL suppliers, especially going into 4Q26 when we expect the traditional consumer electronics demand will start to slow down (90%+ of the low end CCL demand contributed from consumer electronics) and trigger fund fl ow back from low-end CCL players to high-end CCL players.
Going into coming quarters/years, we expect the AI demand will further trend up, making the high-quality high-end capacity to be in even more shortage, suggesting further pricing hike and ASP expansion in the foreseeable future. Based on our supply chain checks, we believe EMC/TUC's M7 and below grade CCL pricing will continue to go up by 10-40%+ per quarter in 2H26, as both companies try to raise the pricing more to accelerate their product mix improvement speed; for high-end products (M8+ grade), we expect the pricing will start going up by 10%+ from end of 3Q26, considering PCB customers' willingness to accept more pricing hikes just to get more high-end high quality CCL products to improve their production yield rate.
For long term, investors are concerned about the high-end CCL demand sustainability; however, as shown in Exhibit 4, we estimate both EMC and TUC will not only just expand average monthly capacity by 35-40% YoY in 2027, but also expand capacity by at least 20-50% YoY in 2028E (EMC plans to expand capacity by 1.8mn sheet/month in 1H28 from 9.3mn by end of 2027, while more capacity could also come on stream in 2H29; for TUC, the company today announced (see here) it will expand 1.95mn sheets/month capacity in 2028-early 2029 from 3.8mn sheets/month by end of 2027, while, based on our supply chain check, all the new capacity that will come on stream in the next few quarters/years has all been booked by the high-end customers (including AI server / LEO / high-end switching customers) already, suggesting a good demand sustainability into long term (even after 2028).
Overall, we maintain our bullish view on high-end CCL players' business outlook and margin expansion trend; maintain Buy on EMC and TUC, with a new TP of NT$10,200 / NT$3,010 (from NT$9,500/NT$2,860).
e92c7a75ab8b4efbba794e6b187208c8
emoll < loc earnings comparison table
50%
TUC (6274. TW)
EMC (2383.TW)
45%
Revenue
Diff (%)
2Q26
2Q26
GS est.
GS est.
Diff (%)
14,301
Revenue
40%
35%
47,275
16,003
14,300
47,275
16,110
0%
0%
-1%
Exhibit 1: EMC earnings comparison table
30%
Pre-tax income
3,358
Operating profits
25%
Net earnings
Pre-tax income
20%
Net earnings
EPS, NT$
15%
EPS, NT$
Gross margin (%)
EBIT margin (%)
Net margin (%)
Gross margin (%)
EBIT margin (%)
Net margin (%)
Avelage montly cer capacity (sheets/mont)
12,000
YoY
Q0Q
QoQ
YoY
1Q26
1Q26
QoQ
33,067
9,729
10,000
10,054
2,529
1,828
Bloomberg consensus
Bloomberg consensus
Consensus
YoY
2Q25
2Q25
22,508
6,829
6,780
1,435
853
%
Consensus
%
YoY
110%
43,045
134%
14,320
111%
196%
174%
294%
13,983
10,814
4,644
7,128
QoQ
43%
42%
8,000
68%
64%
79%
0%
10%
14%
18%
4,004
3,130
6%
7%
| -2% 7,194 1% | -2% 7,194 1% | -2% 7,194 1% | 78% 4,467 | 78% 4,467 | 186% | 186% | 10,713 19% | 10,713 19% | |
|---|---|---|---|---|---|---|---|---|---|
| 12,785 9,873 | 12,990 10,132 3,427 3,399 | -3% | 5,340 1,874 | 85% 83% 4,000 | 3,478 840 | 184% 308% | 3,135 | 8,398 18% 9% | |
| 27.56 2,342 | 28.27 2,651 | -3% - 12% | 14.90 1,260 | 85% 86% | 10.02 652 | 175% 259% | 23.85 2,412 | 16% -3% | |
| 33.9% | 34.1% 8.02 9.18 | -0.2ppt - 13% | 29.4% 4.36 | 4.4ppt 84% 2,000 | 30.3% 2.36 | 3.5ppt 240% | 32.5% 8.35 | 1.4ppt -4% | |
| 26.9% 29.7% | 27.5% 29.9% | -0.5 ppt -0.2ppt | 21.6% 25.1% | 5.4ppt 4.6ppt | 20.6% 21.2% | 6.3ppt 8.5ppt | 25.1% 28.0% | 1.8ppt 1.8ppt | |
| 20.9% 23.5% — EMC | 21.4% 23.9% - TUC | -0.5 ppt -0.4ppt | 16.1% 18.2% | 4.7ppt 5.3ppt 2023 | 15.5% 12.6% 2024 | 5.4ppt 10.9ppt 2025 2026E | 19.5% 21.9% 2027E | 1.4ppt 1.6ppt 2028E | |
| 16.4% | 18.5% | -2.2ppt | 12.5% | 3.8ppt | 9.6% | 6.8ppt -EMC -TUC | 16.8% | -0.5ppt |
Source: Company data, Goldman Sachs Global Investment Research, Bloomberg
Exhibit 2: TUC earnings comparison table
Source: Company data, Goldman Sachs Global Investment Research, Bloomberg
Exhibit 3: We expect both EMC and TUC GM to start the next round of expansion driven by solid AI demand and tightening S/D outlook
Source: Company data, Goldman Sachs Global Investment Research
Earnings revisions EMC
We revise up our 2026/27/28E net income estimates by 3/7/7% to factor in the faster
84%
3,419
-2%
For the exclusive use of KEVINLU@LENOVO.COM
Exhibit 4: Both EMC and TUC will expand more than 100%+ capacity in coming 2 years, while both companies future capacity has all been booked by high-end customers
Average monthly CCL capacity (k sheets/month)
Source: Company data, Goldman Sachs Global Investment Research e92c7a75ab8b4efbba794e6b187208c8
camble sue call selevision lavie
Exmolto. l0c earmings revision lable
EMC P&L (NT$ mn)
TUC P&L (NT$ mn)
Sales
Sales
Gross Profit
Gross Profit
EBIT
EBIT
Net Income
Net Income
EPS (NTS)
Ratio analysis
EPS (NT$)
Ratio analysis
Gross margin
EBIT margin
Gross margin
EBIT margin
Net margin
Diff.
Diff.
7%
7%
than expected high-end CCL demand growth and better CCL pricing outlook, and we also factor in a 1/4% high-end substrate revenue contribution in 2027/28E, suggesting a better GM outlook (revising up 2026/27/28E revenue by 2/5/4%, and revise up 2026/27/28E GM by 0.2/0.7/1.0ppt). 29.4% 0.8pp 0.8pp
Net margin
Exhibit 5: EMC earnings revision table
Source: Goldman Sachs Global Investment Research
TUC
We revise up our 2027/28E net income estimates by 1/5/7% to factor in the faster than expected high-end CCL demand growth and better CCL pricing outlook, as well as the company's solid expansion in high-end AI server and switching customers' market share (revising up 2026/27/28E revenue by 1/1/4%, and revise up 2026/27/28E GM by 0.6/1.1/1.1ppt).
Exhibit 6: TUC earnings revision table
Source: Goldman Sachs Global Investment Research
Valuation EMC
Maintain Buy on EMC, with a new TP of NT$10,200 from NT$9,500, based on the same 27x 2H27-1H28E EPS (in line with the peak P/E multiple for AI component suppliers in past 3 years), and factoring in our earnings revisions.
2026 New
For the exclusive use of KEVINLU@LENOVO.COM
2026 Old
2027 New
2027 Old
2028 New
2028E New
2028 Old
2028E Old e92c7a75ab8b4efbba794e6b187208c8
exmollo. lUe ral lable
NTSmn
1Q26
NTSmn
1Q26
Revenue
Revenue
Gross profit
Gross profit
Operating expense
Operating income
Operating expense
Operating income
Pretax income
Pretax income
Taxes expense
Net income
(2,601)
7,128
(701)
1,828
2Q26
2Q26
(3,269)
12.734
(892)
3,358
3Q26E
3Q26E
17.621|
57,349
21,117
5,835
(3,556)
17,561
(1,022)
4,813
4Q26E
4Q26E
59,952
19,785
22,649
6,897
(3,897)
18,752
(1,108)
5,789
7,194
1,874
18,752
17.561
12,785
3,427
4,813
5,269
Exhibit 7: EMC P&L table
Taxes expense
Net income
EPS, NTS
EPS, NTS
(4,126)
(1,265)
27.56
37.75
14.90
Ratio analysis and assumption
As % of sales
Ratio analysis and assumption
As % of sales
Gross margin
Gross margin
Operating expense ratio
Operating margin
Operating expense ratio
Operating margin
Net margin
Net margin
QoQ growth (%)
Revenue
QoQ growth (%)
Revenue
Gross profit
Gross profit
Operating income
Net in come
Operating income
Net income
YoY growth (%)
YoY growth (%)
Revenue
Gross profit
Revenue
Gross profit
Operating income
Operating income
Net income
3Q27E
3Q27E
94,459
33,587
38,502
12.468
(4,912)
33,591
(1,511)
10,956
10,956
33,591
(7.726)
25,865
(2,739)
8.217
28.14
2026E
2026E
197,643
61,760
69,498
19.510
(13,322)
(3,723)
15,787
56,176
56.293
(12,934)
15,383
(4,119)
11,264
43.362
121.03
38.63
4Q27E
4Q27E
109,822
39,348
46,151
14.883
(5,162)
40.990
(1,613)
13,270
40,990
(9.428)
13,270
(3,317)
9,952
31,562
88.10
34.08
2027E
2027E
120,421
353.024
143,548
44,457
(19,081)
124.467
(5,687)
38,770
37,850
124,467
(28,628)
95,840
(9,463)
28.388
97.22
1Q28E
1Q28E
41.153
122,256
52,156
15.466
(5,502)
46,655
_(1,708)
13,758
46,655
(10,731)
13,722
(3,431)
10,292
35.924
100.28
35.25
3Q28E
3Q28E
153.104
55,305
66,695
21.093
(6,277)
60.418
(1,963)
19,130
60,418
(13,896)
19,130
(4,782)
14.347
46,522
129.86
49.14
2028E
2028E
202,913
580,049
77.288
251,894
(24,385)
227,509
_(7,732)
69,556
69,485
227,509
(52,327)
175,182
(17,371)
52,114
178.48
2029E
2029E
827,957
297,071
(11,341)
106,329
339.766
339,766
(78,146)
106,258
(26,565)
79.694
261,620
730.27
272.94
4Q28E
4Q28E
165,161
60.569
72,969
23,533
(6,606)
66.362
(2,271)
21,262
21,262
66.362
(15,263)
51.099
(5,315)
15,946
54.61
2Q27E
2Q27E
81,696
25,821
32,690
9.395
(4,616)
28,075
(1,381)
8,013
7,613
28.075
(1.903)
(6,457)
21,618
60.34
1Q27E
1Q27E
67,047
21,664
7.712
26,204
(1,181)
(4,392)
6,531
21,813
21.813
(5,017)
6,011
(1,503)
4.508
16,796
46.88
2Q28E
2Q28E
139,528
45.886
60,074
17.196
(1,790)
(6,000)
15,407
54,074
54.074
(12,437)
15,372
(3,843)
11,529
41,637
116.22
2025
2025
94,261
30,340
28,120
6.898
(9,012)
19.108
(2,554)
4,344
4,519
18.876
(4.231)
14.649
(1,109)
3.409
4,005
5,710
| 4.36 | 8.02 12.53 | 13.72 15.44 | 19.56 | 39.48 | 12.13 | |||||||||||
|---|---|---|---|---|---|---|---|---|---|---|---|---|---|---|---|---|
| 29.4% | 33.9% | 36.8% | 37.8% | 39.1% | 40.0% | 40.8% | 42.0% 42.7% | 43.1% | 43.6% | 44.2% | 29.8% | 35.2% | 40.7% | 43.4% | 45.2% | |
| 7.9% 25.1% | 6.9% 29.7% | 62% 33.1% | 6.5% 34.9% | 6.6% 35.6% | 5.7% 36.4% | 5.2% 37.1% | 4.7% 37.8% 37.6% | 4.5% 4.3% 37.5% | 4.1% 38.1% | 4.0% 38.9% | 9.6% 22.7% | 6.7% 31.6% | 5.4% 36.9% | 4.2% 38.1% | 4.2% 39.6% | |
| 21.6% | 26.9% | 30.6% | 31.3% | 32.5% | 34.4% | 35.6% | 37.3% 38.2% | 38.8% 42% | 39.5% 40.2% 3.6% | 20.3% 8.4% | 28.4% 6.0% | 35.3% 4.7% | 39.2% 3.8% | 41.0% 3.8% | ||
| 16.1% | 20.9% 23.6% | 24.4% | 25.1% | 26.5% | 27.4% | 28.7% 29.4% | 29.8% 33.4% | 30.4% 33.6% | 30.9% 34.6% | 35.1% | 15.5% 14.3% | 21.9% 25.6% | 27.1% 32.2% | 30.2% 34.3% | 31.6% 35.8% | |
| 25.0% 25.1% | 25.9% | 26.3% | 11.2% | 18.2% | 23.6% | 25.7% | 26.8% | |||||||||
| 32.7% 10.2% | 43.0% 21.3% 42.2% 23.2% | 4.5% 11.8% 12.3% | 21.8% 19.2% | 15.6% | 16.3% 30.1% | 11.3% 17.2% | 14.1% 4.6% 11.5% | 9.7% 20.5% | 7.9% 9.5% | |||||||
| 36.6% 44.5% 64.5% 78.6% 32.0% 37.9% 7.3% 6.8% 15.7% 16.3% 24.8% 28.7% 17.8% 19.6% 19.9% 22.0% 13.0% 13.8% 15.2% 15.9% 11.0% 11.7% 9.4% 9.8% 21.8% 32.7% 19.4% 3.9% 11.2% 22.7% 11.6% | 36.6% 44.5% 64.5% 78.6% 32.0% 37.9% 7.3% 6.8% 15.7% 16.3% 24.8% 28.7% 17.8% 19.6% 19.9% 22.0% 13.0% 13.8% 15.2% 15.9% 11.0% 11.7% 9.4% 9.8% 21.8% 32.7% 19.4% 3.9% 11.2% 22.7% 11.6% | 36.6% 44.5% 64.5% 78.6% 32.0% 37.9% 7.3% 6.8% 15.7% 16.3% 24.8% 28.7% 17.8% 19.6% 19.9% 22.0% 13.0% 13.8% 15.2% 15.9% 11.0% 11.7% 9.4% 9.8% 21.8% 32.7% 19.4% 3.9% 11.2% 22.7% 11.6% | 36.6% 44.5% 64.5% 78.6% 32.0% 37.9% 7.3% 6.8% 15.7% 16.3% 24.8% 28.7% 17.8% 19.6% 19.9% 22.0% 13.0% 13.8% 15.2% 15.9% 11.0% 11.7% 9.4% 9.8% 21.8% 32.7% 19.4% 3.9% 11.2% 22.7% 11.6% | 36.6% 44.5% 64.5% 78.6% 32.0% 37.9% 7.3% 6.8% 15.7% 16.3% 24.8% 28.7% 17.8% 19.6% 19.9% 22.0% 13.0% 13.8% 15.2% 15.9% 11.0% 11.7% 9.4% 9.8% 21.8% 32.7% 19.4% 3.9% 11.2% 22.7% 11.6% | 36.6% 44.5% 64.5% 78.6% 32.0% 37.9% 7.3% 6.8% 15.7% 16.3% 24.8% 28.7% 17.8% 19.6% 19.9% 22.0% 13.0% 13.8% 15.2% 15.9% 11.0% 11.7% 9.4% 9.8% 21.8% 32.7% 19.4% 3.9% 11.2% 22.7% 11.6% | 36.6% 44.5% 64.5% 78.6% 32.0% 37.9% 7.3% 6.8% 15.7% 16.3% 24.8% 28.7% 17.8% 19.6% 19.9% 22.0% 13.0% 13.8% 15.2% 15.9% 11.0% 11.7% 9.4% 9.8% 21.8% 32.7% 19.4% 3.9% 11.2% 22.7% 11.6% | 36.6% 44.5% 64.5% 78.6% 32.0% 37.9% 7.3% 6.8% 15.7% 16.3% 24.8% 28.7% 17.8% 19.6% 19.9% 22.0% 13.0% 13.8% 15.2% 15.9% 11.0% 11.7% 9.4% 9.8% 21.8% 32.7% 19.4% 3.9% 11.2% 22.7% 11.6% | 36.6% 44.5% 64.5% 78.6% 32.0% 37.9% 7.3% 6.8% 15.7% 16.3% 24.8% 28.7% 17.8% 19.6% 19.9% 22.0% 13.0% 13.8% 15.2% 15.9% 11.0% 11.7% 9.4% 9.8% 21.8% 32.7% 19.4% 3.9% 11.2% 22.7% 11.6% | 36.6% 44.5% 64.5% 78.6% 32.0% 37.9% 7.3% 6.8% 15.7% 16.3% 24.8% 28.7% 17.8% 19.6% 19.9% 22.0% 13.0% 13.8% 15.2% 15.9% 11.0% 11.7% 9.4% 9.8% 21.8% 32.7% 19.4% 3.9% 11.2% 22.7% 11.6% | 36.6% 44.5% 64.5% 78.6% 32.0% 37.9% 7.3% 6.8% 15.7% 16.3% 24.8% 28.7% 17.8% 19.6% 19.9% 22.0% 13.0% 13.8% 15.2% 15.9% 11.0% 11.7% 9.4% 9.8% 21.8% 32.7% 19.4% 3.9% 11.2% 22.7% 11.6% | 36.6% 44.5% 64.5% 78.6% 32.0% 37.9% 7.3% 6.8% 15.7% 16.3% 24.8% 28.7% 17.8% 19.6% 19.9% 22.0% 13.0% 13.8% 15.2% 15.9% 11.0% 11.7% 9.4% 9.8% 21.8% 32.7% 19.4% 3.9% 11.2% 22.7% 11.6% | 36.6% 44.5% 64.5% 78.6% 32.0% 37.9% 7.3% 6.8% 15.7% 16.3% 24.8% 28.7% 17.8% 19.6% 19.9% 22.0% 13.0% 13.8% 15.2% 15.9% 11.0% 11.7% 9.4% 9.8% 21.8% 32.7% 19.4% 3.9% 11.2% 22.7% 11.6% | ||||
| 42.9% 84.9% 37.0% 8.2% 14.8% 28.7% 19.6% 22.0% 13.8% 15.9% 11.7% 9.8% 41.7% 83.7% 43.3% 20.3% 12.8% 22.7% 36.7% 21.1% 3.7% 12.0% 24.2% 11.1% | 42.9% 84.9% 37.0% 8.2% 14.8% 28.7% 19.6% 22.0% 13.8% 15.9% 11.7% 9.8% 41.7% 83.7% 43.3% 20.3% 12.8% 22.7% 36.7% 21.1% 3.7% 12.0% 24.2% 11.1% | 42.9% 84.9% 37.0% 8.2% 14.8% 28.7% 19.6% 22.0% 13.8% 15.9% 11.7% 9.8% 41.7% 83.7% 43.3% 20.3% 12.8% 22.7% 36.7% 21.1% 3.7% 12.0% 24.2% 11.1% | 42.9% 84.9% 37.0% 8.2% 14.8% 28.7% 19.6% 22.0% 13.8% 15.9% 11.7% 9.8% 41.7% 83.7% 43.3% 20.3% 12.8% 22.7% 36.7% 21.1% 3.7% 12.0% 24.2% 11.1% | 42.9% 84.9% 37.0% 8.2% 14.8% 28.7% 19.6% 22.0% 13.8% 15.9% 11.7% 9.8% 41.7% 83.7% 43.3% 20.3% 12.8% 22.7% 36.7% 21.1% 3.7% 12.0% 24.2% 11.1% | 42.9% 84.9% 37.0% 8.2% 14.8% 28.7% 19.6% 22.0% 13.8% 15.9% 11.7% 9.8% 41.7% 83.7% 43.3% 20.3% 12.8% 22.7% 36.7% 21.1% 3.7% 12.0% 24.2% 11.1% | 42.9% 84.9% 37.0% 8.2% 14.8% 28.7% 19.6% 22.0% 13.8% 15.9% 11.7% 9.8% 41.7% 83.7% 43.3% 20.3% 12.8% 22.7% 36.7% 21.1% 3.7% 12.0% 24.2% 11.1% | 42.9% 84.9% 37.0% 8.2% 14.8% 28.7% 19.6% 22.0% 13.8% 15.9% 11.7% 9.8% 41.7% 83.7% 43.3% 20.3% 12.8% 22.7% 36.7% 21.1% 3.7% 12.0% 24.2% 11.1% | 42.9% 84.9% 37.0% 8.2% 14.8% 28.7% 19.6% 22.0% 13.8% 15.9% 11.7% 9.8% 41.7% 83.7% 43.3% 20.3% 12.8% 22.7% 36.7% 21.1% 3.7% 12.0% 24.2% 11.1% | 42.9% 84.9% 37.0% 8.2% 14.8% 28.7% 19.6% 22.0% 13.8% 15.9% 11.7% 9.8% 41.7% 83.7% 43.3% 20.3% 12.8% 22.7% 36.7% 21.1% 3.7% 12.0% 24.2% 11.1% | 42.9% 84.9% 37.0% 8.2% 14.8% 28.7% 19.6% 22.0% 13.8% 15.9% 11.7% 9.8% 41.7% 83.7% 43.3% 20.3% 12.8% 22.7% 36.7% 21.1% 3.7% 12.0% 24.2% 11.1% | 42.9% 84.9% 37.0% 8.2% 14.8% 28.7% 19.6% 22.0% 13.8% 15.9% 11.7% 9.8% 41.7% 83.7% 43.3% 20.3% 12.8% 22.7% 36.7% 21.1% 3.7% 12.0% 24.2% 11.1% | 42.9% 84.9% 37.0% 8.2% 14.8% 28.7% 19.6% 22.0% 13.8% 15.9% 11.7% 9.8% 41.7% 83.7% 43.3% 20.3% 12.8% 22.7% 36.7% 21.1% 3.7% 12.0% 24.2% 11.1% | ||||
| 56.2% | 26.6% | 43.9% | 21.1% | 3.4% 12.0% | 24.4% | 11.1% | ||||||||||
| 52.5% 110.0% | 128.1% | 140.5% | 102.8% | 72.8% | 64.7% | 83.2% | 82.3% | 70.8% | 62.1% | 50.4% | 46% | 79% | 64% | |||
| 47.6% | 134.3% 178.7% 110.9% 118.5% | 217.9% 116.8% | 169.3% 115.5% | 104.3% 80.6% | 82.3% | 103.8% | 99.0% | 83.8% 77.7% | 73.2% 64.7% | 58.1% 53.9% | 56% 32% | 110% 147% 107% 104% | 95% | 75% 69% | 43% 49% 46% | |
| 251.9% 196.1% 204.7% | 280.0% | 206.0% | 120.5% | 118.6% | 113.9% | 92.6% | 79.9% 69.2% | 57% | 194% 183% 128% | 122% | 74% | 49% 52% | ||||
| 57.0% 53.9% 174.2% 183.9% 241.0% 291.4% 214.5% 118.9% 91.3% 91.3% 115.8% 113.9% 92.6% 79.9% 61.9% 61.9% 53% 293.9% 280.3% 348.9% 257.4% 138.6% 127.7% 129.2% 110.7% 92.3% 74.6% 60.2% 30% | 57.0% 53.9% 174.2% 183.9% 241.0% 291.4% 214.5% 118.9% 91.3% 91.3% 115.8% 113.9% 92.6% 79.9% 61.9% 61.9% 53% 293.9% 280.3% 348.9% 257.4% 138.6% 127.7% 129.2% 110.7% 92.3% 74.6% 60.2% 30% | 57.0% 53.9% 174.2% 183.9% 241.0% 291.4% 214.5% 118.9% 91.3% 91.3% 115.8% 113.9% 92.6% 79.9% 61.9% 61.9% 53% 293.9% 280.3% 348.9% 257.4% 138.6% 127.7% 129.2% 110.7% 92.3% 74.6% 60.2% 30% | 57.0% 53.9% 174.2% 183.9% 241.0% 291.4% 214.5% 118.9% 91.3% 91.3% 115.8% 113.9% 92.6% 79.9% 61.9% 61.9% 53% 293.9% 280.3% 348.9% 257.4% 138.6% 127.7% 129.2% 110.7% 92.3% 74.6% 60.2% 30% | 57.0% 53.9% 174.2% 183.9% 241.0% 291.4% 214.5% 118.9% 91.3% 91.3% 115.8% 113.9% 92.6% 79.9% 61.9% 61.9% 53% 293.9% 280.3% 348.9% 257.4% 138.6% 127.7% 129.2% 110.7% 92.3% 74.6% 60.2% 30% | 57.0% 53.9% 174.2% 183.9% 241.0% 291.4% 214.5% 118.9% 91.3% 91.3% 115.8% 113.9% 92.6% 79.9% 61.9% 61.9% 53% 293.9% 280.3% 348.9% 257.4% 138.6% 127.7% 129.2% 110.7% 92.3% 74.6% 60.2% 30% | 57.0% 53.9% 174.2% 183.9% 241.0% 291.4% 214.5% 118.9% 91.3% 91.3% 115.8% 113.9% 92.6% 79.9% 61.9% 61.9% 53% 293.9% 280.3% 348.9% 257.4% 138.6% 127.7% 129.2% 110.7% 92.3% 74.6% 60.2% 30% | 57.0% 53.9% 174.2% 183.9% 241.0% 291.4% 214.5% 118.9% 91.3% 91.3% 115.8% 113.9% 92.6% 79.9% 61.9% 61.9% 53% 293.9% 280.3% 348.9% 257.4% 138.6% 127.7% 129.2% 110.7% 92.3% 74.6% 60.2% 30% | 57.0% 53.9% 174.2% 183.9% 241.0% 291.4% 214.5% 118.9% 91.3% 91.3% 115.8% 113.9% 92.6% 79.9% 61.9% 61.9% 53% 293.9% 280.3% 348.9% 257.4% 138.6% 127.7% 129.2% 110.7% 92.3% 74.6% 60.2% 30% | 57.0% 53.9% 174.2% 183.9% 241.0% 291.4% 214.5% 118.9% 91.3% 91.3% 115.8% 113.9% 92.6% 79.9% 61.9% 61.9% 53% 293.9% 280.3% 348.9% 257.4% 138.6% 127.7% 129.2% 110.7% 92.3% 74.6% 60.2% 30% | 57.0% 53.9% 174.2% 183.9% 241.0% 291.4% 214.5% 118.9% 91.3% 91.3% 115.8% 113.9% 92.6% 79.9% 61.9% 61.9% 53% 293.9% 280.3% 348.9% 257.4% 138.6% 127.7% 129.2% 110.7% 92.3% 74.6% 60.2% 30% | 57.0% 53.9% 174.2% 183.9% 241.0% 291.4% 214.5% 118.9% 91.3% 91.3% 115.8% 113.9% 92.6% 79.9% 61.9% 61.9% 53% 293.9% 280.3% 348.9% 257.4% 138.6% 127.7% 129.2% 110.7% 92.3% 74.6% 60.2% 30% | 57.0% 53.9% 174.2% 183.9% 241.0% 291.4% 214.5% 118.9% 91.3% 91.3% 115.8% 113.9% 92.6% 79.9% 61.9% 61.9% 53% 293.9% 280.3% 348.9% 257.4% 138.6% 127.7% 129.2% 110.7% 92.3% 74.6% 60.2% 30% | 196% 263% | 121% 146% | 83% 83% 79% | 49% 53% |
| 259.3% 264.8% | 270.0% | 257.8% | 148.5% | 128.3% | 101.9% | 74.6% 60.2% | 31% | 230% 152% | 84% | 53% |
Source: Company data, Goldman Sachs Global Investment Research
TUC
We maintain Buy on TUC, with new TP of NT$3,010 (from NT$2,860) which is based on an unchanged 22x on 2H27-1H28E P/E, which is +2x STDV higher than the past 3-year industry average P/E multiple, and factoring in our earnings revisions.
41.67
142.63
488.99
267.52
72.20
Net income
For the exclusive use of KEVINLU@LENOVO.COM
40.83
Exhibit 8: TUC P&L table
Source: Company data, Goldman Sachs Global Investment Research
Investment Thesis & PT methodology and risks
EMC, a key supplier of high-end HDI material (70%+ market share) and SLP material (90%+ market share), has been focusing on the high-speed switch/server CCL market for 3-5+ years. We are positive on its market share trajectory in the server industry and expect EMC to increase its share from <10% in the Purley generation to 15-20%/20+% in the Whitley/Eagle Stream platforms. EMC is also proactively expanding its share in the switch market (40%/30%+ in 2024/23 vs. <5% before 2019), with an expanding AI customer base (only one 400G customer in 3Q20, to being one of the largest suppliers in e92c7a75ab8b4efbba794e6b187208c8
For the exclusive use of KEVINLU@LENOVO.COM
2023), which should continue to bene fi t the company's top/bottom line growth over time. We believe EMC's leading position in the AI server CCL market should drive strong revenue growth and GM/OPM expansion in the long term, given that it is the major supplier for all Nvidia/Google/AWS AI server projects, and we expect it to maintain its leadership position. Considering its leading position in the high-end CCL industry, solid production skills and earnings growth outlook, we are Buy rated on the stock. With the shares trading at a 2026E P/E below AI server component suppliers and supported by a solid growth outlook, we view valuation as attractive.
Key downside risks include: (1) RCC to replace all high-end smartphone HDI design; (2) rising trade tensions, which could lead to weaker smartphone and server shipments; and (3) rising competition from mainland China peers.
Valuation methodology: Our 12m TP of NT$10,200 is based on 27x 2H27-1H28E P/E (in line with the peak P/E multiple for AI component suppliers in the past 3 years).
Key downside risks: (1) RCC to replace all high-end smartphone HDI design; (2) rising trade tensions, which could lead to weaker smartphone and server shipments; and (3) rising competition from mainland China peers.
TUC is a key high-end global CCL supplier that focuses on M7+ grade high-speed CCL (key applications include high-end switches (100G+) and AI server materials), with 20%+ market share in the past two years. The company continues to expect its unit market share in the server industry to increase from 15% in Whitley and Purley processors to higher in the Eagle Stream generation, and plans to launch two types of p roducts for low-end and high-end customers (T2A and T2C) to gain market share. Also, strong growth in 400G/800G switch shipments and new 800G switch shipments, scheduled for launch in 2025-27, should continue to be a key demand driver for TUC, in our view. Additionally, the company is working on high-end AI projects with CSP and enterprise players, which we believe should drive revenue momentum in the long term. We view the stock as undervalued vs. Taiwan CCL peers on a P/E basis and rate it Buy.
Key downside risks include: (1) slower-than-expected share gains in the low-loss CCL segment; (2) rising trade tensions, which could lead to weaker server and switch shipments globally; and (3) rising competition from mainland China peers.
Valuation methodology: Our 12m TP of NT$3,010 is based on a 22x 2027E P/E (+2x STDV higher than the past 3-year industry average P/E multiple).
Key downside risks: (1) slower-than-expected share gains in the low-loss CCL segment; (2) rising trade tensions, which could lead to weaker server and switch shipments globally; and (3) rising competition from mainland China peers.
e92c7a75ab8b4efbba794e6b187208c8
For the exclusive use of KEVINLU@LENOVO.COM