PDF 原檔:報告_BofA_記憶體週報_20260711_original.pdf
原始內容
Global Memory Tech
Global Memory Tech
Weekly theme: Samsung correction, strong indicator, CXMT IPO, Nanya Tech upturn
Industry Overview
Samsung share-price correction vs strong fundamentals
Many investors have asked why Samsung Electronics ' share price corrected despite reporting (7 July) strong 2Q OP of W89.4tn. In our view, the bearish sentiment stemmed from following concerns: (1) Meta US -chip order cut; (2) CXMT China -large capacity; and (3) QoQ growth -no longer strong after 2Q peak. That said, we don ' t see any downturn signals -our weekly channel check still indicates strong memory chip demand (from US Big Tech), low impact of CXMT (no severe competition), and more favorable 3Q ASP (many new quarterly contracts already reveal 20%+ price hike, in our view). In fact, we have slightly raised 3Q DRAM ASP assumptions in our global memory industry model (new: +21% QoQ vs old +17%); see Exhibit 15 for our new forecast summary.
Super-cycle reconfirmed by BofA memory indicator
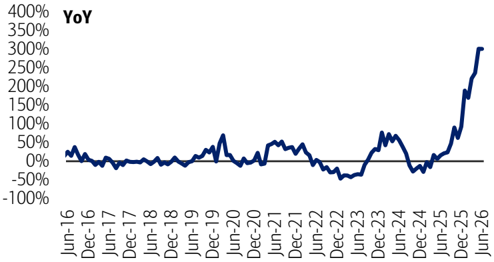
Our memory indicator, which is based on YoY changes in spot price, global billings, Korea exports, etc., remained at a record-high level, with May results at 183 -far above 2017/ 2024 peaks (120-130; mid-cycle: 100; downturn: 80). DRAM/NAND global billings grew more than 300% YoY in May, according to our analysis using WSTS ' s data. We also note solid June sales (Nanya Tech: +621% YoY; Phison +301% YoY), exports (Korea semis: +199%) and DRAM spot (+700%; even NAND shows +600% despite MoM drop). One of the most interesting point in Jun results was resumption of DRAM spot rally MoM (+11% on average vs -4%/+3% in Apr/May) but this is weaker than Korea ' s semis exports (+21% MoM) that include more high-end memory (HBM4, SOCAMM, etc.) vs May level.
CXMT's IPO share subscription date announced - 16 July
CXMT, China-based DRAM manufacturer, stated the firm ' s IPO share subscription date will be 16 July. Thus, actual listing can happen in late-July if the government regulations are properly followed. CXMT has disclosed its 2Q26 sales guidance (CNY59-69bn; ~US$9.5bn). This is 7x YoY growth but still only high-single-digit% of global DRAM market share despite large wafer capacity (high-200k wpm or 300k, according to media reports; this accounts for mid-teen% of global total DRAM capacity). We still assume high-end DRAM (10Ghz+ LPDDR5, HBM, SOCAMM, GDDR7, etc.) will be supplied mostly by ex-China memory chipmakers due to quality and US ' s strict control (on China semis).
Nanya Tech's legacy DRAM more profitable vs HBM
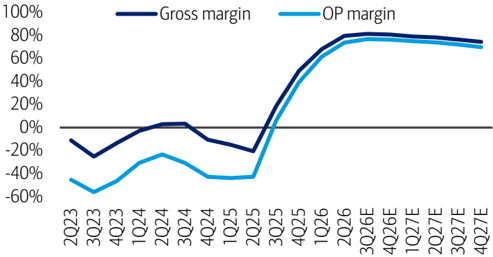
Nanya Tech reported very strong 2Q results (sales up 684% YoY; OP margin 74% vs large loss or -43% a year ago). The key contributor was DRAM ASP rise (up 60%+ QoQ; 500%+ YoY). Management ' s guidance was also bullish for 3Q and even for the long term (shortage of legacy DRAM such as DDR3 & 4 continues, low impact of China memory players ' capacity expansion, etc). We also learned that Nanya Tech ' s DRAM business is more profitable than HBM. Since 2Q results were broadly in line with our already bullish forecasts, our EPS estimate changes (2026-28) are almost nil and, as such, PO (NT$660; 9x 2027-28E P/E) is unchanged; maintain Buy on solid earnings and low multiples.
>> Employed by a non-US affiliate of BofAS and is not registered/qualified as a research analyst under the FINRA rules.
Refer to "Other Important Disclosures" for information on certain BofA Securities entities that take responsibility for the information herein in particular jurisdictions.
BofA Securities does and seeks to do business with issuers covered in its research reports. As a result, investors should be aware that the firm may have a conflict of interest that could affect the objectivity of this report. Investors should consider this report as only a single factor in making their investment decision.
Refer to important disclosures on page 32 to 35. Analyst Certification on page 30. Price Objective Basis/Risk on page 29. 12992970
Timestamp: 10 July 2026 07:52PM EDT
11 July 2026
Equity Global Technology
Simon Woo, CFA >> Research Analyst Merrill Lynch (Seoul) +82 2 3707 0554
simon.woo@bofa.com
Dai Shen >> Research Analyst Merrill Lynch (Hong Kong) dai.shen@bofa.com
Vivek Arya Research Analyst BofAS vivek.arya@bofa.com
Mikio Hirakawa >> Research Analyst BofAS Japan mikio.hirakawa@bofa.com
Matt Shin >> Research Analyst Merrill Lynch (Seoul) matt.shin2@bofa.com
Exhibit 1: Global memory outlook supercycle likely to continue through 2027 despite 2026 quadrupling
BofA global memory forecasts
| YoY | 24 | 25 | 26E | 27E |
|---|---|---|---|---|
| DRAM sales | 86% | 52% | 325% | 45% |
| NAND sales | 84% | 4% | 299% | 30% |
| DRAM ASP | 62% | 29% | 249% | 25% |
| NAND ASP | 65% | -8% | 238% | 9% |
| DRAM bit | 15% | 18% | 22% | 17% |
| NAND bit | 11% | 13% | 18% | 20% |
| DRAM capex | 49% | 43% | 65% | 27% |
| NAND capex | 4% | -5% | 55% | 18% |
| DRAM capa | 7% | 8% | 11% | 9% |
| NAND capa | -2% | -7% | 5% | 4% |
Source:
BofA Global Research estimates
BofA GLOBAL RESEARCH
Exhibit 2: DDR5 and DDR4 price up in Jun/early-Jul, while NAND prices softened
Spot-market prices among DRAM and NAND
| US$ | Current | WoW | QoQ | YoY |
|---|---|---|---|---|
| DRAM spot | ||||
| 16Gb DDR5 | 47.8 | 2% | 29% | 688% |
| 16Gb DDR4 | 77.6 | 2% | 9% | 825% |
| 8Gb DDR4 | 37.8 | 3% | 13% | 661% |
| NAND spot | ||||
| 1Tb wafer | 24.2 | -1% | -9% | 377% |
| 512Gb wafer | 19.3 | -3% | -11% | 621% |
| 256Gb wafer | 10.2 | 0% | -7% | 578% |
Source:
DRAMeXchange
BofA GLOBAL RESEARCH
ASP-driven memory super-cycle to continue
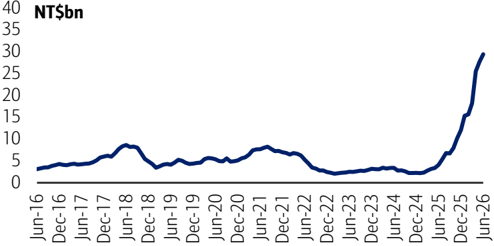
Exhibit 3: New record-high in Jun (NT$29.4bn; +6% MoM); more than 5x higher than 2025-avg (NT$5.5bn)
Nanya Tech - Monthly sales (Jun 2026)
Source: Company
BofA GLOBAL RESEARCH
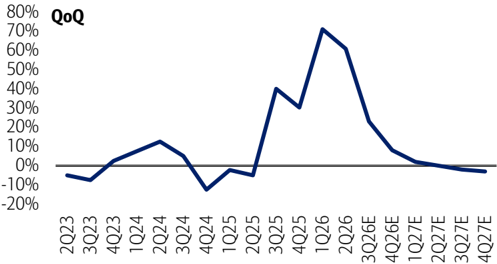
Exhibit 5: Exceptionally strong ASP hike in 2Q (up >60% QoQ) even after robust 1Q (up >70%); we assume decelerating growth in 2H, but still strong at 23%/8% in 3Q/4Q, respectively; no downturn in 2027 - just softening ASP QoQ (still super-cycle)
Nanya Tech DRAM ASP trend - quarterly; 8Gb equiv.
Source: Company, BofA Global Research estimates
BofA GLOBAL RESEARCH
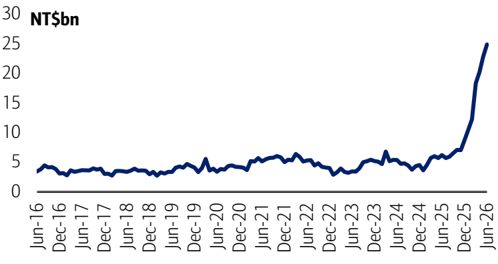
Exhibit 7: Also at all-time high in Jun (NT$24.9bn; +9% MoM); more than 4x higher than 2025-avg (NT$6.1bn)
Phison Electronics - Monthly sales (Jun 2026)
Source: Company
BofA GLOBAL RESEARCH
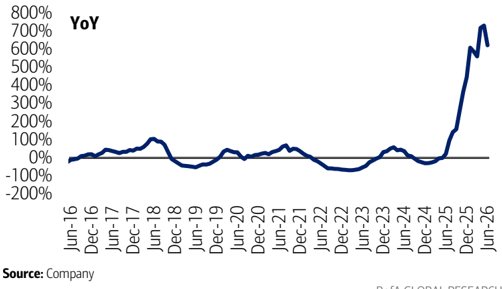
Exhibit 4: Robust YoY growth continued in Jun (+621%); already 11 consecutive months of triple-digit rebound
Nanya Tech - YoY monthly sales (Jun 2026)
BofA GLOBAL RESEARCH
Exhibit 6: We expect robust margins to continue in 2H26-27 (GM/OPM 70%+); record-high margins well-proved in 2Q (GM 79%, OPM 74%)
Nanya Tech - Gross and OP margin trend
Source: Company, BofA Global Research estimates
BofA GLOBAL RESEARCH
Exhibit 8: Strong YoY growth continued in Jun (+621%); already six consecutive months of triple-digit rebound
Phison Electronics - YoY monthly sales (Jun 2026)
Source: Company
BofA GLOBAL RESEARCH
Exhibit 9: Given 2Q results were broadly in-line with our already bullish forecasts, our EPS estimate changes (2026-28) are almost nil and consequently PO (NT$660; 9x 2027-28E P/E) is unchanged; reiterate Buy on strong earnings and low multiples
Nanya Tech - Earnings revisions (2026-28E)
| (NT$bn, NT$) | 1Q26 | 2Q26 | 3Q26E | 4Q26E | 1Q27E | 2Q27E | 3Q27E | 4Q27E | 2022 | 2023 | 2024 | 2025 | 2026E | 2027E | 2028E |
|---|---|---|---|---|---|---|---|---|---|---|---|---|---|---|---|
| New | 8.3 | 14.6 | 18.7 | 20.2 | 20.8 | 21.3 | 21.9 | 20.7 | 4.7 | -2.4 | -1.6 | 2.1 | 62.6 | 84.6 | 68.3 |
| Old | 8.3 | 14.7 | 19.0 | 20.5 | 20.9 | 21.3 | 21.8 | 20.6 | 4.7 | -2.4 | -1.6 | 2.1 | 62.6 | 84.7 | 68.0 |
| Diff | n/a | -1% | -2% | -1% | -1% | 0% | 0% | 0% | n/a | n/a | n/a | n/a | 0% | 0% | 0% |
| Dividend/share | |||||||||||||||
| New | 0.0 | 1.4 | 0.0 | 0.0 | 0.0 | 20.0 | 0.0 | 0.0 | 2.1 | 0.0 | 0.0 | 1.4 | 20.0 | 25.0 | 25.0 |
| Old | 0.0 | 1.4 | 0.0 | 0.0 | 0.0 | 20.0 | 0.0 | 0.0 | 2.1 | 0.0 | 0.0 | 1.4 | 20.0 | 25.0 | 25.0 |
| Difference | n/a | nm | nm | nm | nm | nm | nm | nm | n/a | n/a | n/a | n/a | 0% | 0% | 0% |
| Sales total | |||||||||||||||
| New | 49.1 | 82.5 | 110.7 | 120.5 | 126.2 | 130.9 | 138.1 | 134.8 | 57.0 | 29.9 | 34.1 | 66.6 | 362.9 | 530.0 | 519.2 |
| Old | 49.1 | 82.2 | 102.6 | 111.6 | 116.8 | 121.1 | 127.8 | 124.8 | 57.0 | 29.9 | 34.1 | 66.6 | 345.5 | 490.5 | 480.5 |
| Diff | n/a | 0% | 8% | 8% | 8% | 8% | 8% | 8% | n/a | n/a | n/a | n/a | 5% | 8% | 8% |
| OP margin | |||||||||||||||
| New | 61.3% | 73.7% | 76.7% | 76.2% | 74.9% | 73.8% | 72.0% | 69.7% | 19.3% | -48.4% | -30.9% | 7.9% | 73.8% | 72.5% | 59.8% |
| Old | 61.3% | 72.5% | 75.6% | 75.1% | 73.2% | 71.8% | 69.8% | 67.3% | 19.3% | -48.4% | -30.9% | 7.9% | 72.7% | 70.5% | 57.8% |
| Diff | n/a | 1.1% | 1.1% | 1.1% | 1.7% | 2.0% | 2.2% | 2.3% | n/a | n/a | n/a | n/a | 1.1% | 2.1% | 2.0% |
| EBITDA | |||||||||||||||
| New | 33.0 | 63.8 | 87.8 | 94.9 | 97.5 | 99.8 | 102.7 | 97.4 | 26.2 | 0.9 | 5.6 | 19.5 | 279.5 | 397.4 | 326.3 |
| Old | 33.0 | 62.6 | 80.5 | 86.8 | 88.5 | 90.2 | 92.5 | 87.5 | 26.2 | 0.9 | 5.6 | 19.5 | 262.9 | 358.7 | 293.5 |
| Diff | n/a | 2% | 9% | 9% | 10% | 11% | 11% | 11% | n/a | n/a | n/a | n/a | 6% | 11% | 11% |
| Capex | |||||||||||||||
| New | 2.8 | 4.0 | 15.0 | 28.1 | 18.0 | 16.0 | 17.0 | 19.0 | 20.7 | 13.2 | 16.1 | 13.4 | 50.0 | 70.0 | 70.0 |
| Old | 2.8 | 10.0 | 15.0 | 27.2 | 18.0 | 16.0 | 17.0 | 19.0 | 20.7 | 13.2 | 16.1 | 13.4 | 55.0 | 70.0 | 70.0 |
| Diff | n/a | -60% | 0% | 4% | 0% | 0% | 0% | 0% | n/a | n/a | n/a | n/a | -9% | 0% | 0% |
| DRAM sales (US$mn) | |||||||||||||||
| New | 1,551 | 2,612 | 3,325 | 3,645 | 3,840 | 4,002 | 4,248 | 4,160 | 1,935 | 958 | 1,062 | 2,156 | 11,133 | 16,249 | 16,082 |
| Old | 1,551 | 2,411 | 3,060 | 3,356 | 3,537 | 3,687 | 3,915 | 3,833 | 1,935 | 958 | 1,062 | 2,156 | 10,378 | 14,972 | 14,820 |
| Diff | n/a | 8% | 9% | 9% | 9% | 9% | 9% | 9% | n/a | n/a | n/a | n/a | 7% | 9% | 9% |
| Shipments (8Gb, mn) | |||||||||||||||
| New | 220 | 220 | 224 | 226 | 233 | 243 | 262 | 265 | 447 | 429 | 450 | 705 | 890 | 1,002 | 1,154 |
| Old | 220 | 212 | 216 | 219 | 225 | 234 | 253 | 255 | 447 | 429 | 450 | 705 | 867 | 967 | 1,114 |
| Diff | n/a | 4% | 4% | 4% | 4% | 4% | 4% | 4% | n/a | n/a | n/a | n/a | 3% | 4% | 4% |
| ASP US$/8b equiv | |||||||||||||||
| New | 7.90 | 12.70 | 15.62 | 16.87 | 17.21 | 17.21 | 16.86 | 16.36 | 4.49 | 2.52 | 2.86 | 3.54 | 13.31 | 16.89 | 14.50 |
| Old | 7.90 | 12.23 | 14.98 | 16.18 | 16.50 | 16.50 | 16.17 | 15.69 | 4.49 | 2.52 | 2.86 | 3.54 | 12.81 | 16.20 | 13.91 |
| Diff | n/a | 4% | 4% | 4% | 4% | 4% | 4% | 4% | n/a | n/a | n/a | n/a | 4% | 4% | 4% |
| ASP chg (QoQ/YoY) | |||||||||||||||
| New | 71% | 61% | 23% | 8% | 2% | 0% | -2% | -3% | -10% | -44% | 13% | 24% | 276% | 27% | -14% |
| Old | 71% | 55% | 23% | 8% | 2% | 0% | -2% | -3% | -10% | -44% | 13% | 24% | 262% | 26% | -14% |
| Diff | n/a | 6% | 1% | 0% | 0% | 0% | 0% | 0% | n/a | n/a | n/a | n/a | 14% | 0% | 0% |
| Cost US$/8Gb equiv | |||||||||||||||
| New | 3.05 | 3.34 | 3.64 | 4.01 | 4.33 | 4.50 | 4.73 | 4.96 | 3.61 | 3.75 | 3.74 | 3.30 | 3.52 | 4.64 | 5.83 |
| Old | 3.05 | 3.36 | 3.66 | 4.03 | 4.43 | 4.65 | 4.88 | 5.13 | 3.61 | 3.75 | 3.74 | 3.30 | 3.53 | 4.79 | 5.88 |
| Diff | n/a | -2% | -2% | -2% | -10% | -15% | -16% | -17% | n/a | n/a | n/a | n/a | -1% | -14% | -4% |
| Bit growth (QoQ/YoY) | |||||||||||||||
| New | 0% | 0% | 0% | 0% | 0% | 0% | 0% | 0% | -27% | -4% | 5% | 57% | 26% | 13% | 15% |
| Old | 0% | 0% | 0% | 0% | 0% | 0% | 0% | 0% | -27% | -4% | 5% | 57% | 23% | 12% | 15% |
| Diff | n/a | 0% | 0% | 0% | 0% | 0% | 0% | 0% | n/a | n/a | n/a | n/a | 3% | 1% | 0% |
Source:
Company, BofA Global Research estimates
BofA GLOBAL RESEARCH
BofA Memory Indicator
Exhibit 10: Our memory indicator still near all-time high level in May (183) vs 186/189/189 in Feb/Mar/Apr-26, driven by exceptionally strong DRAM/NAND spot pricing, rising ASPs and billings, along with Korea's 150%+ export growth.
BofA Memory Indicator - back to upturn level since Oct-2025 and hit highest peak in Mar/Apr-26 (back-tested)
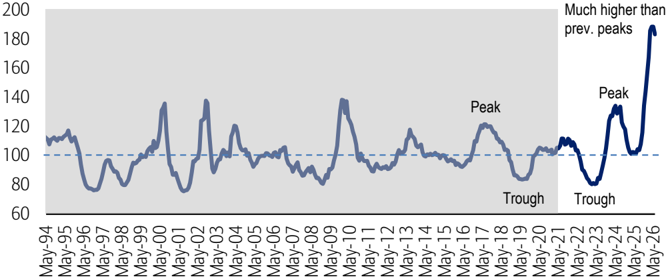
Note: Our indicator had previously been capped at ~140, but the recent unprecedented surge-driven by memory spot prices, ASPs, and billings-has led us to raise the ceiling (up to 240 levels) to reflect a more accurate relative comparison. This exceptional strength is further validated by strong earnings from memory chipmakers.
Source: DRAMeXchange, WSTS, MoTIR Korea, BofA Global Research
*The shaded area represents back-tested results from January 1991 to March 2021. The unshaded area represents actual performance since April 2021. This performance is back-tested up to March-2021, and does not represent the actual performance of any account or fund. Back-tested performance depicts the theoretical (not actual) performance of a particular strategy over the time period indicated. No representation is being made that any actual portfolio is likely to have achieved returns similar to those shown herein.
Disclaimer: The BofA Memory Indicator is intended to be an indicative metric only and may not be used for reference purposes or as a measure of performance for any financial instrument or contract, or otherwise relied upon by third parties for any other purpose, without the prior written consent of BofA Global Research. This indicator was not created to act as a benchmark. For methodology, see the 5 Aug 2024 Global Memory Tech report.
BofA GLOBAL RESEARCH
Exhibit 11: Mild setback in memory companies' stock prices in early-July, but still near record highs, supported by Samsung (strong 2Q prelim, optimism around HBM4 upside, and higher exposure to conventional DRAM), Micron (solid May-Q results and strong Aug-Q guidance), and Nanya Tech (record Jan-Jun monthly sales, up ~500-700% YoY).
BofA Memory Indicator is highly correlated with stock performance (back-tested)
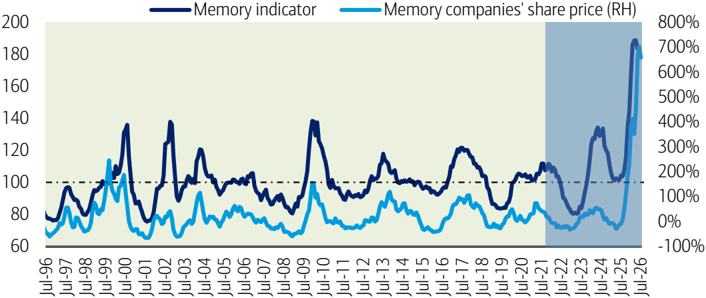
Note: Memory companies share price is average of Samsung, Micron, and Nanya share price YoY changes
Source: Bloomberg, BofA Global Research
The light green shaded area represents back-tested results from January 1991 to March 2021. The blue shaded area represents actual data since April 2021. This performance is back-tested and does not represent the actual performance of any account or fund. Back-tested performance depicts the theoretical (not actual) performance of a particular strategy over the time period indicated. No representation is being made that any actual portfolio is likely to have achieved returns similar to those shown herein. For methodology, see the 5 Aug 2024 Global Memory Tech report.
BofA GLOBAL RESEARCH
Exhibit 12: HBM, DDR5, and legacy DRAM drove a strong YoY rebound in May, with DRAM ASP/billings up +252%/+309% and NAND +331%/+377%; momentum carried into Jun with sharp YoY gains in spot pricing (DRAM +723%, NAND +647%) and Korea semiconductor exports rising near-3x Seven components of BofA Memory Indicator - MoM and YoY trends (back-tested)
| Jun-25 | Jul-25 | Aug-25 | Sep-25 | Oct-25 | Nov-25 | Dec-25 | Jan-26 | Feb-26 | Mar-26 | Apr-26 | May-26 | Jun-26 | |
|---|---|---|---|---|---|---|---|---|---|---|---|---|---|
| MoM | |||||||||||||
| DRAM spot price | Up | Up | Up | Up | Up | Up | Up | Up | Up | Up | Down | Up | Up |
| NAND spot price | Down | Down | Up | Up | Up | Up | Up | Up | Up | Up | Down | Down | Down |
| Korea semis exports | Up | Down | Up | Up | Down | Up | Up | Up | Up | Up | Down | Up | Up |
| DRAM ASP | Down | Up | Up | Up | Up | Up | Up | Up | Up | Up | Up | Up | na |
| NAND ASP | Down | Up | Down | Down | Up | Up | Up | Up | Up | Up | Up | Up | na |
| DRAM billings | Up | Up | Up | Up | Down | Up | Up | Down | Up | Up | Down | Up | na |
| NAND billings | Up | Down | Up | Up | Down | Up | Up | Up | Up | Up | Down | Up | na |
| Avg of MoMtrend | Up | Down | Up | Up | Up | Up | Up | Up | Up | Up | Up | Up | na |
| YoY | |||||||||||||
| DRAM spot price | Up | Up | Up | Up | Up | Up | Up | Up | Up | Up | Up | Up | Up |
| NAND spot price | Down | Down | Down | Up | Up | Up | Up | Up | Up | Up | Up | Up | Up |
| Korea semis exports | Up | Up | Up | Up | Up | Up | Up | Up | Up | Up | Up | Up | Up |
| DRAM ASP | Up | Up | Up | Up | Up | Up | Up | Up | Up | Up | Up | Up | na |
| NAND ASP | Down | Down | Down | Down | Down | Up | Up | Up | Up | Up | Up | Up | na |
| DRAM billings | Up | Up | Up | Up | Up | Up | Up | Up | Up | Up | Up | Up | na |
| NAND billings | Down | Down | Down | Up | Up | Up | Up | Up | Up | Up | Up | Up | na |
| Avg of YoY trend | Up | Up | Up | Up | Up | Up | Up | Up | Up | Up | Up | Up | na |
| Memory indicator | 102 | 105 | 104 | 108 | 116 | 135 | 144 | 168 | 186 | 189 | 189 | 183 | na |
Source: DRAMeXchange, WSTS, MoTIE Korea, BofA Global Research estimates. This performance is back-tested and does not represent the actual performance of any account or fund. Back-tested performance depicts the theoretical (not actual) performance of a particular strategy over the time period indicated. No representation is being made that any actual portfolio is likely to have achieved returns similar to those shown herein. Notes: *May-26 results recovered in all aspects in terms of YoY growth, but softened in terms of MoM change for DRAM/NAND billings and NAND spot price due to high base level in Apr-26
**For Jun-26, only spot prices and exports are reported so far
***DRAM spot price is based on weighted average MoM change of16Gb DDR5, 16Gb DDR4 and 8Gb DDR4; NAND spot price is based on MoM change in 512Gb wafer spot price
Exhibit 13: Exceptionally strong DRAM/NAND spot pricing persisted through May-Jun, with DRAM ASPs and billings also rising sharply in May, while semiconductor exports remained robust, reaching record highs in Jun
Seven components of BofA Memory Indicator - YoY
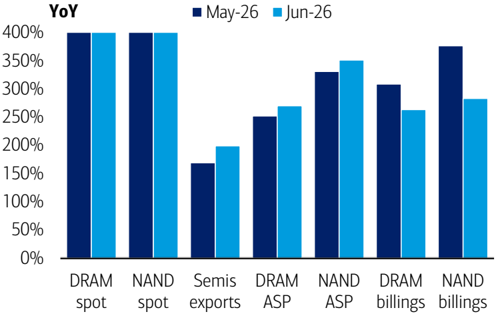
All May data and Jun spot/exports are actual, but Jun billings are our estimates *DRAM spot up +839%/723% YoY and NAND spot up +646%/647% YoY in May/Jun
Source: DRAMeXchange, WSTS, MoTIR Korea, BofA Global Research estimates
BofA GLOBAL RESEARCH
BofA GLOBAL RESEARCH
Exhibit 14: Solid price hike in DRAM spot seen in Jun vs NAND spot slightly down following a sharp rally in 4Q25/1Q26; semis exports rebounded strongly MoM in May-Jun, while DRAM/NAND ASP and billingss remained elevated in May
Seven components of BofA Memory Indicator - MoM
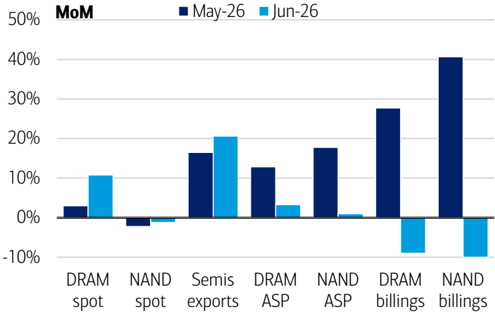
*All May data and Jun spot/exports are actual, but Jun billings are our estimates
Source:
DRAMeXchange, WSTS, MoTIR Korea, BofA Global Research estimates
BofA GLOBAL RESEARCH
Global memory forecasts
Exhibit 15: We expect global DRAM revenue to nearly quadruple (+325% YoY) in 2026E, building on the strong growth trajectory of 86%/52% in 2024/25, primarily driven by a sharp ~3x rebound in ASPs (+249% YoY). NAND revenue is similarly forecast to increase nearly fourfold (+299% YoY) in 2026E, following modest low-single-digit growth in 2025, supported by a robust ~2.3x expansion in ASPs (+238% YoY).
Global memory forecast summary - top-down approach
| 1Q26 | 2Q26E | 3Q26E | 4Q26E | 1Q27E | 2Q27E | 3Q27E | 4Q27E | 2021 | 2022 | 2023 | 2024 | 2025 | 2026E | 2027E | 2028E | |
|---|---|---|---|---|---|---|---|---|---|---|---|---|---|---|---|---|
| Revenue US$bn DRAM | 83.9 | 134.6 | 167.7 | 182.6 | 191.8 | 200.1 | 213.3 | 221.2 | 92.1 | 77.7 | 47.3 | 87.9 | 133.8 | 568.8 | 826.4 | 900.7 |
| NAND | 45.3 | 78.9 | 96.4 | 102.4 | 101.7 | 103.1 | 106.8 | 108.8 | 73.3 | 67.3 | 42.4 | 78.1 | 81.0 | 323.1 | 420.4 | 421.5 |
| DRAM+NAND total | 129.2 | 213.6 | 264.1 | 285.0 | 293.5 | 303.2 | 320.1 | 329.9 | 165.4 | 144.9 | 89.7 | 166.0 | 214.8 | 891.8 | 1,246.8 | 1,322.2 |
| %QoQ | ||||||||||||||||
| DRAM | 78% | 60% | 25% | 9% | 5% | 4% | 7% | 4% | ||||||||
| NAND | 71% | 74% | 22% | 6% | -1% | 1% | 4% | 2% | ||||||||
| DRAM/NAND total | 75% | 65% | 24% | 8% | 3% | 3% | 6% | 3% | ||||||||
| %YoY | ||||||||||||||||
| DRAM | 258% | 378% | 378% | 287% | 129% | 49% | 27% | 21% | 41% | -16% | -39% | 86% | 52% | 325% | 45% | 9% |
| NAND | 196% | 332% | 360% | 287% | 125% | 31% | 11% | 6% | 25% | -8% | -37% | 84% | 4% | 299% | 30% | 0% |
| DRAM/NAND total | 234% | 360% | 371% | 287% | 127% | 42% | 21% | 16% | 34% | -12% | -38% | 85% | 29% | 315% | 40% | 6% |
| Blended ASP US$/unit | ||||||||||||||||
| DRAM 8Gb equiv | 8.1 | 12.4 | 14.9 | 16.0 | 16.3 | 16.3 | 16.1 | 15.8 | 3.8 | 3.2 | 1.8 | 2.9 | 3.7 | 13.0 | 16.1 | 14.9 |
| NAND 256Gb equiv | 5.0 | 8.3 | 9.5 | 9.6 | 9.5 | 9.2 | 8.7 | 8.5 | 3.4 | 3.0 | 1.6 | 2.6 | 2.4 | 8.2 | 8.9 | 7.8 |
| %QoQ | ||||||||||||||||
| DRAM ASP | 73% | 53% | 21% | 7% | 2% | 0% | -2% | -2% | ||||||||
| NAND ASP | 75% | 65% | 15% | 1% | -2% | -3% | -5% | -3% | ||||||||
| %YoY | ||||||||||||||||
| DRAM ASP | 155% | 283% | 318% | 242% | 102% | 32% | 8% | -1% | 14% | -16% | -45% | 62% | 29% | 249% | 25% | -8% |
| NAND ASP | 115% | 281% | 313% | 236% | 89% | 11% | -9% | -12% | -9% | -13% | -46% | 65% | -8% | 238% | 9% | -13% |
| Shipments bn units | ||||||||||||||||
| DRAM 8Gb equiv | 10.4 | 10.9 | 11.2 | 11.4 | 11.8 | 12.2 | 13.3 | 14.0 | 24.1 | 24.2 | 26.7 | 30.6 | 36.0 | 43.9 | 51.2 | 60.5 |
| NAND 256Gb equiv | 9.0 | 9.5 | 10.1 | 10.6 | 10.7 | 11.2 | 12.2 | 12.8 | 21.3 | 22.6 | 26.6 | 29.5 | 33.2 | 39.3 | 47.0 | 54.3 |
| %QoQ | ||||||||||||||||
| DRAM bit growth | 3% | 5% | 3% | 2% | 3% | 4% | 8% | 5% | ||||||||
| NAND bit growth | -2% | 5% | 6% | 5% | 1% | 5% | 9% | 5% | ||||||||
| %YoY DRAM bit growth | 41% | 25% | 14% | 13% | 13% | 12% | 18% | 22% | 23% | 0% | 10% | 15% | 18% | 22% | 17% | 18% |
| NAND bit growth | 38% | 13% | 11% | 15% | 19% | 18% | 21% | 21% | 38% | 6% | 18% | 11% | 13% | 18% | 20% | 16% |
| Capacity300mmkwpm | ||||||||||||||||
| DRAM wafer capacity | 1,988 | 2,036 | 2,091 | 2,150 | 2,182 | 2,224 | 2,264 | 2,299 | 1,481 | 1,561 | 1,628 | 1,734 | 1,867 | 2,066 | 2,242 | 2,379 |
| NAND wafer capacity | 1,695 | 1,722 | 1,736 | 1,750 | 1,767 | 1,784 | 1,801 | 1,834 | 1,681 | 1,783 | 1,820 | 1,781 | 1,651 | 1,726 | 1,797 | 1,878 |
| DRAM+NAND total | 3,683 | 3,758 | 3,827 | 3,900 | 3,949 | 4,008 | 4,065 | 4,133 | 3,162 | 3,344 | 3,447 | 3,515 | 3,517 | 3,792 | 4,039 | 4,256 |
| %QoQ | ||||||||||||||||
| DRAM capacity total | 3% | 2% | 3% | 3% | 1% | 2% | 2% | 2% | ||||||||
| NAND capacity total | 1% | 2% | 1% | 1% | 1% | 1% | 1% | 2% | ||||||||
| 2% | 1% | |||||||||||||||
| DRAM/NAND total | 2% | 2% | 2% | 1% | 1% | 2% | ||||||||||
| %YoY | ||||||||||||||||
| DRAM capacity | 9% | 11% | 12% | 11% | 10% | 9% | 8% | 7% | 8% | 5% | 4% | 7% | 8% | 11% | 9% | 6% |
| NAND capacity | 2% | 6% | 6% | 4% | 4% | 4% | 4% | 5% | 1% | 6% | 2% | -2% | -7% | 5% | 4% | 5% |
| DRAM+NAND total | 5% | 9% | 9% | 8% | 7% | 7% | 6% | 6% | 4% | 6% | 3% | 2% | 0% | 8% | 7% | 5% |
| Capex spending | ||||||||||||||||
| DRAM | 23.0 | 22.2 | 21.3 | 22.2 | 26.0 | 27.1 | 29.4 | 30.5 | 27.1 | 31.0 | 25.2 | 37.7 | 53.9 | 88.6 | 112.9 | 119.5 |
| NAND | 6.9 | 7.2 | 7.5 | 8.4 | 9.2 | 8.8 | 8.5 | 8.8 | 27.9 | 29.0 | 19.7 | 20.4 | 19.3 | 30.1 | 35.4 | 37.2 |
| Total (DRAM+NAND) | 30.0 | 29.4 | 28.8 | 30.6 | 35.2 | 35.9 | 37.8 | 39.3 | 55.0 | 60.0 | 45.0 | 58.2 | 73.2 | 118.7 | 148.3 | 156.7 |
| QoQ/YoY in capex | ||||||||||||||||
| DRAM | 58% | -4% | -4% | 4% | 17% | 4% | 8% | 4% | 27% | 14% | -19% | 49% | 43% | 65% | 27% | 6% |
| NAND | 28% | 4% | 4% | 12% | 9% | -4% | -4% | 4% | -32% | 4% | 5% | |||||
| 6% | 2% | 5% | 4% | 24% | 4% | -5% | 55% | 18% | 6% | |||||||
| Total (DRAM+NAND) | 50% | -2% | -2% | 15% | 25% | 9% | -25% | 29% | 26% | 62% | 25% |
Source:
Companies' reports, BofA Global Research estimates
BofA GLOBAL RESEARCH
Exhibit 16: We slightly raise our 2026-28 DRAM revenue forecasts by 2-3%, primarily reflecting higher ASP assumptions (at ~$13/$16/$15 per 8Gb equivalent in 2026/27/28). NAND revenue estimates are also increased by 1-2% for 2026-28, driven by stronger ASP expectations (~$8-9 per 256Gb equivalent) amid the recent pricing upcycle.
Global memory forecast revisions - top-down analysis
| 1Q26 | 2Q26E | 3Q26E | 4Q26E | 1Q27E | 2Q27E | 3Q27E | 4Q27E | 2021 | 2022 | 2023 | 2024 | 2025 | 2026E | 2027E | 2028E | |
|---|---|---|---|---|---|---|---|---|---|---|---|---|---|---|---|---|
| DRAM (8Gb equiv) Sales (US$bn) | ||||||||||||||||
| New | 83.9 | 134.6 | 167.7 | 182.6 | 191.8 | 200.1 | 213.3 | 221.2 | 92.1 | 77.7 | 47.3 | 87.9 | 133.8 | 568.8 | 826.4 | 900.7 |
| Old | 83.9 | 134.6 | 162.1 | 176.6 | 185.5 | 193.5 | 206.3 | 213.9 | 92.1 | 77.7 | 47.3 | 87.9 | 133.8 | 557.2 | 799.1 | 870.9 |
| Diff | nm | 0.0% | 3.4% | 3.4% | 3.4% | 3.4% | 3.4% | 3.4% | nm | nm | nm | nm | nm | 2.1% | 3.4% | 3.4% |
| Shipments (bn units) | ||||||||||||||||
| New | 10.4 | 10.9 | 11.2 | 11.4 | 11.8 | 12.2 | 13.3 | 14.0 | 24.1 | 24.2 | 26.7 | 30.6 | 36.0 | 43.9 | 51.2 | 60.5 |
| Old | 10.4 | 10.9 | 11.2 | 11.4 | 11.8 | 12.2 | 13.3 | 14.0 | 24.1 | 24.2 | 26.7 | 30.6 | 36.0 | 43.9 | 51.2 | 60.5 |
| Diff | nm | 0.0% | 0.0% | 0.0% | 0.0% | 0.0% | 0.0% | 0.0% | nm | nm | nm | nm | nm | 0.0% | 0.0% | 0.0% |
| Bit growth - sequential | ||||||||||||||||
| New | 2.8% | 5.0% | 3.0% | 1.8% | 3.0% | 4.1% | 8.3% | 5.3% | 23.3% | 0.3% | 10.3% | 14.8% | 17.6% | 21.9% | 16.7% | 18.1% |
| Old | 2.8% | 5.0% | 3.0% | 1.8% | 3.0% | 4.1% | 8.3% | 5.3% | 23.3% | 0.3% | 10.3% | 14.8% | 17.6% | 21.9% | 16.7% | 18.1% |
| Diff | nm | 0.0% | 0.0% | 0.0% | 0.0% | 0.0% | 0.0% | 0.0% | nm | nm | nm | nm | nm | 0.0% | 0.0% | 0.0% |
| ASP chg - sequential | ||||||||||||||||
| New | 73.2% | 52.9% | 20.9% | 7.0% | 2.0% | 0.2% | -1.6% | -1.5% | 14.2% | -16.0% | -44.8% | 61.8% | 29.4% | 248.7% | 24.5% | -7.7% |
| Old | 73.2% | 52.9% | 16.9% | 7.0% | 2.0% | 0.2% | -1.6% | -1.6% | 14.2% | -16.0% | -44.8% | 61.8% | 29.4% | 241.6% | 22.9% | -7.7% |
| Diff | nm | 0.0% | 4.0% | 0.0% | 0.0% | 0.0% | 0.0% | 0.0% | nm | nm | nm | nm | nm | 7.1% | 1.6% | 0.0% |
| Blended ASP (US$) | ||||||||||||||||
| New | 8.1 | 12.4 | 14.9 | 16.0 | 16.3 | 16.3 | 16.1 | 15.8 | 3.8 | 3.2 | 1.8 | 2.9 | 3.7 | 13.0 | 16.1 | 14.9 |
| Old | 8.1 | 12.4 | 14.4 | 15.5 | 15.8 | 15.8 | 15.6 | 15.3 | 3.8 | 3.2 | 1.8 | 2.9 | 3.7 | 12.7 | 15.6 | 14.4 |
| Diff | nm | 0.0% | 3.4% | 3.4% | 3.4% | 3.4% | 3.4% | 3.4% | nm | nm | nm | nm | nm | 2.1% | 3.4% | 3.4% |
| NAND (256Gb equiv) | ||||||||||||||||
| Sales (US$bn) | ||||||||||||||||
| New | 45.3 | 78.9 | 96.4 | 102.4 | 101.7 | 103.1 | 106.8 | 108.8 | 73.3 | 67.3 | 42.4 | 78.1 | 81.0 | 323.1 | 420.4 | 421.5 |
| Old | 45.3 | 78.9 | 94.7 | 100.6 | 99.9 | 101.3 | 104.9 | 106.9 | 73.3 | 67.3 | 42.4 | 78.1 | 81.0 | 319.6 | 413.0 | 414.1 |
| Diff | nm | 0.0% | 1.8% | 1.8% | 1.8% | 1.8% | 1.8% | 1.8% | nm | nm | nm | nm | nm | 1.1% | 1.8% | 1.8% |
| Shipments (bn units) | ||||||||||||||||
| New | 9.0 | 9.5 | 10.1 | 10.6 | 10.7 | 11.2 | 12.2 | 12.8 | 21.3 | 22.6 | 26.6 | 29.5 | 33.2 | 39.3 | 47.0 | 54.3 |
| Old | 9.0 | 9.5 | 10.1 | 10.6 | 10.7 | 11.2 | 12.2 | 12.8 | 21.3 | 22.6 | 26.6 | 29.5 | 33.2 | 39.3 | 47.0 | 54.3 |
| Diff | nm | 0.0% | 0.0% | 0.0% | 0.0% | 0.0% | 0.0% | 0.0% | nm | nm | nm | nm | nm | 0.0% | 0.0% | 0.0% |
| Bit growth - sequential | ||||||||||||||||
| New | -2.2% | 5.4% | 6.2% | 5.2% | 0.9% | 4.6% | 9.0% | 5.0% | 37.8% | 6.1% | 17.6% | 11.2% | 12.5% | 18.2% | 19.7% | 15.6% |
| Old | -2.2% | 5.4% | 6.2% | 5.2% | 0.9% | 4.6% | 9.0% | 5.0% | 37.8% | 6.1% | 17.6% | 11.2% | 12.5% | 18.2% | 19.7% | 15.6% |
| Diff | nm | 0.0% | 0.0% | 0.0% | 0.0% | 0.0% | 0.0% | 0.0% | nm | nm | nm | nm | nm | 0.0% | 0.0% | 0.0% |
| ASP chg - sequential | ||||||||||||||||
| New | 74.7% | 65.4% | 15.0% | 1.0% | -1.6% | -3.1% | -5.0% | -3.0% | -9.1% | -13.5% | -46.4% | 65.5% | -7.8% | 237.6% | 8.7% | -13.3% |
| Old | 74.7% | 65.4% | 13.0% | 1.0% | -1.6% | -3.1% | -5.0% | -3.0% | -9.1% | -13.5% | -46.4% | 65.5% | -7.8% | 234.0% | 7.9% | -13.3% |
| Diff | nm | 0.0% | 2.0% | 0.0% | 0.0% | 0.0% | 0.0% | 0.0% | nm | nm | nm | nm | nm | 3.6% | 0.7% | 0.0% |
| Blended ASP (US$) | ||||||||||||||||
| New | 5.0 | 8.3 | 9.5 | 9.6 | 9.5 | 9.2 | 8.7 | 8.5 | 3.4 | 3.0 | 1.6 | 2.6 | 2.4 | 8.2 | 8.9 | 7.8 |
| Old | 5.0 | 8.3 | 9.4 | 9.5 | 9.3 | 9.0 | 8.6 | 8.3 | 3.4 | 3.0 | 1.6 | 2.6 | 2.4 | 8.1 | 8.8 | 7.6 |
| Diff | nm | 0.0% | 1.8% | 1.8% | 1.8% | 1.8% | 1.8% 1.8% | nm | nm | nm | nm | nm | 1.1% | 1.8% | 1.8% |
Source: BofA Global Research estimates, industry data. Chg = change. Equiv = equivalent
BofA GLOBAL RESEARCH
Exhibit 17: Servers-especially AI systems using HBM-now make up over half of total DRAM demand, mainly due to higher memory per system Global DRAM demand mix by application
| (8Gb equiv, mnunits) | 1Q262Q26E | 3Q26E | 4Q26E | 1Q27E | 2Q27E | 3Q27E | 4Q27E | 2022 | 2023 | 2024 | 2025E | 2026E | 2027E | 2028E | 2028E | |
|---|---|---|---|---|---|---|---|---|---|---|---|---|---|---|---|---|
| Supply-to-demand | ||||||||||||||||
| Sufficiency (supply-to-demand) | 64.1% | 75.0% | 88.0% | 96.0% | 101.0% | 100.0% | 101.0% | 101.8% | 108.5% | 100.6% | 94.3% | 92.1% | 79.3% | 101.0% | 101.8% | 101.8% |
| Supply | 10,375 | 10,894 | 11,220 | 11,422 | 11,765 | 12,247 | 13,264 | 13,968 | 24,171 | 26,670 | 30,628 | 36,023 | 43,912 | 51,245 | 60,514 | 60,514 |
| Demand | 16,196 | 14,525 | 12,751 | 11,898 | 11,649 | 12,247 | 13,133 | 13,728 | 22,270 | 26,514 | 32,491 | 39,106 | 55,370 | 50,757 | 59,462 | 59,462 |
| Wafer capacity (12" equiv k wpm) | 1,988 | 2,036 | 2,091 | 2,150 | 2,182 | 2,224 | 2,264 | 2,299 | 1,561 | 1,628 | 1,734 | 1,867 | 2,066 | 2,242 | 2,379 | 2,379 |
| Revenue (US$bn) | 83.9 | 134.6 | 167.7 | 182.6 | 191.8 | 200.1 | 213.3 | 221.2 | 77.7 | 47.3 | 87.9 | 133.8 | 568.8 | 826.4 | 900.7 | 900.7 |
| ASP (US$) | 8.1 | 12.4 | 14.9 | 16.0 | 16.3 | 16.3 | 16.1 | 15.8 | 3.2 | 1.8 | 2.9 | 3.7 | 13.0 | 16.1 | 14.9 | 14.9 |
| Demand by application (mn units) | ||||||||||||||||
| Server | 5,468 | 5,583 | 6,094 | 6,585 | 6,452 | 6,646 | 7,599 | 7,596 | 9,731 | 9,022 | 13,217 | 18,459 | 23,730 | 28,293 | 34,504 | 34,504 |
| PC | 1,028 | 869 | 864 | 803 | 707 | 747 | 838 | 913 | 3,574 | 3,418 | 3,922 | 4,713 | 3,564 | 3,205 | 3,694 | 3,694 |
| Smartphone | 2,844 | 2,481 | 2,430 | 2,526 | 2,296 | 2,366 | 2,558 | 2,794 | 7,388 | 8,045 | 10,255 | 12,149 | 10,281 | 10,014 | 11,586 | 11,586 |
| Tablet | 233 | 194 | 183 | 196 | 184 | 188 | 187 | 221 | 846 | 786 | 929 | 1,052 | 805 | 781 | 908 | 908 |
| TV - DRAM embedded | 221 | 206 | 238 | 297 | 251 | 237 | 273 | 341 | 586 | 635 | 728 | 839 | 962 | 1,102 | 1,262 | 1,262 |
| Game - DRAM embedded | 125 | 114 | 136 | 206 | 135 | 124 | 156 | 221 | 454 | 459 | 499 | 535 | 581 | 636 | 680 | 680 |
| Auto - DRAM embedded | 105 | 113 | 125 | 132 | 135 | 145 | 161 | 170 | 168 | 219 | 288 | 370 | 475 | 611 | 785 | 785 |
| Total demand | 16,196 | 14,525 | 12,751 | 11,898 | 11,649 | 12,247 | 13,133 | 13,728 | 22,270 | 26,514 | 32,491 | 39,106 | 55,370 | 50,757 | 59,462 | 59,462 |
| Demand mix (% to total bits) | ||||||||||||||||
| Server | 34% | 38% | 48% | 55% | 55% | 54% | 58% | 55% | 44% | 34% | 41% | 47% | 43% | 56% | 58% | 58% |
| PC | 6% | 6% | 7% | 7% | 6% | 6% | 6% | 7% | 16% | 13% | 12% | 12% | 6% | 6% | 6% | 6% |
| Smartphone | 18% | 17% | 19% | 21% | 20% | 19% | 19% | 20% | 33% | 30% | 32% | 31% | 19% | 20% | 19% | 19% |
| Tablet | 1% | 1% | 1% | 2% | 2% | 2% | 1% | 2% | 4% | 3% | 3% | 3% | 1% | 2% | 2% | 2% |
| TV - DRAM embedded | 1% | 1% | 2% | 2% | 2% | 2% | 2% | 2% | 3% | 2% | 2% | 2% | 2% | 2% | 2% | 2% |
| Game - DRAM embedded | 1% | 1% | 1% | 2% | 1% | 1% | 1% | 2% | 2% | 2% | 2% | 1% | 1% | 1% | 1% | 1% |
| Auto - DRAM embedded | 0.6% | 0.8% | 1.0% | 1.1% | 1.2% | 1.2% | 1.2% | 1.2% | 0.8% | 0.8% | 0.9% | 0.9% | 0.9% | 1.2% | 1.3% | 1.3% |
| Total | 100% | 100% | 100% | 100% | 100% | 100% | 100% | 100% | 100% | 100% | 100% | 100% | 100% | 100% | 100% | 100% |
| DRAM content per product (GB) | ||||||||||||||||
| Server | 1,148 | 1,159 | 1,182 | 1,194 | 1,206 | 1,230 | 1,267 | 1,293 | 655 | 736 | 914 | 1,066 | 1,172 | 1,251 | 1,383 | 1,383 |
| PC | 16.9 | 15.7 | 15.4 | 14.2 | 14.3 | 14.6 | 14.9 | 15.1 | 12.2 | 13.5 | 15.3 | 17.1 | 15.6 | 14.8 | 16.2 | 16.2 |
| Smartphone | 10.4 | 10.2 | 9.8 | 9.7 | 9.8 | 10.0 | 10.3 | 10.8 | 6.2 | 7.0 | 8.4 | 9.8 | 10.0 | 10.3 | 11.3 | 11.3 |
| Tablet | 6.8 | 6.4 | 6.2 | 6.3 | 6.4 | 6.4 | 6.6 | 7.0 | 5.2 | 5.7 | 6.3 | 7.0 | 6.5 | 6.6 | 7.3 | 7.3 |
| TV - DRAM embedded | 4.5 | 4.6 | 4.7 | 4.8 | 5.1 | 5.2 | 5.3 | 5.4 | 2.9 | 3.2 | 3.6 | 4.1 | 4.7 | 5.3 | 5.9 | 5.9 |
| Game - DRAM embedded | 13.1 | 13.3 | 13.5 | 13.6 | 13.9 | 14.2 | 14.3 | 14.4 | 10.6 | 11.2 | 11.9 | 12.6 | 13.4 | 14.2 | 15.1 | 15.1 |
| Auto - DRAM embedded | 5.2 | 5.5 | 5.8 | 5.9 | 6.3 | 6.7 | 6.9 | 7.1 | 2.4 | 3.0 | 3.9 | 4.7 | 5.6 | 6.8 | 8.1 | 8.1 |
| DRAM-based products (mn units) | ||||||||||||||||
| Server | 5 | 5 | 5 | 6 | 5 | 5 | 6 | 6 | 15 | 12 | 14 | 17 | 20 | 23 | 25 | 25 |
| PC | 61 | 55 | 56 | 57 | 49 | 51 | 56 | 61 | 294 | 253 | 256 | 275 | 228 | 217 | 228 | 228 |
| Smartphone | 275 | 244 | 247 | 259 | 233 | 236 | 247 | 260 | 1,198 | 1,152 | 1,218 | 1,237 | 1,025 | 976 | 1,028 | 1,028 |
| Tablet | 34 | 31 | 29 | 31 | 29 | 29 | 28 | 32 | 163 | 138 | 147 | 151 | 125 | 118 | 124 | 124 |
| TV - DRAM embedded | 49 | 45 | 50 | 61 | 50 | 46 | 51 | 63 | 203 | 199 | 201 | 203 | 206 | 209 | 213 | 213 |
| Game - DRAM embedded | 10 | 9 | 10 | 15 | 10 | 9 | 11 | 15 | 43 | 41 | 42 | 42 | 43 | 45 | 45 | 45 |
| Auto - DRAM embedded | 20 | 20 | 22 | 22 | 21 | 22 | 23 | 24 | 69 | 72 | 75 | 79 | 85 | 90 | 96 | 96 |
| %QoQin DRAM-based products | ||||||||||||||||
| Server | 0% | 1% | 7% | 7% | -3% | 1% | 11% | -2% | 10% | -17% | 18% | 20% | 17% | 12% | 10% | 10% |
| PC | -17% | -9% | 1% | 1% | -13% | 3% | 10% | 8% | -16% | -14% | 1% | 8% | -17% | -5% | 5% | 5% |
| Smartphone | -15% | -11% | 1% | 5% | -10% | 1% | 5% | 5% | -12% | -4% | 6% | 2% | -17% | -5% | 5% | 5% |
| Tablet | -20% | -10% | -4% | 6% | -7% | 1% | -4% | 13% | -12% | -16% | 7% | 3% | -17% | -5% | 5% | |
| TV - DRAM embedded | -19% | -9% | 12% | 22% | -19% | -8% | 12% | 22% | -5% | -2% | 1% | 1% | 1% | 2% | 2% | |
| Game - DRAM embedded | -35% | -11% | 19% | 50% | -36% | -10% | 25% | 40% | -10% | -5% | 3% | 1% | 2% 3% | 1% | 1% | 1% |
| Auto - DRAM embedded | -4% | 2% | 7% | 3% | -4% | 2% | 7% | 3% | 0% | 5% | 3% | 6% | 7% | 7% | 7% |
Source: BofA Global Research estimates, industry data. Chg = change. Equiv = equivalent
BofA GLOBAL RESEARCH
Exhibit 18: SSD-especially in data center and AI applications-now accounts for over half of total NAND demand, driven by higher storage capacity per system; SSD including enterprise solutions already account for 50%+ of total NAND sales (price premium seen vs IT applications)
Global NAND demand mix by application
| (256Gb equiv, mnunits) | 1Q26 | 2Q26E | 3Q26E | 4Q26E | 1Q27E | 2Q27E | 3Q27E | 4Q27E | 2022 | 2023 | 2024 | 2025E | 2026E | 2027E | 2028E | 2028E |
|---|---|---|---|---|---|---|---|---|---|---|---|---|---|---|---|---|
| Supply-to-demand Sufficiency (supply-to-demand) | 65.1% | 69.2% | 92.4% | 99.9% | 101.0% | 103.0% | 104.0% | 102.7% | 108.0% | 101.8% | 94.9% | 97.7% | 79.8% | 102.7% | 102.2% | 102.2% |
| Supply | 9,022 | 9,510 | 10,099 | 10,624 | 10,720 | 11,217 | 12,227 | 12,838 | 22,576 | 26,558 | 29,528 | 33,222 | 39,256 | 47,003 | 54,350 | 54,350 |
| Demand | 13,853 | 13,742 | 10,930 | 10,639 | 10,614 | 10,891 | 11,757 | 12,498 | 20,910 | 26,097 | 31,128 | 34,004 | 49,164 | 45,759 | 53,172 | 53,172 |
| Wafer capacity (12" | 1,695 | 1,722 | 1,736 | 1,750 | 1,767 | 1,784 | 1,801 | 1,834 | 1,783 | 1,820 | 1,781 | 1,651 | 1,726 | 1,797 | 1,878 | 1,878 |
| equiv k wpm) Revenue (US$bn) | 45.3 | 78.9 | 96.4 | 102.4 | 101.7 | 103.1 | 106.8 | 108.8 | 67.3 | 42.4 | 78.1 | 81.0 | 323.1 | 420.4 | 421.5 | 421.5 |
| ASP (US$) | 5.0 | 8.3 | 9.5 | 9.6 | 9.5 | 9.2 | 8.7 | 8.5 | 3.0 | 1.6 | 2.6 | 2.4 | 8.2 | 8.9 | 7.8 | 7.8 |
| Demand by application (mn units) Smartphones | 2,808 | 2,474 | 2,449 | 2,623 | 2,408 | 2,481 | 2,683 | 2,902 | 6,821 | 7,724 | 9,792 | 11,965 | 10,355 | 10,473 | 12,467 | 12,467 |
| SSDs | 3,932 | 4,033 | 4,511 | 4,928 | 4,392 | 4,651 | 5,379 | 5,860 | 9,520 | 9,715 | 12,587 | 15,738 | 17,405 | 20,282 | 23,880 | 23,880 |
| Notebook | 1,129 | 1,013 | 1,061 | 1,072 | 961 | 1,036 | 1,178 | 1,316 | 3,172 | 3,275 | 3,991 | 4,934 | 4,275 | 4,491 | 5,325 | 5,325 |
| Desktop | 431 | 437 | 482 | 502 | 445 | 455 | 502 | 523 | 990 | 1,031 | 1,271 | 1,708 | 1,853 | 1,925 | 2,004 | 2,004 |
| Server | 1,929 | 2,105 | 2,428 | 2,749 | 2,467 | 2,617 | 3,085 | 3,333 | 4,256 | 4,432 | 6,057 | 7,335 | 9,211 | 11,502 | 13,866 | 13,866 |
| Spot &inventories | 443 | 477 | 540 | 606 | 519 | 542 | 614 | 689 | 1,101 | 978 | 1,268 | 1,760 | 2,066 | 2,363 | 2,686 | 2,686 |
| Tablets | 393 | 335 | 312 | 335 | 311 | 321 | 316 | 370 | 1,134 | 1,155 | 1,483 | 1,812 | 1,374 | 1,319 | 1,509 | 1,509 |
| Game - NAND embedded | 216 | 196 | 235 | 357 | 235 | 216 | 273 | 386 | 736 | 760 | 843 | 913 | 1,004 | 330 | 1,202 | 1,202 |
| Autos - NAND embedded | 55 | 58 | 72 | 77 | 87 | 94 | 80 | 107 | 147 | 191 | 251 | 1,111 | 434 | 434 | ||
| Others &spot adj | 6,449 | 6,645 | 66 3,356 | 72 2,324 | 3,195 | 3,145 | 3,019 | 2,885 | 2,620 | 6,636 | 6,277 | 3,385 | 18,775 | 12,245 | 13,679 | 13,679 |
| 20,910 | 34,004 | |||||||||||||||
| NAND demand total | 13,853 | 13,742 | 10,930 | 10,639 | 10,614 | 10,891 | 11,757 | 12,498 | 26,097 | 31,128 | 49,164 | 45,759 | 53,172 | 53,172 | ||
| Demand mix (% to total bits) | ||||||||||||||||
| Smartphones | 20% | 18% | 22% | 25% | 23% | 23% | 23% | 23% | 33% | 30% | 31% | 35% | 21% | 23% | 23% | 23% |
| SSDs | 28% | 29% | 41% | 46% | 41% | 43% | 46% | 47% | 46% | 37% | 40% | 46% | 35% | 44% | 45% | 45% |
| Notebook | 8% | 7% | 10% | 10% | 9% | 10% | 10% | 11% | 15% | 13% | 13% | 15% | 9% | 10% 4% | 10% | 10% |
| Desktop | 3% | 3% | 4% | 5% | 4% | 4% | 4% | 4% | 5% | 4% | 4% | 5% | 4% | 4% | 4% | |
| Server | 14% | 15% | 22% | 26% | 23% | 24% | 26% | 27% | 20% | 17% | 19% | 22% | 19% | 25% | 26% | 26% |
| Spot &inventories | 3% | 3% | 5% | 6% | 5% | 5% | 5% | 6% | 5% | 4% | 4% | 5% | 4% | 5% | 5% | 5% |
| Tablets | 3% | 2% | 3% | 3% | 3% | 3% | 3% | 3% | 5% | 4% | 5% | 5% | 3% | 3% | 3% | 3% |
| Game - NAND embedded | 2% | 1% | 2% | 3% | 2% | 2% | 2% | 3% | 4% | 3% | 3% | 3% | 2% | 2% | 2% | 2% |
| Autos - NAND embedded | 0% | 0% | 1% | 1% | 1% | 1% | 1% | 1% | 0% | 0% | 0% | 1% | 1% | 1% | 1% | 1% |
| Total | 100% | 100% | 100% | 100% | 100% | 100% | 100% | 100% | 100% | 100% | 100% | 100% | 100% | 100% | 100% | 100% |
| NAND content per product (GB) | ||||||||||||||||
| Smartphones | 327 | 324 | 318 | 324 | 330 | 337 | 347 | 357 | 182 | 215 | 257 | 310 | 323 | 343 | 388 | 388 |
| SSDs | 1,293 | 1,371 | 1,449 | 1,503 | 1,558 | 1,594 | 1,652 | 1,662 | 763 | 885 | 1,065 | 1,185 | 1,406 | 1,620 | 1,796 | 1,796 |
| Notebook | 846 | 867 | 910 | 919 | 938 | 956 | 975 | 985 | 525 | 600 | 700 | 801 | 884 | 965 | 1,035 | 1,035 |
| Desktop | 892 | 914 | 960 | 970 | 989 | 1,009 | 1,029 | 1,039 | 555 | 632 | 739 | 845 | 935 | 1,017 | 1,091 | 1,091 |
| Server | 3,822 | 3,899 | 3,996 | 4,076 | 4,158 | 4,241 | 4,347 | 4,434 | 2,348 | 2,676 | 3,215 | 3,640 | 3,959 | 4,305 | 4,683 | 4,683 |
| Spot &inventories | 617 | 632 | 645 | 658 | 691 | 708 | 722 | 736 | 388 | 438 | 505 | 572 | 639 | 716 | 801 | 801 |
| Tablets | 370 | 351 | 341 | 344 | 344 | 351 | 358 | 373 | 223 | 269 | 324 | 383 | 352 | 357 | 390 | 390 |
| Game - NAND embedded | 960 | 1,049 | 779 | |||||||||||||
| Autos - NAND embedded | 941 | 95 | 970 | 979 | 1,009 | 1,029 | 1,039 | 719 | 48 | 841 | 900 | 965 | 1,034 | 1,108 152 | 1,108 152 | |
| NAND-based products (mn units) | 91 | 101 | 107 | 112 | 118 | 125 | 133 | 38 | 65 | 80 | 99 | 122 | 122 | |||
| Smartphones | 275 | 244 | 247 | 259 | 233 | 236 | 247 | 260 | 1,198 | 1,152 | 1,218 | 1,237 | 1,025 | 976 | 1,028 | 1,028 |
| SSDs | 97 | 94 | 100 | 105 | 90 | 93 | 104 | 113 | 399 | 351 | 378 | 425 | 396 | 401 | 426 | 426 |
| Notebook | 43 | 37 | 37 | 37 | 33 | 35 | 39 | 43 | 193 | 175 | 182 | 197 | 155 | 149 | 165 | 165 |
| Desktop | 15 | 15 | 16 | 17 | 14 | 14 | 16 | 16 | 57 | 52 | 55 | 65 | 63 | 61 | 59 | 59 |
| Server | 16 | 17 | 19 | 22 | 19 | 20 | 23 | 24 | 58 | 53 | 60 | 64 | 74 | 86 | 95 | 95 |
| 27 | 29 | 107 | 107 | |||||||||||||
| Spot &inventories | 23 | 24 | 24 | 25 | 27 | 30 | 91 | 71 | 80 | 98 | 103 | 106 | ||||
| Tablets | 34 | 31 | 29 | 31 | 29 | 29 | 28 | 32 | 163 | 138 | 147 | 151 | 125 | 124 | 124 | 124 |
| Game - NAND embedded | 7 | 7 | 8 | 12 | 7 | 8 | 12 | 33 | 31 | 32 | 32 | 33 | 34 | 35 | ||
| Auto | 19 | 20 | 21 | 21 | 21 | 7 21 | 22 | 23 | 68 | 71 | 73 | 77 | 81 | 86 | 92 | |
| %QoQ/YoY in NAND-based products | ||||||||||||||||
| Smartphones | -15% | -11% | 1% | 5% | -10% | 1% | 5% | 5% | -12% | -4% | 6% | 2% | -17% | -5% | 5% | 5% |
| SSDs Notebook | -18% -18% | -3% -12% | 6% 0% | 5% 0% | -14% -12% | 3% 6% | 12% 11% | 8% 11% | -7% -12% | -12% -10% | 8% 4% | 12% 8% | -7% -22% | 1% -4% | 6% 11% | 6% 11% |
| -1% | 5% | -13% | 0% | 8% | 3% | 10% | -9% | 5% | -2% | -3% | -3% | -3% | ||||
| Desktop | -13% | 13% | 3% | -12% | 17% 7% | 15% | 15% | |||||||||
| Server | -14% | 7% | 11% | 4% | 15% | 6% -9% | 8% | 14% 13% | 5% | 11% 2% | 11% 2% | 11% 2% | ||||
| Spot &inventories | -25% | 5% | 11% | 10% | -19% | 2% | 11% -4% | 10% | -15% | -22% | 23% | 2% -5% | 5% | 5% | 5% | 5% |
| Tablets | -20% | -10% | -4% | 6% | -7% | 1% | 13% -16% | -12% | 7% | 3% 1% | -17% 1% | -17% 1% | -17% 1% | -17% 1% | -17% 1% | |
| Game - NAND embedded | -35% | -11% | 19% | 50% | -36% | -10% | 25% | 40% | -10% | -5% | 3% | 3% | 6% | 6% | 6% |
Source: BofA Global Research estimates, industry data. Chg = change. Equiv = equivalent
BofA GLOBAL RESEARCH
Exhibit 19: Company-specific DRAM sales/ASP/shipment/margin comparison - high margin due to HBM
Bottom-up approach analysis based on top-4 DRAM companies' quarterly earnings results
| (8Gb equiv) | 1Q26 | 2Q26E | 3Q26E | 4Q26E | 1Q27E | 2Q27E | 3Q27E | 4Q27E | 2021 | 2022 | 2023 | 2024 | 2025 | 2026E | 2027E | 2028E | 2028E |
|---|---|---|---|---|---|---|---|---|---|---|---|---|---|---|---|---|---|
| Units (bn) | |||||||||||||||||
| Samsung | 4.3 | 4.6 | 4.7 | 4.8 | 4.9 | 5.1 | 5.6 | 5.9 | 10.9 | 10.8 | 11.8 | 13.4 | 15.0 | 18.4 | 21.5 | 24.9 | 24.9 |
| SK Hynix | 3.1 | - | - | - | - | - | - | - | 6.8 | 6.8 | 7.6 | 9.0 | 11.0 | - | - | - | - |
| Micron | 2.5 | 2.6 | 2.7 | 2.9 | 3.0 | 3.2 | 3.4 | 3.5 | 5.2 | 5.2 | 5.8 | 7.2 | 8.6 | 10.7 | 13.1 | 15.4 | 15.4 |
| Nanya | 0.2 | 0.2 | 0.2 | 0.2 | 0.2 | 0.2 | 0.3 | 0.3 | 0.6 | 0.4 | 0.4 | 0.4 | 0.7 | 0.9 | 1.0 | 1.2 | 1.2 |
| Top 4 total | 10.1 | 23.5 | 23.3 | 25.7 | 30.1 | 35.3 | |||||||||||
| ASP (US$) | |||||||||||||||||
| Samsung | 9.0 | 13.1 | 15.8 | 17.0 | 17.4 | 17.4 | 17.2 | 16.7 | 3.9 | 3.3 | 1.8 | 2.9 | 3.5 | 13.9 | 17.2 | 15.5 | 15.5 |
| SK Hynix | 9.4 | - | - | - | - | - | - | - | 4.1 | 3.3 | 2.1 | 3.6 | 4.8 | - | - | - | - |
| Micron | 7.5 | 12.2 | 14.2 | 14.6 | 14.6 | 14.6 | 14.2 | 13.7 | 4.1 | 3.8 | 2.0 | 2.9 | 3.9 | 12.2 | 14.3 | 13.0 | 13.0 |
| Nanya | 7.9 | 12.7 | 15.6 | 16.9 | 17.2 | 17.2 | 16.9 | 16.4 | 5.0 | 4.5 | 2.5 | 2.9 | 3.5 | 13.3 | 16.9 | 14.5 | 14.5 |
| Top 4 total | 8.7 | 4.0 | 3.4 | 2.0 | 3.1 | 4.0 | |||||||||||
| OP margin (%) | |||||||||||||||||
| Samsung | 79% | 80% | 81% | 81% | 80% | 80% | 80% | 79% | 50% | 41% | -4% | 30% | 40% | 80% | 80% | 76% | 76% |
| SK Hynix | 77% | - | - | - | - | - | - | - | 39% | 31% | 0% | 47% | 61% | - | - | - | - |
| Micron | 70% | 81% | 83% | 83% | 82% | 82% | 81% | 80% | 39% | 35% | -31% | 19% | 40% | 81% | 81% | 76% | 76% |
| Nanya | 61% | 74% | 77% | 76% | 75% | 74% | 72% | 70% | 32% | 20% | -48% | -31% | 7% | 74% | 73% | 60% | 60% |
| Top 4 total | 76% | 44% | 36% | -10% | 32% | 47% | |||||||||||
| Sales (US$bn) | |||||||||||||||||
| Samsung | 39.2 | 59.7 | 73.9 | 81.4 | 85.7 | 89.1 | 96.2 | 98.0 | 42.0 | 35.3 | 21.8 | 39.2 | 53.2 | 254.2 | 369.1 | 385.9 | 385.9 |
| SK Hynix | 28.7 | - | - | - | - | - | - | - | 27.7 | 22.8 | 15.7 | 32.6 | 52.4 | - | - | - | - |
| Micron | 18.8 | 31.3 | 38.9 | 41.6 | 43.7 | 46.3 | 47.9 | 48.5 | 21.6 | 19.6 | 11.6 | 20.6 | 33.0 | 130.6 | 186.5 | 200.7 | 200.7 |
| Nanya | 1.7 | 2.8 | 3.5 | 3.8 | 4.0 | 4.2 | 4.4 | 4.3 | 3.1 | 2.0 | 1.1 | 1.3 | 2.5 | 11.9 | 16.9 | 16.7 | 16.7 |
| Top 4 total | 88.4 | 94.3 | 79.7 | 50.2 | 93.6 | 141.1 | |||||||||||
| Bit mkt shr | |||||||||||||||||
| Samsung | 43% | 46% | 46% | 46% | 45% | 43% | |||||||||||
| SK Hynix | 30% | 29% | 29% | 30% | 30% | 31% | |||||||||||
| Micron | 25% | 22% | 22% | 23% | 24% | 24% | |||||||||||
| Nanya | 2% | 3% | 2% | 2% | 1% | 2% | |||||||||||
| Top 4 total | 100% | 100% | 100% | 100% | 100% | 100% | |||||||||||
| Sales mkt shr | |||||||||||||||||
| Samsung | 44% | 43% | 43% | 43% | 44% | 44% | 44% | 44% | 45% | 44% | 43% | 42% | 38% | 43% | 44% | 43% | 43% |
| SK Hynix | 32% | - | - | - | - | - | - | - | 29% | 29% | 31% | 35% | 37% | - | - | - | - |
| Micron | 21% | 23% | 23% | 22% | 22% | 23% | 22% | 22% | 23% | 25% | 23% | 22% | 23% | 22% | 22% | 23% | 23% |
| Nanya | 2% | 2% | 2% | 2% | 2% | 2% | 2% | 2% | 3% | 3% | 2% | 1% | 2% | 2% | 2% | 2% | 2% |
| Top 4 total | 100% | 100% | 100% | 100% | 100% | 100% | 100% | 100% | 100% | 100% | 100% | 100% | 100% | 100% | 100% | 100% | 100% |
| Bit growth QoQ/YoY | |||||||||||||||||
| Samsung | 3% | 5% | 3% | 2% | 3% | 4% | 9% | 5% | 27% | -1% | 9% | 14% | 12% | 22% | 17% | 16% | 16% |
| SK Hynix | 0% | - | - | - | - | - | - | - | 19% | 0% | 12% | 17% | 23% | - | - | - | - |
| Micron | 5% | 3% | 6% | 4% | 5% | 6% | 6% | 5% | 22% | 0% | 11% | 25% | 19% | 25% | 22% | 18% | 18% |
| Nanya | -5% | 0% | 2% | 1% | 3% | 4% | 8% 1% | 0% | -27% | -4% | 5% | 57% | 26% | 13% | 15% | 15% | |
| Top 4 total | 2% | 23% | -1% | 10% | 17% | 17% | |||||||||||
| ASP chg QoQ/YoY | |||||||||||||||||
| Samsung | 91% | 45% | 20% | 8% | 2% | 0% | -1% | -3% | 13% | -15% | -43% | 58% | 21% | 291% | 24% | -10% | -10% |
| SK Hynix | 65% | - | - | - | - | - | - | - | 15% | -18% | -38% | 76% | 31% | - | - | - | |
| Micron | 65% | 62% | 17% | 3% | 0% | 0% | -3% | -4% | 17% | -9% | -47% | 43% 35% | 217% | 17% | -9% | -9% | |
| Nanya | 71% | 61% | 23% | 8% | 2% | 0% | -2% | -3% | 47% | -10% | -44% | 13% | 24% 276% | 27% | -14% | -14% | -14% |
| Top 4 total | 76% | 15% | -15% | -43% | 59% | 28% |
*Upbeat YTD data points not yet fully reflected in 2026 ASP; thus earnings upside seen
**SK Hynix information is historical data only
Source: Companies, BofA Global Research estimates, industry data. Chg = change. Equiv = equivalent
BofA GLOBAL RESEARCH
Exhibit 20: Company-specific NAND sales/ASP/shipment/margin comparison - high margin due to eSSD and 3D NAND
Bottom-up approach analysis based on top-4 NAND companies' quarterly earnings results
| (256Gb equiv) | 1Q26 | 2Q26E | 3Q26E | 4Q26E | 1Q27E | 2Q27E | 3Q27E | 4Q27E | 2022 | 2023 | 2024 | 2025 | 2026E | 2027E | 2028E | 2028E | 2028E |
|---|---|---|---|---|---|---|---|---|---|---|---|---|---|---|---|---|---|
| Sales (US$bn) | |||||||||||||||||
| Samsung | 15.4 | 26.1 | 33.4 | 36.0 | 35.0 | 33.9 | 35.1 | 36.8 | 22.2 | 14.2 | 26.1 | 25.2 | 110.9 | 140.8 | 144.4 | 144.4 | 144.4 |
| Kioxia ex-foundry | 5.8 | 10.4 | 12.5 | 12.7 | 11.7 | 11.6 | 12.1 | 12.1 | 9.4 | 5.6 | 9.5 | 9.2 | 41.4 | 47.4 | 46.7 | 46.7 | 46.7 |
| Micron | 5.0 | 9.9 | 11.4 | 12.5 | 12.9 | 12.7 | 12.2 | 12.4 | 7.0 | 4.3 | 8.2 | 9.0 | 38.9 | 50.2 | 50.3 | 50.3 | 50.3 |
| SK Hynix | 9.7 | - | - | - | - | - | - | - | 12.4 | 8.4 | 16.0 | 16.9 | - | - | - | - | - |
| Global total | 45.3 | 67.3 | 42.4 | 78.1 | 81.0 | ||||||||||||
| OP margin (%) | |||||||||||||||||
| Samsung | 60% | 65% | 65% | 62% | 59% | 58% | 56% | 54% | 13% | -68% | 13% | 4% | 63% | 57% | 52% | 52% | 52% |
| Kioxia ex-foundry | 60% | 72% | 72% | 70% | 67% | 65% | 63% | 61% | 15% | -46% | 27% | 19% | 70% | 64% | 53% | 53% | 53% |
| Micron | 58% | 78% | 78% | 79% | 78% | 77% | 75% | 74% | 0% | -71% | 8% | 5% | 76% | 76% | 71% | 71% | 71% |
| SK Hynix | 54% | - | - | - | - | - | - | - | -12% | -76% | 14% | 8% | - | - | |||
| ASP (US$) | |||||||||||||||||
| Samsung | 5.5 | 9.1 | 10.5 | 10.5 | 10.2 | 9.9 | 9.4 | 9.2 | 2.9 | 1.6 | 2.6 | 2.5 | 9.0 | 9.7 | 8.5 | 8.5 | 8.5 |
| Kioxia ex-foundry | 5.2 | 9.2 | 9.5 | 9.3 | 9.0 | 8.6 | 8.1 | 7.9 | 3.4 | 1.8 | 2.6 | 2.2 | 8.4 | 8.4 | 7.2 | 7.2 | 7.2 |
| Micron | 2.3 | 4.3 | 4.6 | 4.8 | 4.7 | 4.6 | 4.2 | 4.1 | 1.7 | 0.8 | 1.3 | 1.2 | 4.1 | 4.4 | 3.7 | 3.7 | 3.7 |
| SK Hynix | 5.5 | - | - | - | - | - | - | - | 2.4 | 1.4 | 2.6 | 2.5 | - | - | |||
| 5.0 | 3.0 | 1.6 | 2.6 | 2.4 | |||||||||||||
| Global total | |||||||||||||||||
| Samsung | 2.8 | 2.9 | 3.2 | 3.4 | 3.4 | 3.4 | 3.7 | 4.0 | 7.7 | 8.9 | 9.9 | 10.2 | 12.3 | 14.6 | 17.0 | 17.0 | 17.0 |
| Kioxia ex-foundry | 1.1 | 1.1 | 1.3 | 1.4 | 1.3 | 1.3 | 1.5 | 1.5 | 2.7 | 3.0 | 3.6 | 4.1 | 4.9 | 5.7 | 6.5 | 6.5 | 6.5 |
| Micron | 2.1 | 2.3 | 2.5 | 2.6 | 2.7 | 2.8 | 2.9 | 3.1 | 4.1 | 5.3 | 6.2 | 7.8 | 9.5 | 11.4 | 13.7 | 13.7 | 13.7 |
| SK Hynix | 1.8 | - | - | - | - | - | - | - | 5.1 | 6.1 | 6.0 | 6.7 | - | - | - | - | - |
| Global total | 9.0 | 22.6 | 26.6 | 29.5 | 33.2 | ||||||||||||
| Bit growth QoQ/YoY | |||||||||||||||||
| Samsung | 7% | 3% | 11% | 8% | -1% | 0% | 9% | 8% | 3% | 16% | 11% | 3% | 20% | 18% | 17% | 17% | 17% |
| Kioxia ex-foundry | -10% | 2% | 16% | 4% | -5% | 3% | 11% | 3% | -1% | 10% | 19% | 15% | 20% | 15% | 15% | 15% | 15% |
| Micron | 2% | 6% | 9% | 5% | 4% | 2% | 4% | 5% | 0% | 27% | 18% | 26% | 22% | 20% | 19% | 19% | 19% |
| SK Hynix | -10% | - | - | - | - | - | - | - | 42% | 21% | -2% | 12% | - | - | |||
| Global total | -2% | 6% | 18% | 11% | 13% | ||||||||||||
| ASP chg QoQ/YoY | |||||||||||||||||
| Samsung | 88% | 65% | 15% | 0% | -2% | -3% | -5% | -3% | -15% | -45% | 66% | -7% | 266% | 7% | -12% | -12% | -12% |
| Kioxia ex-foundry | 105% | 75% | 3% | -2% | -3% | -4% | -6% | -3% | -15% | -46% | 43% | -15% | 276% | 0% | -14% | -14% | -14% |
| Micron | 79% | 87% | 6% | 4% | -2% | -3% | -8% | -4% | -3% | -52% | 61% | -13% | 254% | 7% | -16% | -16% | -16% |
| SK Hynix | 75% | - | - | - | - | - | - | - | -18% | -44% | 93% | -5% | - | - | - | - | - |
| Global total | 75% | -13% | -46% | 65% | -8% | ||||||||||||
| Sales mkt shr | |||||||||||||||||
| Samsung | 34% | 33% | 34% | 33% | 31% | ||||||||||||
| Kioxia ex-foundry | 13% | 14% | 13% | 12% | 11% | ||||||||||||
| Micron | 11% | 10% | 10% | 11% | 11% | ||||||||||||
| SK Hynix | 21% | 18% | 20% | 20% | 21% | ||||||||||||
| Global total | 100% | 100% | 100% | 100% | 100% | ||||||||||||
| Bit mkt shr | |||||||||||||||||
| Samsung | 31% | 34% | 34% | 34% | 31% | ||||||||||||
| Kioxia ex-foundry | 12% | 12% | 11% | 12% | 12% | ||||||||||||
| Micron | 24% | 18% | 20% | 21% | 23% | ||||||||||||
| SK Hynix | 20% | 23% | 23% | 20% | 20% | ||||||||||||
| Global total | 100% | 100% | 100% | 100% | 100% |
*Upbeat YTD data points not yet fully reflected in 2026 ASP; thus earnings upside seen
** SK Hynix information is historical data only
***Kioxia data mostly based on JV fab NAND production/sales; thus it can be different vs the company's GAAP basis accounting results
Source: Companies, BofA Global Research estimates, industry data. Chg = change. Equiv = equivalent
BofA GLOBAL RESEARCH
Exhibit 21: Smartphone and PC production cut assumed for 2026 due to memory chip shortage and very expensive BOM - a mild recovery assumed for 2027-28 once memory supply shortage somewhat relieved; separately server shipment growth can be stronger due to AI boom
Product unit assumptions - our underlying assumptions for tech product shipments
| 2016 | 2017 | 2018 | 2019 | 2020 | 2021 | 2022 | 2023 | 2024 | 2025 | 2026E | 2027E | 2028E | CAGR 2025-28E | |
|---|---|---|---|---|---|---|---|---|---|---|---|---|---|---|
| Units (mn) | ||||||||||||||
| 5G smartphone | 19 | 269 | 614 | 678 | 730 | 847 | 888 | 752 | 777 | 850 | -1.4% | |||
| Non-5G smartphone | 1,488 | 1,508 | 1,432 | 1,394 | 1,031 | 744 | 520 | 421 | 371 | 349 | 273 | 199 | 178 | -20.0% |
| Smartphones | 1,488 | 1,508 | 1,432 | 1,413 | 1,300 | 1,358 | 1,198 | 1,152 | 1,218 | 1,237 | 1,025 | 976 | 1,028 | -6.0% |
| Apple iPhone) | 215 | 216 | 205 | 192 | 195 | 238 | 233 | 225 | 222 | 243 | 215 | 262 | 269 | 3.4% |
| Samsung | 311 | 315 | 290 | 295 | 254 | 271 | 258 | 225 | 224 | 240 | 227 | 232 | 242 | 0.3% |
| Other OEMs | 962 | 977 | 936 | 926 | 851 | 849 | 707 | 702 | 772 | 754 | 583 | 482 | 517 | -11.8% |
| Tablet | 204 | 185 | 173 | 160 | 188 | 184 | 163 | 138 | 147 | 151 | 125 | 118 | 124 | -6.4% |
| SSD | 130 | 167 | 201 | 248 | 340 | 431 | 399 | 351 | 378 | 425 | 396 | 401 | 426 | 0.1% |
| PC | 256 | 255 | 255 | 261 | 297 | 351 | 294 | 253 | 256 | 275 | 228 | 217 | 228 | -6.0% |
| Server | 10 | 10 | 12 | 12 | 13 | 14 | 15 | 12 | 14 | 17 | 20 | 23 | 25 | 12.9% |
| Auto - DRAM embedded | 57 | 61 | 65 | 67 | 63 | 69 | 69 | 72 | 75 | 79 | 85 | 90 | 96 | 6.7% |
| TV (LCD, OLED) | 222 | 215 | 221 | 223 | 225 | 214 | 203 | 199 | 201 | 203 | 206 | 209 | 213 | 1.6% |
| Game - DRAM embedded | 44 | 50 | 52 | 51 | 42 | 48 | 43 | 41 | 42 | 42 | 43 | 45 | 45 | 2.1% |
| Growth YoY | ||||||||||||||
| 5G smartphone Non-5G smartphone | 3.3% | 1.3% | -5.1% | -2.6% | -26.1% | 128.1% -27.8% | 10.3% -30.1% | 7.8% -19.0% | 16.0% -12.0% | 4.9% -6.0% | -15.3% -21.8% | 3.3% -27.0% | 9.4% -10.4% | |
| Smartphones | 3.3% | 1.3% | -5.1% | -1.3% | -8.0% | 4.5% | -11.8% | -3.9% | 5.7% | 1.5% | -17.1% | -4.8% | 5.4% | |
| Apple iPhone) | -7.0% | 0.2% | -4.8% | -6.5% | 1.3% | 22.2% | -2.1% | -3.4% | -1.3% | 9.5% | -11.5% | 21.9% | 2.7% | |
| Samsung | -3.0% | 1.5% | -8.1% | 1.8% | -14.0% | 6.8% | -4.8% | -12.8% | -0.6% | 7.3% | -5.4% | 2.1% | 4.5% | |
| Other OEMs | 8.3% | 1.5% | -4.1% | -1.1% | -8.0% | -0.3% | -16.8% | -0.7% | 10.0% | -2.4% | -22.6% | -17.3% | 7.3% | |
| Tablet | -9.1% | -9.0% | -6.3% | -7.5% | 17.2% | -2.0% | -11.7% | -15.5% | 6.6% | 3.1% | -17.4% | -5.3% | 4.7% | |
| SSD | 36.2% | 28.4% | 20.0% | 23.7% | 36.9% | 26.7% | -7.3% | -12.0% | 7.6% | 12.4% | -6.8% | 1.1% | 6.2% | |
| PC | -5.9% | -0.3% | -0.2% | 2.6% | 13.6% | 4.0% | -16.2% | -13.8% | 1.0% | 7.6% | -17.0% | -4.9% | 5.1% | |
| Server | -1.6% | 7.2% | 15.7% | -0.4% | 7.3% | 6.9% | 9.7% | -17.5% | 18.0% | 19.8% | 16.9% | 11.7% | 10.3% | |
| Auto - DRAM embedded | 13.1% | 7.1% | 5.3% | 3.5% | -5.2% | 8.6% | 0.3% | 4.7% | 3.4% | 5.9% | 6.8% | 6.7% | 6.7% | |
| TV (LCD, OLED) | -1.2% | -3.2% | 2.9% | 0.7% | 1.0% | -5.2% | -4.8% | -2.1% | 1.0% | 1.1% | 1.2% | 1.8% | 1.8% | |
| Game - DRAM embedded | 6.9% | 12.8% | 3.0% | -1.3% | -16.8% | 12.5% | -9.7% | -4.9% | 2.5% | 1.0% | 2.4% | 3.0% | 0.8% |
Note: Sell-in based thus actual sell-through can be higher/lower than our assumptions; we still assume minimal impact of Huawei given other OEMs' market share increase, etc; memory content increase (auto, server,
SSD) likely stronger than unit growth; smartphone shipment estimate is slightly lowered due to Samsung Electronics' weak shipment for mid to low end phones vs upbeat AI smartphone GS24
Source: SA, IDC, IHS, BofA Global Research estimates
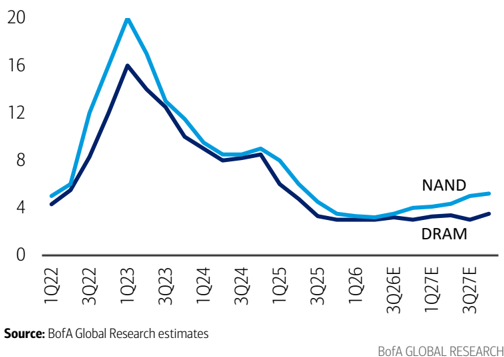
Exhibit 22: NAND inventories likely up through 2027 but still normal level or slightly higher; DRAM continuously tight
Memory chipmakers' inventories - finished chips in weeks
Source: BofA Global Research estimates
BofA GLOBAL RESEARCH
BofA GLOBAL RESEARCH
Exhibit 23: DRAM mostly full utilization; NAND also more than 90% - different vs 2H24-1H25 production cut
Memory chipmakers' fab utilization
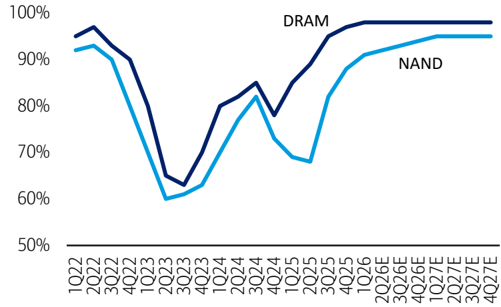
Source: BofA Global Research estimates
BofA GLOBAL RESEARCH
Exhibit 24: Mostly server (including HBM) and smartphone-driven sales seen
Implied DRAM sales mix based on bit shipments x ASP by application
| 2016 | 2017 | 2018 | 2019 | 2020 | 2021 | 2022 | 2023 | 2024 | 2025 | 2026E | 2027E | 2028E | |
|---|---|---|---|---|---|---|---|---|---|---|---|---|---|
| DRAM sales mix | |||||||||||||
| Servers | 25% | 26% | 35% | 24% | 30% | 31% | 41% | 33% | 48% | 55% | 58% | 61% | 65% |
| PCs | 10% | 14% | 14% | 13% | 14% | 15% | 14% | 11% | 11% | 12% | 6% | 5% | 5% |
| Smartphones | 26% | 31% | 29% | 45% | 38% | 36% | 34% | 33% | 34% | 30% | 21% | 18% | 17% |
| Spot, others, adjustments* | 39% | 29% | 22% | 18% | 18% | 18% | 12% | 22% | 7% | 2% | 14% | 16% | 13% |
| Demand mix total | 100% | 100% | 100% | 100% | 100% | 100% | 100% | 100% | 100% | 100% | 100% | 100% | 100% |
| DRAM sales, US$bn | |||||||||||||
| Servers | 10.2 | 18.9 | 34.4 | 14.9 | 19.4 | 28.5 | 31.6 | 15.8 | 42.3 | 73.4 | 331.9 | 501.9 | 585.5 |
| PCs | 4.1 | 10.0 | 13.9 | 8.4 | 8.9 | 14.2 | 10.6 | 5.3 | 9.6 | 16.6 | 36.9 | 41.9 | 41.2 |
| Smartphones | 10.6 | 22.9 | 29.0 | 27.9 | 25.0 | 32.9 | 26.1 | 15.7 | 29.6 | 40.6 | 119.8 | 148.7 | 155.2 |
| Spot, others, adjustments* | 16.3 | 21.0 | 22.0 | 11.3 | 12.0 | 16.6 | 9.4 | 10.5 | 6.5 | 3.2 | 80.0 | 133.9 | 118.8 |
| Total sales US$bn | 41.2 | 72.8 | 99.3 | 62.5 | 65.4 | 92.1 | 77.7 | 47.3 | 87.9 | 133.8 | 568.8 | 826.4 | 900.7 |
| DRAM ASP, US$/8Gb | |||||||||||||
| Servers | 5.9 | 7.7 | 9.9 | 3.3 | 3.1 | 3.6 | 3.2 | 1.8 | 3.2 | 4.0 | 14.0 | 17.7 | 17.0 |
| PCs | 2.6 | 5.8 | 7.2 | 3.7 | 3.0 | 3.6 | 3.0 | 1.5 | 2.4 | 3.5 | 10.4 | 13.1 | 11.2 |
| Smartphones | 4.1 | 6.6 | 6.9 | 5.1 | 4.1 | 4.4 | 3.5 | 2.0 | 2.9 | 3.3 | 11.7 | 14.9 | 13.4 |
| Spot, others, adjustments* | 4.5 | 5.7 | 6.6 | 3.0 | 2.9 | 3.4 | 2.7 | 1.7 | 2.0 | 4.6 | 12.6 | 13.8 | 11.1 |
| DRAM ind avg price | 4.3 | 6.4 | 7.7 | 3.9 | 3.3 | 3.8 | 3.2 | 1.8 | 2.9 | 3.7 | 13.0 | 16.1 | 14.9 |
| ASP change YoY | |||||||||||||
| Servers | -20% | 31% | 29% | -66% | -7% | 17% | -11% | -46% | 82% | 24% | 252% | 27% | -4% |
| PCs | -48% | 122% | 26% | -49% | -18% | 21% | -19% | -48% | 58% | 45% | 194% | 26% | -15% |
| Smartphones | -42% | 60% | 5% | -26% | -20% | 8% | -20% | -45% | 48% | 16% | 249% | 27% | -10% |
| Spot, others, adjustments* | -35% | 25% | 17% | -54% | -6% | 19% | -21% | -37% | 18% | 128% | 177% | 9% | -20% |
| DRAM ind avg price | -34% | 48% | 20% | -49% | -15% | 14% | -16% | -45% | 62% | 29% | 249% | 25% | -8% |
*Implied amount after server/PC/smartphone demand, thus negative figures possible due to channel inventories (not consumed)
Source: Company data, BofA Global Research estimates, industry data
Exhibit 25: Mostly for SSD (including enterprise solutions) and smartphone applications
Implied NAND sales mix based on bit shipments x ASP by application
| 2016 | 2017 | 2018 | 2019 | 2020 | 2021 | 2022 | 2023 | 2024 | 2025 | 2026E | 2027E | 2028E | |
|---|---|---|---|---|---|---|---|---|---|---|---|---|---|
| NAND sales mix | |||||||||||||
| SSD | 30% | 33% | 34% | 36% | 45% | 47% | 48% | 40% | 49% | 52% | 60% | 61% | 64% |
| Smartphone | 36% | 38% | 33% | 34% | 33% | 34% | 33% | 31% | 35% | 33% | 25% | 23% | 23% |
| Spot, others, adjustments* | 34% | 29% | 33% | 30% | 22% | 19% | 18% | 29% | 16% | 14% | 15% | 17% | 14% |
| Demand mix total | 100% | 100% | 100% | 100% | 100% | 100% | 100% | 100% | 100% | 100% | 100% | 100% | 100% |
| NAND sales, US$bn | |||||||||||||
| SSD | 11.1 | 19.8 | 22.9 | 16.7 | 26.5 | 34.3 | 32.6 | 16.9 | 38.6 | 42.2 | 193.4 | 255.7 | 268.5 |
| Smartphone | 13.7 | 22.3 | 22.0 | 15.5 | 19.2 | 24.9 | 22.4 | 13.1 | 27.2 | 27.1 | 81.8 | 94.6 | 95.7 |
| Spot, others, adjustments* | 12.8 | 17.2 | 22.6 | 14.1 | 12.7 | 14.1 | 12.3 | 12.4 | 12.3 | 11.7 | 47.9 | 70.0 | 57.2 |
| Total sales US$bn | 37.6 | 59.2 | 67.4 | 46.3 | 58.5 | 73.3 | 67.3 | 42.4 | 78.1 | 81.0 | 323.1 | 420.4 | 421.5 |
| NAND ASP, US$/8Gb | |||||||||||||
| SSD | 8.5 | 10.6 | 8.8 | 4.5 | 4.4 | 4.0 | 3.4 | 1.7 | 3.1 | 2.7 | 11.1 | 12.6 | 11.2 |
| Smartphone | 8.7 | 10.5 | 8.6 | 4.4 | 4.3 | 4.1 | 3.3 | 1.7 | 2.8 | 2.3 | 7.9 | 9.0 | 7.7 |
| Spot, others, adjustments* | 7.7 | 9.2 | 6.9 | 3.0 | 2.6 | 2.1 | 2.0 | 1.4 | 1.7 | 2.1 | 4.2 | 4.3 | 3.2 |
| NAND ind avg price | 8.3 | 10.1 | 8.0 | 3.9 | 3.8 | 3.4 | 3.0 | 1.6 | 2.6 | 2.4 | 8.2 | 8.9 | 7.8 |
| ASP change YoY | |||||||||||||
| SSD | -29% | 25% | -17% | -49% | -1% | -10% | -13% | -49% | 76% | -13% | 314% | 14% | -11% |
| Smartphone | -30% | 21% | -18% | -48% | -2% | -4% | -21% | -48% | 64% | -18% | 248% | 14% | -15% |
| Spot, others, adjustments* | -27% | 19% | -24% | -57% | -14% | -17% | -8% | -31% | 26% | 23% | 97% | 3% | -26% |
| NAND ind avg price | -28% | 22% | -21% | -52% | -2% | -9% | -13% | -46% | 65% | -8% | 238% | 9% | -13% |
*Implied amount after SSD/smartphone demand, thus negative figures possible due to channel inventories (not consumed)
Source: Company data, BofA Global Research estimates, industry data
BofA GLOBAL RESEARCH
BofA GLOBAL RESEARCH
Record high capex includes heavy infrastructure spending
Exhibit 26: Big-3 DRAM makers' capex to grow in 2026, but it includes lots of non-WFE spending (shell fab, utilities, TCB/HB); overall capex growth rate likely to decelerate through 2027-28 vs 40%+ CAGR in 2023-25
DRAM capex trend
| US$bn | 2018 | 2019 | 2020 | 2021 | 2022 | 2023 | 2024 | 2025 | 2026E | 2027E | 2028E |
|---|---|---|---|---|---|---|---|---|---|---|---|
| Samsung | 12.5 | 8.9 | 8.2 | 11.6 | 12.2 | 13.9 | 17.0 | 19.9 | 29.0 | 38.8 | 44.3 |
| SK Hynix | 8.1 | 7.4 | 5.6 | 7.3 | 8.9 | 3.8 | 9.0 | 16.1 | - | - | - |
| Micron | 4.6 | 4.3 | 5.3 | 5.6 | 5.7 | 3.9 | 6.3 | 13.1 | 27.9 | 37.4 | 37.2 |
| Nanya | 0.7 | 0.2 | 0.3 | 0.4 | 0.7 | 0.4 | 0.5 | 0.4 | 1.7 | 2.3 | 2.3 |
| CXMT | 0.7 | 1.5 | 1.5 | 1.7 | 2.6 | 4.0 | 3.5 | 4.0 | 4.4 | 4.5 | |
| DRAM capex total | 27.1 | 21.9 | 21.4 | 27.1 | 31.0 | 25.2 | 37.7 | 53.9 | |||
| Capex change YoY | 66% | -19% | -2% | 27% | 14% | -19% | 49% | 43% | |||
| DRAM capex to sales | 27% | 35% | 33% | 29% | 40% | 53% | 43% | 40% | |||
| DRAM capex share | |||||||||||
| Samsung | 46% | 41% | 38% | 43% | 39% | 55% | 45% | 37% | |||
| SK Hynix | 30% | 34% | 26% | 27% | 29% | 15% | 24% | 30% | |||
| Micron | 17% | 19% | 25% | 21% | 19% | 16% | 17% | 24% | |||
| Nanya | 2% | 1% | 1% | 1% | 2% | 2% | 1% | 1% | |||
| CXMT | 3% | 7% | 6% | 5% | 10% | 11% | 6% | ||||
| Total | 99% | 100% | 100% | 100% | 100% | 100% | 100% | 100% | |||
| DRAM capex YoY | |||||||||||
| Samsung | 72% | -28% | -8% | 42% | 5% | 14% | 22% | 17% | |||
| SK Hynix | 71% | -10% | -23% | 30% | 22% | -58% | 138% | 79% | |||
| Micron | 72% | -8% | 24% | 6% | 3% | -32% | 62% | 106% | |||
| Nanya | -30% | -74% | 62% | 40% | 72% | -39% | 27% | -17% | |||
| CXMT | 75% | 114% | 0% | 13% | 50% | 57% | -13% | ||||
| Total | 66% | -19% | -2% | 27% | 14% | -19% | 49% | 43% |
- SK Hynix information is historical data only
Source:
Companies' reports, BofA Global Research estimates
Exhibit 27: NAND capex also grows in 2026, but mainly due to low base in 2025
NAND capex trend
| US$bn | 2018 | 2019 | 2020 | 2021 | 2022 | 2023 | 2024 | 20252026E2027E2028E | |||
|---|---|---|---|---|---|---|---|---|---|---|---|
| Samsung | 7.3 | 4.9 | 9.2 | 10.9 | 10.3 | 10.1 | 8.1 | 4.6 | 8.2 | 11.2 | 12.5 |
| Kioxia &JVs | 5.0 | 3.8 | 4.5 | 5.7 | 6.5 | 2.7 | 4.5 | 5.2 | 7.0 | 7.5 | 7.0 |
| Micron | 4.7 | 4.4 | 3.4 | 4.6 | 5.2 | 2.7 | 3.1 | 4.6 | 7.4 | 7.7 | 7.9 |
| SK Hynix | 6.3 | 4.4 | 2.7 | 3.4 | 4.1 | 1.6 | 2.3 | 2.5 | - | - | - |
| Intel China | 2.0 | 1.6 | 0.8 | 1.5 | 0.0 | 0.0 | 0.0 | 0.0 | 0.0 | 0.0 | 0.0 |
| YMTC | 0.3 | 0.7 | 1.6 | 1.5 | 2.5 | 2.3 | 2.0 | 2.0 | 3.0 | 3.5 | 4.0 |
| NAND capex total | 26.0 | 20.1 | 22.5 | 27.9 | 29.0 | 19.7 | 20.4 | 19.3 | |||
| NAND capex chg YoY | 7% | -23% | 12% | 24% | 4% | -32% | 4% | -5% | |||
| NAND capex to sales | 38% | 43% | 38% | 38% | 43% | 46% | 26% | 24% | |||
| NAND capex share | |||||||||||
| Samsung | 28% | 25% | 41% | 39% | 36% | 51% | 39% | 24% | |||
| Kioxia &JVs | 19% | 19% | 20% | 20% | 22% | 14% | 22% | 27% | |||
| Micron | 18% | 22% | 15% | 17% | 18% | 14% | 15% | 24% | |||
| SK Hynix | 24% | 22% | 12% | 12% | 14% | 8% | 11% | 13% | |||
| Intel China | 8% | 8% | 4% | 5% | n/a | n/a | n/a | n/a | |||
| YMTC | 1% | 3% | 7% | 5% | 9% | 11% | 10% | 10% | |||
| NAND capex total | 100% | 100% | 100% | 100% | 100% | 100% | 100% | 100% | |||
| NAND capex growth (YoY) | |||||||||||
| Samsung | -36% | -33% | 87% | 19% | -5% | -2% | -20% | -42% | 76% | 37% | 12% |
| Kioxia &JVs | 4% | -24% | 18% | 27% | 14% | -58% | 67% | 16% | 35% | 7% | -7% |
| Micron | 100% | -6% | -22% | 35% | 11% | -47% | 13% | 49% | 60% | 5% | 2% |
| SK Hynix | 97% | -29% | -38% | 26% | 19% | -60% | 42% | 5% | - | - | - |
| Intel China | 0% | -23% | -48% | 88% | na | na | na | na | na | na | na |
| YMTC | 200% | 133% | 129% | -6% | 67% | -10% | -11% | 0% | 50% | 17% | 14% |
| NAND capex total | 7% | -23% | 12% | 24% | 4% | -32% | 4% | -5% |
- SK Hynix information is historical data only
**Kioxia data mostly based on JV fab NAND production/sales; thus it can be different vs the company's GAAP basis accounting
results
Source:
Companies' reports, BofA Global Research estimates
BofA GLOBAL RESEARCH
BofA GLOBAL RESEARCH
Exhibit 28: Ex-conventional DRAM equipment capex spend likely up strongly due to HBM, but conventional DRAM and NAND spend broadly disciplined; nonequipment spend for buildings and utilities remain high
SPE vs non-SPE capex spend
| US$bn | 2019 | 2020 | 2021 | 2022 | 2023 | 2024 | 2025 | 2026E | 2027E | 2028E |
|---|---|---|---|---|---|---|---|---|---|---|
| SPE capex | ||||||||||
| DRAM | 12.1 | 12.7 | 16.2 | 17.3 | 14.1 | 23.8 | 34.8 | 58.9 | 74.8 | 79.9 |
| NAND | 12.1 | 14.3 | 18.2 | 18.7 | 11.9 | 12.9 | 13.5 | 21.5 | 25.6 | 26.8 |
| Total | 24.3 | 26.9 | 34.4 | 35.9 | 26.0 | 36.7 | 48.3 | 80.4 | 100.4 | 106.7 |
| SPE capex YoY | ||||||||||
| DRAM | -22% | 4% | 28% | 7% | -18% | 69% | 46% | 69% | 27% | 7% |
| NAND | -24% | 17% | 28% | 3% | -36% | 8% | 5% | 59% | 19% | 5% |
| Total | -23% | 11% | 28% | 5% | -28% | 41% | 32% | 66% | 25% | 6% |
| Non-SPE to capex | ||||||||||
| DRAM | 45% | 41% | 40% | 44% | 44% | 37% | 35% | 34% | 34% | 33% |
| NAND | 39% | 37% | 35% | 36% | 40% | 37% | 30% | 29% | 28% | 28% |
| Total | 42% | 39% | 38% | 40% | 42% | 37% | 34% | 32% | 32% | 32% |
| Total capex, US$bn | ||||||||||
| DRAM | 21.9 | 21.4 | 27.1 | 31.0 | 25.2 | 37.7 | 53.9 | 88.6 | 112.9 | 119.5 |
| NAND | 20.1 | 22.5 | 27.9 | 29.0 | 19.7 | 20.4 | 19.3 | 30.1 | 35.4 | 37.2 |
| Total | 42.0 | 43.9 | 55.0 | 60.0 | 45.0 | 58.2 | 73.2 | 118.7 | 148.3 | 156.7 |
Source: Company data, BofA Global Research estimates, industry data
BofA GLOBAL RESEARCH
Exhibit 29: DRAM capex increase likely to remain strong even in 2026 driven by big-3 chipmakers; NAND capex growth also notable (due to low base)
SPE capex spend by memory chipmakers
| US$bn | 2019 | 2020 | 2021 | 2022 | 2023 | 2024 | 2025 | 2026E | 2027E | 2028E |
|---|---|---|---|---|---|---|---|---|---|---|
| DRAM SPE | ||||||||||
| Samsung | 5.5 | 4.8 | 6.9 | 7.0 | 7.8 | 9.8 | 12.3 | 18.3 | 24.8 | 28.8 |
| SK Hynix | 2.9 | 2.5 | 3.4 | 4.3 | 1.6 | 6.1 | 9.9 | - | - | - |
| Micron | 2.9 | 3.5 | 3.7 | 3.8 | 2.1 | 3.8 | 9.0 | 18.1 | 23.2 | 23.4 |
| Nanya | 0.1 | 0.2 | 0.4 | 0.5 | 0.3 | 0.4 | 0.3 | 1.1 | 1.5 | 1.5 |
| CXMT | 0.3 | 1.2 | 1.3 | 1.2 | 2.0 | 3.2 | 2.8 | 3.2 | 3.5 | 3.6 |
| DRAM SPE total | 12.1 | 12.7 | 16.2 | 17.3 | 14.1 | 23.8 | 34.8 | |||
| YoY | ||||||||||
| Samsung | -25% | -14% | 44% | 1% | 12% | 27% | 25% | 49% | 36% | 16% |
| SK Hynix | -21% | -14% | 32% | 27% | -63% | 284% | 63% | - | - | - |
| Micron | -14% | 24% | 6% | 3% | -45% | 80% | 137% | 101% | 28% | 1% |
| DRAM SPE total | -22% | 4% | 28% | 7% | -18% | 69% | 46% | |||
| NAND SPE | ||||||||||
| Samsung | 3.4 | 5.7 | 6.7 | 6.6 | 6.2 | 5.2 | 3.2 | 6.2 | 8.4 | 9.4 |
| Kioxia &JVs | 2.1 | 2.7 | 3.4 | 4.1 | 1.4 | 2.7 | 3.7 | 5.0 | 5.3 | 4.8 |
| Micron | 3.0 | 2.3 | 3.1 | 3.5 | 1.4 | 1.9 | 3.0 | 5.2 | 5.4 | 5.5 |
| SK Hynix | 2.3 | 1.8 | 2.4 | 2.5 | 1.0 | 1.5 | 1.9 | - | - | - |
| YMTC | 0.0 | 1.0 | 1.2 | 1.8 | 1.8 | 1.3 | 1.4 | 2.0 | 2.5 | 2.8 |
| NAND SPE total | 12.1 | 14.3 | 18.2 | 18.7 | 11.9 | 12.9 | 13.5 | |||
| YoY | ||||||||||
| Samsung | -26% | 68% | 19% | -2% | -6% | -16% | -40% | 95% | 37% | 12% |
| Micron | -3% | -22% | 35% | 11% | -59% | 33% | 62% | 72% | 5% | 1% |
| SK Hynix | -38% | -24% | 36% | 2% | -61% | 57% | 27% | - | - | - |
| YMTC | 25% | 46% | 3% | -28% | 8% | 39% | 26% | 14% | ||
| NAND SPE total | -24% | 17% | 28% | 3% | -36% | 8% | 5% |
- SK Hynix information is historical data only
**Kioxia data mostly based on JV fab NAND production/sales; thus it can be different vs the company's GAAP basis accounting results
Source: Company data, BofA Global Research estimates, industry data
BofA GLOBAL RESEARCH
2026/27E HBM TAM expansion to US$77bn/135bn
Exhibit 30: We maintain our bullish view on HBM. We assume strong growth in 2026 sales (US$77bn; +122% YoY) driven by solid ASP growth (+27% YoY) and robust bit growth (+76%). Industry average OPM near 50%; no downturn in 2027 given volume growth and cost reduction fully offset price cut.
Global HBM market - record high revenue continues into 2027E (US$135bn)
| 2022 | 2023 | 2024 | 2025 | 2026E | 2027E | 2028E | 2029E | 2030E | CAGR 2025-28E | |
|---|---|---|---|---|---|---|---|---|---|---|
| HBMearnings | ||||||||||
| Sales, US$bn | 1.6 | 4.2 | 17.4 | 34.5 | 76.8 | 134.6 | 176.3 | 204.6 | 246.3 | 72% |
| Shipment units, GB bn | 0.1 | 0.5 | 1.6 | 3.1 | 5.4 | 7.7 | 10.1 | 12.9 | 16.2 | 49% |
| ASP, US$/GB | 16.7 | 8.8 | 11.0 | 11.3 | 14.3 | 17.4 | 17.5 | 15.9 | 15.2 | 16% |
| Price premium | 430% | 436% | 355% | 274% | 12% | 9% | 22% | 2% | -6% | |
| OP, US$bn | 0.4 | 1.8 | 8.3 | 14.6 | 37.6 | 72.4 | 98.2 | 111.3 | 135.7 | 89% |
| OP margin | 25% | 42% | 48% | 42% | 49% | 54% | 56% | 54% | 55% | |
| %YoY | ||||||||||
| Sales, US$bn | 55% | 155% | 316% | 98% | 122% | 75% | 31% | 16% | 20% | |
| Shipment units, GB bn | 95% | 383% | 233% | 94% | 76% | 44% | 30% | 27% | 26% | |
| ASP, US$/GB | n/a | n/a | 25% | 2% | 27% | 22% | 0% | -9% | -4% | |
| HBMshipment mix | ||||||||||
| HBM5+ | 0% | 0% | 0% | 0% | 0% | 0% | 23% | 55% | 79% | |
| HBM4e | 0% | 0% | 0% | 0% | 0% | 19% | 51% | 36% | 19% | |
| HBM4 | 0% | 0% | 0% | 0% | 32% | 64% | 24% | 9% | 3% | |
| HBM3e | 0% | 0% | 58% | 83% | 60% | 16% | 3% | 1% | 0% | |
| HBM3 | 10% | 60% | 27% | 14% | 7% | 1% | 0% | 0% | 0% | |
| HBM2e &below | 90% | 40% | 15% | 3% | 1% | 0% | 0% | 0% | 0% | |
| HBMmix total | 100% | 100% | 100% | 100% | 100% | 100% | 100% | 100% | 100% | |
| %toDRAMshipment | 0.4% | 1.8% | 5.2% | 8.5% | 12.2% | 15.1% | 16.7% | 18.8% | 21.1% | |
| %toDRAMsales | 2.1% | 8.8% | 19.8% | 25.8% | 13.5% | 16.3% | 19.6% | 19.1% | 20.2% | |
| Wafer capacity,kwpm | 68 | 87 | 204 | 360 | 476 | 624 | 741 | 815 | 897 | 27% |
| %toDRAMwafer capacity | 4.4% | 5.4% | 11.8% | 19.3% | 23.0% | 27.8% | 31.1% | 32.6% | 34.5% | |
| Main node | 1z | 1z | 1a, 1b | 1a, 1b | 1b, 1c | 1c | 1c, 1d | 1d | 1d, 1e | |
| Implied demand, GB bn units | 0.1 | 0.5 | 1.8 | 3.3 | 6.4 | 8.7 | 10.2 | 12.1 | 15.8 | 46% |
| AI+HBM server units,mn | 0.3 | 1.0 | 1.9 | 2.8 | 4.5 | 5.9 | 6.3 | 6.8 | 7.5 | 32% |
| AI+HBM server shipment YoY | 42% | 289% | 88% | 50% | 62% | 30% | 8% | 7% | 11% | |
| GB HBMper AI+HBM server | 340 | 530 | 1,171 | 1,413 | 1,479 | 1,612 | 1,789 | 2,093 | 11% | |
| GB content growth QoQ/YoY | 13% | 56% | 954 80% | 23% | 21% | 5% | 9% | 11% | 17% | |
| AI+HBM to total server units* | 1.7% | 8.1% | 12.9% | 16.1% | 22.3% | 26.0% | 25.4% | 25.4% | 26.4% | |
| Global server units,mn | 14.9 | 12.3 | 14.5 | 17.3 | 20.2 | 22.6 | 24.9 | 26.7 | 28.6 | 13% |
| Global server units YoY | 10% | -17% | 18% | 20% | 17% | 12% | 10% | 7% | 7% | |
| Excess supply, GB bn units | 0.01 | -0.05 | -0.20 | -0.20 | -1.01 | -0.95 | -0.15 | 0.70 | 0.41 | |
| HBMsufficiency (supply to demand) | 13% | -10% | -11% | -6% | -16% | -11% | -1% | 6% | 3% |
Source: Companies' reports, BofA Global Research estimates
BofA GLOBAL RESEARCH
Exhibit 31: Our bottom-up approach based on Big-3 companies' track record and long-term plans
Global HBM market share by company
| 2022 | 2023 | 2024 | 2025 | 2026E | 2027E | 2028E | 2029E | 2030E | CAGR 2025-28E | |
|---|---|---|---|---|---|---|---|---|---|---|
| HBMunits, GB bn | ||||||||||
| SK Hynix | 0.06 | 0.27 | 0.87 | 1.78 | - | - | - | - | - | - |
| Samsung | 0.03 | 0.20 | 0.61 | 0.66 | 1.82 | 2.80 | 3.61 | 4.51 | 5.50 | 76% |
| Others | 0.00 | 0.01 | 0.10 | 0.62 | - | - | - | - | - | - |
| Global HBMtotal GB bn units | 0.10 | 0.47 | 1.58 | 3.06 | 5.38 | 7.74 | 10.08 | 12.85 | 16.19 | 49% |
| %of global DRAM volume | 0.4% | 1.8% | 5.2% | 8.5% | 12.2% | 15.1% | 16.7% | 18.8% | 21.1% | |
| HBMwafer capa, k wpm- yr avg | ||||||||||
| SK Hynix | 35 | 37 | 100 | 153 | - | - | - | - | - | - |
| Samsung | 30 | 45 | 78 | 133 | 178 | 246 | 298 | 312 | 322 | 31% |
| Others | 3 | 5 | 27 | 75 | - | - | - | - | - | - |
| GlobalHBM wafer capa total | 68 | 87 | 204 | 360 | 476 | 624 | 741 | 815 | 897 | 27% |
| %of global DRAM capacity | 4.4% | 5.4% | 11.8% | 19.3% | 23.0% | 27.8% | 31.1% | 32.6% | 34.5% | |
| Main node | 1z | 1z | 1a, 1b | 1a, 1b | 1b, 1c | 1c | 1c, 1d | 1d | 1d, 1e | |
| HBMASP, US$/GB | ||||||||||
| SK Hynix | 16.2 | 8.5 | 11.1 | 11.8 | - | - | - | - | - | - |
| Samsung | 17.8 | 9.3 | 11.0 | 9.8 | 14.8 | 17.3 | 17.4 | 16.0 | 15.2 | 21% |
| Global average - HBMASP | 16.7 | 8.8 | 11.0 | 11.3 | 14.3 | 17.4 | 17.5 | 15.9 | 15.2 | 16% |
| HBMprice premium | 430% | 436% | 355% | 274% | 12% | 9% | 22% | 2% | -6% | |
| HBMsales, US$bn | ||||||||||
| SK Hynix | 1.1 | 2.3 | 9.6 | 20.9 | - | - | - | - | - | - |
| Samsung | 0.6 | 1.8 | 6.7 | 6.5 | 26.9 | 48.5 | 62.7 | 72.1 | 83.6 | 113% |
| Others | 0.0 | 0.1 | 1.1 | 7.1 | - | - | - | - | - | - |
| GlobalHBM sales total | 1.6 | 4.2 | 17.4 | 34.5 | 76.8 | 134.6 | 176.3 | 204.6 | 246.3 | 72% |
| %of global DRAM sales | 2.1% | 8.8% | 19.8% | 25.8% | 13.5% | 16.3% | 19.6% | 19.1% | 20.2% | |
| Ex-HBM global DRAM | ||||||||||
| ex-HBM wafer capa,kwpm | 1,493 | 1,541 | 1,530 | 1,507 | 1,590 | 1,618 | 1,638 | 1,683 | 1,701 | 3% |
| ex-HBM GB bn units | 24.1 | 26.2 | 29.0 | 33.0 | 38.5 | 43.5 | 50.4 | 55.5 | 60.4 | 15% |
| ex-HBM ASP, US$/GB | 3.2 | 1.6 | 2.4 | 3.0 | 12.8 | 15.9 | 14.4 | 15.6 | 16.1 | 68% |
| ex-HBM sales, US$bn | 76.0 | 43.1 | 70.5 | 99.3 | 492.0 | 691.8 | 724.5 | 864.1 | 974.6 | 94% |
| HBMOPM | ||||||||||
| SK Hynix | 25% | 47% | 63% | 64% | - | - | - | - | - | - |
| Samsung | 27% | 38% | 33% | 20% | 53% | 58% | 62% | 62% | 63% | |
| HBMbit market share | ||||||||||
| SK Hynix | 66% | 57% | 55% | 58% | - | - | - | - | - | - |
| Samsung | 32% | 42% | 39% | 22% | 34% | 36% | 36% | 35% | 34% | |
| HBMsales market share | ||||||||||
| SK Hynix | 64% | 54% | 55% | 61% | - | - | - | - | - | - |
| Samsung | 34% | 44% | 39% | 19% | 35% | 36% | 36% | 35% | 34% | |
| HBMwafer capa mkt share | ||||||||||
| SK Hynix | 51% | 43% | 49% | 42% | - | |||||
| Samsung | 44% | 52% | 38% | 37% | ||||||
| HBMwafer capa mkt share total | 100% | 100% | 100% | 100% |
- SK Hynix information is historical data only
Source: Companies' reports, BofA Global Research estimates
BofA GLOBAL RESEARCH
Exhibit 32: Samsung's upside could come from more normalized HBM price (2026-28) vs 2025 bottom, focused on NVIDIA's Tier 2 customers (ex-US data centers) and Big Tech companies (Amazon, Google, Broadcom, AMD, etc.)
SEC - HBM earnings outlook
| 1Q26 | 2Q26E | 3Q26E | 4Q26E | 1Q27E | 2Q27E | 3Q27E | 4Q27E | 2023 | 2024 | 2025 | 2026E | 2027E | 2028E | 2029E | 2030E | |
|---|---|---|---|---|---|---|---|---|---|---|---|---|---|---|---|---|
| HBM | ||||||||||||||||
| Sales, US$bn | 2.82 | 4.45 | 7.33 | 12.34 | 11.17 | 10.93 | 12.50 | 13.90 | 1.84 | 6.75 | 6.46 | 26.94 | 48.50 | 62.73 | 72.14 | 83.61 |
| %to DRAM sales | 7.2% | 7.4% | 9.9% | 15.2% | 13.4% | 12.8% | 13.5% | 14.6% | 8.4% | 17.2% | 12.1% | 10.6% | 13.6% | 16.6% | 18.3% | 21.4% |
| Shipment, GB bn | 0.24 | 0.30 | 0.48 | 0.80 | 0.68 | 0.64 | 0.71 | 0.77 | 0.20 | 0.61 | 0.66 | 1.82 | 2.80 | 3.61 | 4.51 | 5.50 |
| ASP, US$/GB | 11.63 | 14.77 | 15.21 | 15.52 | 16.52 | 17.02 | 17.53 | 18.06 | 9.31 | 11.00 | 9.76 | 14.79 | 17.31 | 17.38 | 15.99 | 15.19 |
| Price premium | 31% | 14% | -4% | -10% | -6% | -3% | 2% | 8% | 440% | 335% | 200% | 8% | 1% | 12% | 0% | 2% |
| Cost, US$/GB | 6.7 | 6.5 | 6.9 | 7.3 | 7.4 | 7.4 | 7.1 | 7.0 | 5.8 | 7.4 | 7.8 | 7.0 | 7.2 | 6.5 | 6.1 | 5.7 |
| OP, US$bn | 1.20 | 2.48 | 4.03 | 6.50 | 6.16 | 6.17 | 7.42 | 8.48 | 0.70 | 2.22 | 1.29 | 14.21 | 28.23 | 39.10 | 44.67 | 52.45 |
| OP margin | 43% | 56% | 55% | 53% | 55% | 56% | 59% | 61% | 38% | 33% | 20% | 53% | 58% | 62% | 62% | 63% |
| Wafer capa,kwpm | 160 | 170 | 180 | 200 | 220 | 240 | 250 | 275 | 45 | 78 | 133 | 178 | 246 | 298 | 312 | 322 |
| QoQ/YoY | ||||||||||||||||
| Sales | 27% | 57% | 65% | 68% | -9% | -2% | 14% | 11% | 267% | -4% | 317% | 80% | 29% | 15% | 16% | |
| Shipment | 5% | 24% | 60% | 65% | -15% | -5% | 11% | 8% | 210% | 8% | 175% | 54% | 29% | 25% | 22% | |
| ASP | 21% | 27% | 3% | 2% | 7% | 3% | 3% | 3% | 18% | -11% | 52% | 17% | 0% | -8% | -5% | |
| Cost | 13% | -2% | 5% | 7% | 1% | 0% | -4% | -1% | 28% | 6% | -10% | 4% | -10% | -7% | -7% | |
| OP | 41% | 106% | 62% | 62% | -5% | 0% | 20% | 14% | 217% | -42% | 998% | 99% | 39% | 14% | 17% | |
| Wafer capa | 7% | 6% | 6% | 11% | 10% | 9% | 4% | 10% | 72% | 71% | 34% | 39% | 21% | 5% | 3% | |
| HBMshipment mix | ||||||||||||||||
| HBM5 &above | 0.0% | 0.0% | 0.0% | 0.0% | 0.0% | 0.0% | 0.0% | 0.1% | 0.0% | 0.0% | 0.0% | 0.0% | 0.0% | 39.4% | 60.0% | 80.0% |
| HBM4e | 0.0% | 0.0% | 0.0% | 0.0% | 1.0% | 5.0% | 15.0% | 30.0% | 0.0% | 0.0% | 0.0% | 0.0% | 13.5% | 49.3% | 34.0% | 18.0% |
| HBM4 | 1.0% | 20.0% | 30.0% | 42.0% | 60.0% | 70.0% | 65.0% | 60.0% | 0.0% | 0.0% | 0.0% | 29.7% | 63.6% | 11.1% | 6.0% | 2.0% |
| HBM3e | 95.0% | 78.0% | 69.0% | 58.0% | 39.0% | 25.0% | 20.0% | 9.9% | 0.0% | 19.8% | 77.3% | 69.1% | 23.0% | 0.2% | 0.0% | 0.0% |
| HBM3 | 3.0% | 2.0% | 1.0% | 0.0% | 0.0% | 0.0% | 0.0% | 0.0% | 6.3% | 58.1% | 18.4% | 1.0% | 0.0% | 0.0% | 0.0% | 0.0% |
| HBM2e &below | 1.0% | 0.0% | 0.0% | 0.0% | 0.0% | 0.0% | 0.0% | 0.0% | 93.7% | 22.1% | 4.4% | 0.1% | 0.0% | 0.0% | 0.0% | 0.0% |
| Mix total | 100.0% | 100.0% | 100.0% | 100.0% | 100.0% | 100.0% | 100.0% | 100.0% | 100.0% | 100.0% | 100.0% | 100.0% | 100.0% | 100.0% | 100.0% | 100.0% |
| Hi-mix | ||||||||||||||||
| 20-hi &above | 0.0% | 0.0% | 0.0% | 0.0% | 0.0% | 0.0% | 0.0% | 0.1% | 0.0% | 0.0% | 0.0% | 0.0% | 0.0% | 39.4% | 60.0% | 80.0% |
| 16-hi | 0.0% | 0.0% | 0.0% | 0.3% | 2.0% | 5.0% | 15.0% | 30.0% | 0.0% | 0.0% | 0.0% | 0.1% | 13.7% | 49.3% | 39.0% | 20.0% |
| 12-hi | 51.0% | 75.0% | 90.0% | 92.7% | 94.0% | 93.0% | 84.0% | 69.9% | 0.0% | 0.4% | 17.2% | 83.5% | 84.6% | 11.2% | 1.0% | 0.0% |
| 8-hi | 49.0% | 25.0% | 10.0% | 7.0% | 4.0% | 2.0% | 1.0% | 0.0% | 100.0% | 99.6% | 82.8% | 16.4% | 1.7% | 0.0% | 0.0% | 0.0% |
| Hi-mix total | 100.0% | 100.0% | 100.0% | 100.0% | 100.0% | 100.0% | 100.0% | 100.0% | 100.0% | 100.0% | 100.0% | 100.0% | 100.0% | 100.0% | 100.0% | 100.0% |
| %HBMtoDRAM | ||||||||||||||||
| Sales | 7% | 7% | 10% | 15% | 13% | 13% | 14% | 15% | 8% | 17% | 12% | 11% | 14% | 17% | 18% | 21% |
| Shipment | 6% | 7% | 10% | 17% | 14% | 13% | 13% | 14% | 2% | 5% | 4% | 10% | 14% | 15% | 17% | 19% |
| OP | 4% | 7% | 8% | 12% | 12% | 11% | 12% | 14% | -72% | 19% | 6% | 8% | 12% | 18% | 38% | 45% |
| Wafer capa | 24% | 25% | 26% | 28% | 30% | 32% | 33% | 37% | 6% | 11% | 20% | 26% | 33% | 38% | 39% | 40% |
| QoQ/YoY | 2.82 | 4.45 | 7.33 | 12.34 | 11.17 | 10.93 | 12.50 | 13.90 | 6.75 | 6.46 | 26.94 | 48.50 | 62.73 | |||
| Sales | 7.2% | 9.9% | 1.84 | 17.2% | 10.6% | 72.14 | 83.61 | |||||||||
| 7.4% | 15.2% | 13.4% | 12.8% | 13.5% | 14.6% | 8.4% | 12.1% | 13.6% | 16.6% | 18.3% | 21.4% | |||||
| Shipment | 0.24 | 0.30 | 0.48 | 0.80 | 0.68 | 0.64 | 0.71 | 0.77 | 0.20 | 0.61 | 0.66 | 1.82 | 2.80 | 3.61 | 4.51 | 5.50 |
| ASP | 11.63 31% | 14.77 14% | 15.21 -4% | 15.52 -10% | 16.52 -6% | 17.02 -3% | 17.53 2% | 18.06 8% | 9.31 440% | 11.00 335% | 9.76 200% | 14.79 8% | 17.31 1% | 17.38 12% | 15.99 0% | 15.19 2% |
| Cost | 7.4 | 7.8 | 7.0 | |||||||||||||
| OP | 6.7 | 6.5 | 6.9 | 7.3 | 7.4 | 7.1 | 7.0 | 5.8 | 7.4 | 7.2 | 6.5 | 6.1 | 5.7 | |||
| Wafer capa | 1.20 | 2.48 | 4.03 | 6.50 | 6.16 | 6.17 | 7.42 | 8.48 | 0.70 | 2.22 | 1.29 | 14.21 | 28.23 | 39.10 | 44.67 | 52.45 |
Source: Company reports, BofA Global Research estimates
BofA GLOBAL RESEARCH
GPU spec tables
Exhibit 33: H200/B200/B300 will lead to 2025 HBM demand growth and later by Rubin/Rubin Ultra in 2026/27
NVIDIA GPUs that use HBM memory
| Company | Name | Type | AI function | Launch date | DRAM spec | Remarks |
|---|---|---|---|---|---|---|
| Mainstream | Feynman | GPU | AI training | 2028 | HBM5 (likely) | Based on Next-genHBM |
| Rubin Ultra | GPU | AI training | 2H27 | 1TB HBM4e | 4 reticles leading to 16 HBMchips each with 64GB memory (based on 16-hi layer 32Gb DRAM) | |
| Rubin | GPU | AI training | 2H26 | 288/384GB HBM4 | HBM4 with 12-hi/16-hi layer 24Gb DRAM die; bandwidth at 13TB/s | |
| B300 | GPU | AI training | 3Q25 | 288GB HBM3e | Based on 8 units of 12-hi layer 24Gb DRAM die; bandwidth at 8TB/s | |
| B100/200 | GPU | AI training | 1Q25 | 192GB HBM3e | Nvidia confirmed production ramp-up and shipment in FY4Q25 (Oct-Jan) | |
| H200 SXM/NVL | GPU | AI training | 2Q24 | 141GB HBM3e | First GPU with HBM3e (1.2TB/s) memory | |
| H100 NVL | GPU | AI training | Sep-22 | 188GB HBM3; 7.8TB/s | Powerful AI training GPU using 188GB HBM3 | |
| H100 SXM5 | GPU | AI training | Sep-22 | 80GB HBM3; 3.35TB/s | High-speed AI training GPU (900GB/sec) PCIe / NVL (600GB/sec) | |
| H100 PCIe | GPU | AI training | Sep-22 | 80GB HBM2e; 2TB/s | Still based on HBM2e - HBM3 not yet | |
| A100 | GPU | AI training | Jun-20 | 40/80GB HBM2/2e; 2TB/s | Old gen but still actively used for AI training | |
| Superchip | Rubin Ultra NVL576 | Giant Superchip AI training/inference 2H27 | Giant Superchip AI training/inference 2H27 | Giant Superchip AI training/inference 2H27 | 288TB HBM4e (likely) + 72TB DRAM | Combines 288x Rubin Ultra GPU via NV Link |
| Vera Rubin NVL144 CPX Giant Superchip AI training/inference | 2H26 | 2H26 | 2H26 | 40TB HBM4 (likely) + 36TB DRAM + 18TB GDDR7 | Combines 144x Rubin GPU and 114x CPX GPU and Vera CPUs via NV Link | |
| Vera Rubin NVL144 | Giant Superchip AI training/inference 2H26 | Giant Superchip AI training/inference 2H26 | Giant Superchip AI training/inference 2H26 | 40TB HBM4 (likely) + 36TB DRAM 21TB HBM4 (likely) + 27/54TB | Combines 144x Rubin GPU along with Vera CPUs via NV Link GPU along with 36x Vera CPUs via NV | |
| Vera Rubin NVL72 | Giant Superchip AI training/inference 2H26 | Giant Superchip AI training/inference 2H26 | Giant Superchip AI training/inference 2H26 | DRAM | Combines 72x Rubin Link | |
| Vera Rubin GB300 NVL72 GB300 | Superchip Giant Superchip Superchip | AI training/inference AI training/inference AI training/inference | 2H26 3Q25 3Q25 | 576GB HBM4 + 1.5TB LPDDR5X 20TB HBM3e + 18TB LPDDR5X 576GB HBM3e + 1.2TB LPDDR5X | Combines 2 x Rubin GPUs with a 1 x Vera CPU Combines 36x GB300 superchips via NV Link Combines 2 x B300 GPUs with a 1 x Grace CPU | |
| GB200 NVL72 | Giant Superchip | AI training/inference | 1H25 | 13.5TB HBM3e + 17TB LPDDR5X | Combines 36x GB200 superchips to form one supercomputer | |
| GB200 GH200 v2 GH200 | Superchip Superchip Superchip | AI training/inference AI training/inference AI training/inference | 1H25 2Q24 Dec-23 | 384GB HBM3e + 480GB LPDDR5X 144GB HBM3e 96GB HBM3 | Combines 2 x B200 GPUs with a 1 x Grace CPU 2nd gen of GH200 using "HBM3e (1.2TB/sec)" Superchip based on both GPU+HBM3 and CPU+LPDDR5 | |
| China | B30/B40 | GPU | AI training/inference | 2H25 | GDDR7 | Despec version of B300 for China; multiple B30 chips can be connected to form cluster |
| H20 | GPU | AI training | 1Q24 | 96GB HBM3; 4TB/s | Despec version of H100 for China export; | |
| L2 | GPU | AI training/inference | Jan-24 | 24GB GDDR6; 300GB/s | Despec version of L40S for China export; lower bandwidth vs L20 [ | |
| L20 | GPU | AI training/inference | Dec-23 | 48GB GDDR6; 864GB/s | Despec version of L40S for China export; | |
| L40S | GPU | AI training/inference | Oct-23 | 48GB GDDR6; 864GB/s | No HBM, just GDDR6 used but 1.2x/1.7x better AI inference/training vs A100 |
Source:
Company reports, media reports, BofA Global Research
BofA GLOBAL RESEARCH
Exhibit 34: Lots of GPU line-ups for AI training/inference; LPDDR5 and GDDR6 are also used for AI inferencing but we newly see upbeat demand for 12-hi HBM3e from new ASICs (e.g., Google's TPU v7/TPU 8i/8t); AMD MI400 series; Amazon Trainium chips expected to use HBM4
AI accelerators that use HBM memory
| Company | Name | Type AI function | Type AI function | Launch date | DRAM spec | Remarks |
|---|---|---|---|---|---|---|
| AMD | MI500 | APU | AI training | 2027 | 500-600GB HBM4e (exp.) | Provides up to a 1,000x increase in performance vs MI300X |
| MI450 | APU | AI training | 2026 | 432GB HBM4; 20TB/s+ | Fabricated on TSMC's 2nm technology; can be scaled to a sever rack combining 72x GPUs (to a total of 30TB HBM) | |
| MI400 | APU | AI training | 2026 | 384GB HBM4 | To compete with NVIDIA's Rubin GPU using HBM4; based on 16-hi | |
| MI350X | APU | AI training | 2H25 | 288GB HBM3e; 8TB/s | Announced during its Advancing AI 2024 event; MPin 2H25 | |
| MI325X | APU | AI training | 4Q24 | 256GB HBM3e; 6TB/s | 256GB HBM3e stated during its Advancing AI 2024 event on 10 Oct | |
| MI300A | APU | AI training | Dec-23 | 128GB HBM3; 5.3TB/s | Slightly higher bandwidth vs MI300X | |
| MI300X | APU | AI training | Jun-23 | 192GB HBM3; 5.2 TB/s | More advanced version vs MI300 | |
| MI300 | APU | AI training | Jan-23 | 128GB HBM3; 1.2TB/s | Combination of CPU+GPU | |
| Intel | Crescent Island | GPU | AI inference | 2H26 | 160GB LPDDR5X | Xe3P architecture with 640-bit memory interface |
| Gaudi3 | GPU | AI training | 3Q24 | 128GB HBM2e; 3.7TB/s | Target to compete with NVIDIA H100 | |
| Gaudi2 | GPU | AI training | May-22 | 96GB HBM2e; 2.45TB/s | Stated stronger than NVIDIA A100 | |
| Gaudi | GPU | AI training | NA | 32GB HBM2; 1TB/s | ||
| Meta | MTIA 400 | ASIC | AI inference | 2027 | 288GB HBM; 9.2TB/s | On track to deploy chips in datacenters; 6 petaflops FP8 perf. |
| MTIA 300 | ASIC | AI inference | 2026 | 216GB HBM; 6.1TB/s | Offers 1.2 petaflops of FP8 compute performance | |
| Amazon | Trainium 4 | ASIC | AI training | 4Q26/1Q27 | 288GB HBM4 | 2x the HBMcapacity and 4x the bandwidth (19.6 TB/s) |
| Trainium3 | ASIC | AI training | 4Q25 | 144GB HBM3e | 2x faster and 40% more energy-efficient vs previous gen | |
| Trainium2 | ASIC | AI training | Dec-2024 | 96GB HBM3e | Apple reportedly will use these chips for training its AI Intelligence | |
| Inferentia2 | ASIC | AI inference | 2H22 | 32GB HBM2e | More advanced AI inference vs 2019 generation | |
| Trainium | ASIC | AI training | 2H22 | 32GB HBM2e; 1.6TB/s | Used for training AI models in cloud | |
| TPU 8t | ASIC | AI training | 2H26 | 216GB HBM3e | Can be scaled to 9,600 chips to a massive 2PBHBM memory | |
| TPU 8i | ASIC | AI inference | 2H26 | 288GB HBM3e | Scalable to 1,152 chips for 331TBHBM memory | |
| TPU v7 (Ironwood) | ASIC | AI inference | 4Q25 | 192GB HBM3e | Designed for inference workloads and for AI agents | |
| TPU v6e | ASIC | AI training | Late-2024 | 64GB HBM3 | 2x higher capacity and bandwidth vs its predecessor | |
| TPU v5p | ASIC | AI training | Dec-23 | 95GB HBM2e | 2.8x faster in AI training vs its predecessor | |
| TPU v5e | ASIC | AI training | Aug-23 | 16GB HBM2 | Pre-version of v5 2024; combines tens of thousands of v5e TPUs | |
| Microsoft | Maia 200 (next-gen) | ASIC | AI training | 2026 | 288GB HBM3e | For large-scale training and inference tasks within Microsoft cloud |
| Maia 100 | ASIC | AI inference | 2024 | 64GB HBM2e | Optimized for Azure/Bing inference workloads;1.8TB/s bandwidth | |
| Cobalt CPU | CPU | AI inference | TBC | DDR5 | Undisclosed | |
| Huawei | Ascend 950PR/950DT | NPU | AI Inference/training | 2026 | 128GB HiBL/144GB HiZQ | Employs proprietary HBM(HiBL / HiZQ) |
| Ascend 910C | NPU | AI Training | 1H25 | 128GB HBM2e (likely) | ASIC for China AI training and inference | |
| Ascend 910B | NPU | AI Training | Oct-23 | 64GB HBM2e | Mostly used Ai chips in China besides the US chips | |
| Alibaba | Zhenwu M890 | PPU | AI training/inference | 2026 | 144GB HBM3 | Mainly for Alibaba AI training/inference; supports cluster scaling |
| Biren | BR106 | GPU | AI training/inference 2023 | AI training/inference 2023 | 64GB HBM2e | HBM3 not yet adopted; memory content also low at 64GB |
| BR104 | GPU | AI training/inference 2022 | AI training/inference 2022 | 32GB HBM2e | TSMC 7nm process | |
| Enflame | L600 | ASIC | AI training | 2025 | 144GB HBM2e | Mainly for China AI training |
| Cambricon | MLU590 | ASIC | AI inference | 2024 | 64GB HBM2e | Mainly for AI inference; |
Source: Company reports, media reports, BofA Global Research
Exhibit 35: Substantial HBM content growth expected in 2025/202627, led by B300, Rubin, and Rubin Ultra
NVIDIA GPUs HBM spec evolution; Rubin Ultra HBM content also up 3x vs 2026 1 st Rubin
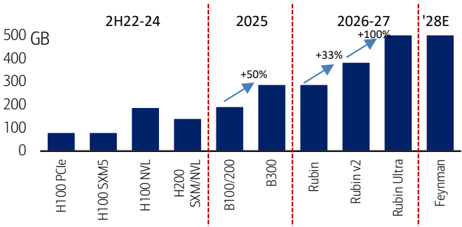
Rubin Ultra and Feynman are likely to have HBM content more than 1TB; axis scaled Source: NVIDIA, BofA Global Research
BofA GLOBAL RESEARCH
BofA GLOBAL RESEARCH
Exhibit 36: 10-30% HBM content growth observed in AMD GPUs as well led by MI350X in 2025 and MI400 series in 2026 AMD GPUs HBM spec evolution
Source: NVIDIA, BofA Global Research
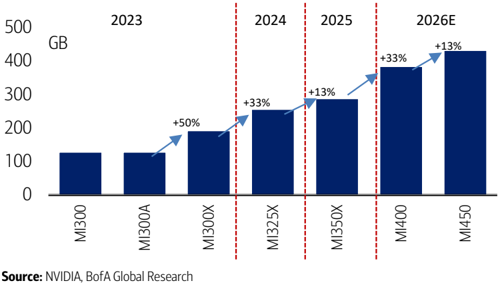
BofA GLOBAL RESEARCH
HBM4
Exhibit 37: HBM capacity to hit 1TB with Rubin Ultra (2027) and then more than 1.5TB with Feynman Ultra (2030); bandwidth also set to increase 40-50% every year from 1.2 TB/s in 2025 to more than 8 TB/s in 2030
NVIDIA GPU HBM capacity and bandwidth progression
NVIDIA GPU HBM capacity and bandwidth progression
HBM4
| GPU | Shipment start | HBMgen | HBM units/GPU | # of DRAM die layers | DRAM die capacity | Capacity/HB M | Total HBM/GPU | Bandwidth/H BM | GPU bandwidth | Packaging | Bonding |
|---|---|---|---|---|---|---|---|---|---|---|---|
| Blackwell B200 | 2024 | HBM3e 8 | 8-hi | 24Gb (3GB) | 24GB | 192GB | 1.2 TB/s | 7.2 TB/s | 2.5D CoWoS | MR-MUF/NCF | |
| Blackwell Ultra B300 | 2025 | HBM3e | 8 | 12-hi | 24Gb (3GB) | 36GB | 288GB | 1.2 TB/s | 7-8 TB/s | 2.5D CoWoS | MR-MUF/NCF |
| Rubin | 2026 | HBM4 | 8 | 12-hi/16-hi | 24Gb (3GB) | 36-48GB | 288-384GB | 2.8-3.3 TB/s | 22-26 TB/s | 2.5D CoWoS | MR-MUF/NCF |
| Rubin Ultra | 2027 | HBM4e | 16 | 16-hi | 32Gb (4GB) | 64GB | 1,024GB | 3.6-4.1 TB/s | 58-66 TB/s | 2.5D CoWoS | MR-MUF/NCF |
| Feynman | 2028-29 | HBM5 | 8 | 16-hi/20-hi | 32Gb (4GB) | 64-80GB | 512-640GB | 5-6 TB/s | 40-50 TB/s | 3D Stacked | Partially HB |
| Feynman Ultra | 2030 | HBM5e | 16 | 16-hi/20-hi | 40Gb (5GB) | 80-100GB | 1,280- 1,600GB | 8 TB/s+ | 128 TB/s+ | 3D Stacked | Almost Full HB |
| Post Feynman | 2032 | HBM6 | 16 | 20-hi/24-hi | 48Gb (6GB) | 120-144GB | 1,920- 2,304GB | 12 TB/s+ | 192 TB/s+ | 3D Stacked | HB |
| Post Feynman Ultra | 2035 | HBM7 | 32 | 20-hi/24-hi | 64Gb (8GB) | 160-192GB | 5,120- 6,144GB | 20 TB/s+ | 640 TB/s+ | 3D Stacked | HB |
Source: Company, media reports, BofA Global Research
HBMA PHY
Exhibit 38: GPU/ASIC/TPUs use 6-8 HBM chips; upcoming Rubin Ultra GPU is expected to use 16 HBM units; each HBM contains 8-12 DRAM dies (16-20 likely for HBM4e and HBM5)
HBM supply GPU or ASIC (TPU) vs conventional DRAM (LPDDR5, etc.) works with CPU
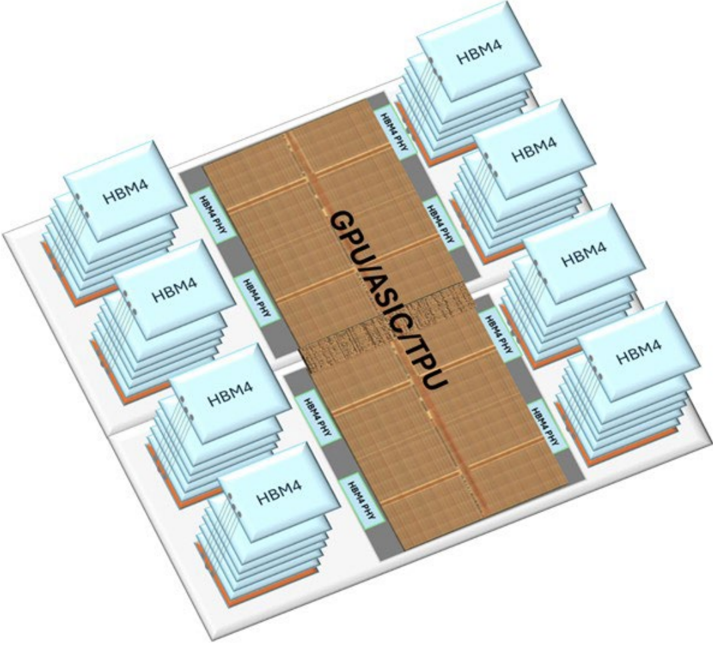
Source: BofA Global Research
BofA GLOBAL RESEARCH
BofA GLOBAL RESEARCH
Hyperscale capex and cloud revenue margins
Exhibit 39: Amazon, Microsoft, Alphabet, Meta, and Oracle capex collectively to grow ~80% YoY in 2026 to $650bn even after strong 65% YoY growth in 2025; 2027/28 capex to hit $800/950bn+
Combined capex of top 4 US tech companies
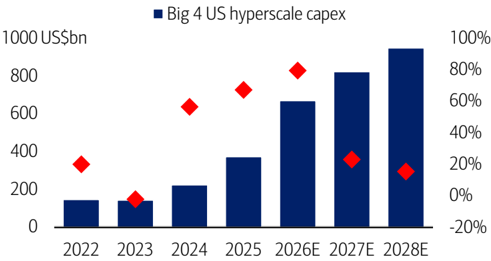
Source: Company reports, BofA Global Research estimates
BofA GLOBAL RESEARCH
Exhibit 41: Amazon, Microsoft, Alphabet, and Meta overall revenue expected to grow +15-20% in 2026-28
Overall revenue growth trend of top 4 US hyperscalers
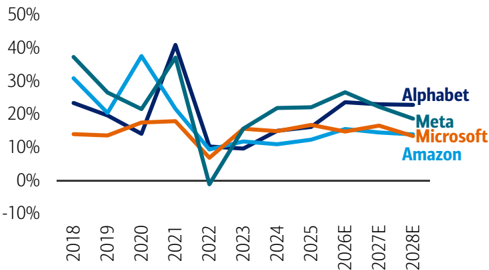
Source: Company reports, BofA Global Research estimates
BofA GLOBAL RESEARCH
Exhibit 43: Cloud revenue growth still solid at 35-40% YoY in 2026-28 Cloud revenue of hyperscalers consistently strong
Source: Company reports, BofA Global Research estimates
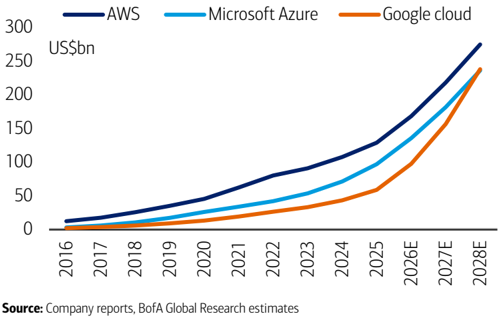
BofA GLOBAL RESEARCH
Exhibit 40 : Record-high capex spend by all big-4 hyperscalers expected to continue in 2026E; robust growth since 2024
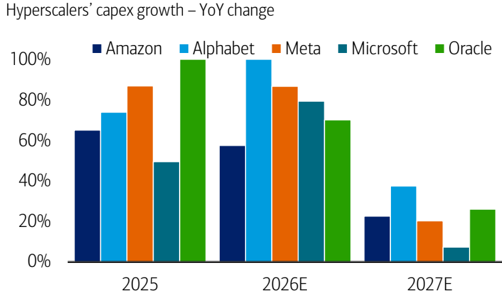
Note: Microsoft and Oracle data adjusted for CY basis **Oracle's 2025 capex up 230% YoY MSFT capex for 2026-27 is based on consensus
Source: Companies, BofA Global Research estimates
BofA GLOBAL RESEARCH
Exhibit 42: Gross margin of hyperscalers strong at around 70-80% levels
Gross margin trend of top 4 US hyperscalers
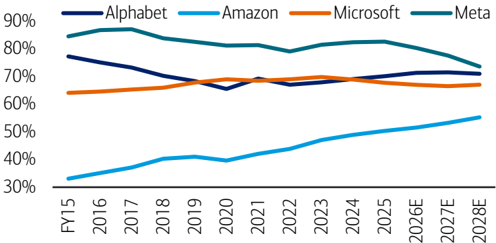
Source: Company reports, BofA Global Research estimates
BofA GLOBAL RESEARCH
Exhibit 44: High OPM seen among AWS (35%+) and Azure (40%+); Google's margin also set to reach 30-35% in 2026-28 Cloud OPM trend also high
Source: Company reports, BofA Global Research estimates
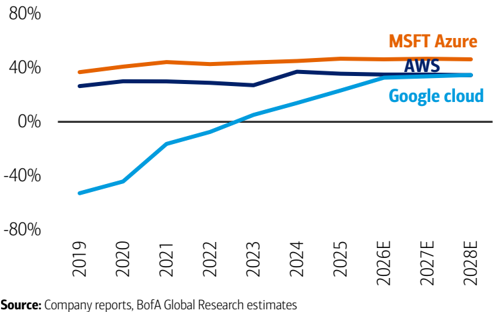
BofA GLOBAL RESEARCH
Memory price forecast and spot price short term trend
Exhibit 45: Well recovered in Jun-Jul following May corrections but still far higher than normal at US$30-40/GB vs previous peaks of US$10 range; thus 10%+ downside seen toward end-2026 DRAM spot price outlook - US$/16Gb equiv
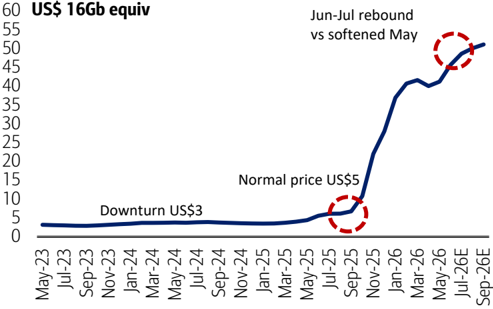
Source: DRAMeXchange, BofA Global Research estimates
Exhibit 46: Unlike DRAM, NAND spot price has been corrected through June-July; further correction possible through summer but no hardlanding and absolut price still far higher than normal NAND spot price outlook - US$/512Gb equiv
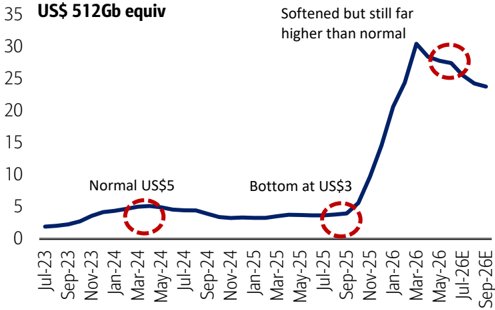
Source: DRAMeXchange, BofA Global Research estimates
BofA GLOBAL RESEARCH
Exhibit 47: DDR5 prices reached new highs ($48) in early-July, supported by strong AI-related demand and constrained supply as DRAM makers prioritize HBM production
16Gb DDR5 spot price - daily, Jul'25 - Jul '26
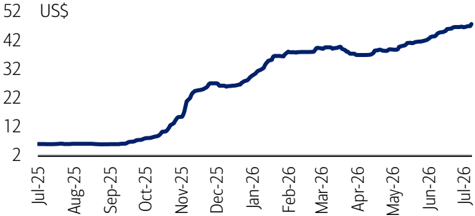
Source:
DRAMeXchange
BofA GLOBAL RESEARCH
Exhibit 49: 8Gb DDR4 prices remained firm near highs, driven by production exits and inventory replenishment
8Gb DDR4 spot price trend, Jul'25 - Jul '26
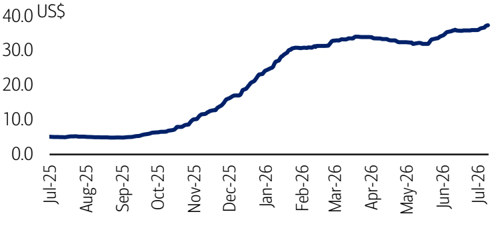
Source: DRAMeXchange
BofA GLOBAL RESEARCH
BofA GLOBAL RESEARCH
Exhibit 48: DDR4 prices remained near cycle highs, supported by supply cuts and customer restocking, with a brief correction in May before recovering through June and early-July
16Gb DDR4 spot price trend, Jul'25 - Jul '26
Source: DRAMeXchange
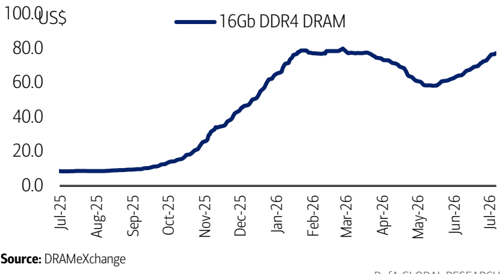
BofA GLOBAL RESEARCH
Exhibit 50: NAND wafer pricing rose to elevated levels, through 4Q25-1Q26, on tight supply and stronger SSD demand, but has flattened/slightly softened through 2Q26 and early-Jul
512Gb NAND wafer spot price - weekly, Jun'25 - Jun '26
Source: DRAMeXchange
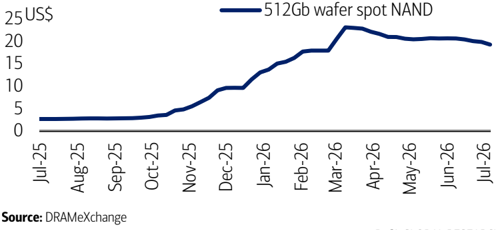
BofA GLOBAL RESEARCH
Memory spot/contract price long term trend
Exhibit 51: DRAM spot prices rebounded through June after softening through April-May, following a strong rally from September 2025 to January 2026. Prices have reached multi-decade highs, with 16Gb DDR5 at ~$48 and DDR4 at ~$77, driven by supply reallocation toward HBM and server DRAM-well above the prior ~$10 peak in October 2017.
DRAM spot price - long-term trend (2000-2025)
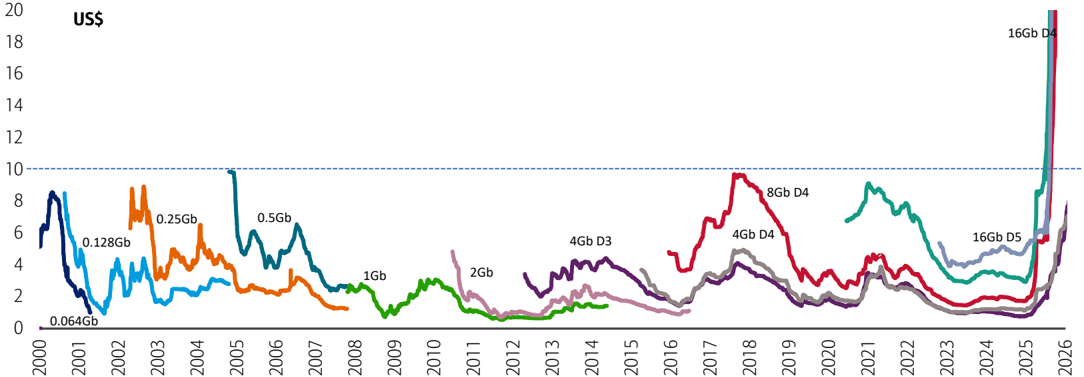
Source: DRAMeXchange
Exhibit 52: DRAM spot and contract prices climbed to record highs of ~$35-40, with moderate growth in 2Q26 following a strong rally in 4Q25 and 1Q26.
DRAM spot and contract price - quarterly average trend
Source: DRAMeXchange, TrendForce
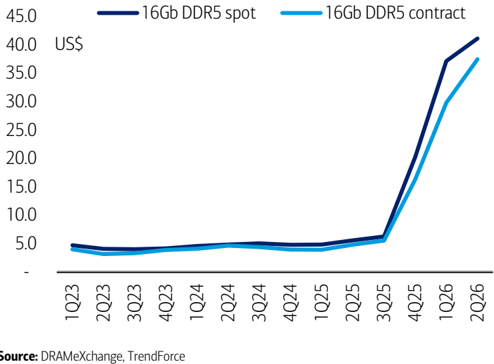
BofA GLOBAL RESEARCH
BofA GLOBAL RESEARCH
Exhibit 53: NAND wafer contract prices have surged significantly ahead of spot prices, with both now at record-high levels
NAND wafer spot and contract price - quarterly average trend
Source: DRAMeXchange, TrendForce
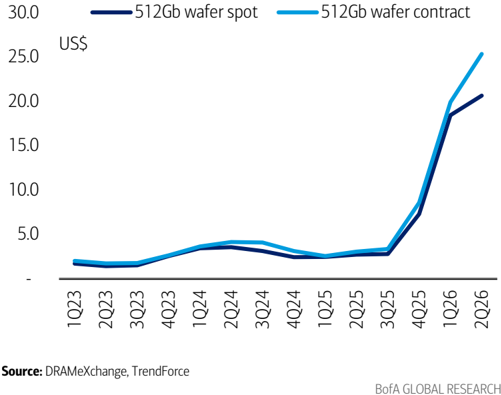
Exhibit 54: Prices rebounded through May/June/early-Jul, reaching an all-time high ($48). Uptrend was driven by strong gains in Oct (+70%), Nov (+60%), Jan (+25%), before moderating into a more subdued trend during Feb-Apr
16Gb DDR5 spot price - daily, Nov '23 - Jul '26
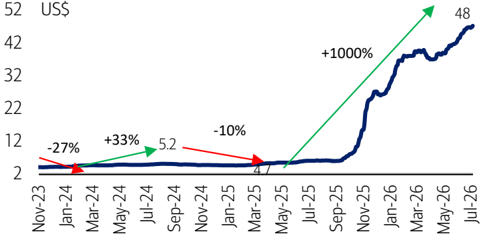
Source: DRAMeXchange
BofA GLOBAL RESEARCH
Exhibit 56: 8Gb DDR4 spot prices reached a record high of ~$37 in early July, well above the prior ~$10 peak in October 2017, driven by ongoing supply cuts from major vendors
8Gb DDR4 spot price trend, Nov '23 - Jul '26
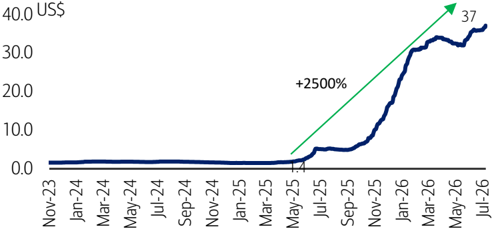
Source: DRAMeXchange
BofA GLOBAL RESEARCH
Exhibit 58: DDR4 and DDR5 (16Gb) contract prices are similar at US$35-$40 levels - DDR5 price premium no longer exists due to DDR4 shortage
16Gb DDR5 vs 16Gb DDR4 contract price trend, Feb '23-Jun '26
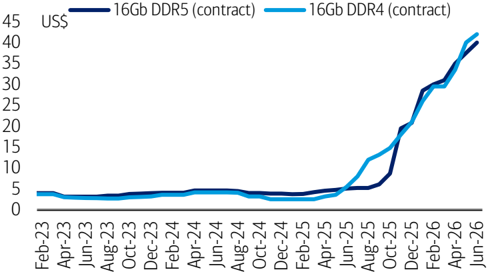
Source: TrendForce
BofA GLOBAL RESEARCH
Exhibit 55: Modest uptick observed in May/Jun/early-Jul (+5-10%), following a sequential slowdown from Feb (+10%) to flat momentum in Mar and a minor decline in Apr, after the strong Jan (+25%) surge and the sharp Oct-Nov-25 rally (+60-120%)
16Gb DDR5 spot month-average price - MoM change, Nov '23 - Jul '26
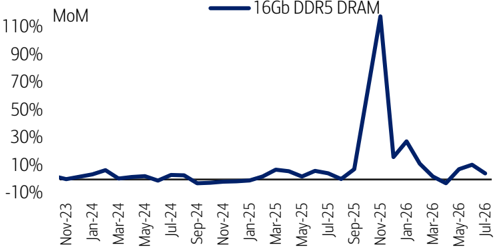
Source: DRAMeXchange
BofA GLOBAL RESEARCH
Exhibit 57: Prices rebounded to record highs in late May-early July after a ~25% April-mid-May correction, remaining ~2000% above the October 2025 low (~$3)
16Gb DDR4 spot price trend, Jul '23 - Jul '26
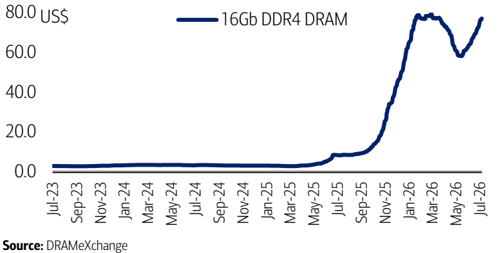
BofA GLOBAL RESEARCH
Exhibit 59: DDR5 and DDR4 contract prices expected to be flat MoM in Jun vs up +10-15% MoM each in Apr/May-26; price strong through 2H25 and early 2026
16Gb DDR5 vs 16Gb DDR4 contract price change - MoM, Feb '23-Jun '26
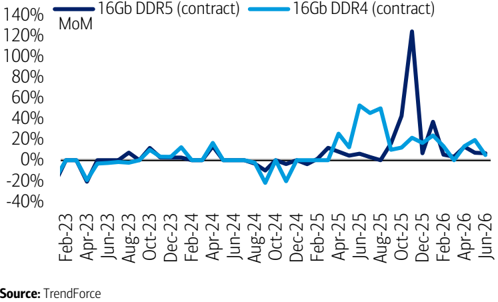
BofA GLOBAL RESEARCH
Source:
DRAMeXchange
Exhibit 60: NAND spot prices remained broadly stable to slightly weaker through 1Q26 and early Jul, but still stand more than 50% YTD and nearly 8x higher than the Feb-25 trough
512Gb NAND wafer spot price - weekly, Apr '21 - Jul '26
Source:
DRAMeXchange
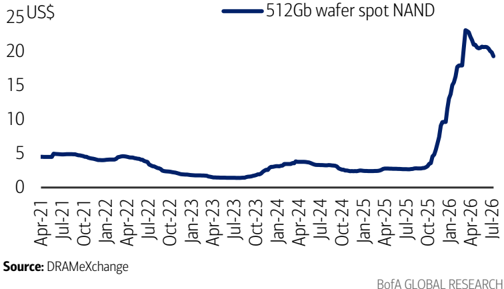
BofA GLOBAL RESEARCH
Exhibit 62: Current contract price at ~$25, around 10x vs Feb-25 bottom of $2.5; prices significantly up in 4Q25/1Q26 and remained broadly stable thereafter
NAND wafer contract price trend, Aug '23-Jun '26
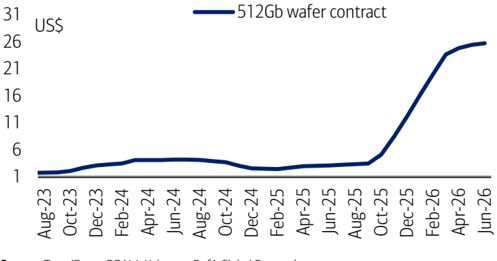
BofA GLOBAL RESEARCH
Exhibit 64: 16Gb DDR5 spot and contract prices are in the range of US$35-40 vs historical range of US$3-5
16Gb DDR5 spot vs contract price trend (US$), Aug '23-Jun '26
Source: DRAMeXchange, TrendForce
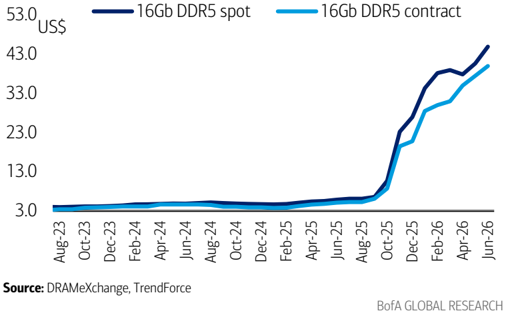
Source: TrendForce, DRAMeXchange, BofA Global Research
Exhibit 61: Prices were largely flat in June and slightly lower in early July, following the April-May correction, compared with gains of 15-20% in Feb-Mar 2026 and 40-70% MoM increases during Oct 2025-Jan 2026
512Gb NAND wafer spot average - MoM change, Jul'21 - Jul'26
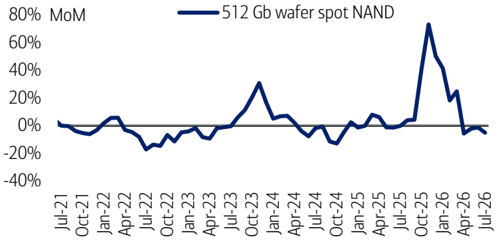
Source: DRAMeXchange
BofA GLOBAL RESEARCH
Exhibit 63: Apr/May/Jun price only up +1-5% MoM each following Jan/Feb/Mar-26 rally (up 20-30% MoM) and Oct/Nov/Dec upturn (up 40-60% MoM)
MoM change of NAND contract price (512Gb wafer Aug '23-Jun '26
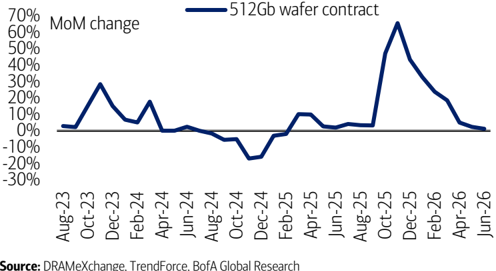
Source: DRAMeXchange, TrendForce, BofA Global Research
BofA GLOBAL RESEARCH
Exhibit 65: Jun'26 spot and contract prices turned positive again after Feb-Mar moderation, prices had witnessed a sharp OctDec'25 rally
16Gb DDR5 spot vs contract price trend - MoM change, Aug '23-Jun '26
Source: DRAMeXchange, TrendForce
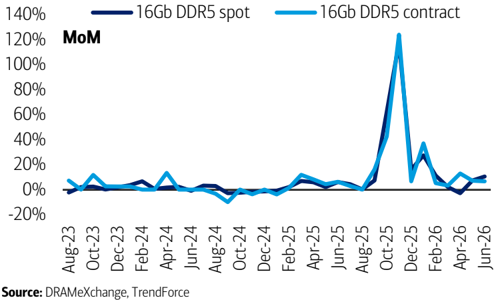
BofA GLOBAL RESEARCH
Exhibit 66: Current NAND spot and contract prices are a few times higher than 2025 summer level
512Gb NAND wafer spot vs contract price trend (US$), Jun '19 - Jun '26
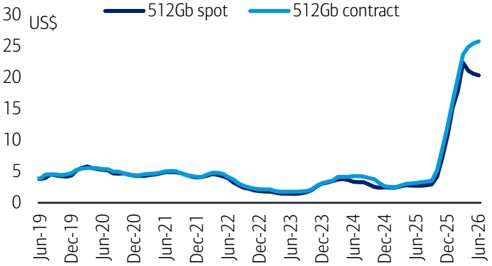
Source: DRAMeXchange, TrendForce
BofA GLOBAL RESEARCH
Exhibit 68: Current price of 64GB DDR4/DDR5 modules hit all-time high of more than $1,000 level (DDR5: US$1,400, DDR4: US$1,100)
Server DRAM contract price trend - DDR5 vs DDR4 modules, Feb '24-Jun '26
Source: TrendForce
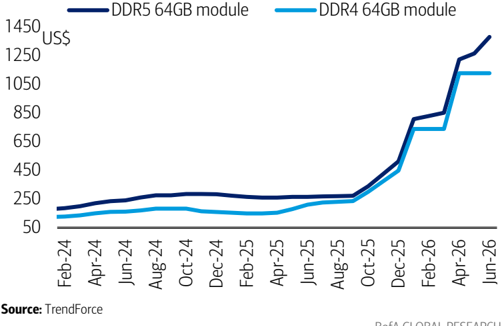
BofA GLOBAL RESEARCH
Exhibit 70: 2H-Jun SSD price slightly down vs 1H-Jun rebound; following a gradual upward trend throughout 2025
prices witnessed a sharp surge in 1Q26 and April (DRAMeXchange), Client SSD price trend - mostly for PC (not server), Apr '24 - Jun '26
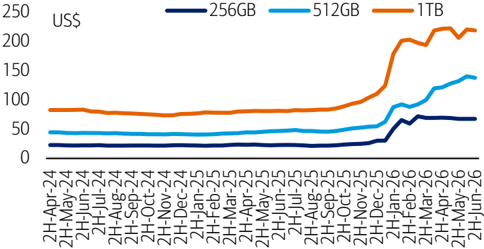
Note: SSD prices are as of 28 Jun 2026, reported by DRAMeXchange. TB = terabyte.
Source: DRAMeXchange
BofA GLOBAL RESEARCH
Exhibit 67: NAND spot and contract prices normalized in Apr/May/Jun after strong rally during Oct-25 - Dec-25 (up 40-50% per month) and Jan-Mar-26 (20-30% per month)
512Gb NAND spot vs contract price trend - MoM change, Jun '19 - Jun '26
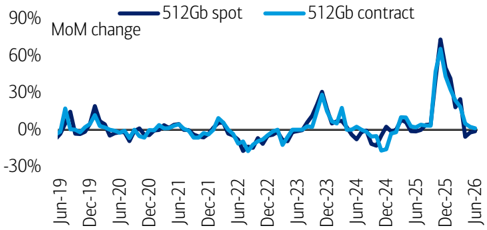
Source: DRAMeXchange, TrendForce
BofA GLOBAL RESEARCH
Exhibit 69: DDR5 server contract prices recovered in June, while DDR4 remained flat in, following a sharp 40-50% MoM increase in Apr-26 and a similar 50-60% surge in January, after largely stable pricing conditions during Feb-Mar
MoM change of server DRAM contract prices, Feb '24-Jun '26
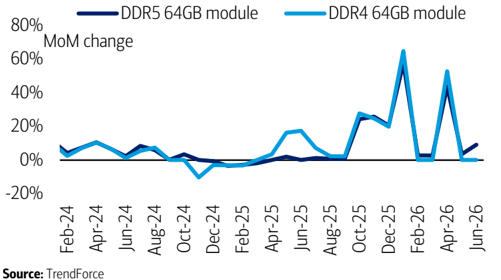
BofA GLOBAL RESEARCH
Exhibit 71: Jun prices have doubled compared to end-2025 levels, while the 2025 increase was more modest at around 35-40%
Client SSD (for PC) price comparison - current vs. end-2025
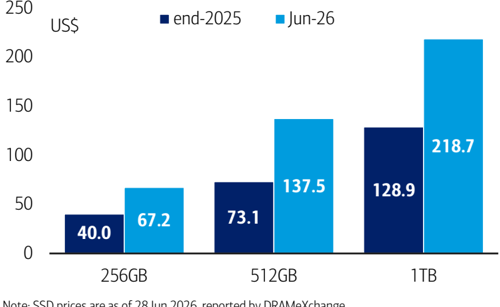
Note: SSD prices are as of 28 Jun 2026, reported by DRAMeXchange
Source: DRAMeXchange
BofA GLOBAL RESEARCH
Valuation and stock performance
Exhibit 72: Memory stocks sharply corrected this week as well; we believe Meta/CXMT/Korea were newly overly concerned vs solid fundamentals (still rising AI capex spend, CXMT's DRAM for Apple likely not meaningful, low impact of Korea's new memory cluster by 2030, etc); P/E multiples still low despite robust stock price rally in May/June
Valuation comparison among memory and semiconductor supply chain stocks
| Ticker | Rating | Price (Local) | Mcap ($bn) | FY25 | P/E FY26E | FY27E | FY25 | P/Book FY26E | FY27E FY26E | EV/EBITDA FY27E | EV/Sales FY26E | FY27E | FY25 | ROE FY26E | FY27E | Div. yield FY26E FY27E | |||
|---|---|---|---|---|---|---|---|---|---|---|---|---|---|---|---|---|---|---|---|
| Memory/DRAM | |||||||||||||||||||
| SK Hynix | HXSCF | RSTR** | 2,253,000 | 1,043.9 | 37.3 | 13.3 | 44.2% | ||||||||||||
| Samsung | SSNLF | B-1-7 | 282,500 | 1,110.2 | 43.0 | 6.5 | 4.9 | 4.5 | 2.7 | 1.8 | 3.8 | 2.9 | 2.3 | 1.8 | 10.8% | 51.8% | 43.5% | 1.0% | 1.7% |
| Micron | MU | C-1-7 | 991.64 | 1,120.0 | 119.6 | 13.6 | 7.1 | 20.6 | 8.2 | 4.3 | 10.9 | 5.7 | 8.4 | 4.7 | 18.8% | 87.8% | 81.0% | 0.1% | 0.1% |
| Nanya | NNYAF | B-1-7 | 435.50 | 46.7 | 205.5 | 7.0 | 5.1 | 8.8 | 4.2 | 2.7 | 5.0 | 3.7 | 3.8 | 2.7 | 3.9% | 73.9% | 57.6% | 4.6% | 5.7% |
| Memory/NAND | |||||||||||||||||||
| Kioxia | XIYUF | C-1-9 | 77,000 | 259.5 | 75.3 | 8.4 | 6.4 | 29.8 | 6.5 | 3.2 | 5.2 | 4.0 | 4.2 | 3.3 | 51.9% | 128.2% | 67.2% | 0.0% | 0.0% |
| Sandisk | SNDK | C-1-9 | 1,858.27 | 275.2 | n/a | 27.0 | 8.0 | 29.9 | 14.6 | 4.8 | 20.7 | 5.9 | 13.2 | 5.0 | 4.3% | 76.0% | 96.8% | 0.0% | 0.0% |
| Western Digital | WDC | C-1-7 | 578.05 | 211.6 | n/a | 58.1 | 30.9 | 39.8 | 17.1 | 11.4 | 39.2 | 21.4 | 16.4 | 11.3 | 22.5% | 42.9% | 46.5% | 0.1% | 0.1% |
| SIMO | SIMO | C-1-7 | 324.26 | 11.0 | 89.1 | 36.0 | 30.5 | 12.9 | 9.9 | 7.9 | 26.8 | 21.1 | 6.3 | 5.3 | 15.3% | 31.9% | 29.6% | 0.7% | 0.9% |
| Phison | PISNF | C-1-8 | 2,220.00 | 15.2 | 55.9 | 6.2 | 10.5 | 8.0 | 4.1 | 3.4 | 4.6 | 7.4 | 1.9 | 1.7 | 16.0% | 89.2% | 36.0% | 8.6% | 5.1% |
| US/Taiwan semis | |||||||||||||||||||
| NVIDIA | NVDA | C-1-7 | 202.78 | 4,907.3 | 44.6 | 22.3 | 15.3 | 32.1 | 16.7 | 10.5 | 18.6 | 13.0 | 12.6 | 8.8 | 94.3% | 95.9% | 80.3% | 0.4% | 0.6% |
| AMD | AMD | C-1-9 | 546.72 | 891.5 | 131.1 | 72.9 | 41.2 | 14.2 | 12.0 | 9.2 | 52.6 | 31.7 | 17.9 | 11.5 | 11.3% | 18.1% | 26.3% | 0.0% | 0.0% |
| Broadcom | AVGO | C-1-7 | 401.11 | 1,908.3 | 58.8 | 34.6 | 22.4 | 23.6 | 18.1 | 11.6 | 27.4 | 17.5 | 18.2 | 12.0 | 45.3% | 61.3% | 65.5% | 0.6% | 0.7% |
| Intel | INTC | C-1-9 | 112.54 | 565.6 | 261.7 | 106.2 | 65.4 | 4.5 | 4.1 | 3.8 | 27.9 | 21.1 | 9.3 | 8.1 | 1.7% | 4.1% | 6.2% | 0.0% | 0.0% |
| Arm | ARM | C-2-9 | 327.87 | 350.2 | 185.2 | 158.4 | 115.4 | 42.3 | 33.4 | 25.9 | 125.1 | 90.1 | 59.0 | 44.1 | 25.0% | 23.6% | 25.5% | 0.0% | 0.0% |
| Qualcomm | QCOM | B-3-7 | 191.11 | 201.4 | 15.9 | 18.0 | 17.4 | 9.5 | 7.6 | 7.2 | 14.8 | 14.8 | 5.1 | 4.9 | 56.0% | 47.6% | 41.7% | 1.9% | 1.9% |
| TSMC | TSMWF | B-1-7 | 2,415 | 1,944.6 | 36.5 | 23.5 | 16.1 | 11.6 | 8.2 | 5.7 | 15.2 | 10.7 | 11.2 | 8.0 | 35.4% | 40.8% | 41.8% | 1.0% | 1.0% |
| MediaTek | MDTKF | B-1-7 | 3,925 | 195.5 | 59.3 | 60.3 | 28.8 | 15.7 | 16.6 | 11.5 | 47.1 | 23.2 | 9.5 | 5.7 | 26.4% | 26.6% | 46.8% | 1.3% | 2.8% |
| Equipment | |||||||||||||||||||
| ASML | ASMLF | B-1-7 | 1,602.80 | 711.2 | 64.7 | 48.3 | 34.3 | 31.8 | 25.8 | 21.2 | 38.3 | 27.8 | 15.3 | 12.2 | 50.6% | 58.7% | 67.5% | 0.5% | 0.7% |
| AMAT | AMAT | B-1-7 | 588.66 | 467.4 | 62.5 | 48.4 | 36.3 | 22.9 | 16.0 | 11.2 | 41.3 | 30.9 | 14.2 | 11.3 | 38.6% | 39.0% | 36.0% | 0.4% | 0.4% |
| Lam | LRCX | C-1-7 | 353.17 | 441.7 | 85.5 | 62.5 | 46.7 | 44.8 | 38.6 | 27.8 | 51.4 | 38.4 | 19.1 | 15.0 | 57.9% | 66.9% | 68.9% | 0.3% | 0.3% |
| TEL | TOELF | C-1-7 | 72,940 | 210.2 | 58.3 | 48.9 | 39.7 | 16.2 | 13.7 | 11.4 | 33.2 | 27.3 | 10.6 | 9.1 | 29.3% | 30.3% | 31.4% | 1.0% | 1.3% |
| Hanmi Semi | HNSIF | C-1-7 | 220,000 | 14.0 | 97.5 | 69.7 | 36.4 | 30.4 | 22.9 | 15.1 | 53.9 | 26.9 | 26.5 | 14.7 | 34.8% | 37.3% | 49.8% | 0.5% | 0.9% |
| BESI | BESVF | B-1-7 | 254.80 | 23.6 | 151.2 | 59.1 | 35.4 | 48.3 | 35.4 | 25.9 | 44.9 | 28.2 | 20.3 | 14.4 | 29.2% | 69.4% | 84.6% | 1.6% | 2.7% |
| ASMPT | ASMVF | C-1-7 | 187.90 | 10.1 | 74.1 | 47.2 | 28.4 | 4.6 | 4.4 | 17.6 | 4.1 | 2.8 | 6.5% | 9.4% | |||||
| 4.0 | 26.9 | 14.5% | 1.1% | 1.4% |
Source: Company reports, BofA Global Research estimates; Mcap = market capitalization, ROE = return on equity, Div = dividend. RSTR = Restricted. Price as of latest close.
Exhibit 73: Memory stocks corrected sharply for 2 consecutive week after a strong 1H26 rally; however, prices still remain elevated year -to -date, led by NAND and HDD with sustained strength in DRAM, underpinned by robust AI-driven demand
Memory companies - 2026 YTD stock performance comparison
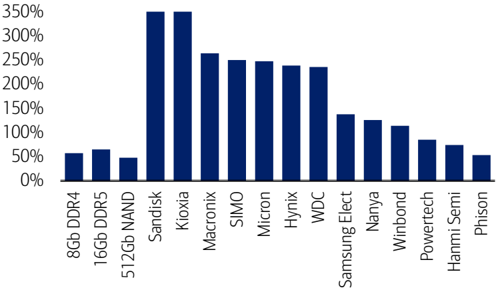
SanDisk/Kioxia shows above 800% YTD return Source: Bloomberg, DRAMeXchange
BofA GLOBAL RESEARCH
BofA GLOBAL RESEARCH
Exhibit 74: CPU names such as Intel and AMD clearly outperforming other US big tech names such as NVIDIA/Apple/QCOM
Global major tech companies - 2026 YTD stock performance comparison
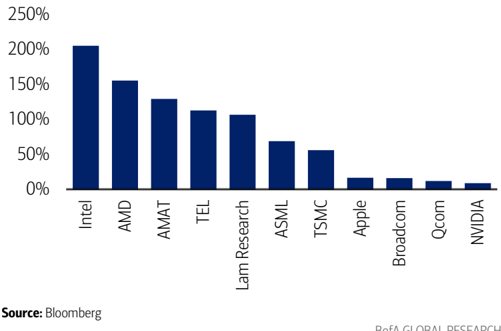
BofA GLOBAL RESEARCH
Glossary
ASP : Average selling price
CXMT
: ChangXin Memory Technologies
DDR3/4/5:
3 rd /4 th /5 th gen double-data rate DRAM
DRAM
: Dynamic random-access memory
GDDR7:
7 th gen graphics DRAM
GHz
: Gigahertz
HBM
: High bandwidth memory
HBM4:
6 th gen of HBM
IPO
: Initial public offering
LPDDR5:
Low-power DDR5
SOCAMM
: Small-outline compression attached memory module
Wpm:
Wafers per month
WSTS:
World semiconductor trade statistics
Exhibit 75: Stocks mentioned
Prices and ratings for stocks mentioned in this report
BofA Ticker
Bloomberg ticker 2408 TT
Company name Nanya Tech
NNYAF
BofA Global Research
Source:
Investment Rationale
Nanya Technology
Our Buy rating is based on the DRAM industry's supercycle, which should warrant a highmargin profile for Nanya Tech even in the long term. Its 1Q/2Q26 results already reveal exceptionally strong revenue (NT$49/83bn, more than 2-3x higher than the previous peak cycle) and 70%+ operating margin. Management focus on long-term contracts, including DDR4 for eSSD or servers, should also act as a catalyst. Significantly rising net cash even after capex hike could also support higher dividend payouts.
Price objective basis & risk
Nanya Technology (NNYAF)
Our PO of NT$660 is derived from 9x 2027-28E P/E, which is c.30% below the longterm historical average (13x during 2014-25), but near-50% above the previous upturn period (6x in 2014-18). Memory stocks usually trade at low valuation multiples during peak cycle due to downturn concerns. However, the current DRAM cycle looks structurally much better than ever and we expect 2027-28 earnings to exceed 2026 level due to the AI growth theme. This could lead to a re-rating (e.g., 9x P/E or higher), with solid earnings outlook.
Upside risks: DRAM price increases even after the 1H26 upturn, Big-3 memory chipmakers' significant supply cut for commodity DRAM due to HBM, and Nanya Tech's more successful ramp-up of DDR4 or DDR5 (better cost or margin improvement).
Downside risks: weaker legacy DDR4 demand (quicker shift to DDR5), and China's more successful memory production increase.
Price NT$ 435.5
Rating B-1-7
BofA GLOBAL RESEARCH
圖片清單(已驗證 2026-07-13)
| 檔名 | size | 分類 | 親眼所見內容 |
|---|---|---|---|
| 002.png | 43603 | 真資料圖 | DRAM/NAND QoQ 價格變化折線圖,2Q23-4Q27E,2026 出現大幅上揚後回落 |
| 005.png | 46047 | 真資料圖 | Gross margin(深藍)與 OP margin(淺藍)雙線圖,2Q23-4Q27E,2025 下半年由負轉正並升至 70-80% 區間 |
| 006.png | 45387 | 真資料圖 | 某指標 YoY 變化折線圖,Jun-16 至 Jun-26,2025-2026 出現陡升至 300% |
| 007.png | 63786 | 真資料圖 | 週期性指標長期走勢圖(灰底歷史區間+藍底近期區間),May-94 至 May-26,標註歷次 Peak/Trough,近期峰值「Much higher than prev. peaks」 |
| 008.png | 94942 | 真資料圖 | Memory indicator(深藍)vs Memory companies' share price(淺藍,右軸)雙軸圖,Jul-96 至 Jul-26,近期同步大漲 |
| 012.png | 41040 | 真資料圖 | DRAM/NAND 稼動率或類似指標折線圖,1Q22-4Q27E,2023 觸底後回升並於 2026 附近趨平於 90-100% |
| 015.png | 462662 | 真資料圖 | HBM4 封裝架構示意圖,GPU/ASIC/TPU 中央基板周圍環繞多組 HBM4 堆疊,標示 HBM PHY 位置 |
| 017.png | 46007 | 真資料圖 | Alphabet/Meta/Microsoft/Amazon 四家公司某項成長率折線圖,2018-2028E |
| 018.png | 49223 | 真資料圖 | AWS/Microsoft Azure/Google cloud 三雲端業者營收(US$bn)折線圖,2016-2028E,皆逐年攀升 |
| 020.png | 42891 | 真資料圖 | Alphabet/Amazon/Microsoft/Meta 四家公司某項占比折線圖,FY15-2028E |
| 022.png | 47938 | 真資料圖 | DRAM 16Gb equiv 價格走勢圖(US$),May-23 至 Sep-26E,標註 Downturn US$3、Normal US$5、Jun-Jul rebound |
| 023.png | 50416 | 真資料圖 | NAND 512Gb equiv 價格走勢圖(US$),Jul-23 至 Sep-26E,標註 Normal US$5、Bottom at US$3、近期回落 |
| 028.png | 113360 | 真資料圖 | DRAM 各世代(0.064Gb 至 16Gb D5)長期價格走勢疊圖,2000-2026,多色線標示各製程世代價格區間 |
| 029.png | 44152 | 真資料圖 | 16Gb DDR5 spot 與 contract 價格折線圖(US$),1Q23-2Q26,2025 下半年後陡升至 35-40 美元 |
| 030.png | 42575 | 真資料圖 | 512Gb NAND wafer spot 與 contract 價格折線圖(US$),1Q23-2Q26,2025 下半年後陡升至 20-25 美元 |
| 033.png | 43099 | 真資料圖 | 16Gb DDR5 vs DDR4 contract 價格走勢圖(US$),Feb-23 至 Jun-26,兩者於 2025 下半年皆大幅上漲 |
| 036.png | 54513 | 真資料圖 | 16Gb DDR5 vs DDR4 contract MoM 變化圖,Feb-23 至 Jun-26,Oct-25 出現逾 120% 單月漲幅尖峰 |
| 039.png | 43985 | 真資料圖 | 16Gb DDR5 spot 與 contract 價格走勢圖(US$),Aug-23 至 Jun-26,2025 下半年後陡升 |
| 040.png | 43819 | 真資料圖 | 512Gb wafer spot NAND MoM 變化圖,Jul-21 至 Jul-26,多次波動且近期尖峰達 80% |
| 041.png | 52068 | 真資料圖 | 512Gb wafer contract MoM 變化圖,Aug-23 至 Jun-26,Dec-25 附近出現逾 60% 尖峰 |
| 042.png | 54482 | 真資料圖 | 16Gb DDR5 spot 與 contract MoM 變化圖,Aug-23 至 Jun-26,Oct-25 附近出現逾 120% 尖峰 |
| 044.png | 40153 | 真資料圖 | DDR5 64GB module 與 DDR4 64GB module 價格走勢圖(US$),Feb-24 至 Jun-26,兩者於 2025 下半年後大幅上漲 |
| 045.png | 46866 | 真資料圖 | 256GB/512GB/1TB 模組價格走勢圖(US$),2H24 至 2H26,1TB 價位最高且近期漲幅最大 |
| 046.png | 44207 | 真資料圖 | 512Gb spot 與 contract MoM 變化圖,Jun-19 至 Jun-26,多次波動,近期 Dec-25 附近尖峰逾 60% |
| 047.png | 49564 | 真資料圖 | DDR5 64GB module 與 DDR4 64GB module MoM 變化圖,Feb-24 至 Jun-26,兩者於 2025-2026 間多次尖峰達 40-60% |
| 051.png | 67522 | 真資料圖 | Nanya Tech(NNYAF)股價走勢(深藍實線)+ 歷次券商目標價調整標註(淺藍色垂直標線+淺藍陰影區間,非紅色虛線階梯),標示每次調整日期與 PO 金額,從 10-Jul PO:NT$88 一路上修至 26-Jun PO:NT$660 |