PDF 原檔:報告_BofA_日月光投控3711_20260930_original.pdf
圖片清單(已驗證 2026-10-01)
| 檔名 | size | 分類 | 親眼所見內容 |
|---|---|---|---|
報告_BofA_日月光投控3711_20260930_001.png |
73.5KB | 真資料圖 | ASE's equipment buy and capex(NT$mn)長條圖 2021-2026 + YoY/Equipment buy % of capex 折線 |
報告_BofA_日月光投控3711_20260930_002.png |
51.1KB | 真資料圖 | ASE's IC ATM sales(NT$mn)長條圖 2020-2027E + GMs/OpMs 折線 |
報告_BofA_日月光投控3711_20260930_003.png |
46.3KB | 真資料圖 | ASE's LEAP/IC ATM gross profit(US$mn)長條圖 2021-2027E + LEAP % of IC ATM gross profit 折線 |
報告_BofA_日月光投控3711_20260930_004.png |
38.0KB | 真資料圖 | LEAP GMs/Non-LEAP GMs/IC ATM GMs 季度折線圖 1Q23-4Q27E |
報告_BofA_日月光投控3711_20260930_005.png |
62.3KB | 真資料圖 | ASE's LEAP sales(US$mn)依子業務別堆疊長條圖 2024-2028 + Advanced packaging/testing YoY、LEAP YoY 折線 |
報告_BofA_日月光投控3711_20260930_006.png |
47.2KB | 真資料圖 | ASE's Capex/Net debt(NT$mn)長條圖 + FCF(NT$mn)折線 2023-2028E |
報告_BofA_日月光投控3711_20260930_007.png |
46.3KB | 真資料圖 | ASE's Capex/IC ATM sales(NT$mn)長條圖 + Capital intensity 折線 2023-2028E |
報告_BofA_日月光投控3711_20260930_008.png |
45.9KB | 真資料圖 | ASE(XSRIF,台股)股價走勢圖搭配歷次 BofA PO 標註,NT$120(2024-01-08)逐步上修至 NT$800(2026-09-08) |
報告_BofA_日月光投控3711_20260930_009.png |
49.9KB | 真資料圖 | ASE ADR(ASX,美股)股價走勢圖搭配歷次 BofA PO 標註,US$7.70 逐步上修至 US$51 |
原始內容
ASE Technology Holding
Continued Capex spree underpins strong business outlook
Maintain Rating: BUY | PO: 800.00 TWD | Price: 703.00 TWD
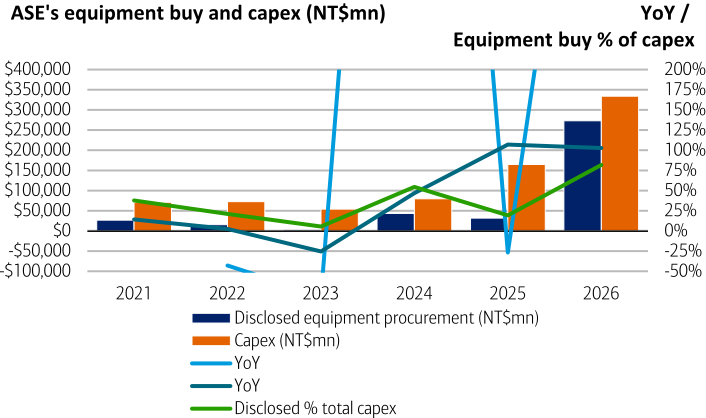
YTD equipment buys tracks 82% of its '26 capex guidance
ASE has filed 152 equipment buys and 101 facility construction announcements through late September. The spending on equipment YTD has reached NT$273bn, tracking 82% of its '26 capex guidance of US$10.5bn (has revised up from US$8.5bn) not yet considering their land and facility purchase. The equipment buy should mainly be for 2.5D packaging and chip probing, reflecting accelerated capacity expansion amid strong demand for its LEAP business from its own project wins and its foundry partner's outsourcing. To secure sufficient facility infrastructure to house additional capacity, ASE has announced NT$112bn of spending YTD on facility and clean room construction contracts, with these projects expected to progressively complete through 2027-2028.
Solid sales/margins across the board sponsor heavy capex
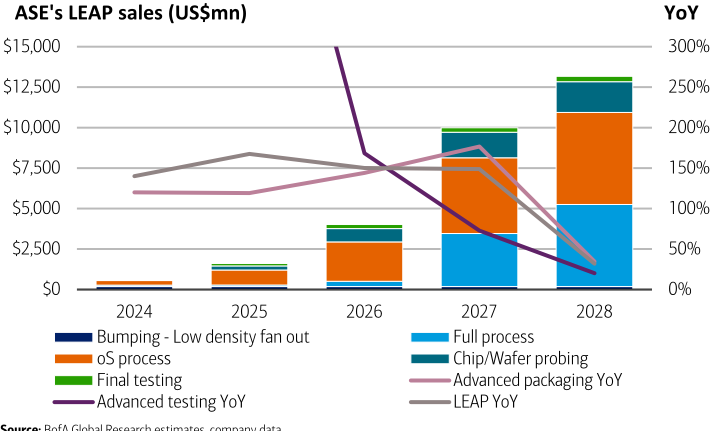
Following ASE's July announcements to acquire new lands and facilities in Kaohsiung and Taoyuan, the company announced another NT$2.15bn facility acquisition in Singapore to support the future testing expansion needs in its Singapore subsidiary as its major customers request supply base diversification. Despite rising depreciation from heavy capex investments and additional funding needs, we forecast ASE's IC ATM sales to +37% CAGR from '26-28 while GMs should improve to 33.8%/37% in '27/28 (from 28.3% in 2026) on solid packaging and testing demand for AI chipsets (BofAe LEAP sales US$4/10/13bn in 2026/27/28) and fast improving mainstream business outlook.
Decent earnings support re-rating despite funding needs
We keep Buy on ASE with NT$800 PO on 20x 2H27-1H28 P/E and maintain EPS for '26/27/28E at NT$18/31/45. While additional funding may be required to finance its aggressive spending on expansion and R&D projects, we believe the decent customer commitment and ROE of 25-30%+ from LEAP business should justify the funding costs.
| Estimates (Dec) (NT$) | 2024A | 2025A | 2026E | 2027E | 2028E |
|---|---|---|---|---|---|
| Net Income (Adjusted - mn) | 36,902 | 43,283 | 83,585 | 141,453 | 205,977 |
| EPS | 7.70 | 9.30 | 18.13 | 30.90 | 45.30 |
| EPS Change (YoY) | 4.0% | 20.8% | 94.9% | 70.5% | 46.6% |
| Consensus EPS (Visible Alpha) | 18.39 | 28.36 | 37.47 | ||
| Dividend / Share | 5.30 | 5.70 | 11.30 | 19.40 | 28.40 |
| Free Cash Flow / Share | 2.61 | (5.16) | (36.89) | (45.13) | (13.32) |
| ADR EPS (US$) | 0.480 | 0.597 | 1.14 | 1.94 | 2.84 |
| ADR Dividend / Share (US$) | 0.330 | 0.366 | 0.708 | 1.22 | 1.78 |
| Valuation (Dec) | |||||
| P/E | 91.29x | 75.58x | 38.78x | 22.75x | 15.52x |
| Dividend Yield | 0.754% | 0.811% | 1.61% | 2.76% | 4.04% |
| EV / EBITDA* | 36.30x | 30.42x | 19.45x | 11.32x | 8.00x |
| Free Cash Flow Yield* | 0.358% | -0.713% | -5.16% | -6.32% | -1.87% |
| * For full definitions of iQmethod SM measures, see page 8. |
This research report provides general information only. No part of this report may be used or reproduced or quoted in any manner whatsoever in Taiwan by the press or other persons without the express written consent of BofA Securities.
>> Employed by a non-US affiliate of BofAS and is not registered/qualified as a research analyst under the FINRA rules.
Refer to "Other Important Disclosures" for information on certain BofA Securities entities that take responsibility for the information herein in particular jurisdictions.
BofA Securities does and seeks to do business with issuers covered in its research reports. As a result, investors should be aware that the firm may have a conflict of interest that could affect the objectivity of this report. Investors should consider this report as only a single factor in making their investment decision.
Refer to important disclosures on page 9 to 12. Analyst Certification on page 6. Price
30 September 2026
Equity
Haas Liu >> Research Analyst Merrill Lynch (Taiwan) +886 2 2376 3727 haas.liu@bofa.com
Mike Yang >> Research Analyst Merrill Lynch (Taiwan) mike.c.yang@bofa.com
Cathy Hsu >> Research Analyst Merrill Lynch (Taiwan) cathy.hsu3@bofa.com
Stock Data
| Price (Common / ADR) | 703.00 TWD / 45.31 USD |
|---|---|
| Price Objective | 800.00 TWD / 51.00 USD |
| Date Established | 8-Sep-2026 / 8-Sep-2026 |
| Investment Opinion | C-1-7 / C-1-7 |
| 52-Week Range | 162.50 TWD-729.00 TWD |
| Market Value (mn) | 98,453 USD |
| Market Value (mn) | 3,142,812 TWD |
| Shares Outstanding (mn) | 4,470.6 / 2,235.3 |
| Average Daily Value (mn) | 384.96 USD |
| Free Float | 81.9% |
| BofA Ticker / Exchange | XSRIF / TAI |
| BofA Ticker / Exchange | ASX / NYS |
| Bloomberg / Reuters | 3711 TT / 3711.TW |
| ROE (2026E) | 20.3% |
| Net Dbt to Eqty (Dec-2025A) | 41.5% |
Glossary of abbreviations in Exhibit 9
iQprofile SM ASE Technology Holding
| Key Income Statement Data (Dec) | 2024A | 2025A | 2026E | 2027E | 2028E |
|---|---|---|---|---|---|
| (NT$ Millions) | |||||
| Sales | 595,410 | 645,388 | 846,543 | 1,089,719 | 1,297,628 |
| Gross Profit | 96,997 | 114,193 | 179,917 | 290,641 | 396,978 |
| Sell General & Admin Expense | (28,935) | (30,586) | (37,752) | (44,816) | (49,575) |
| Operating Profit | 39,232 | 50,756 | 98,585 | 192,658 | 286,762 |
| Net Interest & Other Income | 2,588 | 545 | 3,412 | (16,792) | (29,302) |
| Associates | NA | NA | NA | NA | NA |
| Pretax Income | 41,820 | 51,301 | 101,997 | 175,866 | 257,460 |
| Tax (expense) / Benefit | (7,756) | (9,460) | (18,880) | (33,098) | (48,196) |
| Net Income (Adjusted) | 36,902 | 43,283 | 83,585 | 141,453 | 205,977 |
| Average Fully Diluted Shares Outstanding | 4,333 | 4,462 | 4,506 | 4,506 | 4,506 |
| Key Cash Flow Statement Data | |||||
| Net Income | 32,620 | 40,658 | 81,048 | 139,247 | 204,103 |
| Depreciation & Amortization | 59,815 | 67,440 | 86,230 | 124,891 | 162,867 |
| Change in Working Capital | (3,706) | (9,449) | (22,598) | (36,173) | (27,900) |
| Deferred Taxation Charge | NA | NA | NA | NA | NA |
| Other Adjustments, Net | 2,058 | 43,600 | 27,147 | 0 | 0 |
| Cash Flow from Operations | 90,788 | 142,249 | 171,827 | 227,965 | 339,071 |
| Capital Expenditure | (79,522) | (164,643) | (333,900) | (426,600) | (397,800) |
| (Acquisition) / Disposal of Investments | 1 | (1,971) | 4,511 | 1,719 | (178) |
| Other Cash Inflow / (Outflow) | (4,387) | 969 | (12,022) | 0 | 0 |
| Cash Flow from Investing | (83,909) | (165,644) | (341,411) | (424,881) | (397,978) |
| Shares Issue / (Repurchase) | 1,103 | 3,480 | 2,203 | 0 | 0 |
| Cost of Dividends Paid | (22,459) | (23,034) | (25,208) | (50,250) | (86,333) |
| Cash Flow from Financing | (7,271) | 45,269 | 89,859 | 184,919 | 90,251 |
| Free Cash Flow | 11,266 | (22,393) | (162,073) | (198,635) | (58,729) |
| Net Debt | 109,225 | 155,020 | 337,127 | 586,012 | 731,074 |
| Change in Net Debt | 20,146 | 61,690 | 199,041 | 247,166 | 145,241 |
| Key Balance Sheet Data | |||||
| Property, Plant & Equipment | 312,531 | 421,115 | 699,889 | 1,063,727 | 1,384,481 |
| Other Non-Current Assets | 152,881 | 154,423 | 202,546 | 224,320 | 250,667 |
| Trade Receivables | 113,420 | 125,042 | 152,050 | 198,842 | 233,310 |
| Cash & Equivalents | 84,883 | 100,223 | 34,387 | 20,671 | 52,193 |
| Other Current Assets | 76,982 | 88,530 | 100,913 | 114,459 | 124,064 |
| Total Assets | 740,698 | 889,333 | 1,189,783 | 1,622,018 | 2,044,714 |
| Long-Term Debt | 140,237 | 214,510 | 304,588 | 544,588 | 724,588 |
| Other Non-Current Liabilities | 23,735 | 57,108 | 90,750 | 90,750 | 90,750 |
| Short-Term Debt | 53,872 | 40,734 | 66,926 | 62,094 | 58,678 |
| Other Current Liabilities | 177,068 | 203,615 | 221,262 | 245,030 | 253,256 |
| Total Liabilities | 394,911 | 515,966 | 683,525 | 942,462 | 1,127,272 |
| Total Equity | 345,787 | 373,368 | 506,258 | 679,556 | 917,442 |
| Total Equity & Liabilities | 740,698 | 889,333 | 1,189,783 | 1,622,018 | 2,044,714 |
| iQmethod SM - Bus Performance* | |||||
| Return On Capital Employed | 6.2% | 6.9% | 9.9% | 13.5% | 14.8% |
| Return On Equity | 11.9% | 12.9% | 20.3% | 25.1% | 26.8% |
| Operating Margin | 6.6% | 7.9% | 11.6% | 17.7% | 22.1% |
| EBITDA Margin | 16.6% | 18.3% | 21.8% | 29.1% | 34.7% |
| iQmethod SM - Quality of Earnings* | |||||
| Cash Realization Ratio | 2.5x | 3.3x | 2.1x | 1.6x | 1.6x |
| Asset Replacement Ratio | 1.4x | 2.6x | 4.0x | 3.5x | 2.5x |
| Tax Rate (Reported) | 18.5% | 18.4% | 18.5% | 18.8% | 18.7% |
| Net Debt-to-Equity Ratio | 31.6% | 41.5% | 66.6% | 86.2% | 79.7% |
| Interest Cover | 5.8x | 6.8x | 8.0x | 8.1x | 8.6x |
Key Metrics
- For full definitions of iQmethod SM measures, see page 8.
Company Sector
Semiconductors
Company Description
Established in 1984 and headquartered in Taiwan, ASE Technology Holding is the no.1 outsourced assembly and testing (OSAT) firm globally, in terms of market share by revenue. ASE acquired Siliconware Precision (SPIL) in 2018, and had acquired USI in 2010, which became its EMS business segment providing synergies in system-level packaging. 2 shares = 1 ADR.
Investment Rationale
We rate ASE Buy, factoring in the company's opportunity in advanced packaging and testing evidenced in TSMC's outsourcing and its own heavy capex investment. The strategy shift should allow the company to capture fast growing addressable market in high performance computing applications and improves its margins. ASE could maintain its leading position in the Outsourced Semiconductor Assembly and Test (OSAT) universe, owing to its well-established footprints and widespread service offerings.
| Stock Data | |
|---|---|
| Shares / ADR | 2.00 |
| Price to Book Value | 6.6x |
lül
Focus charts and tables
Exhibit 1: ASE 2026-28 estimates BofAe vs. Street
We maintain our EPS estimates for '26/27/28 at NT$18/31/45
| 2026E - BofAe | 2026E - Street | 2026E - vs. Street | 2027E - BofAe | 2027E - Street | 2027E - vs. Street | 2028E - BofAe | 2028E - Street | 2028E - vs. Street | |
|---|---|---|---|---|---|---|---|---|---|
| Sales (NT$mn) Sales QoQ / YoY (%) | $846,543 31.2% | $837,179 29.7% | 1% | $1,089,719 28.7% | $1,043,653 24.7% | 4% | $1,297,628 19.1% | $1,230,594 17.9% | 5% |
| Gross profit (NT$mn) GMs (%) | $179,917 21.3% | $177,390 21.2% | 1% 0% | $290,641 26.7% | $247,335 23.7% | 18% 3% | $396,978 30.6% | $314,331 25.5% | 26% 5% |
| Operating profit (NT$mn) OpMs (%) | $98,585 11.6% | $98,311 11.7% | 0% 0% | $192,658 17.7% | $155,971 14.9% | 24% 3% | $286,762 22.1% | $211,153 17.2% | 36% 5% |
| Pretax profit (NT$mn) Pretax margins (%) | $101,997 12.0% | $103,760 12.4% | -2% 0% | $175,866 16.1% | $155,822 14.9% | 13% 1% | $257,460 19.8% | $204,201 16.6% | 26% 3% |
| Tax expense (NT$mn) Tax rate (%) | -$20,949 20.5% | -$20,517 19.8% | 2% 1% | -$36,619 20.8% $139,247 | -$31,011 19.9% $124,811 12.0% | 18% 1% 12% 1% | -$53,357 20.7% $204,103 | -$40,544 19.9% $163,657 13.3% | 32% 1% 25% |
| Net profit (NT$mn) Net margins (%) | $81,048 | $83,243 | -3% | 12.8% | 2% | ||||
| EPS (NT$) | 9.6% | 0% | 15.7% | ||||||
| $18.13 | 9.9% | ||||||||
| $28.24 | $45.30 | $37.25 | |||||||
| $18.78 | -3% | $30.90 | 9% | 22% |
Source: BofA Global Research estimates, Bloomberg
Exhibit 2: ASE's equipment buy YTD vs. capex trend
ASE's spending on equipment through late September is already tracking 82% if its full year Capex guidance
Source: BofA Global Research estimates, company data
il
BofA GLOBAL RESEARCH
BofA GLOBAL RESEARCH
Exhibit 3: ASE IC ATM revenue and GMs/OpMs
ASE's LEAP business to drive GM expansion to 37% in 2028
Source: BofA Global Research estimates, company data
Exhibit 4: ASE LEAP/IC ATM revenue
LEAP to account for 38% of IC ATM sales in 2028
BofA GLOBAL RESEARCH
Exhibit 5: ASE LEAP/non-LEAP/IC ATM GMs
LEAP is margin accretive to IC ATM business
ASE's LEAP/Non-LEAP/ICATM GMs
Source: BofA Global Research estimates, company data
Source: BofA Global Research estimates, company data
BofA GLOBAL RESEARCH
BofA GLOBAL RESEARCH
il
Exhibit 6: ASE LEAP sales by subsegments and YoY
ASE's full process packaging should see strong ramp from 2H26
BofA GLOBAL RESEARCH
Exhibit 8: ASE Capex/Net debt/FCF
ASE will need debt to support Capex expansion
BofA GLOBAL RESEARCH
BofA GLOBAL RESEARCH
Source: BofA Global Research estimates, company data
Exhibit 7: ASE Capex and IC ATM sales
ASE Capex as % of IC ATM sales to remain above 40%
Exhibit 9: Terms and definitions
Glossary of abbreviations/acronyms
Term Definition
IC ATM Integrated Circuit Assembly, Testing, and Material
LEAP
Leading-Edge Advanced Packaging
oS
On Substrate
Source: BofA Global Research
il
BofA GLOBAL RESEARCH
Price objective basis & risk
ASE Technology Holding (XSRIF / ASX)
We value ASE Technology Holding at NT$800 per share (US$51 for ADR), based on 20x 2H27-1H28E P/E, above its historical range of 5-26x, in view of its solidified industry position in AI era. We use P/E ratio to value ASE as the company has been able to maintain healthy profitability through the cycles in the past 20 years due to consolidating industry landscape supporting a more benign supply/demand and keeping pricing and margins less cyclical.
Downside risks to our PO are 1) share loss and/or ASP erosion owing to Chinese players' cannibalization and/or ASE's worsening execution, 2) weakening end demand due to uncontrollable matters, such as macro halt and/or geopolitical tensions, 3) regulatory issues that could hinder ASE from generating synergies and benefit its competitors.