PDF 原檔:260701_2345_智邦_daiwa_accton_original.pdf
圖片清單(已驗證 2026-07-02)
| 檔名 | size | 分類 | 親眼所見內容 |
|---|---|---|---|
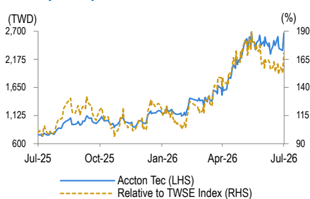
| _001.png | 27KB | 裝飾·valuation | 股價表現圖 |
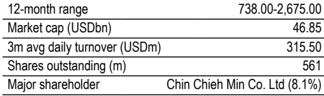
| _002.png | 21KB | 裝飾·valuation | 股價表現圖(相對指數) |
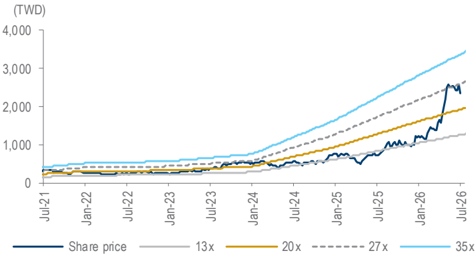
| _003.png | 35KB | 裝飾·valuation | 1-year forward PER bands |
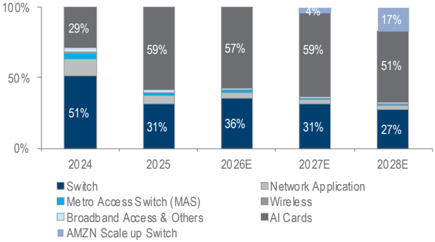
| _004.png | 31KB | 裝飾·valuation | 依產品別營收拆解圖 |
全數為財務/估值圖表 → lib 頁不嵌入。
原始內容
Taiwan
Accton Technology (2345 TT)
Target price:
TWD3,666.00 (from TWD3,222.00)
Share price (1 Jul): TWD2,660.00 | Up/downside: +37.8%
Next revenue momentum is around the corner
- Strong revenue pick-up likely due to Amazon's Trn3 ramp-up
- Long-term growth opportunities on track with solid capacity increase
- Reaffirming our Buy (1) rating; lifting our 12M TP to TWD3,666
What's new: Trainium 3 will soon begin mass production and is likely to become the key catalyst for the supply chain.
What's the impact: Near-term: ASIC AI server shipment strength is likely around the corner. Based on our supply chain check and one rail kit company's quarter-to-date revenue strength in 2Q26, we believe the entire supply chain for Trainium will benefit from the next generation that will begin mass production from June. We also revise up our shipment forecast for Amazon's Trainium from 2.6m to 3.2m (upward revision by c.25%) in 2027, as we believe the hyperscalers would focus more on ASIC AI server development due to budget concerns given the high-cost inflation environment (eg, memory, substrate). Correspondingly, we raise our revenue forecasts by 11-18% for 2026-27. We now forecast Accton's revenue in 2Q26/3Q26 to reach TWD87/107bn (vs. our prior estimates of TWD83/91bn). A stronger-than-expected revenue momentum will likely act as the key share price catalyst for Accton.
Long-term development: new growth opportunities largely on track.
Given the strong AI demand ahead, we expect Accton's capacity to increase by 30-50% from the Taoyuan and Zhubei plants in 2026 (vs. 30% earlier). Also, Accton is still eager to ramp up its new capacity in the US, Malaysia, and Vietnam (third phase) in 2027 to meet the strong demand for AI infrastructure (for both switch and AI card business). For its first client, we still expect the scale-up switch from the next generation (T4) to become the new growth driver for Accton in 2H27-2028. As for the second client, we expect the rising AI card business and potential scale-up switch to be potential growth drivers. Moreover, we believe Accton's further penetration into the L11 level would present opportunities for Accton beyond 2027. We are not overly concerned by the potential gross margin dilution as Accton would be able to provide most of the value within L11 except for memory, power, and rail kit. Finally, we see Accton aggressively developing CPO-related technology to provide value add when designing next generation switches.
What we recommend: We raise our 2026-28E EPS by 11-22% to factor in higher Trainium shipment in the forecast period. We raise our 12M TP to TWD3,666, based on an unchanged PER multiple of 35x (higher than its past-3-year range of 10-33x), applied to our 1-year forward EPS forecast. The PEG of 0.71 (2025-28E EPS CAGR of 49%) makes our target PER undemanding. Key downside risk: worse-than-expected ASIC server and switch demand.
How we differ: Our 2026-28E EPS are 1-6% higher than the Bloomberg consensus, likely due to our positive view on Accton's revenue growth.
1 July 2026
5
Daiwa
3
→
2
1
Buy
Sheng Cheng
(886) 2 8758 6253
sheng.cheng@daiwacm-cathay.com.tw
Allan Wang (886) 2 8758 6249 allan.wang@daiwacm-cathay.com.tw
Forecast revisions (%)
| Year to 31 Dec | 26E | 27E | 28E |
|---|---|---|---|
| Revenue change | 10.8 | 18.3 | 12.7 |
| Net profit change | 20.5 | 21.5 | 10.8 |
| Core EPS (FD) change | 20.5 | 21.5 | 10.8 |
Source: Daiwa forecasts
Share price performance
| 12-month range | 738.00-2,675.00 |
|---|---|
| Market cap (USDbn) | 46.85 |
| 3m avg daily turnover (USDm) | 315.50 |
| Shares outstanding (m) | 561 |
| Major shareholder | Chin Chieh Min Co. Ltd (8.1%) |
Financial summary (TWD)
| Year to 31 Dec | 26E | 27E | 28E |
|---|---|---|---|
| Revenue (m) | 374,820 | 519,281 | 717,767 |
| Operating profit (m) | 55,858 | 78,396 | 108,615 |
| Net profit (m) | 45,159 | 62,762 | 86,639 |
| Core EPS (fully-diluted) | 80.481 | 111.852 | 154.404 |
| EPS change (%) | 71.4 | 39.0 | 38.0 |
| Daiwa vs Cons. EPS (%) | 5.6 | 2.4 | 0.6 |
| PER (x) | 33.1 | 23.8 | 17.2 |
| Dividend yield (%) | 0.6 | 0.8 | 0.8 |
| DPS | 15.0 | 22.0 | 22.0 |
| PBR (x) | 17.2 | 10.9 | 7.1 |
| EV/EBITDA (x) | 24.5 | 17.0 | 11.7 |
| ROE (%) | 62.6 | 56.1 | 49.7 |
Source: FactSet, Daiwa forecasts
Accton: revenue and earnings forecasts vs. the consensus
| 2026E | 2026E | 2026E | 2027E | 2027E | 2027E | 2028E | 2028E | 2028E | |
|---|---|---|---|---|---|---|---|---|---|
| (TWDm) | Previous | New | Consensus | Previous | New | Consensus | Previous | New | Consensus |
| Revenue | 338,373 | 374,820 | 361,803 | 439,089 | 519,281 | 502,843 | 637,062 | 717,767 | 670,378 |
| Diff (%) | 10.8% | 3.6% | 18.3% | 3.3% | 12.7% | 7.1% | |||
| Gross Margin (%) | 18.5% | 19.3% | 19.1% | 18.7% | 18.9% | 19.2% | 18.9% | 18.6% | 19.3% |
| Operating profit | 46,357 | 55,859 | 52,830 | 64,293 | 78,396 | 75,802 | 97,901 | 108,615 | 106,964 |
| Op Margin (%) | 13.7% | 14.9% | 14.6% | 14.6% | 15.1% | 15.1% | 15.4% | 15.1% | 16.0% |
| Net profit | 37,477 | 45,160 | 42,752 | 51,656 | 62,762 | 61,298 | 78,209 | 86,639 | 86,150 |
| EPS (TWD) | 66.79 | 80.48 | 76.19 | 92.06 | 111.85 | 109.24 | 139.38 | 154.40 | 153.53 |
| Diff (%) | 20.5% | 5.6% | 21.5% | 2.4% | 10.8% | 0.6% |
Source: Bloomberg, Daiwa forecasts
Accton: quarterly and annual P&L highlights
| 2026E | 2026E | 2026E | 2026E | 2027E | 2027E | 2027E | 2027E | 2025 | 2026E | 2027E | 2028E | |
|---|---|---|---|---|---|---|---|---|---|---|---|---|
| (TWDm) | 1Q | 2QE | 3QE | 4QE | 1QE | 2QE | 3QE | 4QE | ||||
| Net revenue | 70,121 | 86,778 | 106,949 | 110,972 | 109,335 | 128,178 | 139,474 | 142,295 | 248,320 | 374,820 | 519,281 | 717,767 |
| COGS | -56,412 | -69,811 | -86,508 | -89,806 | -88,621 | -103,951 | -113,096 | -115,484 | -203,401 | -302,537 | -421,151 | -584,177 |
| Gross profit | 13,701 | 16,967 | 20,441 | 21,166 | 20,714 | 24,226 | 26,378 | 26,811 | 44,886 | 72,275 | 98,130 | 133,590 |
| Operating expenses | -3,652 | -3,992 | -4,278 | -4,494 | -4,647 | -4,871 | -4,951 | -5,265 | -12,752 | -16,417 | -19,734 | -24,975 |
| Operating profit | 10,049 | 12,975 | 16,163 | 16,672 | 16,068 | 19,356 | 21,427 | 21,546 | 32,135 | 55,859 | 78,396 | 108,615 |
| Non-operating profit | 313 | 246 | 253 | 265 | 247 | 252 | 254 | 254 | 782 | 1,076 | 1,007 | 1,011 |
| Pre-tax profit | 10,362 | 13,222 | 16,416 | 16,936 | 16,314 | 19,608 | 21,681 | 21,800 | 32,917 | 56,935 | 79,403 | 109,627 |
| Income taxes | -2,029 | -2,777 | -3,447 | -3,557 | -3,426 | -4,118 | -4,553 | -4,578 | -6,611 | -11,809 | -16,675 | -23,022 |
| Net profit | 8,341 | 10,454 | 12,977 | 13,388 | 12,897 | 15,499 | 17,136 | 17,231 | 26,342 | 45,160 | 62,762 | 86,639 |
| Net EPS (TWD) | 14.87 | 18.63 | 23.13 | 23.86 | 22.98 | 27.62 | 30.54 | 30.71 | 46.95 | 80.48 | 111.85 | 154.40 |
| Operating Ratios | ||||||||||||
| Gross margin | 19.5% | 19.6% | 19.1% | 19.1% | 18.9% | 18.9% | 18.9% | 18.8% | 18.1% | 19.3% | 18.9% | 18.6% |
| Operating margin | 14.3% | 15.0% | 15.1% | 15.0% | 14.7% | 15.1% | 15.4% | 15.1% | 12.9% | 14.9% | 15.1% | 15.1% |
| Pre-tax margin | 14.8% | 15.2% | 15.3% | 15.3% | 14.9% | 15.3% | 15.5% | 15.3% | 13.3% | 15.2% | 15.3% | 15.3% |
| Net margin | 11.9% | 12.0% | 12.1% | 12.1% | 11.8% | 12.1% | 12.3% | 12.1% | 10.6% | 12.0% | 12.1% | 12.1% |
| YoY (%) | ||||||||||||
| Net revenue | 64% | 43% | 47% | 54% | 56% | 48% | 30% | 28% | 125% | 51% | 39% | 38% |
| Gross profit | 59% | 56% | 63% | 64% | 51% | 43% | 29% | 27% | 97% | 61% | 36% | 36% |
| Operating profit | 70% | 60% | 80% | 83% | 60% | 49% | 33% | 29% | 136% | 74% | 40% | 39% |
| Pre-tax profit | 65% | 100% | 69% | 64% | 57% | 48% | 32% | 29% | 118% | 73% | 39% | 38% |
| Net profit | 63% | 108% | 66% | 60% | 55% | 48% | 32% | 29% | 120% | 71% | 39% | 38% |
| QoQ (%) | ||||||||||||
| Net revenue | -3% | 24% | 23% | 4% | -1% | 17% | 9% | 2% | ||||
| Gross profit | 6% | 24% | 20% | 4% | -2% | 17% | 9% | 2% | ||||
| Operating profit | 10% | 29% | 25% | 3% | -4% | 20% | 11% | 1% | ||||
| Pre-tax profit | 0% | 28% | 24% | 3% | -4% | 20% | 11% | 1% | ||||
| Net profit | 0% | 25% | 24% | 3% | -4% | 20% | 11% | 1% |
Source: Company, Daiwa forecasts
Accton: 1-year forward PER bands
Source: TEJ, Daiwa forecasts
Accton Technology (2345 TT): 1 July 2026
Accton: revenue breakdown by product
Source: Company, Daiwa forecasts
Daiwa
Financial summary
Key assumptions
| Year to 31 Dec | 2021 | 2022 | 2023 | 2024 | 2025 | 2026E | 2027E | 2028E |
|---|---|---|---|---|---|---|---|---|
| Switch Shipment (k units) | 3,053.0 | 3,538.1 | 4,035.6 | 4,381.5 | 4,739.1 | 5,125.9 | 5,544.3 | 5,996.8 |
| Network Application Shipment (k units) | 2,417.5 | 2,891.4 | 3,638.9 | 4,160.1 | 4,814.8 | 5,572.4 | 6,449.3 | 7,464.2 |
| Switch ASP (USD) | 463.8 | 451.4 | 506.6 | 454.6 | 573.2 | 913.1 | 1,019.5 | 1,153.0 |
Profit and loss (TWDm)
| Year to 31 Dec | 2021 | 2022 | 2023 | 2024 | 2025 | 2026E | 2027E | 2028E |
|---|---|---|---|---|---|---|---|---|
| Switch | 40,359 | 45,521 | 58,270 | 56,763 | 77,426 | 133,399 | 161,093 | 197,057 |
| Network Application | 10,916 | 20,472 | 17,468 | 13,043 | 14,560 | 15,351 | 16,854 | 18,616 |
| Other Revenue | 8,323 | 11,212 | 8,450 | 40,618 | 156,334 | 226,071 | 341,334 | 502,093 |
| Total Revenue | 59,599 | 77,205 | 84,188 | 110,425 | 248,320 | 374,820 | 519,281 | 717,767 |
| Other income | 0 | 0 | 0 | 0 | 0 | 0 | 0 | 0 |
| COGS | (48,254) | (60,687) | (64,926) | (87,647) | (203,433) | (302,545) | (421,151) | (584,177) |
| SG&A | (3,236) | (3,913) | (3,981) | (4,474) | (5,782) | (7,129) | (8,121) | (10,519) |
| Other op.expenses | (2,668) | (2,973) | (3,781) | (4,702) | (6,970) | (9,289) | (11,613) | (14,456) |
| Operating profit | 5,441 | 9,633 | 11,501 | 13,601 | 32,135 | 55,858 | 78,396 | 108,615 |
| Net-interest inc./(exp.) | (10) | 111 | 566 | 782 | 987 | 986 | 1,007 | 1,011 |
| Assoc/forex/extraord./others | 300 | 532 | (335) | 750 | (205) | 90 | 0 | 0 |
| Pre-tax profit | 5,731 | 10,276 | 11,732 | 15,134 | 32,917 | 56,934 | 79,403 | 109,627 |
| Tax | (1,026) | (2,110) | (2,812) | (3,135) | (6,611) | (11,809) | (16,675) | (23,022) |
| Min. int./pref. div./others | 0 | 0 | 0 | 1 | 36 | 34 | 34 | 34 |
| Net profit (reported) | 4,705 | 8,166 | 8,920 | 12,000 | 26,342 | 45,159 | 62,762 | 86,639 |
| Net profit (adjusted) | 4,705 | 8,166 | 8,920 | 12,000 | 26,342 | 45,159 | 62,762 | 86,639 |
| EPS (reported)(TWD) | 8.403 | 14.578 | 15.919 | 21.385 | 46.945 | 80.481 | 111.852 | 154.404 |
| EPS (adjusted)(TWD) | 8.403 | 14.578 | 15.919 | 21.385 | 46.945 | 80.481 | 111.852 | 154.404 |
| EPS (adjusted fully-diluted)(TWD) | 8.403 | 14.578 | 15.919 | 21.385 | 46.945 | 80.481 | 111.852 | 154.404 |
| DPS (TWD) | 6.474 | 5.976 | 7.471 | 9.961 | 10.957 | 15.000 | 22.000 | 22.000 |
| EBIT | 5,441 | 9,633 | 11,501 | 13,601 | 32,135 | 55,858 | 78,396 | 108,615 |
| EBITDA | 6,207 | 10,499 | 12,455 | 14,764 | 33,861 | 57,849 | 80,893 | 111,580 |
Cash flow (TWDm)
| Year to 31 Dec | 2021 | 2022 | 2023 | 2024 | 2025 | 2026E | 2027E | 2028E |
|---|---|---|---|---|---|---|---|---|
| Profit before tax | 5,731 | 10,276 | 11,732 | 15,134 | 32,917 | 56,934 | 79,403 | 109,627 |
| Depreciation and amortisation | 767 | 867 | 953 | 1,163 | 1,727 | 1,991 | 2,497 | 2,965 |
| Tax paid | (1,026) | (2,110) | (2,812) | (3,135) | (6,611) | (11,809) | (16,675) | (23,022) |
| Change in working capital | (3,574) | (1,670) | 2,131 | (3,784) | 3,360 | (9,260) | (7,393) | (10,153) |
| Other operational CF items | (529) | 2,361 | 6,366 | 565 | 3,459 | 0 | 0 | (0) |
| Cash flow from operations | 1,368 | 9,723 | 18,371 | 9,942 | 34,852 | 37,857 | 57,833 | 79,417 |
| Capex | (480) | (952) | (2,245) | (2,762) | (4,894) | (3,373) | (3,116) | (4,307) |
| Net (acquisitions)/disposals | 2,261 | (5,108) | (2,276) | 629 | (12,347) | 0 | 0 | 0 |
| Other investing CF items | 2,119 | (45) | (1,146) | 2,929 | (1,907) | 0 | 0 | 0 |
| Cash flow from investing | 3,900 | (6,104) | (5,666) | 796 | (19,149) | (3,373) | (3,116) | (4,307) |
| Change in debt | 0 | 2,325 | (2,564) | (338) | (187) | 0 | 0 | 0 |
| Net share issues/(repurchases) | 0 | 0 | 0 | 0 | 0 | 0 | 0 | 0 |
| Dividends paid | (3,622) | (3,346) | (4,185) | (5,582) | (6,148) | (8,417) | (12,345) | (12,345) |
| Other financing CF items | (320) | (261) | (307) | (295) | (327) | 4 | 4 | 4 |
| Cash flow from financing | (3,943) | (1,282) | (7,056) | (6,215) | (6,663) | (8,413) | (12,341) | (12,340) |
| Forex effect/others | 0 | 0 | 0 | 0 | 0 | 0 | 0 | 0 |
| Change in cash | 1,325 | 2,336 | 5,649 | 4,523 | 9,041 | 26,070 | 42,377 | 62,770 |
| Free cash flow | 888 | 8,772 | 16,126 | 7,181 | 29,958 | 34,483 | 54,717 | 75,110 |
Source: FactSet, Daiwa forecasts
Accton Technology (2345 TT): 1 July 2026
Daiwa
Financial summary continued …
Balance sheet (TWDm)
| Year to 31 Dec | 2021 | 2022 | 2023 | 2024 | 2025 | 2026E | 2027E | 2028E |
|---|---|---|---|---|---|---|---|---|
| Cash & short-term investment | 7,592 | 15,015 | 24,333 | 25,465 | 51,463 | 77,535 | 119,911 | 182,681 |
| Inventory | 13,246 | 12,788 | 13,551 | 19,371 | 30,202 | 36,867 | 51,321 | 71,188 |
| Accounts receivable | 10,731 | 13,730 | 11,722 | 21,714 | 38,653 | 45,560 | 63,120 | 87,246 |
| Other current assets | 214 | 349 | 386 | 4,089 | 749 | 749 | 749 | 749 |
| Total current assets | 31,782 | 41,883 | 49,991 | 70,639 | 121,067 | 160,711 | 235,102 | 341,864 |
| Fixed assets | 1,487 | 1,804 | 3,181 | 5,445 | 9,228 | 10,610 | 11,228 | 12,570 |
| Goodwill & intangibles | 109 | 168 | 178 | 1,016 | 771 | 771 | 771 | 771 |
| Other non-current assets | 1,642 | 2,206 | 3,225 | 9,366 | 12,165 | 4,572 | 4,572 | 4,572 |
| Total assets | 35,021 | 46,061 | 56,576 | 86,467 | 143,231 | 176,663 | 251,672 | 359,777 |
| Short-term debt | 0 | 0 | 133 | 175 | 333 | 333 | 333 | 333 |
| Accounts payable | 11,567 | 12,478 | 13,681 | 25,955 | 58,486 | 62,798 | 87,419 | 121,258 |
| Other current liabilities | 6,076 | 9,090 | 15,265 | 20,790 | 23,365 | 23,365 | 23,365 | 23,365 |
| Total current liabilities | 17,643 | 21,568 | 29,080 | 46,920 | 82,184 | 86,496 | 111,117 | 144,956 |
| Long-term debt | 1,003 | 2,605 | 538 | 281 | 84 | 84 | 84 | 84 |
| Other non-current liabilities | 822 | 1,460 | 1,771 | 2,831 | 3,328 | 3,328 | 3,328 | 3,328 |
| Total liabilities | 19,468 | 25,633 | 31,388 | 50,032 | 85,596 | 89,908 | 114,529 | 148,369 |
| Share capital | 5,599 | 5,601 | 5,604 | 5,611 | 5,611 | 5,611 | 5,611 | 5,611 |
| Reserves/R.E./others | 9,954 | 14,827 | 19,584 | 30,715 | 51,928 | 81,048 | 131,436 | 205,701 |
| Shareholders' equity | 15,553 | 20,428 | 25,188 | 36,327 | 57,540 | 86,659 | 137,047 | 211,312 |
| Minority interests | 0 | 0 | 0 | 108 | 96 | 96 | 96 | 96 |
| Total equity & liabilities | 35,021 | 46,061 | 56,576 | 86,467 | 143,231 | 176,663 | 251,672 | 359,777 |
| EV | 1,485,985 | 1,480,164 | 1,468,912 | 1,467,672 | 1,441,623 | 1,415,552 | 1,373,175 | 1,310,405 |
| Net debt/(cash) | (6,588) | (12,410) | (23,662) | (25,010) | (51,046) | (77,117) | (119,494) | (182,264) |
| BVPS (TWD) | 27.777 | 36.470 | 44.950 | 64.740 | 102.544 | 154.441 | 244.240 | 376.592 |
Key ratios (%)
| Year to 31 Dec | 2021 | 2022 | 2023 | 2024 | 2025 | 2026E | 2027E | 2028E |
|---|---|---|---|---|---|---|---|---|
| Sales (YoY) | 9.4 | 29.5 | 9.0 | 31.2 | 124.9 | 50.9 | 38.5 | 38.2 |
| EBITDA (YoY) | (12.3) | 69.1 | 18.6 | 18.5 | 129.3 | 70.8 | 39.8 | 37.9 |
| Operating profit (YoY) | (15.0) | 77.0 | 19.4 | 18.3 | 136.3 | 73.8 | 40.3 | 38.5 |
| Net profit (YoY) | (6.8) | 73.6 | 9.2 | 34.5 | 119.5 | 71.4 | 39.0 | 38.0 |
| Core EPS (fully-diluted) (YoY) | (6.9) | 73.5 | 9.2 | 34.3 | 119.5 | 71.4 | 39.0 | 38.0 |
| Gross-profit margin | 19.0 | 21.4 | 22.9 | 20.6 | 18.1 | 19.3 | 18.9 | 18.6 |
| EBITDA margin | 10.4 | 13.6 | 14.8 | 13.4 | 13.6 | 15.4 | 15.6 | 15.5 |
| Operating-profit margin | 9.1 | 12.5 | 13.7 | 12.3 | 12.9 | 14.9 | 15.1 | 15.1 |
| Net profit margin | 7.9 | 10.6 | 10.6 | 10.9 | 10.6 | 12.0 | 12.1 | 12.1 |
| ROAE | 31.3 | 45.4 | 39.1 | 39.0 | 56.1 | 62.6 | 56.1 | 49.7 |
| ROAA | 14.2 | 20.1 | 17.4 | 16.8 | 22.9 | 28.2 | 29.3 | 28.3 |
| ROCE | 33.8 | 48.7 | 47.0 | 43.4 | 67.7 | 76.9 | 69.8 | 62.2 |
| ROIC | 64.2 | 90.1 | n.a | n.a | n.a | n.a | n.a | n.a |
| Net debt to equity | n.a. | n.a. | n.a. | n.a. | n.a. | n.a. | n.a. | n.a. |
| Effective tax rate | 17.9 | 20.5 | 24.0 | 20.7 | 20.1 | 20.7 | 21.0 | 21.0 |
| Accounts receivable (days) | 61.0 | 57.8 | 55.2 | 55.3 | 44.4 | 41.0 | 38.2 | 38.2 |
| Current ratio (x) | 1.8 | 1.9 | 1.7 | 1.5 | 1.5 | 1.9 | 2.1 | 2.4 |
| Net interest cover (x) | 548.6 | n.a. | n.a. | n.a. | n.a. | n.a. | n.a. | n.a. |
| Net dividend payout | 71.7 | 71.1 | 51.2 | 62.6 | 51.2 | 32.0 | 27.3 | 19.7 |
| Free cash flow yield | 0.1 | 0.6 | 1.1 | 0.5 | 2.0 | 2.3 | 3.7 | 5.0 |
Source: FactSet, Daiwa forecasts
Company profile
Founded in 1988, Accton is dedicated to the design and manufacturing of enterprise networking and communication products. With its long-term experience and expertise, Accton is one of the leading open-source networking ODM partners for major players worldwide, with particular focuses on data centres, telco carriers and campus networks. Major products include enterprise switches, metro access switches, network applications and wireless products.
Accton Technology (2345 TT): 1 July 2026
Daiwa
ESG analysis
ESG risks
| Risks | Management | Analyst comments |
|---|---|---|
| G | Executive/board quality 1 | Accton's board has 8 directors, with 4 independent directors. The independent directors account for 50% of all directors. A total of 5 board meetings were held in 2023, and the average attendee rate was 96%. The background of independent directors is diversified and their competence includes networking technology, business management, acounting, and work experience in the medical industry. We deem the diversified background as a positive factor for the company's board quality. Besides, the Chairman and CEO are not the same person, which increases the board and executive management's quality. Based on its board structure and key executive hiring, we believe that Accton has already professionalised the family business by allowing external professionals to run the business for major shareholders. |
| Capital management | 1 | We attribute the slightly lower payout ratio to the higher capacities investment in its new Zhunan and Vietnam plants due to the US-China tension. The DPS CAGR in the past 10 years was c.18%, which showcased Accton's capability in capital management. The continuous improvement in networking capabilities (eg, 100G switch, 400G switch) has helped it to differentiate itself from other competitors and successfully penetrate into the white-box switch supply chain for major US cloud service providers recently. |
| Related party & transaction | 1 | There was no related parties transactions in 2024. We see limited risk from related party transactions. |
| S Data security | 2 | To ensure information security for customers and the company, Accton passed the CNS 27001:2014 (ISO/IEC 27001:2013) in 2016 and will complete re-certification for information security every year. Apart from the global information security standards setup, Accton also takes some physical measures to improve its information security, including: 1) implementing power supply improvement plans in the server room by replacing the UPS system and strengthening the power stability, so that the servers can remain in operation and services are not interrupted due to external power outages. 2) purchasing vulnerability analysis software to execute vulnerability scans and penetration tests |
Note: Management score represents a company's ability to manage/benefit from certain ESG topics. The scores range from 1 to 3, with 1 being the strongest.
Update Date: 5 Nov 2025
Source: Daiwa, Company
Accton Technology (2345 TT): 1 July 2026
Daiwa