PDF 原檔:260529_2454_聯發科_gs_MTK_original.pdf
原始內容
MediaTek (2454.TW)
Key takeaways from MediaTek pre-Computex event; data center/custom ASIC moves to center stage; reiterate Buy
2454.TW
12m Pri c e Target:
NT$5,000.00
Pri c e:
NT$4,310.00
Upside:
16.0%
We attended MediaTek's pre-Computex event on 29 May, where management walked through the company's positioning across cloud and edge under the 'One MediaTek' framework. The central narrative was MediaTek's transformation 'from edge to cloud':
building on a dominant edge/device franchise (#1 in smartphone SoC and in smart-home connectivity), it is now carrying that compute and connectivity IP up into the data center, while agentic AI simultaneously pushes more intelligence back down to all edge devices . Management now see its TAM expanding from a US$60-70bn TAM in 2020 towards US$200bn+ as Generative AI becomes the key semiconductor demand driver.
Management also reiterated US$2bn data center/AI ASIC revenue in 2026 and a US$70-80bn 2027 ASIC TAM with a 10-15% market share target - the same fi gures it had raised guidance to at its 1Q26 analyst meeting on 30 April. The value of this event, in our view, was the deeper technical showcase of MediaTek's full-stack custom-ASIC capability (SerDes, XPU, packaging, memory, interconnect) and the clear articulation of its ecosystem role via various collaborations such as NVLink Fusion and Microsoft micro-LED AOC. Please see below for our takeaways.
See also: MediaTek (2454.TW) The AI ASIC upcycle is just getting started; substantial upside potential into 2028E; reiterate Buy with TP up to NT$5,000 (1 May 2026)
Datacenters: technical depth reinforces the full-stack story
Management framed the Datacenter & Compute business opportunity around three pillars - data center solutions (custom silicon and standard product), compute (PC SoCs, including CPUs for Chrome-based PCs), and IoT - each described as a multi-billion-dollar, hyper-growth business transformed by AI build-out. On the data center numbers, management reiterated the US$2bn 2026 revenue, US$70-80bn 2027 ASIC TAM and 10-15%
BUY
Bruce Lu
+886(2)2730-4185 | bruce.lu@gs.com Goldman Sachs (Asia) L.L.C., Taipei Branch
Evelyn Yu
+886(2)2730-4187 | evelyn.yu@gs.com Goldman Sachs (Asia) L.L.C., Taipei Branch
Ryan Huang, CFA
+886(2)2730-4084 | ryan.huang@gs.com Goldman Sachs (Asia) L.L.C., Taipei Branch
Key Data _____________________________________
Market cap: NT$6.9tr / $218.2bn
Enterprise value: NT$6.6tr / $210.4bn
3m ADTV: NT$30.4bn / $961.6mn
Taiwan
Taiwan Semiconductor
M&A Rank: 3
Leases incl. in net debt & EV?: No
| GS Forecast | 12/25 | __________ 12/26E | 12/27E | 12/28E |
|---|---|---|---|---|
| Revenue (NT$ mn) | 595,965.7 | 673,339. 8 | 1,0 8 4,001.9 | 2,2 88 ,915.5 |
| EBITDA (NT$ mn) | 126,444.1 | 124,464.2 | 255, 8 27.4 | 774,133.2 |
| EPS (NT$) | 66.17 | 63.29 | 132.1 8 | 406.51 |
| P/E (X) | 20.7 | 6 8 .1 | 32.6 | 10.6 |
| P/B (X) | 5.5 | 17.4 | 13.7 | 6. 8 |
| Dividend yield (%) | 5.5 | 1.2 | 2.6 | 8 .0 |
| N debt/EBITDA (ex lease,X) | (1.9) | (2.0) | (1.5) | (1.1) |
| C R OC I (%) | 54.0 | 35.5 | 6 8 .2 | 1 8 2. 8 |
| FCF yield (%) | 6.7 | 1. 8 | 3.3 | 8 .9 |
| 3/26 | 6/26E | 9/26E | 12/26E | |
| EPS (NT$) | 15.17 | 13. 8 2 | 12.44 | 21. 8 6 |
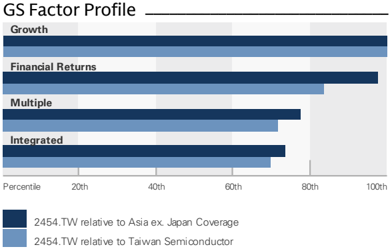
Source: Company data, Goldman Sachs Research estimates. See disclosures for details.
Goldman Sachs does and seeks to do business with companies covered in its research reports. As a result, investors should be aware that the fi rm may have a con fl ict of interest that could a ff ect the objectivity of this report. Investors should consider this report as only a single factor in making their investment decision. For Reg AC certi fi cation and other important disclosures, see the Disclosure Appendix, or go to www.gs.com/research/hedge.html. Analysts employed by non-US a ffi liates are not registered/quali fi ed as research analysts with FINRA in the U.S.
e92c7a75ab8b4efbba794e6b187208c8
BUY
MediaTek (2454.TW)
Rating since Feb 5, 2026
Ratios & Valuation __________________________________________
| 12/25 | 12/26E | 12/27E | 12/28E | |
|---|---|---|---|---|
| P/E (X) | 20.7 | 68.1 | 32.6 | 10.6 |
| P/B (X) | 5.5 | 17.4 | 13.7 | 6.8 |
| FCF yield (%) | 6.7 | 1.8 | 3.3 | 8.9 |
| EV/EBITDAR (X) | 15.5 | 53.2 | 25.4 | 7.8 |
| EV/EBITDA (excl. leases) (X) | 15.5 | 53.2 | 25.4 | 7.8 |
| CROCI (%) | 54.0 | 35.5 | 68.2 | 182.8 |
| ROE (%) | 26.4 | 25.2 | 46.6 | 84.8 |
| Net debt/equity (%) | (57.3) | (62.5) | (73.2) | (82.8) |
| Net debt/equity (excl. leases) (%) | (57.3) | (62.5) | (73.2) | (82.8) |
| Interest co v er (X) | 173.3 | 270.7 | 533.9 | 1 , 795.4 |
| Days in v entory outst , sales | 38.5 | 50.3 | 43.5 | 43.9 |
| Recei v able days | 36.9 | 56.2 | 51.8 | 53.5 |
| Days p ayable outstandin g | 179.5 | 219.1 | 188.2 | 180.5 |
| DuPont ROE (%) | 25.7 | 24.7 | 40.8 | 62.7 |
| Turno v er (X) | 0.8 | 0.8 | 1.1 | 1.1 |
| L e v era g e (X) | 1.8 | 2.1 | 2.0 | 2.0 |
| G ross cas h in v ested (ex cas h ) (NT $ ) | 324 , 106.7 | 324 , 729.0 | 331 , 094.9 | 389 , 835.0 |
| A v era g e ca p ital e mp loyed (NT $ ) | 188 , 602.2 | 163 , 907.3 | 145 , 605.7 | 157 , 845.2 |
| BVP S (NT $ ) | 249.76 | 248.23 | 315.20 | 636.22 |
Growth & Margins (%) ______________________________________
| 12/25 | 12/26E | 12/27E | 12/28E | |
|---|---|---|---|---|
| Total revenue growth | 12.3 | 13.0 | 61 | 111.2 |
| EBITDA growth | 2.5 | (1.6) | 105.5 | 202.6 |
| EPS growth | (1.2) | (4.3) | 108.8 | 207.5 |
| DPS growth | 39.7 | (28.9) | 108.8 | 207.5 |
| EBIT margin | 17.4 | 15.1 | 21.7 | 33 |
| EBITDA margin | 21.2 | 18.5 | 23.6 | 33.8 |
| Net income margin | 17.7 | 15.0 | 19.4 | 28.3 |
Absolute
Rel. to the Taiwan SE Weighted Index
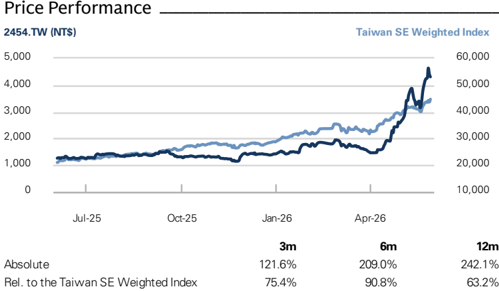
Source: FactSet. Price as of 29 May 2026 close.
Income Statement (NT$ mn) ________________________________
| 12/25 | 12/26E | 12/27E | 12/28E | |
|---|---|---|---|---|
| Tota l r e v e nu e | 595,965.7 | 673,339.8 | 1,084,001.9 | 2,288,915.5 |
| Co s t of good s s old | (312,885.7) | (364,360.4) | (593,643.4) | (1,224,190.0) |
| SG&A | (31,303.9) | (34,871.3) | (42,010.4) | (49,468.1) |
| R&D | (148,306.4) | (172,261.5) | (213,494.5) | (260,777.2) |
| Other operating inc./(exp.) | -- | -- | -- | -- |
| E BITDA | 126 ,444. 1 | 12 4,4 6 4. 2 | 255 , 827 .4 | 77 4, 1 33. 2 |
| Depreciation& amortization | (22,974.4) | (22,617.6) | (20,973.9) | (19,653.0) |
| E BIT | 1 03,4 6 9. 7 | 1 0 1 , 8 4 6 . 6 | 2 34, 85 3. 5 | 75 4,4 8 0. 2 |
| Net intere s t inc./(exp.) | 10,222.3 | 10,317.1 | 10,285.0 | 10,306.1 |
| Income/(lo ss ) from a ss ociate s | 785.0 | -- | -- | -- |
| Pre-t axp r ofi t | 12 4, 887 . 8 | 118 , 216 . 1 | 251 , 1 3 8 .4 | 77 0, 786 .3 |
| Provi s ion for taxe s | (18,770.2) | (16,642.6) | (39,924.1) | (122,845.8) |
| Minority intere s t | (798.3) | (816.3) | (793.9) | (795.0) |
| Preferred dividend s | -- | -- | -- | -- |
| N et inc . (p re-e xc e p t ionals) | 1 0 5 ,3 1 9.3 | 1 00, 757 .3 | 21 0,4 2 0.4 | 6 4 7 , 1 4 5 .4 |
| Po s t-tax exceptional s | -- | -- | -- | -- |
| N et inc . (pos t-e xc e p t ionals) | 1 0 5 ,3 1 9.3 | 1 00, 757 .3 | 21 0,4 2 0.4 | 6 4 7 , 1 4 5 .4 |
| E P S(basic , p re-e xc e p t ) (N T $) | 66 . 17 | 6 3. 2 9 | 1 3 2 . 18 | 40 6 . 51 |
| E P S(dilu te d , p re-e xc e p t ) (N T $) | 66 . 17 | 6 3. 2 9 | 1 3 2 . 18 | 40 6 . 51 |
| E P S(basic , pos t-e xc e p t ) (N T $) | 66 . 17 | 6 3. 2 9 | 1 3 2 . 18 | 40 6 . 51 |
| E P S(dilu te d , pos t-e xc e p t ) (N T $) | 66 . 17 | 6 3. 2 9 | 1 3 2 . 18 | 40 6 . 51 |
| DPS (NT$) | 75.05 | 53.40 | 111.51 | 342.96 |
| Div. payout ratio (%) | 113.4 | 84.4 | 84.4 | 84.4 |
| mn) | 12/25 | 12/26E | ______ | 12/28E |
| Balance Sheet (NT$ C a sh& c a sh equiv a lents | 235,290.1 | 255,638.2 | 12/27E 378,452.9 | 855,055.7 |
| Accounts receiv a ble | 68,597.0 | 138,731.7 | 169,206.0 | 502,374.1 |
| Inventory | 67,234.6 | 118,171.8 | 140,401.7 | 409,800.3 |
| Other current a ssets | 26,334.6 | 26,334.6 | 26,334.6 | 26,334.6 |
| Total c u rrent assets | 39 7 ,4 56 . 2 | 5 3 8 , 876 .4 | 71 4,39 5 . 1 | 1 , 7 93, 56 4. 6 |
| Net PP&E | 60,427.4 | 52,057.1 | 45,330.5 | 39,924.7 |
| Net int a ngibles | 80,261.7 | 70,014.4 | 59,767.1 | 49,519.8 |
| Tot a l investments | 168,911.6 | 168,911.6 | 168,911.6 | 168,911.6 |
| Other long-term a ssets | 36,727.9 | 36,727.9 | 36,727.9 | 36,727.9 |
| Total assets | 7 43, 78 4. 8 | 866 , 587 .4 | 1 ,0 25 , 1 3 2 . 2 | 2 ,0 88 , 6 4 8 . 7 |
| Accounts p a y a ble | 156,525.1 | 280,974.8 | 331,313.0 | 879,139.6 |
| Short-term debt | 940.0 | 940.0 | 940.0 | 940.0 |
| Short-term le a se li a bilities | -- | -- | -- | -- |
| Other current li a bilities | 145,884.7 | 145,884.7 | 145,884.7 | 145,884.7 |
| Total c u rrent liabilities | 303,349. 8 | 4 27 , 7 99. 5 | 4 78 , 1 3 7 . 8 | 1 ,0 25 ,9 6 4.3 |
| Long-term debt | 60.0 | 60.0 | 60.0 | 60.0 |
| Long-term le a se li a bilities | -- | -- | -- | |
| 31,180.0 | 31,180.0 | 31,180.0 | -- | |
| Other long-term li a bilities Total long-term liabilities | 3 1 , 2 40.0 | 3 1 , 2 40.0 | 3 1 , 2 40.0 | 31,180.0 3 1 , 2 40.0 |
| 334, 58 9. 8 | 4 | 5 | 1 ,0 57 , 2 | |
| Total liabilities | 5 9,039. 5 | 09,3 77 . 7 | 04.3 | |
| Preferred sh a res | -- | -- | -- | -- |
| Minority interest | 8 , 5 94.0 | 9,4 1 0.3 | 1 0, 2 04. 2 | 1 0,999.3 |
| Total liabilities &eq u ity | 7 43, 78 4. 8 | 866 , 587 .4 (254,638.2) | 1 ,0 25 , 1 3 2 . 2 (377,452.9) | 2 ,0 88 , 6 4 8 . 7 (854,055.7) |
| Net debt, a djusted | (234,290.1) |
Cash Flow (NT$ mn) ________________________________________
| 12/25 | 12/26E | 12/27E | 12/28E | |
|---|---|---|---|---|
| Net income | 105,319.3 | 100,757.3 | 2 10,4 2 0.4 | 647,145.4 |
| D&Aadd-back | 22 ,974.4 | 22 ,617.6 | 2 0,973.9 | 19,653.0 |
| Minority interest add-back | 798.3 | 816.3 | 793.9 | 795.0 |
| Net (inc)/dec working capital | ( 2 0,30 2 .7) | 3,377.7 | ( 2 ,365.9) | (54,740.1) |
| Other operating cash flow | 54,003.6 | -- | -- | -- |
| Cash flow from operations | 162 , 7 9 2 .9 | 127 , 568 . 8 | 22 9, 822 .3 | 612 , 85 3.4 |
| C apital expenditures | (15,059.1) | (4,000.0) | (4,000.0) | (4,000.0) |
| Acquisitions | (1,141.7) | -- | -- | -- |
| Divestitures | -- | -- | -- | -- |
| Others | ( 2 1,553.1) | -- | -- | -- |
| Cash flow from investing | (3 7 , 75 4.0) | (4,000.0) | (4,000.0) | (4,000.0) |
| Repayment of lease liabilities | -- | -- | -- | -- |
| Dividends paid(common& pref) | (86,069.6) | (103, 22 0.7) | (103,007.7) | (13 2 , 2 50.5) |
| Inc/(dec) in debt | 60.0 | -- | -- | -- |
| Other financing cash flows | (7,435.1) | 0.0 | 0.0 | 0.0 |
| Cash flow from financing | (93,444. 7 ) | ( 1 03, 22 0. 7 ) | ( 1 03,00 7 . 7 ) | ( 1 3 2 , 25 0. 5 ) |
| Total cash flow | 3 1 , 5 94. 2 | 2 0,34 8 . 1 | 122 , 81 4. 6 | 4 76 , 6 0 2 . 8 |
| Free cash flow | 147,733.8 | 1 2 3,568.8 | 22 5,8 22 .3 | 608,853.4 |
Source: Company data, Goldman Sachs Research estimates.
e92c7a75ab8b4efbba794e6b187208c8
share target fi rst raised at the 1Q26 analyst meeting. Management sees such rapid growth in TAM being supported by the accelerating capex from Top 4 Hyperscalers, and MediaTek has won multiple large programs with very strong pipelines of new programs coming in , driving its con fi dence in capturing the 10-15% of market share in a short period of time. Overall, management positioned MediaTek not as a newcomer but as a custom-silicon vendor since 2015: having started in networking ASIC, it has progressively built strong capabilities in developing complex multi-die solutions, which now underpin its full-stack solutions.
Full-stack custom ASIC capability, not just an XPU design house
Management highlighted that MediaTek can supply the entire stack required for a competitive AI accelerators. On SerDes, in which MediaTek is best-in-class, its 224Gbps solution is now available across multiple process nodes and is now ready for production. On XPU, MediaTek works on both training and inference accelerators , integrating high-speed SerDes and optical/electrical interfaces beyond just logic and HBM, and is working on designs of more than 10x reticle size today. On packaging, MediaTek supports TSMC CoWoS and is one of very few vendors to also support EMIB, positioning itself as a 'one-stop shop' while also exploring Co-Packaged Optics (CPO) . On interconnect, it spans on-package die-to-die (UCIe, Mlink), on-board chip-to-chip (PCIe, micro-LED), and o ff -board (Ethernet, CPO solutions). In our view, the breadth of MediaTek's product suites reduces customer's integration risk and support both project wins and dollar content growth per design.
NVLink Fusion and Microsoft AOC partnership extend the ecosystem positioning
MediaTek showcased two industry partnerships (Nvidia/Microsoft) during the event. For Nvidia's NVLink Fusion , a customer can develop custom silicon with MediaTek, which provides an ASIC template for the XPU and integrate a chip-to-chip interface that allows the design to move beyond the ASIC tray into the Nvidia NV switch tray, paving the way for scalable rack-to-rack solutions and then use In fi niband or Ethernet to scale out the rest of the datacenters solution. This integration enables faster-time-to-market for custom silicon that operate with Nvidia rack-level infrastructure. Separately, management also introduced an active optical cable (AOC) solution that adopts micro-LED, which is co-developed with Microsoft. Management claims that the AOC solution enjoys 50% power reduction vs. VCSEL-based solution, while o ff ering the reliability of copper with much further reach. Lastly, management clari fi ed that MediaTek is not launching its own rack-level solution; rather it provides adjacent solutions, such as retimers, AOC, NVLink Fusion, to shortern time-to-market for customers beyond the largest four CSPs.
Compute: winning the 'agentic PC era'
Management claimed that the compute business has grown +80% YoY and just crossed US$1bn in revenue, spanning tablets, Chromebooks, and AI workstations. Management also fl agged strong interest in the Nvidia DGX Spark, supported by robust generative and agentic AI workload. Another key highlight is that MediaTek's market share in Chromebook CPU has risen signi fi cantly from 8% in 2023 to 30% in 2025, and expected to reach 50%+ in 2026. Management has positioned Kompanio (MediaTek's SoC solution for Chromebook) as one of the most-powerful mainstream CPU with longest battery life, which is expected to best supports Google's Gemini model going e92c7a75ab8b4efbba794e6b187208c8
forward.
Automotive: Dimensity AX and the shift to AI-de fi ned vehicles
Management detailed the Dimensity AX platform across cockpit, connectivity, and components. The cockpit platform pairs a MediaTek compute die with an Nvidia GPU die on CoWoS packaging, supporting Nvidia CUDA ecosystem, while the connect platform covers NR-NTN satellite connectivity, 5G-A, WiFi 8, and dual-Bluetooth technologies. On traction, management cited 20+ OEM partnerships and 35m+ cars already using MediaTek solution, with the business up 385% over the past fi ve years.
The bigger strategic message was the industry's shift from software-de fi ned vehicles (SDV) to AI-de fi ned vehicles (AIDV) - vehicles whose features are enabled by AI and whose tasks are carried out by intelligent agents running rapidly evolving models. Management characterized an AIDV by four traits: 1) multi-model experiences that sense beyond voice input to take in sight, sounds, emotion, health and the surrounding environment, 2) proactive, always-on services that anticipate the user's need, 3) concurrent execution of complex tasks across multiple users and scenarios than one at a time, and 4) hybrid edge-to-cloud compute rather than purely local processing. To deliver this, MediaTek's Dimensity AX platform provides powerful, concurrent multi-model inference at up to 400 TOPS, with AI-bandwidth meaningfully reduced via compression and a multi-core GPU. Net net, MediaTek positioned the Dimensity AX family as purpose-built to support the transition toward AI -de fi ned vehicles.
Edge: device leadership as the anchor, AI glasses as the next platform
Management reinforced MediaTek's edge breadth as both a pro fi t anchor and an on-ramp for agentic AI. It has been the number one smartphone SoC vendor for more than fi ve years, with growth driven by the premium and fl agship segment, and its next fl agship moving to TSMC N2 in 3Q26. In connectivity, it continues to extend its lead from WiFi 6 through 7, with WiFi 8 expected to be introduced in 2028, and it also claimed to have the number one global market share in smart-home devices. The clearest new edge platform is AI glasses, which management framed as a major opportunity growing from around 10mn units worldwide in 2025 towards 100mn units a year in 2030 , and as a natural extension of its edge franchise as agentic AI brings more intelligence to all devices. Here MediaTek leans on its 3D low-power computing IP, and the main challenges it fl agged are battery life, a form factor small enough for stylish designs, and proactive AI that can sense the surrounding environment. Taken together with its leadership in smartphones, connectivity and the smart home, AI glasses are becoming the next platform that will keep MediaTek at the center of the edge as agentic AI proliferates.
e92c7a75ab8b4efbba794e6b187208c8
Investment Thesis, Price Target Risks and Methodology
Investment Thesis - Mediatek
MediaTek is a leading global IC design house specializing in smartphone AP (application processor). We have a positive stance on MediaTek, viewing it as well-positioned to transition from a traditional smartphone application provider to an AI-focused vendor, beginning with AI smartphones and extending to enterprise ASICs and smart automotive solutions (in partnership with NVIDIA) in 2025 and beyond. We expect MediaTek to achieve solid multi-year growth, where we expect revenue and earnings to increase by 40%/57% CAGRs, respectively, in 2025-28E. This growth will be primarily driven by: 1) market share gains, particularly in the premium segment (speci fi cally high-end 5G fl agship SoCs), 2) strong ramp in AI ASIC business, and 3) new TAM in automotive/computing sectors.
Price Target Risks and Methodology - MediaTek (2454.TW)
Valuation: We have a 12m TP of NT$5,000. Our TP is based on a target P/E multiple of 25x (1.8 stdv above its 5-year trading average) applied to our 2H27E-1H28E EPS.
Key risks to our views: (1) Weaker-than-expected end demand especially with smartphones, (2) Higher foundry cost to impact its margin outlook, (3) Intensifying competition would result in change in pro fi tability as competition would normally lead to change in pricing dynamics, and (4) Slower ramp in ASIC would result in changes in operating leverage e92c7a75ab8b4efbba794e6b187208c8
圖片清單(已驗證 2026-07-02)
回補驗證:僅涵蓋已被 lib 頁嵌入的圖片,非全量驗證。
| 檔名 | size | 分類 | 親眼所見內容 |
|---|---|---|---|
260529_2454_聯發科_gs_MTK_003.png |
84KB | 真資料圖 | 「MediaTek (2454.TW) Goldman Sachs rating and stock price target history」評等目標價沿革圖,藍色股價折線疊加藍色方塊評等/目標價標記(605/770/915/1115/1300/1350/1460/1490/1780/1700/1620/1800/1400等數值)與灰色台灣加權指數線,X軸2023-2026 |