報告_Citi_台積電2330_20260513
PDF 原檔:報告_Citi_台積電2330_20260513_original.pdf
原始內容
(RIC: 2330.1W, BB: 2330 11)
TWD
2,250
2,000
1,750
1,500
1,250
1,000
750
13 May 2026 09:17:01 ET │ 21 pages
Jun
Sep
Dec
Mar
TSMC (2330.TW)
Competitive Landscape Holding Steady
CITI’S TAKE
We note that there is rising concern on long term competition for TSMC as its customers are considering other alternatives in foundry and advanced packaging. While Intel’s EMIB-T presents an alternative packaging strategy, the technology is dependent on the readiness of the ABF substrate ecosystem, a critical factor for next-generation AI scaling. TSMC’s predictable yields, cycle times, and cost control at high volumes provide a significant advantage, giving it an edge over competitors. In this note, we provide more detailed comparison from advanced node and design rule differences between EMIB-T and CoWoS.
TSMC’s Advanced Node and Packaging Strategy -During TSMC ’ s latest technology symposium, TSMC elaborated on its N2 platform, including N2P and N2X, and the AI-focused A16 node with Super Power Rail, underscoring a shift towards system-level scaling over pure transistor shrink. Separately, advanced packaging, through CoWoS, SoIC, and SoW, is central to AI compute scaling, with expanded roadmaps enabling larger, more integrated AI systems. The chip reticle cycle is moving from current 5.5-reticle CoWoS toward 9.5-reticle and eventually beyond 14-reticle package integration by 2028-2029. We estimate CoWoS capacity could continue growing at nearly 85% YoY and 60% YoY into 2026/2027 on continued strong hyperscaler AI demand, and SoIC will see substantial increase in 2027/2028 with CoPoS to follow in 2029/2030. We believe TSMC’s comprehensive AI manufacturing ecosystem provides a significant competitive advantage.
Competitive Landscape and Intel’s EMIB-T -We see no significant change in TSMC’s competitive landscape. Major AI and HPC companies have long-term foundry platform decisions locked in. Intel’s EMIB-T packaging ecosystem presents a different approach to heterogeneous integration compared to TSMC’s CoWoS-L, with the former having a greater reliance on advanced ABF substrate technology. While we believe AI chipmakers may try to diversify their sources and explore Intel’s EMIB-T technology, the compute logic of an AI die may remain identical, and the packaging interface often cannot use the same design.
ABF technology readiness is critical for EMIB-T Adoption -Given EMIB-T ’ s design methodology, the readiness of the ABF substrate ecosystem for ultra-high-density routing, precise bridge embedding, and advanced power delivery is critical for EMIBT adoption. We believe the capacity and technology readiness will be key checkpoint for EMIB-T penetration in the next 2-3 years.
Earnings Summary
| Year to 31Dec | Net Profit (NT$M) | DilutedEPS (NT$) | EPSgrowth (%) | P/E (x) | P/B (x) | ROE (%) | Yield (%) |
|---|---|---|---|---|---|---|---|
| 2024A | 1,173,268 | 45.24 | 39.9 | 49.1 | 13.4 | 30.3 | 0.6 |
| 2025A | 1,717,883 | 66.24 | 46.4 | 33.5 | 10.6 | 35.4 | 0.8 |
| 2026E | 2,563,456 | 98.85 | 49.2 | 22.5 | 7.9 | 40.4 | 1.2 |
| 2027E | 3,410,850 | 131.52 | 33.1 | 16.9 | 6 | 40.6 | 2 |
| 2028E | 4,263,281 | 164.39 | 25 | 13.5 | 4.6 | 38.9 | 2.5 |
Source: Powered by dataCentral
See Appendix A-1 for Analyst Certification, Important Disclosures and Research Analyst Affiliations.
n Buy
Short-Term View: Upside, expires 26-JUN-26
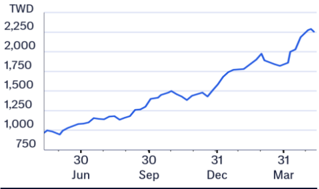
Price (13 May 26 13:30)
NT$2,220.00
Target price
NT$2,875.00
Expected share price
return
29.5%
Expected dividend yield
1.2%
Expected total return
30.7%
Market Cap
NT1,826,002M
Price Performance (RIC: 2330.TW, BB: 2330 TT)
Laura (Chia Yi) Chen AC
+886-2-8726-9090
Jack Chen +886-2-8726-9091 jack1.chen@citi.com
Nicholas Lai +886-2-8726-9093 nicholas.lai@citi.com
Citi Research
See Appendix A-1 for Analyst Certification, Important Disclosures and Research Analyst Affiliations.
| 2330.TW: Fiscalyearend31-Dec | 2330.TW: Fiscalyearend31-Dec | 2330.TW: Fiscalyearend31-Dec | 2330.TW: Fiscalyearend31-Dec | 2330.TW: Fiscalyearend31-Dec | Price: | NT$2,220.00; TP: | NT$2,875.00; | Market Cap: | NT$57,570,203m; | Recomm:Buy | |
|---|---|---|---|---|---|---|---|---|---|---|---|
| Profit&Loss(NT$m) | 2024 | 2025 | 2026E | 2027E | 2028E | Valuation ratios | 2024 | 2025 | 2026E | 2027E | 2028E |
| Sales revenue | 2,894,308 | 3,809,054 | 5,253,452 | 7,071,349 | 8,762,189 | PE(x) | 49.1 | 33.5 | 22.5 | 16.9 | 13.5 |
| Cost of sales | -1,269,954 | -1,527,760 | -1,811,170 | -2,505,095 | -3,075,722 | PB(x) | 13.4 | 10.6 | 7.9 | 6.0 | 4.6 |
| Gross profit | 1,624,354 | 2,281,294 | 3,442,282 | 4,566,254 | 5,686,467 | EV/EBITDA(x) | 28.4 | 21.3 | 14.0 | 10.5 | 8.3 |
| Gross Margin (%) | 56.1 | 59.9 | 65.5 | 64.6 | 64.9 | FCFyield (%) | 1.6 | 2.0 | 2.3 | 4.2 | 5.7 |
| EBITDA(Adj) | 1,984,850 | 2,624,188 | 3,931,270 | 5,150,214 | 6,401,563 | Dividend yield (%) | 0.6 | 0.8 | 1.2 | 2.0 | 2.5 |
| EBITDAMargin(Adj) (%) | 68.6 | 68.9 | 74.8 | 72.8 | 73.1 | Payout ratio (%) | 31 | 27 | 28 | 33 | 33 |
| Depreciation | -662,797 | -688,096 | -946,363 | -1,203,501 | -1,483,358 | ROE(%) | 30.3 | 35.4 | 40.4 | 40.6 | 38.9 |
| Amortisation | 0 | 0 | 0 | 0 | 0 | Cashflow(NT$m) | 2024 | 2025 | 2026E | 2027E | 2028E |
| EBIT (Adj) | 1,322,053 | 1,936,092 | 2,984,907 | 3,946,713 | 4,918,205 | EBITDA | 1,984,850 | 2,624,188 | 3,931,270 | 5,150,214 | 6,401,563 |
| EBIT Margin (Adj) (%) | 45.7 | 50.8 | 56.8 | 55.8 | 56.1 | Working capital | 68,257 | 27,877 | -455,087 | -30,215 | -60,205 |
| Net interest | 67,781 | 86,206 | 99,885 | 160,216 | 215,053 | Other | -147,949 | -215,723 | -421,452 | -535,863 | -654,923 |
| Associates | 828 | 2,546 | 2,000 | 2,000 | 2,000 | Operating cashflow | 1,905,157 | 2,436,342 | 3,054,732 | 4,584,136 | 5,686,435 |
| Non-Op/Except/Other Adj | 15,176 | 16,819 | 25,166 | 35,357 | 43,811 | Capex | -956,007 | -1,272,411 | -1,725,763 | -2,150,000 | -2,400,000 |
| Pre-tax profit | 1,405,839 | 2,041,663 | 3,111,959 | 4,144,285 | 5,179,068 | Net acq/disposals | 74,369 | 122,881 | 140,206 | 88,926 | -330,102 |
| Tax | -233,407 | -326,266 | -549,476 | -735,652 | -918,557 | Other | 0 | 0 | 0 | 0 | 0 |
| Extraord./Min.Int./Pref.div. | 836 | 2,486 | 973 | 2,217 | 2,770 | Investing cashflow | -881,638 | -1,149,530 | -1,585,557 | -2,061,074 | -2,730,102 |
| Reported net profit | 1,173,268 | 1,717,883 | 2,563,456 | 3,410,850 | 4,263,281 | Dividends paid | -363,055 | -466,779 | -716,556 | -1,127,769 | -1,417,854 |
| Net Margin (%) | 40.5 | 45.1 | 48.8 | 48.2 | 48.7 | Financing cashflow | -313,242 | -590,737 | -668,609 | -1,083,140 | -1,355,192 |
| CoreNPAT | 1,173,268 | 1,717,883 | 2,563,456 | 3,410,850 | 4,263,281 | Net change in cash | 627,147 | 615,273 | 709,637 | 1,348,993 | 1,510,211 |
| Per share data | 2024 | 2025 | 2026E | 2027E | 2028E | Free cashflow to s/holders | 949,151 | 1,163,931 | 1,328,969 | 2,434,136 | 3,286,435 |
| Reported EPS($) | 45.24 | 66.24 | 98.85 | 131.52 | 164.39 | ||||||
| Core EPS($) | 45.24 | 66.24 | 98.85 | 131.52 | 164.39 | Revbreakdownbynode | 2024 | 2025 | 2026E | 2027E | 2028E |
| DPS($) | 14.00 | 18.00 | 27.63 | 43.49 | 54.67 | FinSumm-TimeSeriesdataitem3 | na | na | na | na | na |
| CFPS($) | 73.46 | 93.95 | 117.79 | 176.77 | 219.27 | 2nm(%) | 0 | 0 | 14 | 29 | na |
| FCFPS($) | 36.60 | 44.88 | 51.25 | 93.86 | 126.73 | 3nm(%) | 20 | 25 | 29 | 30 | na |
| BVPS($) | 165.37 | 208.98 | 280.20 | 368.24 | 477.96 | 5nm(%) | 33 | 37 | 28 | 23 | na |
| Wtdavgordshares(m) | 25,934 | 25,933 | 25,933 | 25,933 | 25,933 | 10/7nm(%) | 18 | 15 | 13 | 9 | na |
| Wtdavgdiluted shares (m) | 25,934 | 25,933 | 25,933 | 25,933 | 25,933 | 16/20nm(%) | 8 | 7 | 5 | 3 | na |
| Growthrates | 2024 | 2025 | 2026E | 2027E | 2028E | 21nmto32nm(%) | 8 | 7 | 5 | 3 | na |
| Sales revenue (%) | 33.9 | 31.6 | 37.9 | 34.6 | 23.9 | 33nmto45nm(%) | 3 | 2 | 2 | 1 | na |
| EBIT (Adj) (%) | 43.5 | 46.4 | 54.2 | 32.2 | 24.6 | 46nmto65nm(%) | 3 | 2 | 2 | 1 | na |
| CoreNPAT(%) | 39.9 | 46.4 | 49.2 | 33.1 | 25.0 | 66nmto90nm(%) | 1 | 1 | 1 | 0 | na |
| CoreEPS(%) | 39.9 | 46.4 | 49.2 | 33.1 | 25.0 | 0.10u to 0.13u (%) | 1 | 1 | 0 | 0 | na |
| BalanceSheet(NT$m) | 2024 | 2025 | 2026E | 2027E | 2028E | ||||||
| Cash&cashequiv. | 2,127,627 | 2,767,856 | 3,370,288 | 4,567,293 | 5,868,991 | Revbrkdnbygeography | 2024 | 2025 | 2026E | 2027E | 2028E |
| Accounts receivables | 272,088 | 281,791 | 582,266 | 691,824 | 879,972 | N. America (%) | 70 | na | na | na | na |
| Inventory | 287,869 | 288,109 | 428,376 | 507,275 | 643,042 | Asia-Pacific (%) | 10 | na | na | na | na |
| Net fixed &other tangibles | 3,235,771 | 3,691,841 | 4,524,195 | 5,618,469 | 7,157,885 | China (%) | 11 | na | na | na | na |
| Goodwill &intangibles | 0 | 0 | 0 | 0 | 0 | EMEA(%) | 3 | na | na | na | na |
| Financial &other assets | 769,374 | 903,426 | 1,126,006 | 1,261,332 | 1,490,863 | Japan (%) | 5 | na | na | na | na |
| Total assets | 6,692,729 | 7,933,024 | 10,031,132 | 12,646,193 | 16,040,753 | ||||||
| Accounts payable | 74,227 | 84,330 | 113,188 | 137,050 | 169,985 | ||||||
| Short-term debt | 59,858 | 136,926 | 182,927 | 223,123 | 280,244 | ||||||
| Long-term debt | 958,429 | 896,062 | 896,062 | 896,062 | 896,062 | ||||||
| Provisions &other liab | 1,275,849 | 1,354,911 | 1,530,287 | 1,795,993 | 2,252,299 | ||||||
| Total liabilities | 2,368,362 | 2,472,229 | 2,722,464 | 3,052,228 | 3,598,590 | ||||||
| Shareholders’ equity | 4,288,545 | 5,419,596 | 7,266,496 | 9,549,576 | 12,395,003 | ||||||
| Minority interests | 35,031 | 41,199 | 42,172 | 44,389 | 47,159 | ||||||
| Total equity | 4,323,576 | 5,460,795 -1,734,869 | 7,308,668 -2,291,299 | 9,593,965 -3,448,108 | 12,442,162 -4,692,685 | ||||||
| Net debt (Adj) | -1,109,340 | ||||||||||
| Net debt to equity (Adj) (%) | -25.7 | -31.8 | -31.4 | -35.9 | -37.7 |
Figure 1. loMe - Advanced node technology roadmap
High-End
(Premium Mobile,
Data Center Server.|
Al Accelerator.
Gaming, Networking,
ADAS)
Mainstream
(Mid-to-Low-End
Mobile, Consumer.
Base Station)
@ 2026 Citigroun Inc. No redistribution without Citicroun’s written nermission.
NSP
N7A
N6
N4
N3
N4P/N4X
N3E
NSA
N4P
N2
N3P/N3X
N4C
N2P
N3A
N3C
N2X
A16
A14
N2U
N2U
A1S
A12
Figure <. loMe - Advanced node pertormance comparison
N2P PPA (vS. N3E)
Power Reduction at Same Speed
Logic Density
-36%
-1.2X
TSMC A16TM PPA*
Speed Improvement
Power Reduction at Same Vdd
8-10%
Speed Improvement at Same Power
~18%
Technology
A16
(Ref: N2P)
at Same Speed
15~20%
>= 1.15X
Chip Density
1.07-1.10X
Leading position in the most advanced node and packaging remains intact Chip Density
At the latest TSMC Technology Symposium, the company made it amply clear that its future competitiveness is no longer based purely on transistor shrink, but on building a long-duration process ecosystem spanning multiple optimized node variants. The most important message was that N2 is becoming an entire platform family rather than a one-time technology transition. TSMC reiterated that N2 entered risk production trajectory successfully for second-half of 2025, followed by N2P in 2H26 and N2X afterward for higher-performance HPC applications. More importantly, TSMC emphasized A16 as the key AI/HPC-oriented node that introduces its backside power delivery architecture called Super Power Rail (SPR).
TSMC highlighted direct backside contact architecture to reduce IR drop and improve routing efficiency. From an industry perspective, this is strategically critical because AI accelerators are increasingly constrained by power delivery and routing congestion rather than transistor density alone. TSMC claims A16 can deliver roughly 8-10% performance improvement or 15-20% lower power versus N2P, alongside modest density gains. It is also worth noting that TSMC stated that it does not urgently require High-NA EUV through at least 2029, reflecting confidence in its existing EUV optimization capability and cost structure advantage versus competitors aggressively pursuing High-NA insertion.
Figure 1. TSMC - Advanced node technology roadmap
Figure 2. TSMC - Advanced node performance comparison
© 2026 Citigroup Inc. No redistribution without Citigroup’s written permission.
Source: Citi Research, TSMC
© 2026 Citigroup Inc. No redistribution without Citigroup’s written permission.
Source: Citi Research, TSMC
Advanced Packaging has been the Core of AI Scaling Strategy
In the symposium, TSMC also reinforced that advanced packaging is now central to AI compute scaling. It presented an expanded roadmap for CoWoS, SoIC, and System-on-Wafer (SoW) technologies under its 3DFabric strategy with bigger reticle cycle from current 5.5-reticle CoWoS configurations toward 9.5-reticle and eventually beyond 14-reticle package integration by 2028-2029. This is extremely significant because it enables far larger AI systems to integrate more compute dies and HBM stacks into single packages. TSMC also highlighted SoWX, a future wafer-scale integration platform potentially capable of integrating up to 64 HBM stacks and delivering compute capability approaching an entire server rack within a single integrated system. It shows that the industry is now entering
igure 3. TSMC - Advanced packaging technology roadmap and will be in production in 2029
Interposer Size
3.3-reticle
8хHBM3
2024
2023
2025
5.5-reticle
12xHBM3E/4
2026
9.5-reticle
12х HBM4E
2027
2026 Citiornun Ine No redistrihution without Citioroun’s written nermission.
14-reticle an era where package size, memory integration, optical connectivity, and power delivery architecture determine AI system competitiveness more than transistor shrink alone.
Once again, the important strategic takeaway from the symposium was that TSMC is shifting the industry narrative away from traditional node naming competition toward full-system scaling capability . Instead of focusing purely on whether A16 competes with Intel 18A or Samsung SF2, TSMC is emphasizing total AI infrastructure optimization across compute, memory bandwidth, interconnect, optics, packaging, and power efficiency. We estimate CoWoS capacity could continue growing at nearly 85% YoY and 60% YoY into 2026/2027 on continued strong hyperscaler AI demand, and SoIC will see substantial increase in 2027/2028 with CoPoS to follow in 2029/2030.
Figure 3. TSMC - Advanced packaging technology roadmap
© 2026 Citigroup Inc. No redistribution without Citigroup’s written permission.
Source: Citi Research, TSMC
It is also worth noting that TSMC’s roadmap increasingly separates client/mobile optimization from HPC/AI optimization. Nodes such as A16 and future A12 are clearly positioned for high-power AI systems requiring backside power delivery and extreme routing density, while variants such as A13 appear more cost and area optimized. This indicates that smartphone scaling and AI datacenter scaling are diverging technologically. This is also the key that TSMC’s greatest competitive advantage is not transistor leadership alone but its advanced-node ecosystem, advanced packaging infrastructure, and AI supply-chain integration capability. Competitors may narrow transistor gaps, but replicating TSMC’s entire AI manufacturing ecosystem will likely be much more difficult over the next few years.
Competitive landscape not changing much
While we see the positives about Intel’s (covered by Atif; latest report: Intel Corp (INTC.O) - AI CPU Cycle + Terafab Foundry Opportunity = U/G to Buy) progress in 18A and rising expectation on 14A as Intel has already tied 18A to commercial products including Intel Panther Lake for notebooks and Intel Clearwater Forest for servers, key customers of TSMC such as Apple, NVIDIA and Broadcom, and others may evaluate Intel 18A/14A. This may need to be monitored closely in our view, but evaluation tape-outs are standard industry practice and do not imply big volume mass production. As a result, we don’t see competitive landscape changing much for TSMC as of now. In our view, the key debate is no longer just about transistor
>40-reticle
64xHBM
performance, but manufacturing stability and economic scalability. Other than technology leadership, TSMC’s advantage has always been on predictable yields, cycle times, defect density control, and acceptable wafer costs at high volume . Fabless companies require foundries that can perform reliably over years.
More importantly, major AI and HPC companies have already locked in their 2026/2027, or even 2028, platform decisions years ago, particularly around packaging ecosystems, IP portability, software compatibility, and supply-chain predictability. As a result, Intel’s initial foundry opportunity is more likely to come from strategic diversification programs, US-government-aligned projects, networking ASICs, or second-source manufacturing strategies rather than displacement of TSMC.
Intel EMIB-T vs TSMC CoWoS-L; Different Philosophy of Advanced Integration
As AI accelerator complexity continues to rise, hyperscalers and leading ASIC vendors are beginning to explore whether the same AI chip architecture could be deployed using either TSMC’s CoWoS-L platform or another alternative, such as Intel’s EMIB-T packaging ecosystem. The motivation is largely strategic: reducing dependency on a single packaging supply chain, mitigating CoWoS capacity constraints, improving negotiating leverage, and diversifying manufacturing risk.
It is becoming increasingly important that advanced packaging evolves from a backend assembly process into a critical system-level performance differentiator. Also worthy to note AI packaging architecture directly impacts bandwidth density, power efficiency, thermal behavior, scalability, and ultimately total system cost, and Intel EMIB-T and TSMC CoWoS-L basically represent two fundamentally different approaches to heterogeneous integration.
CoWoS-L extends TSMC’s CoWoS family by combining local silicon interconnect structures with RDL-based large-area routing , allowing very high bandwidth connectivity across large package footprints. Much of the fine-pitch routing burden is absorbed by silicon interposer-like structures and redistribution layers. This architecture is particularly well suited for large AI accelerators with multiple HBM stacks, where extremely wide memory interfaces and dense chip-to-chip interconnects are required.
By contrast, Intel EMIB-T relies on localized embedded silicon bridges rather than a full-size silicon interposer. The high-density interconnect is concentrated only where necessary, while a much larger portion of package-level routing responsibility is pushed into the ABF substrate itself . This significantly changes the substrate complexity, as the package substrate must now handle more power distribution, signal breakout, high-speed routing, via structures, and embedded trace management.
As a result, EMIB-T generally imposes greater demands on substrate technology, including:
-
n ultra-fine line/space routing
-
n advanced laser via structures
-
n higher layer counts
-
n tighter warpage control
-
n lower-loss ABF materials
-
n and more sophisticated embedded routing architectures
Intel remains heavily dependent on advanced substrate vendors such as Ibiden, Shinko, and Unimicron for its next-generation AI packaging roadmap. And substrate makers’ capacity and technology progress will be key checking points whether EMIB-T is ready to pick up in big scale in next one year or two.
Dual Packaging challenge
We see a growing possibility that AI chipmakers may try to diversify their sources and try Intel’s EMIB-T technology, and while the compute logic of an AI die may remain identical, the packaging interface often cannot use the same CoWoS design.
The first challenge lies in bump architecture and pad layout . A die originally optimized for CoWoS-L may place its HBM PHYs, die-edge interfaces, micro bump arrays, and power pads according to the routing assumptions of TSMC’s silicon interconnect architecture. EMIB-T, however, may require different bridge landing zones, alternative bump pitch optimization, and distinct signal escape topologies.
Another key consideration would be power delivery integrity . As AI accelerators move toward multi-kilowatt rack-scale systems, package-level power distribution becomes a limiting factor. CoWoS-L and EMIB-T distribute current differently across the package hierarchy. EMIB-T often places heavier reliance on substrateside power routing, while CoWoS-L can leverage larger silicon routing regions to assist in power and signal balancing.
In addition, the signal integrity and HBM routing become increasingly difficult at higher bandwidth generations. HBM4 and future memory architecture require massive parallel interfaces operating at extremely high speeds. CoWoS-L’s largearea routing capability may offer advantages in scaling memory connectivity, while EMIB-T must carefully optimize bridge placement and substrate escape routing to achieve similar bandwidth efficiency.
Given the different design rules, we expect the ecosystem support across validation and reliability complexity rise dramatically when supporting two packaging ecosystems simultaneously. And we believe Mediatek’s TPU progress at EMIB-T will be an important indicator to watch out.
ABF Substrate technology readiness is key for EMIB-T takeoff
Compared to TSMC’s CoWoS approach, Intel’s EMIB-T may place even greater importance on substrate engineering because more routing and system integration responsibility shifts from the silicon interposer toward the package substrate itself. The ABF substrate is responsible not only for structural support, but also for ultrahigh-density redistribution routing, power delivery integrity, signal integrity management, thermal stability, and integration of embedded bridge structures. It must accommodate extremely fine-line routing, precise bridge embedding, ultralow-loss high-speed signaling, and increasingly complex power distribution networks supporting AI accelerators consuming well above 1,000W package-level
Figure 4. Comparison of Intel’s EMIB-T and 15MC’s Cowos/sole
Intel EMIB-T
Modular bridge-based architecture using embedded silicon bridges within
substrate
Reduce cost and improve scalability of very large Al packages while
TSMC CoWoS / SolC
Large silicon interposer-centric architecture with highly integrated
routing
Maximize routing density and power. This significantly raises substrate complexity compared with traditional server CPUs. Full or partial silicon interposer
Lower bridge design
Suppliers capable of advanced ABF substrate manufacturing, fine-line build-up films, precision drilling, embedded bridge integration, and low-warpage control therefore become strategically important in the EMIB-T supply chain. In practice, this means substrate technology is no longer a secondary consideration; it is becoming one of the primary enablers determining whether next-generation AI racks can scale bandwidth, power, and thermal performance economically. In our view, the ABF substrate ecosystem’s readiness for EMIB-T is also an important check point for EMIB-T’s penetration in next 2-3 years.
Philosophy
Main Objective
Interconnect Method
Packaging Scalability
Dependence on Large Silicon
Interposer
Reticle Limit Exposure
Figure 4. Comparison of Intel’s EMIB-T and TSMC’s CoWoS/SoIC
Al Customer Adoption
Thermal Challenges
Cost Structure Potential
Key Competitive Advantage
Key Commercial Risk
@ 2026 Citiornun Ine No redistribution without Citioroun’s written nermission production learning
| Limited but strategically important | Dominant in Al GPU and ASIC |
|---|---|
| ecosystem Complex due to modular bridge distribution and high package power | Complex due to very large integrated package footprint Higher silicon interposer cost but highly |
| Potentially lower at very large package sizes Advanced modular chiplet flexibility | optimized production flow Proven manufacturing scale, reliability, |
| with strong packaging integration Ecosystem readiness and production | and ecosystem trust Capacity constraints and rising |
| consistency | manufacturing complexity |
© 2026 Citigroup Inc. No redistribution without Citigroup’s written permission. Source: Citi Research
Figure o. IsMe - Forward F/E band
NT$
2500
2000
1500
1000 -
500 -
0 +
-
TSMC
-
11.4x
-
13.3x -
— 15.2x
17.1x
C 2026 Citioroun Inc. No redistribution without Citigroun’s written nermission.
Figure 1. 15MC - Forward P/D band & KUE
NT$
2500
2000
1500
1000
Reiterate Buy with TP NT$2,875
500
We remain positive over TSMC’s growth outlook as we are looking for a strong +30% sales CAGR in the next three years, supported by secular AI demand growth and its technology leadership in advanced node and packaging. We reiterate Buy and our target price for TSMC is at NT$2,875 based on 25x the average of our 2026-27E EPS, slightly higher than its 3-year average, which we believe is justified by TSMC’s leading and robust AI demand growth outlook. Our target price equates to 2026E/27E P/E of 29x/22x and 2026E/27E P/B of 10x/8x.
Figure 5. TSMC - Citi Estimates vs Consensus
| 2026E | 2026E | 2026E | 2027E | 2027E | 2027E | 2028E | 2028E | 2028E | |
|---|---|---|---|---|---|---|---|---|---|
| (NT$mn) | Citi | Cons. | Diff. | Citi | Cons. | Diff. | Citi | Cons. | Diff. |
| Sales | 5,253,452 | 5,191,110 | 1.2% | 7,071,349 | 6,558,133 | 7.8% | 8,762,189 | 7,898,797 | 10.9% |
| Gross profit | 3,442,282 | 3,406,874 | 1.0% | 4,566,254 | 4,261,672 | 7.1% | 5,686,467 | 5,067,631 | 12.2% |
| Operating profit | 2,984,907 | 2,972,041 | 0.4% | 3,946,713 | 3,718,829 | 6.1% | 4,918,205 | 4,383,234 | 12.2% |
| Net income | 2,563,456 | 2,542,290 | 0.8% | 3,410,850 | 3,177,832 | 7.3% | 4,263,281 | 3,824,660 | 11.5% |
| EPS(NT$) | 98.85 | 97.97 | 0.9% | 131.52 | 122.62 | 7.3% | 164.39 | 146.83 | 12.0% |
| Gross margin | 65.5% | 65.6% | -0.1 ppt | 64.6% | 65.0% | -0.4 ppt | 64.9% | 64.2% | +0.7 ppt |
| Operating margin | 56.8% | 57.3% | -0.4 ppt | 55.8% | 56.7% | -0.9 ppt | 56.1% | 55.5% | +0.6 ppt |
| Net margin | 48.8% | 49.0% | -0.2 ppt | 48.2% | 48.5% | -0.2 ppt | 48.7% | 48.4% | +0.2 ppt |
© 2026 Citigroup Inc. No redistribution without Citigroup’s written permission.
Source: Citi Research, Bloomberg
Figure 6. TSMC - Forward P/E band
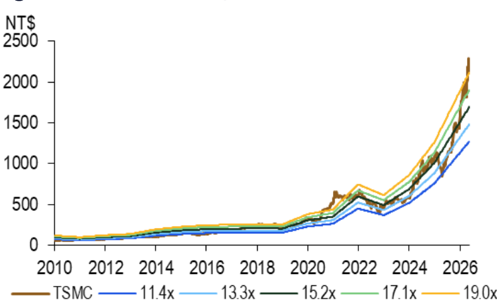
© 2026 Citigroup Inc. No redistribution without Citigroup’s written permission.
Source: Citi Research, company data
ROE
45%
35%
30%
25%
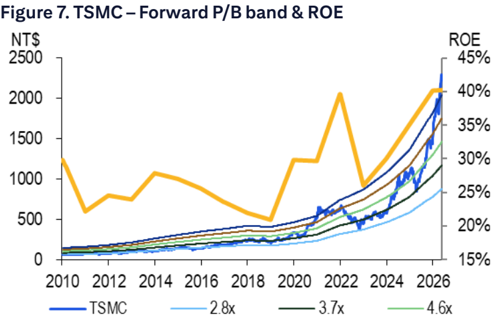
© 2026 Citigroup Inc. No redistribution without Citigroup’s written permission.
Source: Citi Research, company data
Figure s. 15MC - Forecast Summary
2025
2Q
933.8
-386.4
-84.5
547.4
-23.2
-61.3
Unit: NT$bn
Revenue
COGS
Gross Profit
Operating Expense
SG&A expenses
R&D expenses
EBIT
-345.9
-85.2
493.4
-28.6
-56.5
4Q
1,046.1
-394.1
652.0
-88.2
-23.3
-64.9
407.1
463.4
3Q
989.9
-401.4
588.5
-24.0
-87.8
-63.7
500.7
564.9
Figure 8. TSMC - Forecast Summary
Pre Tax Profit
493.0
430.9
Tax Expense/(Credit)
Net Profit
EPS (NT$)
Margins (%)
Gross Margin
Operating Margin
Net Margin
Sequential Growth (%)
Revenue
Gross Profit
EBIT
Net Profit
EPS
© 2026 Citigroun Inc. No redistribution without Citigroun’s written permission.
2025
3,809.1
-1,527.8
2,281.3
-345.2
-99.2
-246.4
1,936.1
86.2
19.4
2,041.7
2026E
5,253.5
-1,811.2
3,442.3
-457.4
-135.7
-323.4
2,984.9
99.9
27.2
3,112.0
2027E
7,071.3
-2,505.1
4,566.3
-619.5
-182.6
-436.9
3,946.7
160.2
37.4
4,144.3
-3,075.7
5,686.5
-768.3
-226.4
-541.8
4,918.2
215.1
45.8
5,179.1
4QE
1,518.0
-539.6
978.5
-129.0
-38.0
-91.1
849.4
27.9
8.1
885.4
1QE
1,681.4
-587.5
1,093.8
-139.8
-38.9
-100.9
954.0
34.5
8.9
997.5
2027
2QE
1,768.2
-623.0
1,145.2
-155.6
-49.5
-106.1
989.6
9.3
3QE
1,818.1
-639.0
1,179.0
-161.8
-49.1
-112.7
1,017.2
41.6
9.6
1,068.4
4QE
1,803.7
-655.6
1,148.1
-162.3
-45.1
-117.2
985.8
45.6
9.5
1,040.9
1Q
1,134.1
-382.8
751.3
-94.0
-26.2
-67.8
659.0
23.8
5.1
687.8
2026
2QE
1,239.6
-412.0
827.6
- 111.6
-34.7
-76.9
716.0
22.9
6.7
745.7
3QE
1,361.7
-476.7
884.9
-124.4
-36.8
-87.7
760.5
25.3
7.3
793.0
| 70.2 95.5 | 86.9 115.0 149.1 | 86.9 115.0 149.1 | 86.9 115.0 149.1 | 86.9 115.0 149.1 | 150.5 169.6 | 150.5 169.6 | 150.5 169.6 | 150.5 169.6 | 181.6 177.0 -326.3 -549.5 -735.7 | 181.6 177.0 -326.3 -549.5 -735.7 | 181.6 177.0 -326.3 -549.5 -735.7 | 181.6 177.0 -326.3 -549.5 -735.7 | ||||
|---|---|---|---|---|---|---|---|---|---|---|---|---|---|---|---|---|
| 361.6 | 73.6 452.3 | 505.7 | 572.5 | 596.9 | 134.8 658.7 | 735.4 | 828.4 | 830.5 | 887.4 | 864.5 | 1,717.9 | 2,563.5 | 3,410.8 | -918.6 4,263.3 | ||
| 13.94 | 398.3 15.36 17.44 | 19.50 | 22.08 | 23.02 | 25.40 | 28.36 | 31.95 | 32.02 | 34.22 | 33.34 | 66.24 | 98.85 | 131.52 | 164.39 | ||
| 58.6 59.5 | 62.3 | 66.2 | 66.8 | 65.0 | 64.5 | 65.1 | 64.8 | 64.9 | 63.7 | 59.9 | 65.5 | 64.6 | 64.9 | |||
| 58.8 48.5 | 50.6 | 54.0 | 58.1 | 57.8 | 55.8 | 56.0 | 56.7 | 56.0 | 56.0 | 54.7 | 50.8 | 56.8 | 55.8 | 56.1 | ||
| 43.1 | 49.6 42.7 45.7 | 48.3 | 50.5 | 48.2 | 48.4 | 48.4 | 49.3 | 47.0 | 48.8 | 47.9 | 45.1 | 48.8 | 48.2 | 48.7 | ||
| -3 | 11 6 | 9 10 | 11 | 11 | 5 | 3 | -1 | 32 | 38 | 35 | 24 | |||||
| -4 | 11 8 | 11 | 15 | 10 | 11 | 12 | 5 | 3 -3 | 40 | 51 | 33 | 25 | ||||
| -4 | 14 8 | 13 | 17 | 9 | 12 | 12 | 4 | 3 -3 | 46 | 54 | 32 | 25 | ||||
| -4 | 10 14 | 12 | 13 | 10 12 | 13 | 7 | -3 | 46 | 49 | 33 | 25 | |||||
| -4 | 10 14 | 12 | 13 | 4 | 10 12 | 13 | 7 | -3 | 46 | 49 | 33 | 25 |
© 2026 Citigroup Inc. No redistribution without Citigroup’s written permission.
Source: Citi Research, company data
525.4
592.4
TSMC
Company description
TSMC is the founder and leader of the dedicated IC foundry segment. The company has built its reputation by offering advanced and “more-thanMoore” wafer production processes and unparalleled manufacturing efficiency. From its inception in 1987, TSMC has consistently offered the foundry segment’s leading technologies and TSMC-compatible design services.
Investment strategy
We rate TSMC shares as Buy. We expect TSMC to deliver sales growth of >30% in recent years thanks to strong growth from HPC/AI as well as stable demand growth from smartphone, IoT, and automotive on tech migration and a shortened replacment cycle. CPU outsourcing to TSMC offers further growth upside potential. A rising cash dividend should also support the share price. While TSMC has been increasing capex meaningfully since 2009, its cost structure is maintained through continuous product mix improvements, efficiency enhancements, and cost reductions.
Valuation
Our target price for TSMC shares of NT$2,875 is based on 25x the average of our 2026-27E EPS, higher than its three-year average forward PER, versus global peers’ average of 15-23x. We believe our PER target is justified by TSMC’s leading position in advanced process node and robust AI demand growth outlook. Given its continuing leadership in the semiconductor foundry industry, we believe TSMC’s stable order visibility and earnings outlook make it less vulnerable than peers to a potential global economic downturn. Our target price equates to 2026E/27E P/E of 29x/22x and 2026E/27E P/B of 10x/8x.
Risks
Key downside risks that could impede the shares from achieving our target price include: 1) weakness in the global semiconductor market; 2) largerthan-expected margin contractions due to depreciation cost hikes and strong NTD; 3) competitors entering the foundry business; 4) longer-than-expected digestion of inventory in the supply chain; and 5) a slowdown in demand either from a global economic downturn or a global trade disruption triggered by tariffs.
Intel Corp
(INTC.O; US$120.61; 1; 12 May 26; 16:00)
Company description
Intel is a semiconductor company that specializes in microprocessors and is the #1 supplier of microprocessors for desktop PCs, notebook PCs, and
servers with approximately 60% total market share. Intel also has a foundry business. Based in Santa Clara, CA, Intel has roughly 83,200 employees worldwide. Intel derives approximately 90% of its total revenue and 90% of total profits from the PC and Datacenter segments. Intel is a vertically integrated device manufacturer (IDM) with front-end wafer fabrication facilities in Oregon, Arizona, New Mexico, China, Ireland, and Israel and backend assembly and test operations in Malaysia, China, Costa Rica, and Vietnam.
Investment strategy
We are Buy rated on Intel shares given the AI-driven CPU cycle and we’re more positive on Intel foundry given better execution by Intel managment.
Valuation
We value INTC based on our SOTP valuation, our price target is $95. We apply a SOTP valuation framework to each of Intel’s reportable segments and to highlight our growth expectations for Intel Foundry.
Risks
PC end-market: Intel derives roughly 90% of sales from the PC and server segments, which are highly dependent on IT spending. Therefore, any major uptick/downtick in IT spending could result in upside/downside to our estimates and cause us to reassess our rating on INTC.
M&A: If Intel engages in a substantial accretive acquisition, it could result in upside to our estimates.
Competition: Intel competes directly with AMD in the microprocessor market. Consequently, any fluctuations in market share between Intel and AMD could result in risk to our estimates.
Customer risk: Intel’s largest PC OEM customers collectively represent roughly 45% Intel’s revenue. As a result, any major declines in orders from PC OEMs could have a negative effect on our estimates for Intel.
Macroeconomic: Intel’s geographic exposure spans multiple geographies including the U.S., Europe, and Asia. As a result, any prolonged macroeconomic downturn/upturn could result in downside/upside to our estimates and rating.
If the impact from the above risks turns out to be greater/less than we anticipate, the shares could fail to achieve or could exceed our target price.
If you are visually impaired and would like to speak to a Citi representative regarding the details of the graphics in this document, please call USA 1-888-500-5008 (TTY: 711), from outside the US +1-210-677-3788