PDF 原檔:Aletheia-TSMC 0615__original.pdf
原始內容

Price: TWD2,310/$426.80
Target Price: TWD3,500 / $700
Upside: 52%/64%
Total return: 55% 67%

Stefan Chang
+852 9250 7088 stefan.chang@aletheia-capital.com
Warren Lau
+852 9181 4766
warren.lau@aletheia-capital.com
TSMC
Local ticker
ADR ticker
Market cap (USD|tn)
Average daily T/O (USD|bn)
2330 TT
TSM US
1.9/2.2
2.8/5.1
Field Trip Takeaways: Still in Overdrive
After our recent field trip to all TSMC's new fabs in Taiwan, we now believe TSMC's new advanced nodes capacity expansion will be 70kwpm, 150kwpm, and 170kwpm in 2026/27/28E. This suggests TSMC's WFE can potentially double YoY in 2027E, while 2028E will see double digit growth. As for the back-end, we believe TSMC will focus more on CoWoS in the next 12 months, while SolC and CoPoS will be more of a 2H27E/2028E story. Should TSMC be able to fill up all new capacity, its revenue and earnings growth should accelerate in 2028E following a 30%+ CAGR in 2024-2027E, which the market has currently underestimated. For the near-term, TSMC is likely to top its 2Q26E revenue guidance and beat on margins. We reiterate BUY for TSMC and raise our TP to TWD3,500/$700 for the local shares and the ADR, based on 20x/25x average 2027/28E P/E.
Wafer capacity to double YoY in 2027E despite slower F18P10 ramp
We now expect TSMC's year-end advanced front-end capacity to increase by 70/150/170kwpm by end-2026/27/28E. This is adjusted from our prior 70/180/170kwpm forecast because we now believe its Fab18 P10 will not be ready for end-2027E tool installation, and P11/12 could also be slower than we have anticipated. On the other hand, we noted robust construction progress for Fab 20 (N2/A16/A14 in Hsinchu), Fab22 (N2/A16 in Kaohsiung) and Fab25 (A14 in Taichung).
CoWoS up, SolC down
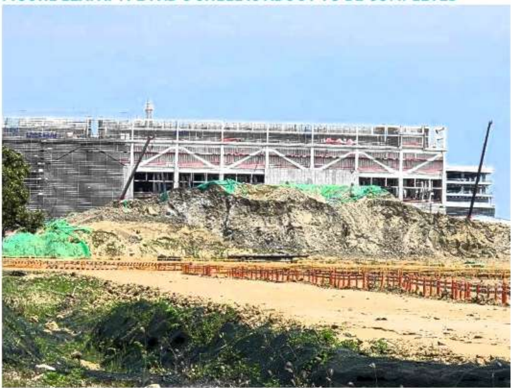
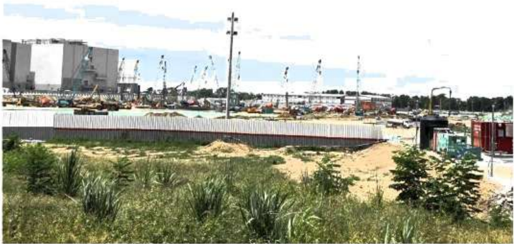
We believe TSMC has decided to prioritize its CoWoS capacity expansion over SolC, and the new driver is CPU demand (NVDA and AMD). This includes a further capacity expansion in its AP8 and prioritizing its AP7P2 for CoWoS. This will result in year-end capacity for CoWoS to be 120kwpm/180kwpm by end-2026/27E from 120kwpm/160kwpm previously; annual output could reach 2.1m/2.2m in 2027/28E accordingly. On the other hand, SolC capacity expansion will take a pause in 1H27E after reaching 20kwpm by end-2026E. The slower ramp of CPO and AVGO's 3.5D ASICs demand gives TSMC flexibility to make such a change in plan. However, we believe TSMC will still expand its SolC in 2H27E in the remaining area of its AP7P2, followed by AP7P3 in 1H27E, which is just about ground-breaking now, ahead of NVDA's Feynman HVM in mid-2027E. Lastly, CoPoS may stay at only pilot run capacity of 3kwpm before 2H28E when TSMC's AP7P4 is ready.
What has the market modelled incorrectly?
In the near-term, we expect TSMC to beat its 2Q26E GM guidance again; the strength should continue into 2H26E. For longer-term, we believe TSMC's revenue and earnings growth will accelerate in 2028E judging from its capacity expansion plan, which differs from the current Bloomberg consensus of a deceleration for the outer years. This puts the stock at a P/E of just 15x/11x in 2027/28E, against 30-40% revenue/earnings CAGR and 40%+ ROE.
KEY FINANCIAL AND VALUATION METRICS
Source: TSMC, Bloomberg, Aletheia Capital/TAG
| FYE 31 Dec | FY22A | FY23A | FY24A | FY25A | FY26E | 2027E | 2028E |
|---|---|---|---|---|---|---|---|
| Revenue (USD bn) | 76.9 | 69.3 | 90.1 | 122.4 | 166.6 | 222.1 | 320.2 |
| Revenue (TWD bn) | 2,264 | 2,162 | 2,894 | 3,809 | 5,252 | 6,996 | 10,087 |
| EPS - ADR (USD) | 6.67 | 5.19 | 7.05 | 10.61 | 17.16 | 23.23 | 33.43 |
| EPS - Local (TWD) | 39.2 | 32.3 | 45.2 | 66.2 | 108.2 | 146.4 | 210.6 |
| Consensus EPS (TWD) | 98.4 | 123.3 | 148.7 | ||||
| PER - Local (X) | 58.9 | 71.4 | 51.1 | 34.9 | 21.4 | 15.8 | 11.0 |
| PER - ADR (X) | 63.6 | 81.7 | 60.1 | 39.9 | 24.7 | 18.2 | 12.7 |
| PBR (X) | 20.3 | 17.3 | 14.0 | 11.1 | 7.9 | 5.8 | 4.2 |
| EV/EBITDA (X) | 38.0 | 40.7 | 29.4 | 22.0 | 14.6 | 10.4 | 7.1 |
| Dividend Yield (%) | 0.5 | 0.5 | 0.6 | 0.8 | 1.1 | 1.8 | 2.3 |
| FCF yield (%) | 0.9 | 0.5 | 1.5 | 1.7 | 2.8 | 3.5 | 5.3 |
| ROE (%) | 39.8 | 26.2 | 30.3 | 35.4 | 43.0 | 42.3 | 44.2 |
Capacity expansion update
Front-end wafer capacity
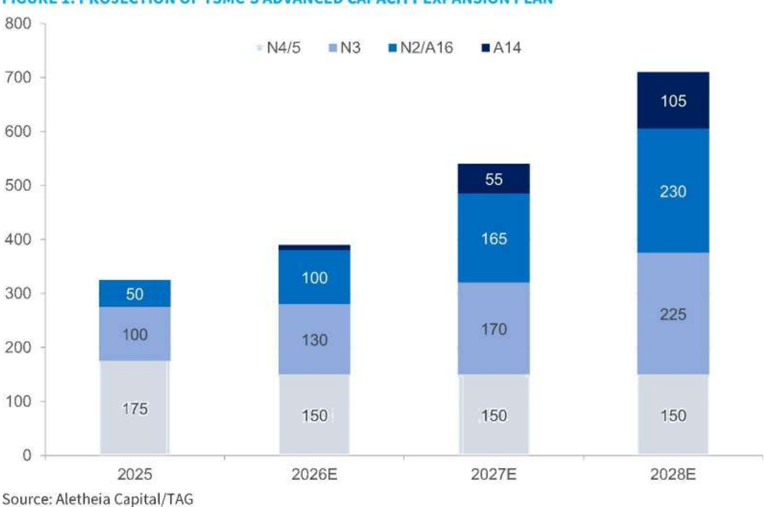
The key change in our forecast after this field tour is that we now assume Fab 18 P10-12 (Tainan) HVM progress will be 6-9 months slower than our previous aggressive forecast, which will lead to around 30kwpm loss in end-2027 capacity compared to our previous forecast, evenly split between N3 and A16. Capacity for N3 and N2/A16 by year-end 2027/28E will therefore become 170kwpm/165kwpm and 225kwpm/230kwpm, respectively. 2027E N3 capacity increase will mainly come from Fab18 P9 and Fab23 P2 (Kumamoto), and the incremental capacity increase will be only 40kwpm in 2027E. Considering the continuous strong N3 demand from GPU/ASICs (Rubin Ultra and TPU8i/8t will all continue into 2028E) and CPUs (all ARM-based CPUs are still in N3 into 2028E and only AMD's is using N2 for compute tiles for Venice/Verano/Florence), one should not be surprised if N3 tightness will continue into 2028E.
Despite the lower figures vs our original forecast, TSMC's year-end capacity increase for advance nodes (<N5) will still reach 150kwpm in 2027E, more than double the 75kwpm/70kwpm in 2025/26E (Figure 2). Incremental capacity will continue to grow into 2028E, by our estimates. If TSMC can deliver all capacity expansion and is able to fill up all new capacity, TSMC's WFE spending will still grow by double digit in 2028E following a doubling in 2027E, based on our estimates. Its 2028E revenue growth should also accelerate. We will have a more detailed discussion about numbers at a later stage.
We will go through the current construction progress for each site from the next page.
FIGURE 1: PROJECTION OF TSMC'S ADVANCED CAPACITY EXPANSION PLAN
Source: Aletheia Capital/TAG
TSMC
Field Trip Takeaways: Still in Overdrive
FIGURE 2: PROJECTION OF TSMC'S ADVANCED CAPACITY EXPANSION PLAN IN TERMS OF PHASES
Note: Capacity figure is expressed in '000 pm. Source: Aletheia Capital/TAG
F18 (Tainan): P9 on schedule, P10/11/12 only by 2028E and onwards
We have anticipated tool installation for Fab18 P9 in 1H27E and P10 in 2H27E, followed by P11 and potentially P12 in 2028E. P9 will be dedicated for N3 while P10/11/12 are for both N3 and A16. P9 is on schedule for tool installation in 1H27, but we noted P10-12 are still far from ready. Figure 4 shows P10-12 are not even close to ground-breaking. Considering a normal 2year construction period (the first year for ground-breaking and shell construction and the second year for facilities and tool installation), we now believe P10 will only be ready for tool installation by mid-2028E (6-9 months later than our previous aggressive expectation), followed by P11/12 which are most likely to be ready by end-2028E or sometime in 2029E.
TSMC
Field Trip Takeaways: Still in Overdrive
FIGURE 3: TSMC'S FAB CAMPUS IN TAINAN (SOUTHERN PART OF TAIWAN)
Source: Google Map, Aletheia Capital/TAG
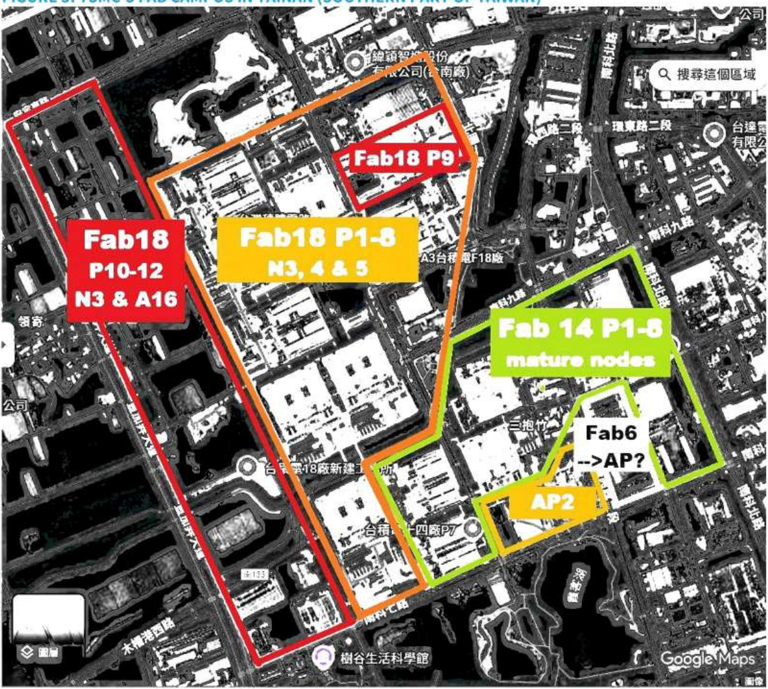
FIGURE 4: F18 P10-12 ARE NOT GROUND BREAKING VET
Source: Aletheia Capital/TAG

Fab22 (Kaohsiung): Construction on schedule
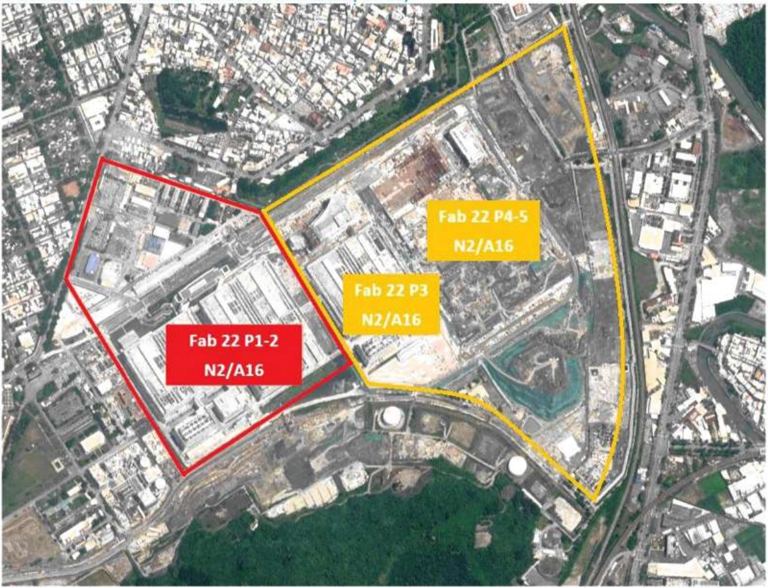
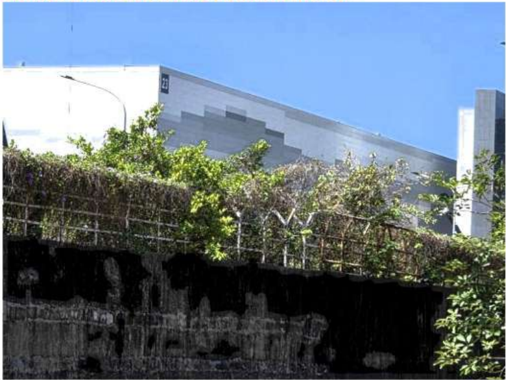
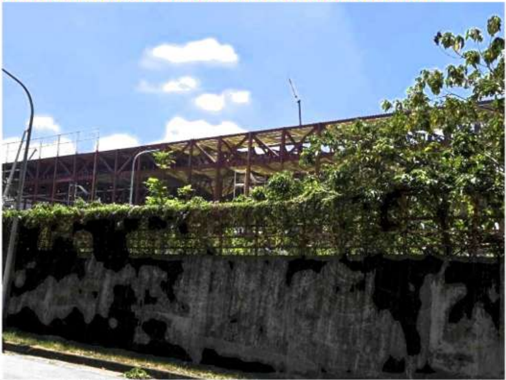
Figures 5 and 6 are photos of TSMC's Fab 22 in Kaohsiung, dedicating for N2 and A16. Should we identify the fab site correctly, satellite photo from Google Map suggests P2 is already done and ready for MP this year. P3 fab construction looks already completed from satellite photo though the office building is still under construction, while our onsite photo suggests the structure of P4 seems about finished. P3 and P4 look ready for tool installation and MP in 2027E.
FIGURE 5: TSMC'S FAB CAMPUS IN KAOHSIUNG (FAB22)
Source: Google Map, Aletheia Capital/TAG
FIGURE 6A: FAB22 P2 - READY FOR HVM IN 2026
Source: Aletheia Capital/TAG
FIGURE 6B: FAB22 P4 - IN CONSTRUCTION FOR HVM IN 2027
Source: Aletheia Capital/TAG
Fab25* (Taichung) & Fab20 (Hsinchu):Moving fast
Compared with our first-ever photo for Fab25* that still showed the original golf course (lefthand side of Figure 7), the latest Google map satellite view shows it has been fully re-shaped and is ready for fab construction. Our on-site photo (Figure 8) shows the construction has started, and the first-wave of buildings are half-way done. We believe Fab25 P1 still has a good chance to be ready for A14 pilot line installation before end-2027E as we have forecasted.
FIGURE 7: TSMC'S FAB CAMPUS IN TAICHUNG (CENTRAL TAIWAN) AND THE CONCTRUCTION PROGRESS COMPARISON (2025 VS NOW)
Note: * The naming of Fab25 is not official. Source: Google Map, Aletheia Capital/TAG
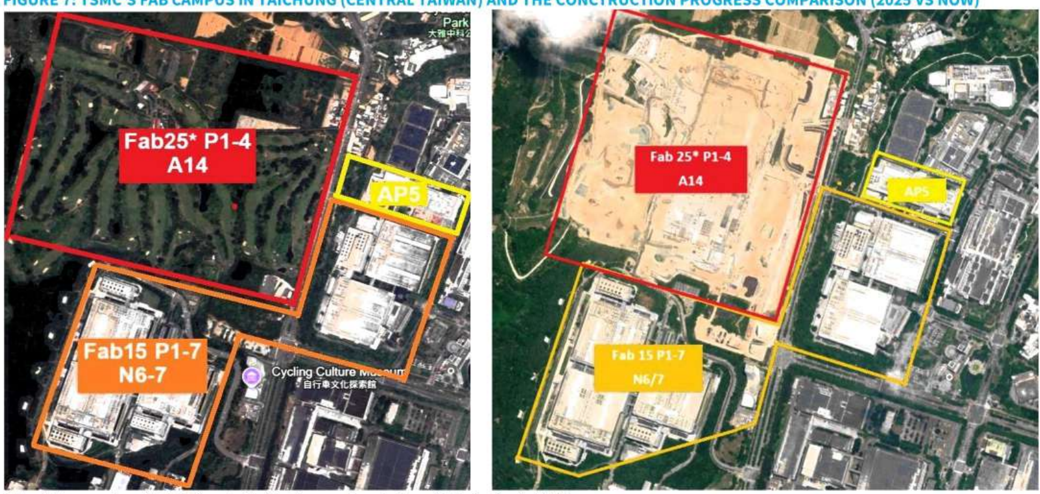
FIGURE 8: FAB25* CURRENT CONSTRUCTION PROGRESS
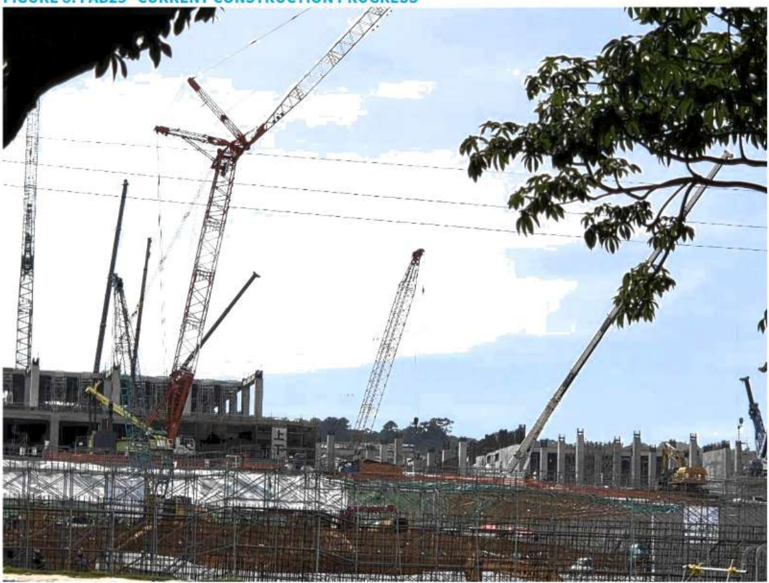
Note: * The naming of Fab25 is not official. Source: Aletheia Capital/TAG
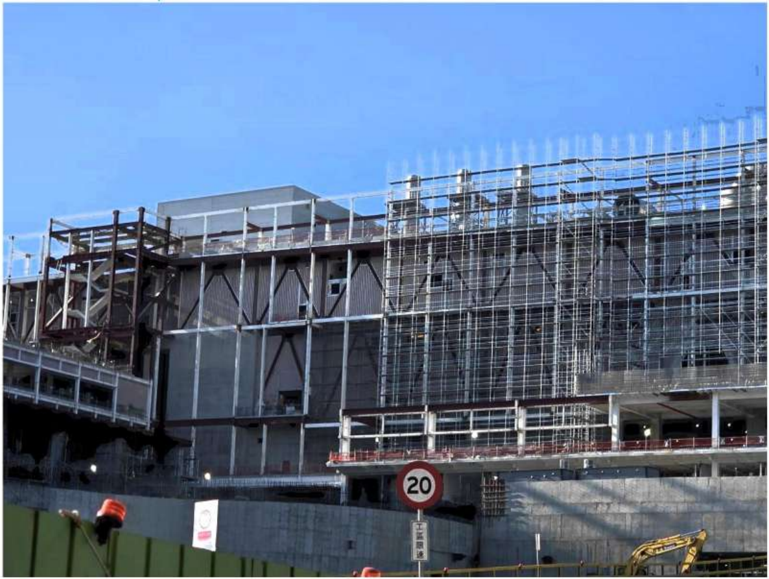
As for Fab20 in Hsinchu, its F20 P1/2 are both ready for N2 HVM in this year, similar to Fab22 P1/2 in Kaohsiung. Construction for its P3, which we believe will be used for A14 pilot, looks to us to be slightly ahead of Fab25 in Taichung. Figure 10 shows the fab shell has been completed, and it is in the progress of internal infrastructure such as cleanroom, etc. This P3 should be ready for A14 pilot sometime in 2027E and is ahead of Fab25 in Taichung, in our view.
FIGURE 9: TSMC'S FAB CAMPUS IN HSInCHU
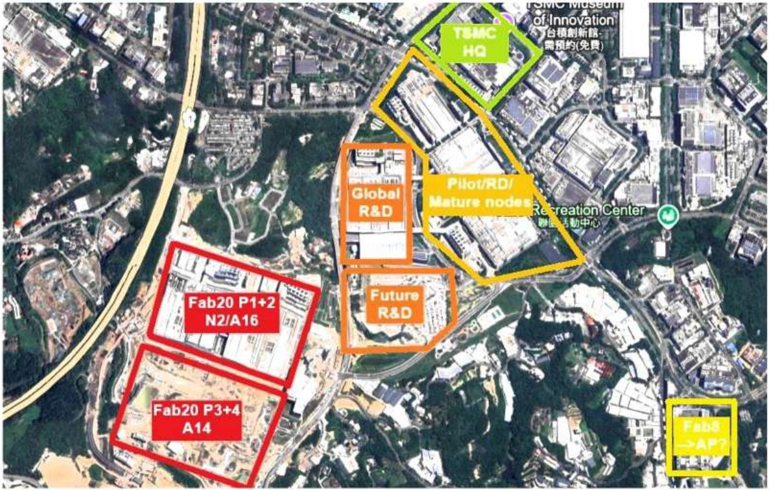
Source: Google Map, Aletheia Capital/TAG
FIGURE 10: FAB22 P3/4: LOOKS THE FASTEST AMONG ALL IN-CONSTRUCTION NEW FABS
Source: Aletheia Capital/TAG
Field Trip Takeaways: Still in Overdrive
Back-end wafer capacity
Since our last update on April 10, we believe TSMC has become increasingly more aggressive on CoWoS expansion, while at the same time SolC (3D packaging) capacity build-up could be slower than what we have anticipated.
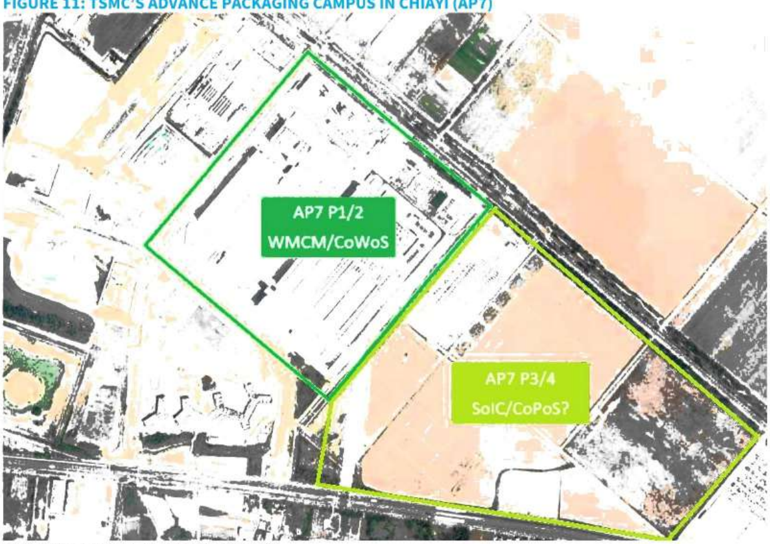
We believe TSMC will expand its AP8 to 80kwpm before end-2027E vs our previous expectation of 60kwpm. At the same time, TSMC should keep its AP7P2 plan to support both CoWoS and SolC (CoWoS installation will have the priority). Rising CPU demand for CoWos (AMD and NVDA) is the key reason for TSMC to be more aggressive, in our view. With such adjustment, we now expect TSMC to have 120kwpm/180kwpm/180kwpm CoWoS capacity by end-2026/27/28E. Its annual available output for CoWoS will therefore reach 2,070k and 2,160k in 2027/28E, nearly 2x our estimated 1,155k in 2026E. Beyond 2027E, we also believe TSMC will switch its 2.5D packaging from CoWoS to CoPoS in 2028E to accommodate largersized XPUs.
On the other hand, we expect TSMC's SolC capacity ramp up in 2027E to be slower than we have anticipated. TSMC is on schedule to squeeze its SolC capacity to 20kwpm in its existing facilities (mainly AP6) by end-2026E. However, SolC expansion in AP7P2 will be pushed out by at least 3-6 months because TSMC is prioritizing CoWoS. The reason is that SolC demand may not grow as fast as TSMC has anticipated. AVGO's TPUv9 and NVDA's CPO optical engine (OE) are the two new SolC demand in 2027E. The former may no longer exist, and the latter still has yield issues (mainly on PIC wafer). AMD will continue to be the only customer requiring SolC capacity in volume, and the existing capacity in AP6 is already sufficient.
Nonetheless, we believe TSMC still needs to expand its SolC capacity before mid-2028E. NVDA's Feynman GPU is expected to go HVM in mid-2028E. Not only does the Feynman GPU need SolC for its compute die, rising CPO adoption and LPU in 2028E may also need Solc TSMC's AP7P3 will only be ready for HVM in mid-2028E and not necessarily be on time for all these new devices. This may explain why TSMC still keeps some AP7P2 space for SolC despite its willingness to support more CoWoS. In summary, we now expect SolC capacity to be 20kwpm, 32kwpm, and 60kwpm ending-2026/27/28E, compared with our previous estimates of 20kwpm/40kwpm/80kwpm.
Source: Google Map, Aletheia Capital/TAG
TSMC
Field Trip Takeaways: Still in Overdrive
FIGURE 12A: AP7P2 FAB'S SHELL IS ABOUT TO BE COMPLETED
Source: Aletheia Capital/TAG
FIGURE 12B: AP7P3/4 STATUS - GROUND YET TO BREAK
Source: Aletheia Capital/TAG
FIGURE 13: TSMC's ADVANCED PACKAGING CAPACITY
| Year-end capacity (*000 wafers/month) | 2024 | 2025 | 2026E | 2027E | 2028E |
|---|---|---|---|---|---|
| CoWos | 35 | 70 | 120 | 180 | 180 |
| AP 1/2/3/5/6 | 35 | 60 | 80 | 80 | 80 |
| AP7 (P1/P2) | 20 | 20 | |||
| AP8 (P1/P2) | 10 | 40 | 80 | 80 | |
| CoPoS | 1 | 8 | 23 | ||
| AP7 (P4) & pilot | 1 | 23 | |||
| SolC | 8 | 10 | 20 | 32 | 60 |
| AP 1/2/3/5/6 | 8 | 10 | 20 | 20 | 20 |
| AP7 (P2/3) | 12 | 40 | |||
| InFO | 100 | 90 | 50 | 20 | |
| AP 1/2/3/5/6 | 100 | 90 | 50 | 20 | |
| WMCM | 10 | 75 | 125 | 145 | |
| AP 1/2/3/5/6 | 10 | 50 | 80 | 100 | |
| AP7 (P1) | 25 | 45 | 45 |
Source: Company, Aletheia Capital/TAG
FIGURE 14: SUMMARY OF TSMC'S BACKEND FABS
| Site name | Location Remarks | |
|---|---|---|
| AP1 | Hsinchu | Could merge with Fab3 (200mm) to support Fab20/25 |
| AP2 | Tainan | Could merge with Fab6 (200mm) to support Fab14&18 |
| APЗ | Longtan | WMCM & InFO for Apple's products |
| AP5 | Taichung | Support Fab25 |
| AP6 | Zhunan | SolC |
| AP7 | Chaiyi | New mega AP fab with six phases for CoW/PoS, SolC & WMCM |
| AP8 | Tainan | New AP fab with two phases for CoWos |
| APX | Hsinchu | Conversion of Fab2 (150mm) & 5 (200mm) for interposer fabrication |
| APX | Phoenix | Two AP fabs in the US |
Source: Company, Aletheia Capital/TAG
Financials
2Q26E/2026E revenue tracking the high-end, margins likely to beat
Accumulated April and May sales already reached 67% of TSMC's 2Q26E revenue guidance at the midpoint, and we do not see any reason for the run rate in June to slow down. 2Q26E revenue should therefore come in at the mid-to high-end of TSMC's revenue guidance. More importantly, we believe GM has room to beat the guidance of 65.5-67.5%, owing to the continuous strong hot-run demand (wafer production cycle time shorter-than normal, and TSMC charges higher prices for such orders). As a result, our 2Q26E EPS is 11% above the current Bloomberg consensus despite our revenue being broadly in line.
We expect the strong margins profile to continue into the rest of the year. Rising wafer shipment and continuous hot-run wafer demand will be positive factors for GM, which we expect to offset the negative impact from higher summer electricity cost and N2 depreciation. Similar to 2Q26E, our 2026E revenue of $167b (+36% YoY) is in line with the Bloomberg consensus while our EPS estimate of TWD108.2 (ADR: $17.2) is 12% above the Street.
Consensus not modelling 2028 correctly?
Our 2027E revenue/EPS continue to be 6%/19% above the Street, but what differentiate us the most from consensus is our 2028E estimates. We are modelling 2028E revenue and earnings growth to accelerate to 44% YoY vs 33-35% in 2027E. Our key assumption is that TSMC's capacity expansion will accelerate in 2027/28E. If this were proven correct, and should TSMC be able to fill up all new capacity, revenue growth should accelerate in 2028E. Tool installation usually takes about 2-3 months and the production cycle time for advance nodes need almost 4-5 months. Thus, any new capacity after 2Q27E will only contribute to TSMC's 2028E revenue. This is contrary to consensus's view that TSMC's growth will decelerate in the outer years. Our updated 2028E revenue of $320b and EPS of TWD211 (ADR: $33.4) are almost 2x from the 2026E level and 27%/42% higher than the current Bloomberg consensus.
FIGURE 15: ALETHEIA'S EARNINGS REVISION FOR TSMC
| 2Q26E | 2Q26E | 2Q26E | 3026E | 3026E | 3026E | 2026E | 2026E | 2026E | 2027E | 2027E | 2027E | 2028E | 2028E | 2028E | ||
|---|---|---|---|---|---|---|---|---|---|---|---|---|---|---|---|---|
| New | Prev Var (%) | Prev Var (%) | New | New | Prev Var (%) | New | Prev Var (%) | Prev Var (%) | New | Prev Var (%) | Prev Var (%) | New | Prev Var (%) | Prev Var (%) | ||
| Sales | TWDb | 1,251 | 1,227 | 2.0 | 1,381 | 1,365 | 1.2 | 5,252 | 5,189 | 1.2 | 6.996 | 6,829 | 2.4 | 10,087 | 9,643 | 4.6 |
| Gross profit | TWDb | 864 | 787 | 9.7 | 951 | 890 | 6.9 | 3,575 | 3.359 | 6.4 | 4,790 | 4,445 | 7.8 | 6,979 | 6,428 | 8.6 |
| OP profit | TWDb | 765 | 690 | 10.9 | 843 | 782 | 7.7 | 3,162 | 2,945 | 7.4 | 4,283 | 3,950 | 8.4 | 6,163 | 5,648 | 9.1 |
| Net profit | TWDb | 687 | 626 | 9.8 | 751 | 708 | 6.1 | 2,805- | 2,663 | 5.3 | 3,796 | 3,569 | 6.3 | 5,461 | 5,100 | 7.1 |
| EPS | TWD | 26.5 | 24.2 | 9.5 | 29.0 | 27.3 | 6.1 | 108.2 | 102.7 | 5.3 | 146.4 | 137.6 | 6.4 | 210.6 | 196.70 | 7.1 |
| Gross margin | % | 69.0 | 64.1 | 4.9 | 68.9 | 65.2 | 3.7 | 68.1 | 64.7 | 3.3 | 68.5 | 65.1 | 3.4 | 69.2 | 66.7 | 2.5 |
| OP margin | % | 61.1 | 56.2 | 4.9 | 61.0 | 57.3 | 3.7 | 60.2 | 56.8 | 3.4 | 61.2 | 57.8 | 3.4 | 61.1 | 58.6 | 2.5 |
| Net margin | % | 54.9 | 51.0 | 3.9 | 54.4 | 51.9 | 2.5 | 53.4 | 51.3 | 2.1 | 54.3 | 52.3 | 2.0 | 54.1 | 52.9 | 1.3 |
Source: Company, Aletheia Capital/TAG
FIGURE 16: ALETHEIA'S EARNINGS ESTIMATES FOR TSMC VS CONSENSUS
| 2Q26E | 2Q26E | 2Q26E | 3Q26E | 3Q26E | 3Q26E | 2026E | 2026E | 2026E | 2027E | 2027E | 2027E | 2028E | 2028E | 2028E | ||
|---|---|---|---|---|---|---|---|---|---|---|---|---|---|---|---|---|
| Aletheia | Street Var (%) Aletheia | Street Var (%) Aletheia | Street Var (%) Aletheia | Street Var (%) Aletheia | Street Var (%) | |||||||||||
| Sales | TWDb | 1,251 | 1,262 | (0.8) | 1,381 | 1,369 | 0.9 | 5,252 | 5,192 | 1.2 | 6,996 | 6,578 | 6.4 | 10,087 | 7,939 | 27.1 |
| Gross profit | TWDb | 864 | 843 | 2.4 | 951 | 895 | 6.2 | 3,575 | 3,410 | 4.8 | 4,790 | 4,282 | 11.9 | 6,979 | 5,123 | 36.2 |
| OP profit | TWDb | 765 | 737 | 3.8 | 843 | 779 | 8.2 | 3,162 | 2,976 | 6.3 | 4,283 | 3,739 | 14.6 | 6,163 | 4,439 | 38.8 |
| Net profit | TWDb | 687 | 616 | 11.5 | 751 | 671 | 11.9 | 2,805 | 2,545 | 10.2 | 3,796 | 3, 196 | 18.8 | 5,461 | 3,860 | 41.5 |
| EPS | TWD | 26.5 | 23.8 | 11.4 | 29.0 | 26.0 | 11.5 | 108.2 | 98.4 | 10.0 | 146.4 | 123.3 | 18.7 | 210.6 | 148.7 | 41.6 |
| Gross margins | % | 69.0 | 66.8 | 2.2 | 68.9 | 65.4 | 3.5 | 68.1 | 65.7 | 2.4 | 68.5 | 65.1 | 3.4 | 69.2 | 64.5 | 4.7 |
| OP margins | % | 61.1 | 58.4 | 2.7 | 61.0 | 56.9 | 4.1 | 60.2 | 57.3 | 2.9 | 61.2 | 56.8 | 4.4 | 61.1 | 55.9 | 5.2 |
| Net margins | %. | 54.9 | 48.8 | 6.1 | 54.4 | 49.0 | 5.4 | 53.4 | 49.0 | 4.4 | 54.3 | 48.6 | 5.7 | 54.1 | 48.6 | 5.5 |
Source: Bloomberg, Company, Aletheia Capital /TAG
TSMC Field Trip Takeaways: Still in Overdrive
2026-28E capex to $230b-240b
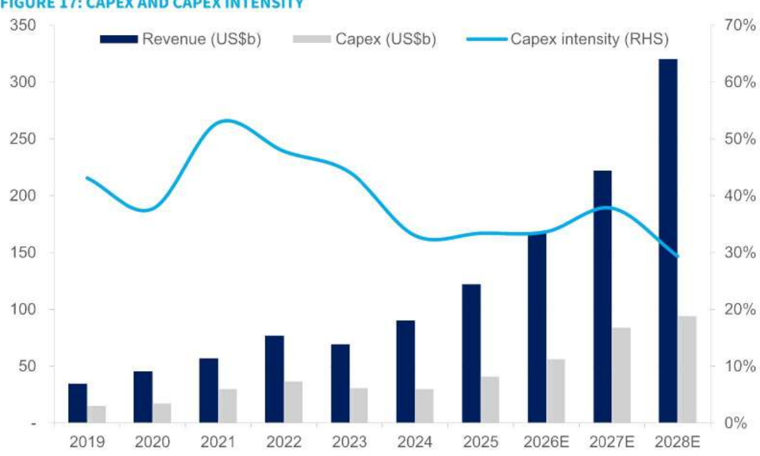
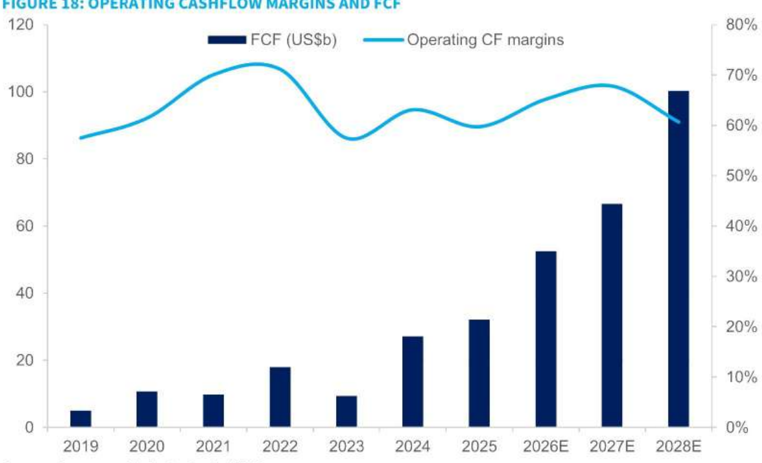
We are assuming TSMC will keep its 2026E cape in the $54-56b range, given its cleanroom space constraints. With the rapid new capacity expansion, we expect TSMC to grow its capex to $84b/94b in 2027/28E, and collective 2026-28E capex to reach $234b. This is based on 1) $350m WFE capex per every 1kwpm front-end capacity for N3/2/A16/A14; and 2) non-WFE capex to stay flat YoY in 2026-28E. This compares with $101b for 2023-25 capex combined. This also implies TSMC's WFE spending will be almost double YoY in 2027E to $50-55b and will continue to grow to $60-65b in 2028E. Thanks to its robust revenue growth, TSMC's capex intensity should stay in the range of 29-38% in 2026-28E (average 34%) compared with 3344% in the 2023-25-time frame (average 37%) or 38-53% during Covid (2022-24; average 46%). FCF will also continue to grow, suggesting higher dividend-paying potential.
FIGURE 17: CAPEX AND CAPEX INTENSITY
Source: Company, Aletheia Capital/TAG
FIGURE 18: OPERATING CASHFLOW MARGINS AND FCF
Source: Company, Aletheia Capital/TAG
TSMC
Field Trip Takeaways: Still in Overdrive
Earnings model
Source: Company, Aletheia Capital/TAG
| Key assumptions | 1Q25 | 2Q25 | 3Q25 | 4Q25 | 1Q26 2Q26E 3Q26E 4Q26E 1Q27E 2Q27E 3Q27E 4Q27E | 2025A | 2026E | 2027E | |||||||||
|---|---|---|---|---|---|---|---|---|---|---|---|---|---|---|---|---|---|
| Total capacity (*000) (300mm equl.) YoY | 4,199 6 | 4,290 6 | 4,370 4,452 5 | 6 | 4,469 6 | 4,520 5 | 4,550 | 4,647 4 | 4,649 | 4,850 7 | 4,925 8 | 5,127 10 | 17,310 6 | 18,185 5 | 19,550 8 | 21,435 10 | 21,435 10 |
| 300mm capacity (*000) | 3,399 | 3,489 | 3,569 | 3,644 | 3,669 | 3,719 | 3,749 | 3,839 | 3,834 | 4,019 | 4,079 | 4,236 | 14,101 | 14,976 | 16,169 | 17,746 | 17,746 |
| YoY | 8 | 7 | 6 | 8 | 7 | 4 | 8 | 9 | 10 | 7 | 6 | 8 | 10 | 10 | |||
| Utilisation (wafer shipment)# | 78 | 87 | 93 | 89 | 93 | 98 | 100 | 99 | 98 | 96 | 95 | 94 | 87 | 98 | 96 | 96 | 96 |
| Wafer shipments (*000) | 3,259 | 3,718 4,085 3,961 | 4,174 4,427 | 4,541 | 4,617 | 4,535 | 4,660 | 4,685 | 4,809 | 15,023 | 17,760 | 18,688 | 20,543 | 20,543 | |||
| YoY | 8 | 19 | 22 | 16 | 28 | 19 | 11 | 17 | 9 | 5 | 3 | 4 | 16 | 18 | 5 | 10 | 10 |
| Blended ASP (USD) | 6,663 | 6,890 7,047 | 7,344 7,342 7,639 | 8,212 | 8,618 | 8,858 | 9,329 | 9,696 | 9,936 | 6,979 | 7,970 | 9,463 | 11,708 | 11,708 | |||
| YoY | 21 | 17 | 18 | 10 | 11 | 17 | 17 | 21 | 22 | 18 | 15 | 15 | 14 | 19 | 24 | 24 | |
| Adv. packaging capacity | |||||||||||||||||
| CoWoS/CoPoS ('000) | 120 | 135 | 177 | 210 | 225 | 273 | 303 | 363 | 459 | 549 | 549 | 564 | 642 | 1,164 | 2,121 | 2,421 | 2,421 |
| SolC (*000) | 30 | 30 | 30 | 30 | 30 | 30 | 45 | 60 | 60 | 60 | 81 | 96 | 120 | 165 | 297 | 591 | 591 |
| InFO/WMCM ('000) | 300 | 300 | 300 | 300 | 321 | 369 | 357 | 375 | 375 | 390 | 413 | 435 | 1,200 | 1,422 | 1,613 | 1,740 | 1,740 |
| FX | |||||||||||||||||
| 32.9 | 31.1 | 29.9 | 31.0 | 31.6 31.5 | 31.5 | 31.5 | 31.5 | 31.5 | 31.5 | 31.5 | 31.2 | 31.5 | 31.5 | 31.5 | 31.5 | ||
| Mix analysis | 1Q25 | 2Q25 | 3Q25 | 4Q25 | 1Q26 | 2Q26E 3Q26E 4Q26E | 1Q27E 2Q27E 3Q27E | 4Q27E | 2025A | 2026E | 2027E | ||||||
| N2/A16 revenue | 0% | 0% | 0% | 1% | 6% | 9% | 16% | 18% | 19% | 21% | 23% | 25% | 0% | 13% | 22% | 26% | 26% |
| N3 revenue | 19% | 20% | 20% | 24% | 22% | 22% | 20% | 21% | 20% | 22% | 23% | 22% | 21% | 21% | 22% | 21% | 21% |
| N4/5 revenue | 31% | 31% | 33% | 30% | 31% | 29% | 26% | 24% | 22% | 19% | 17% | 16% | 31% | 27% | 18% | 12% | 12% |
| Adv. Packaging | 7% | 6% | 7% | 7% | 8% | 9% | 9% | 10% | 13% | 15% | 16% | 16% | 7% | 9% | 15% | 21% | 21% |
| Others (N7 and mainstream) | 44% | 42% | 40% | 38% | 34% | 31% | 28% | 26% | 25% | 23% | 22% | 21% | 41% | 29% | 23% | 19% | 19% |
| P&L model (TWD, bn) | 1Q25 | 2025 | 3Q25 | 4Q25 | 1Q26 2Q26E 3Q26E 4Q26E | 1Q27E 2Q27E 3Q27E 4Q27E | 2025A | 2026E | 2027E | ||||||||
| Revenue (USD bn) | 25.5 | 30.1 | 33.1 | 33.7 | 35.9 | 39.7 | 43.8 | 47.2 | 49.4 | 54.4 | 57.6 | 60.6 | 122.4 | 166.6 | 222.1 | 320.2 | 320.2 |
| Revenue (TWD bn) | 839 | 934 | 990 | 1,046 | 1,134 | 1,251 | 1,381 | 1,486 | 1,556 | 1,715 | 1,815 | 1,910 | 3,809 | 5,252 | 6,996 | 10,087 | 10,087 |
| -Depreciation | -175 | -188 | -163 | -162 | -165 | -163 | -178 | -203 | -235 | -257 | -273 | -291 | -688 | -710 | -1,056 | -1,462 | -1,462 |
| -Other costs | -171 | -198 | -239 | -232 | -217 | -224 | -251 | -275 | -272 | -274 | -286 | -318 | -840 | -968 | -1,150 | -1,646 | -1,646 |
| Gross Profit | 493 | 547 | 589 | 652 | 751 | 864 | 951 | 1,009 | 1,049 | 1,184 | 1,255 | 1,302 | 2,281 | 3,575 | 4,790 | 6,979 | 6,979 |
| OPEX | -86 | -84 | -88 | -87 | -92 | -99 | -109 | -113 | -120 | -123 | -129 | -135 | -345 | -413 | -507 | -816 | -816 |
| OP Profit | 407 | 463 | 501 | 565 | 659 | 765 | 843 | 896 | 929 | 1,061 | 1,127 | 1,166 | 1,936 | 3,162 | 4,283 | 6,163 | 6,163 |
| Total Non-OP Profit | 24 | 30 | 25 | 27 | 29 | 31 | 34 | 36 | 38 | 42 | 45 | 47 | 106 | 130 | 172 | 248 | 248 |
| Pretax Profit | 431 | 493 | 525 | 592 | 688 | 796 | 876 | 932 | 968 | 1,103 | 1,171 | 1,213 | 2,042 | 3,292 | 4,455 | 6,410 | 6,410 |
| Net Profit | 362 | 398 | 452 | 506 | 572 | 687 | 751 | 794 | 805 | 953 | 1,004 | 1,033 | 1,718 | 2,805 | 3,796 | 5,461 | 5,461 |
| EPS (TWD) | 13.9 | 15.4 | 17.4 | 19.5 | 22.1 | 26.5 | 29.0 | 30.6 | 31.1 | 36.7 | 38.7 | 39.9 | 66.3 | 108.2 | 146.4 | 210.6 | 210.6 |
| EPS - ADR (USD) | 2.1 | 2.5 | 2.9 | 3.1 | 3.5 | 4.2 | 4.6 | 4.9 | 4.9 | 5.8 | 6.1 | 6.3 | 10.6 | 17.2 | 23.2 | 33.4 | 33.4 |
| Profit Margins (%) | 1Q25 | 2Q25 | 3Q25 | 4Q25 | 1Q26 | 2Q26E | 3Q26E | 4Q26E | 1Q27E | 2Q27E | 3Q27E | 4Q27E | 2025A | 2026E | 2027E | ||
| Gross margin | 58.8 | 58.6 | 59.5 | 62.3 | 66.2 | 69.0 | 68.9 | 67.9 | 67.4 | 69.1 | 69.2 | 68.1 | 59.9 | 68.1 | 68.5 | 69.2 | 69.2 |
| OPN margin | 48.5 | 49.6 | 50.6 | 54.0 | 58.1 | 61.1 | 61.0 | 60.3 | 59.7 | 61.9 | 62.1 | 61.1 | 50.8 | 60.2 | 61.2 | 61.1 | 61.1 |
| Pre-tax margin | 51.3 | 52.8 | 53.1 | 56.6 | 60.6 | 63.6 | 63.5 | 62.7 | 62.2 | 64.3 | 64.5 | 63.5 | 53.6 | 62.7 | 63.7 | 63.6 | 63.6 |
| Net Margins | 43.1 | 42.7 | 45.7 | 48.3 | 50.5 | 54.9 | 54.4 | 53.4 | 51.8 | 55.6 | 55.3 | 54.1 | 45.1 | 53.4 | 54.3 | 54.1 | 54.1 |
| QoQ (%) | 1Q25 | 2Q25 | 3Q25 | 4Q25 | 1Q26 2026E 3Q26E 4026E 1027E 2027E 3027E 4027E | 2025A | 2026E | 2027E 2028E | |||||||||
| Revenue (USD) | -5 | 18 | 10 | 2 | 6 | 11 | 10 | 10 | |||||||||
| 11 | = | 15 | 6 | ||||||||||||||
| Gross Profit* | -4 -4 | 14 | 15 | 10 | 4 | 13 | |||||||||||
| OP Profit | 13 | 17 | 16 | 10 | 4 | 14 | 6 | ||||||||||
| Net Profit | -4 | 10 | 14 | 12 | 13 | 20 | 9 | 18 | 5 | ||||||||
| EPS (TWD) | -3 | 10 | 14 | 12 | 13 | 20 | 18 | 3 | |||||||||
| YoY (%) | 1Q25 | 2025 | 3Q25 | 4Q25 | 1Q26 2Q26E 3Q26E 4Q26E 1Q27E | 2Q27E 3Q27E 4Q27E | 2025A | 2026E | 2027E | 2027E | 2027E | ||||||
| Revenue (USD) | 35 | 44 | 41 | 25 | 41 | 32 | 32 | 40 | 38 | 37 | 31 | 29 | 36 | 36 | 33 | 2028E 44 | 2028E 44 |
| Revenue (TWD) | 42 | 39 | 30 | 20 | 35 | 34 | 40 | 42 | 37 | 37 | 31 | 29 | 32 | 38 | 33 | 44 | 44 |
| Gross Profit | 53 | 34 | 27 | 52 | 58 | 62 | 55 | 40 | 37 | 32 | 29 | 40 | 57 | 34 | 46 | 46 | |
| OP Profit | 63 | 62 | 39 | 33 | 62 | 65 | 68 | 59 | 41 | 39 | 34 | 30 | 46 | 63 | 35 | 44 | 44 |
| Net Profit | 60 | 61 | 39 | 35 | 58 | 73 | 66 | 57 | 41 | 39 | 34 | 30 | 46 | 63 | 35 | 44 | 44 |
| EPS (TWD) | 60 61 | 39 | 35 | 58 | 73 | 66 | 57 | 41 | 39 | 34 | 30 | 46 | 63 | 35 | 44 | 44 |
TSMC
Field Trip Takeaways: Still in Overdrive
Financial Statements
INCOME STATEMENT
Source: Company, Aletheia Capital /TAG
| FYE Dec (TWDb) | 2023 | 2024 | 2025 | 2026E 2027E | 2028E | FYE Dec (TWDb) | 2023 | 2024 | 2025 | 2026E 2027E 2028E | |||
|---|---|---|---|---|---|---|---|---|---|---|---|---|---|
| Revenue | 2,162 | 2,894 | 3,809 | 5,252 | 6,996 | 10,087 | Cash/ST investments | 1,688 | 2,422 | 3,069 | 4,172 | 5,180 | 6,937 |
| COGS | (987) (1,270) (1,528) (1,657) | (2,206) | (3,108) | Inventory | 202 | 272 | 282 | 465 | 598 | 901 | |||
| Gross profit | 1,175 | 1,624 | 2,281 | 3,595 | 4,790 | 6,979 | Receivable | 251 | 288 | 288 | 380 | 496 | 730 |
| Operating expense | (254) | (302) | (345) | (433) | (507) | (816) | Current assets | 2,194 | 3,088 | 3,817 | 5,225 | 6,481 | 8,776 |
| EBITDA | 1,444 | 1,976 | 2,616 | 5,339 | 7,625 | Fixed Assets | 3,064 | 3,235 | 3,692 | 4,817 | 6,386 | 7,861 | |
| Depreciation | (523) | (654) | (680) | (1,056) (1,462) | Intangible | 23 | 26 | 69 | 75 | 88 | 102 | ||
| Operating profit | 921 | 1,322 | 1,936 | 4,283 | 6,163 | Other LT assets | 251 | 342 | 355 | 377 | 388 | 404 | |
| Interest expense | 12 | 10 | 12 | 17 | 24 | LT assets | 3,338 | 3,604 | 4,116 | 5,269 | 6,861 | 8,366 | |
| Other income | 46 | 73 | 93 | 155 | 223 | Total assets | 5,532 | 6,692 | 7,933 | 10,494 13,342 | 17,143 | ||
| Profit before tax | 979 | 1,406 | 2,042 | 4,455 | 6,410 | ||||||||
| Tax | (141) | (233) | (326) | (657) | (946) | ST Debt | 60 | 137 | 156 | 156 | 156 | ||
| Minorities | 1 | 2 | (1) | (2) | (3) | Payable | 74 | 84 | 119 | 155 | 229 | ||
| Net Profit | 838 | 1,173 | 1,718 | 3,796 | 5,461 | Other liability | 1,130 | 1.237 | 1,536 | 1,640 | 1,303 | ||
| EPS $ | 32.3 | 45.2 | 66.2 | 146.4 | 210.6 | Current liabilities | 1,265 | 1,458 | 1,811 | 1,951 | 1,687 | ||
| Change YoY | LT debt Other LT liability | 958 | 896 118 | 901 | 901 | 901 113 | |||||||
| Revenue | -5% | 34% | 32% | 38% | 33% | 44% | LT liabilities | 1,104 | 1,014 | 1,014 | 1,014 | 1,014 | |
| EBITDA | -7% | 37% | 32% | 48% | 38% | 43% | Common shares | 259 | 259 | 259 | 259 | 259 | |
| Operating profit | -18% | 43% | 46% | 63% | 35% | 44% | Retained earnings | 3,606 | 3,851 | 6,928 | 9,634 | 13,696 | |
| Net Profit | -18% | 40% | 46% | 63% | 35% | 44% | Equity | 4,324 | 5,461 | 7,668 | 10.377 | 14,441 | |
| EPS | -18% | 40% | 46% | 63% | 35% | 44% | Liability&equity | 6,692 | 7,933 | 10,494 | 13,342 | 17,143 | |
| CASH FLOW RATIOS & PER SHARE DATA | CASH FLOW RATIOS & PER SHARE DATA | CASH FLOW RATIOS & PER SHARE DATA | CASH FLOW RATIOS & PER SHARE DATA | CASH FLOW RATIOS & PER SHARE DATA | CASH FLOW RATIOS & PER SHARE DATA | CASH FLOW RATIOS & PER SHARE DATA | CASH FLOW RATIOS & PER SHARE DATA | CASH FLOW RATIOS & PER SHARE DATA | CASH FLOW RATIOS & PER SHARE DATA | CASH FLOW RATIOS & PER SHARE DATA | CASH FLOW RATIOS & PER SHARE DATA | CASH FLOW RATIOS & PER SHARE DATA | |
| FYE Dec (TWDb) | 2023 | 2024 | 2025 | 2026E | 2027E | 2028E | FYE Dec (%, TWD | 2023 | 2024 | 2025 | 2026E | 2027E | 2028E |
| Net profit | 838 | 1,173 | 1,718 | 2,826 | 3,796 | 10,087 | Gross margin | 54.4% | 56.1% | 59.9% | 68.5% | 68.5% | 69.2% |
| Dep. & amortisation | 523 | 654 | 680 | 708 | 1,462 | EBITDA Margin | 66.8% | 68.3% | 68.7% | 73.7% | 76.3% | 75.6% | |
| Chg in WC | 0 | (90) | 0 | (241) | (464) | Op. Profit Margin | 42.6% | 45.7% | 50.8% | 60.2% | 61.2% | 61.1% | |
| Others | (120) | 89 | 132 | (4,965) | Net Profit Margin | 38.8% | 40.5% | 45.1% | 53.4% | 54.3% | 54.1% | ||
| OPN cash flow | 1,242 | 1,826 | 3,424 | ROE (%) | 26.2% | 30.3% | 35.4% | 43.0% | 42.3% | 44.2% | |||
| Capex | (950) | (956) | (1,768) | ROA (%) | 16.0% | 19.2% | 23.5% | 30.4% | 31.8% | 35.8% | |||
| Disposal/(purchase) | (58) | (36) | (1) | (1) | Gross gearing | 26% | 22% | 16% | 12% | 9% | 6% | ||
| Others | 44 | 149 | 29 | (0) | Net gearing | -22% | -34% | -40% | -43% | -41% | -42% | ||
| Investing CF | (906) | (865) | (1,775) | Asset turn (x) | 0.41 | 0.47 | 0.52 | 0.57 | 0.59 | 0.66 | |||
| Debt raised/(repaid) | 93 | 26 | 13 | Leverage (x) | 1.6 | 1.6 | 1.5 | 1.4 | 1.3 | 1.2 | |||
| Equity raised/(repaid) | Payable days | 21.1 | 19.0 | 18.9 | 22.4 | 22.7 | 22.5 | ||||||
| Dividends (paid) | (292) | (363) | Receivable days | 36.6 | 30.0 | 26.5 | 26.0 | 27.7 | 27.1 | ||||
| (10) | (3) | days | 87.3 | 77.7 | 68.8 | 73.6 | 72.5 | 72.0 | |||||
| Financing CF | (346) | 32.3 | 45.2 | 66.2 | 108.2 | 146.4 210.6 | |||||||
| FX & other adj. | 47 | 133.4 | 165.4 | 209.0 | 294.1 | 398.4 | 555.0 | ||||||
| Chg in cash | 662 | per share | 29.7 | 56.4 | 83.8 | 126.1 | 165.0 | 232.8 | |||||
| Beginning cash | 1,343 1,465 | 83.4 111.6 | 146.9 | 202.5 | 269.8 | 389.0 | |||||||
| End cash | 33.6 | 38.7 | 63.8 | 80.9 | 121.8 | ||||||||
| 1,465 2,128 | 11.3 11.3 | 14.0 | 18.0 | 25.0 | 42.0 | 54.0 |
BALANCE SHEET
TSMC
Field Trip Takeaways: Still in Overdrive
• Are.
•
•
Alétheia Research Team
tell Woolcock
David Scen
Vincent Chen
Wiln Colo
Neven Schlegel
Product Marketing Teams
• .
Fic wen
Ches Moore
Anger Mockleton
Movie Pole
soup Mete
Field Trip Takeaways: Still in Overdrive
Firm Disclosures
Aletheia Capital Ltd ("Aletheia") is a limited company registered in Hong Kong, located at Unit 2407, World-Wide House, 19 Des Voeux Road, Central, Hong Kong.
Aletheia Analyst Network Ltd ("AAN") is a limited company registered in Hong Kong and is a wholly owned by Aletheia and is regulated by the Hong Kong Securities and Futures Commission, is a registered investment advisor with the U.S. Securities and Exchange Commission and is regulated by the Financial Conduct Authority, Firm Reference Number 794762.
Aletheia Capital (Singapore) Pte Ltd ("ACS") is a limited company registered in Singapore, UEN 201823248E, and is a wholly owned by AAN and is an Exempt Financial Adviser as defined in the Financial Advisers Act.
This report was published by AAN and is distributed by AAN and ACSG. For investors in Singapore, this material is provided by ACSG pursuant to Regulation 32C of the Financial Advisers Regulations. If there are any matters arising from, or in connection with this material, please contact ACSG, Level 39, MBFC Tower 2, 10 Marina Blvd, Singapore 018983.
Additional information will be made available upon request.
圖片清單(已驗證 2026-07-02)
回補驗證:僅涵蓋已被 lib 頁嵌入的圖片,非全量驗證。
| 檔名 | size | 分類 | 親眼所見內容 |
|---|---|---|---|
Aletheia-TSMC 0615__003.png |
95KB | 真資料圖 | 標題「PROJECTION OF TSMC'S ADVANCED CAPACITY EXPANSION PLAN」堆疊長條圖,橫軸 2025/2026E/2027E/2028E,分色堆疊 N4/5、N3、N2/A16、A14 產能數字(2028E:150/225/230/105,合計710),來源標註 Aletheia Capital/TAG |
Aletheia-TSMC 0615__013.png |
576KB | 真資料圖 | 標題「TSMC'S ADVANCE PACKAGING CAMPUS IN CHIAYI (AP7)」衛星空拍圖,綠色框標示「AP7 P1/2 WMCM/CoWoS」區塊,黃綠色框標示「AP7 P3/4 SolC/CoPoS?」區塊,無產能數字 |