PDF 原檔:報告_UBS_MLCC通路庫存追蹤_20261022_original.pdf
圖片清單(已驗證 2026-10-27)
| 檔名 | size | 分類 | 親眼所見內容 |
|---|---|---|---|
報告_UBS_MLCC通路庫存追蹤_20261022_001.png |
20KB | 真資料圖(未逐張驗證) | <40KB,依 md 圖說為 Figure 1 MLCC 通路庫存數量指數(UBS Evidence Lab);不嵌 |
報告_UBS_MLCC通路庫存追蹤_20261022_002.png |
19KB | 真資料圖(未逐張驗證) | <40KB,依 md 圖說為 Figure 3 MLCC 通路庫存金額指數;不嵌 |
報告_UBS_MLCC通路庫存追蹤_20261022_003.png |
18KB | 真資料圖(未逐張驗證) | <40KB,依 md 圖說為 Figure 5 MLCC 通路價格指數;不嵌 |
報告_UBS_MLCC通路庫存追蹤_20261022_004.png |
33KB | 真資料圖(未逐張驗證) | <40KB,依 md 圖說為 Figure 2 通路庫存數量指數(依廠牌);不嵌 |
報告_UBS_MLCC通路庫存追蹤_20261022_005.png |
34KB | 真資料圖(未逐張驗證) | <40KB,依 md 圖說為 Figure 4 通路庫存金額指數(依廠牌);不嵌 |
報告_UBS_MLCC通路庫存追蹤_20261022_006.png |
27KB | 真資料圖 | Figure 6 MLCC 通路單價指數(依廠牌)折線圖,Sep-21 起約 100;Murata、Samsung、Yageo、TDK 四線 2022–2023 下滑至約 60–80,2024–1H26 低檔盤整,2026-06 後陡升,至 Sep-26 Samsung 約 108、Yageo 與 TDK 約 100、Murata 約 85;嵌入 技術_MLCC |
報告_UBS_MLCC通路庫存追蹤_20261022_007.png |
28KB | 真資料圖(未逐張驗證) | <40KB,依 md 圖說為 Figure 7 Kyocera AVX 通路庫存數量指數;不嵌 |
報告_UBS_MLCC通路庫存追蹤_20261022_008.png |
33KB | 真資料圖(未逐張驗證) | <40KB,依 md 圖說為 Figure 8 Kyocera AVX 通路庫存金額指數;不嵌 |
報告_UBS_MLCC通路庫存追蹤_20261022_009.png |
56KB | 真資料圖 | md 內未引用的評等頁圖:SEMCO(韓元)股價與目標價階梯線(2023/08–2026/10),目標價約 2,500,000→2,700,000 韓元,評等條 Buy 為主;個股評等圖,不嵌 |
報告_UBS_MLCC通路庫存追蹤_20261022_010.png |
59KB | 真資料圖 | 評等頁圖:TDK(日圓)股價與目標價階梯線,目標價末段約 4,950,評等條全程 Buy;個股評等圖,不嵌 |
報告_UBS_MLCC通路庫存追蹤_20261022_011.png |
58KB | 真資料圖 | 評等頁圖:Three-Circle(人民幣)股價與目標價階梯線,目標價末段 180,評等條 Neutral→No Rating→Neutral→Buy(2025-08 起);個股評等圖,不嵌 |
報告_UBS_MLCC通路庫存追蹤_20261022_012.png |
55KB | 真資料圖 | 評等頁圖:Taiyo Yuden(日圓)股價與目標價階梯線,目標價末段約 17,700,評等條 Buy→Neutral(約 2024-11 起);個股評等圖,不嵌 |
報告_UBS_MLCC通路庫存追蹤_20261022_013.png |
54KB | 真資料圖 | 評等頁圖:Murata(日圓)股價與目標價階梯線,目標價末段約 13,200,評等條全程 Buy;個股評等圖,不嵌 |
原始內容
MLCC
UBS Evidence Lab Inside: inventory volume decline has stopped, while the unit price index continues to rise
Inventory volume up 2% in the past four wee s, with inventory value up 8% and the unit price index up 6%
In the up raded version of UBS Evidence Lab Electronics Distributor Inventory Monitor (> Access Dataset) , we track inventory levels and price trends of over 100 distributors worldwide (whereas our previous data tracked only one US distributor) from September 2021. This dataset includes data throu h 10 October. As of 10 October, MLCC distributor inventory volume was +2% versus four weeks prior (12 September), inventory value was +8%, and the unit price index was +6%. Inventory volume appears to have stabilised after reachin its lowest level since 2023 in September. Meanwhile, inventory value rose faster than volume, driven by the increase in the unit price index. Both inventory value and the unit price index reached record hi hs as of this date.
Yageo and SEMCO recorded the largest increases in unit price indices
Lookin at inventory volume by manufacturer as of 10 October versus four weeks prior (12 September), Murata was +2%, SEMCO -4%, Ya eo +11%, TDK +4%, and Taiyo Yuden +4%. In terms of inventory value, Murata was +7%, SEMCO +9%, Ya eo +12%, TDK +8%, and Taiyo Yuden +11%. For the unit price index, Murata was +3%, SEMCO +6%, Ya eo +9%, TDK +4%, and Taiyo Yuden +5%. Re ardin YTD chan es in the unit price index, Murata was +24%, SEMCO +82%, Ya eo +38%, TDK +31%, and Taiyo Yuden +68%.
Key points for CQ3 results
1) Price increases by Japanese manufacturers. Amid a series of price increase announcements by South Korean and Taiwanese manufacturers (link/link, Chinese only) and reports of prospective price increases (link, Chinese only), Japanese manufacturers, which have consistently maintained a cautious stance on price revisions, appear to be la in behind. We aim to confirm whether Japanese firms will follow with price increases and, if so, the extent of the increases, the products covered, and the timin of implementation. 2) The companies' production capacity expansion plans and mediumterm demand outlooks. AI-related demand is broadenin from GPU boards to peripheral areas such as power and optical modules, further stren thenin demand for hi h-end MLCCs. Accordin to media reports, Murata is considerin brin in forward (link, Japanese only) its ¥80bn in additional investment in MLCC production facilities planned over the two years throu h FY3/28, as well as makin further additional investments (link). We aim to examine each company's capacity expansion plans and assess the impact of additional investment on the widenin supply-demand ap for AI-related MLCCs. 3) The demand outlook for non-AI MLCCs. We believe MLCCs handled by distributors have a relatively hi h exposure to non-AI applications. Since June, distributor inventory volume has declined by more than 30%, while the unit price index has risen by nearly 30% over the same period. We intend to confirm the reasons behind these trends, as well as the outlook for non-AI demand amon direct-sales customers, inventory levels, and the pricin environment oin forward.
Stoc implications
We favour companies with a stron presence in hi h-end products where structural rowth is likely. We have a Buy ratin on SEMCO, Murata and TDK, and a Neutral ratin on Taiyo Yuden.
Equities
Japan
Electric Components & Equipment
Shingo Hirata, CFA
Analyst
shin o.hirata@ubs.com +81-3-5208 6224
Jimmy Yoon
Analyst
jimmy.yoon@ubs.com +65-6495 4617
Nicolas Gaudois
Analyst
+65-6495 5148
Timothy Arcuri
Analyst
timothy.arcuri@ubs.com +1-415-352 5676
Francois-Xavier Bouvignies Analyst
francois.bouvi nies@ubs.com +44-20-7568 7105
Kenji Yasui
Analyst
+81-3-5208 6211
Sunny Lin
Analyst
+886-2-8722 7346
Jimmy Yu Analyst
S1460517080002 jimmy.yu@ubs.com +86-21-3866 8880
Diana Chang
Analyst diana.chan @ubs.com +886-2-8722 7335
Figure 1: MLCC distributor inventory unit index
Source: UBS Evidence Lab (> Access Dataset)
Note: Normalised unit inventories UBS Evidence Lab
Figure 3: MLCC distributor inventory value index
Source: UBS Evidence Lab (> Access Dataset)
Note: Normalised dollar inventories
Figure 5: MLCC distributor price index
Source: UBS Evidence Lab (> Access Dataset)
Note: Normalised dollar inventories
Figure 2: MLCC distributor inventory unit index (by manufacturer)
Source: UBS Evidence Lab (> Access Dataset)
Note: Normalised unit inventories
Figure 4: MLCC distributor inventory value index (by manufacturer)
Source: UBS Evidence Lab (> Access Dataset)
Note: Normalised dollar inventories
Figure 6: MLCC distributor price index (by manufacturer)
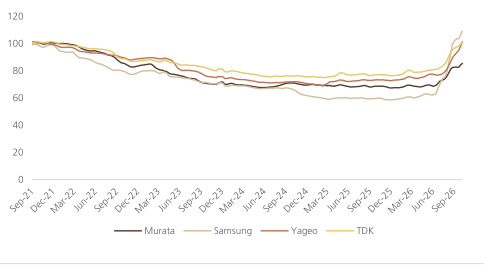
Source: UBS Evidence Lab (> Access Dataset)
Note: Normalised dollar inventories
Figure 7: Kyocera AVX - MLCC distributor inventory unit index
Source: UBS Evidence Lab (> Access Dataset)
Note: Normalised dollar inventories
Figure 8: Kyocera AVX - MLCC distributor inventory value index
Source: UBS Evidence Lab (> Access Dataset)
Note: Normalised dollar inventories
Figure 9: MLCC inventory unit heatmap - yoy change at ma ers
| Oct-25 | Nov-25 | Dec-25 | Jan-26 | Feb-26 | Mar-26 | Apr-26 | May-26 | Jun-26 | Jul-26 | Aug-26 | Sep-26 | |
|---|---|---|---|---|---|---|---|---|---|---|---|---|
| Murata | -4% | -13% | -18% | -18% | -11% | -6% | -11% | -6% | -11% | -26% | -30% | -37% |
| Samsung | 35% | 54% | 60% | 59% | 48% | 66% | 33% | 57% | 16% | -34% | -51% | -56% |
| Yageo | 36% | 29% | 29% | 26% | 34% | 32% | 24% | 19% | -4% | -11% | -18% | -24% |
| TDK | -13% | -13% | -16% | -13% | -11% | -9% | -17% | -17% | -24% | -33% | -38% | -35% |
| Taiyo Yuden | -11% | -8% | -11% | -5% | -1% | -7% | -8% | -5% | 3% | 4% | -1% | 1% |
| Walsin Technologies | -33% | 0% | 0% | 9% | 3% | 6% | -9% | 9% | 10% | -17% | -23% | -25% |
| KYOCERA AVX | 88% | 65% | 45% | 46% | 34% | 41% | -3% | -3% | -12% | -28% | -34% | -38% |
| Peer group avg. | 24% | 22% | 20% | 19% | 19% | 24% | 9% | 13% | -4% | -22% | -31% | -35% |
Source: UBS Evidence Lab (> Access Dataset)
Figure 10: MLCC inventory value heatmap - yoy change at ma ers
| Oct-25 | Nov-25 | Dec-25 | Jan-26 | Feb-26 | Mar-26 | Apr-26 | May-26 | Jun-26 | Jul-26 | Aug-26 | Sep-26 | |
|---|---|---|---|---|---|---|---|---|---|---|---|---|
| Murata | -7% | -18% | -20% | -14% | -11% | -11% | -9% | -4% | 1% | -3% | 15% | 11% |
| Samsung | 13% | 27% | 34% | 35% | 31% | 48% | 29% | 48% | 39% | 4% | 21% | 21% |
| Yageo | 8% | 5% | 6% | 9% | 11% | 12% | 17% | 30% | 19% | 27% | 51% | 60% |
| TDK | 1% | -2% | -5% | 2% | 6% | 6% | -6% | -6% | -12% | -15% | -13% | -4% |
| Taiyo Yuden | -11% | -8% | -7% | -4% | -5% | -10% | -14% | -9% | 8% | 39% | 78% | 88% |
| Walsin Technologies | -40% | 0% | 11% | 16% | 7% | 4% | -11% | 4% | 12% | 16% | 15% | 19% |
| KYOCERA AVX | 74% | 66% | 33% | 40% | 44% | 33% | -7% | 3% | -1% | -4% | 8% | 0% |
| Peer group avg. | 16% | 11% | 6% | 11% | 13% | 12% | 2% | 10% | 8% | 6% | 23% | 24% |
Source: UBS Evidence Lab (> Access Dataset)
Figure 11: MLCC ASP heatmap - yoy change at ma ers
| Oct-25 | Nov-25 | Dec-25 | Jan-26 | Feb-26 | Mar-26 | Apr-26 | May-26 | Jun-26 | Jul-26 | Aug-26 | Sep-26 | |
|---|---|---|---|---|---|---|---|---|---|---|---|---|
| Murata | -2% | -3% | -3% | -1% | 0% | -1% | -1% | 1% | 4% | 9% | 21% | 23% |
| Samsung | -8% | -5% | -3% | 0% | 2% | 2% | 5% | 4% | 13% | 30% | 68% | 79% |
| Yageo | 2% | 3% | 4% | 7% | 7% | 4% | 4% | 7% | 6% | 10% | 23% | 34% |
| TDK | 1% | 1% | 1% | 4% | 7% | 4% | 2% | 5% | 6% | 11% | 24% | 29% |
| Taiyo Yuden | 10% | 12% | 11% | 12% | 14% | 11% | 11% | 15% | 23% | 42% | 60% | 65% |
| Walsin Technologies | -12% | -6% | 15% | 18% | 17% | 10% | 7% | 11% | 11% | 18% | 35% | 39% |
| KYOCERA AVX | 0% | 1% | 5% | 7% | 9% | 6% | 3% | 6% | 10% | 16% | 25% | 33% |
| Peer group avg. | 0% | 1% | 3% | 5% | 7% | 4% | 3% | 6% | 7% | 13% | 26% | 34% |
Source: UBS Evidence Lab (> Access Dataset)
Figure 12: Valuation
| Company | Rating | Price | Prirce Target | EV/Sales - 2026E | EV/Sales - 2027E | EV/Sales - 2028E | EV/EBITDA - 2026E | EV/EBITDA - 2027E | EV/EBITDA - 2028E | Price/Earnings - 2026E | Price/Earnings - 2027E | Price/Earnings - 2028E | Price/Book - 2026E | Price/Book - 2027E | Price/Book - 2028E |
|---|---|---|---|---|---|---|---|---|---|---|---|---|---|---|---|
| Murata Mfg. | Buy | ¥6,756 | ¥13,200 | 5.7 | 4.8 | 4.0 | 18.1 | 12.1 | 9.2 | 33.8 | 20.8 | 15.4 | 4.3 | 3.9 | 3.4 |
| TDK | Buy | ¥2,903 | ¥4,950 | 1.8 | 1.7 | 1.5 | 8.4 | 6.8 | 5.9 | 20.4 | 14.9 | 12.8 | 2.3 | 2.1 | 1.9 |
| Taiyo Yuden | Neutral | ¥9,253 | ¥17,700 | 3.2 | 2.8 | 2.5 | 14.5 | 10.0 | 8.2 | 38.9 | 20.7 | 15.7 | 3.2 | 2.9 | 2.5 |
| SEMCO | Buy | Won1,168,000 | Won2,700,000 | 6.2 | 4.5 | 3.4 | 28.3 | 13.3 | 8.8 | 54.5 | 20.9 | 13.1 | 7.7 | 5.8 | 4.1 |
| Three-Circle | Buy | Rmb96 | Rmb180 | 14.5 | 10.8 | 8.3 | 38.1 | 27.9 | 21.8 | 47.0 | 34.0 | 26.8 | 7.6 | 6.5 | 5.5 |
| Average | 4.2 | 3.4 | 2.8 | 17.3 | 10.6 | 8.0 | 36.9 | 19.3 | 14.2 | 4.4 | 3.7 | 3.0 |
Source: UBS, share prices as of Oct 21
*UBS Evidence Lab is a sell-side team of experts that work across numerous specialized labs creating insight-ready datasets. The experts turn data into evidence by applying a combination of tools and techniques to harvest, cleanse, and connect billions of data items each month. Since 014, UBS Research analysts have utilized the expertise of UBS Evidence Lab for insight-ready datasets on companies, sectors, and themes, resulting in the production of thousands of differentiated UBS Research reports. UBS Evidence Lab does not provide investment recommendations or advice but provides insight-ready datasets for further analysis by UBS Research and by clients. All published UBS Evidence Lab content is available via UBS Neo. The amount and type of content available may vary. Please contact your UBS sales representative if you wish to discuss access.
Electronics Distributor Inventory Monitor (>Access Dataset)
This report levera es the followin UBS Evidence Lab asset: Electronics Distributor Inventory Monitor. It can be used to answer questions such as: How do inventory levels and pricin trends for IT components chan e over time and by manufacturer? UBS Evidence Lab tracks these trends across 100+ lobal distributors, includin more than five of the top 10, coverin over 1 million distinct products from 30+ IT component manufacturers.
Valuation Method and Ris Statement
Risk factors include (1) surprisin fluctuations in macro factors (such as individual consumption in the US), (2) rapid alterations in financial markets (includin the US stock market), and (3) chan e in base material costs (includin petrochemicals and metals).
Murata Mf : Our price tar et is based on PER. We believe the main risk factors are: (1) an unexpected reduction in demand for core products as a result of a slowdown in the US economy, (2) sudden volatility in the equity or forex markets, (3) diffusion of technolo y (for lar e-capacitance ceramic capacitors, etc.) to Asian enterprises, (4) further pro ress with the shift of hi h frequency circuits to IC with improvements in semiconductor technolo y, and (5) a reduction in the competitive advanta e of ceramic capacitors as the performance of other capacitors improves.
Taiyo Yuden: Our price tar et is based on PER. Risks include: 1) weaker-than-expected demand for the company's main products because of a slowdown in US economic rowth or for other reasons; 2) unfavourable trends in the US stock market; 3) rapid exchan e rate fluctuations; 4) diffusion and commoditization of important technolo ies because of personnel losses (in the hi h-capacity ceramic capacitor market, for example); and 5) a decline in the importance of ceramic capacitors because of improvements in other types of capacitors or because of advances in the semiconductor industry; and 6) oversupply of DVD media and substantially lower prices.
TDK: Our price tar et is based on PER. Risk factors include lower prices and volumes of electronic components in conjunction with a lobal economic slowdown, delays in the introduction of next- eneration technolo ies, and loss of market share owin to intensifyin competition. Also, hard drive heads heavily affect earnin s, the stron yen hurts revenue in yen terms, and unexpected lawsuits or controversies could arise.
Samsun Electro-Mechanics: We derive our price tar et from a forward P/BV valuation method, based on our lon -term avera e ROE and cost of equity assumptions.
We think the key risks for SEMCO include:
1) SEMCO has hi h customer concentration towards Samsun Electronics (about 50% of total revenue), so any chan es in Samsun Electronics' business outlook or procurement strate y could pose downside risks. Samsun Electronics is also SEMCO's lar est shareholder, which could pose potential risks from conflict of interest.
2) SEMCO's main competitors for the MLCC business are Japanese companies; hence any meanin ful depreciation of the Japanese yen a ainst the Korean won could lower SEMCO's price competitiveness and intensify competition.
3) SEMCO is subject to any weakness in end-demand for IT (smartphones, PCs, etc), industrial and automotive applications.
4) Given the complexity of the lobal tech supply chain, escalation in trade disputes could pose downside risks to end-demand and compress valuation multiples. This could also present different company-specific upside/downside risks dependin on the supply chain.
Three Circle: We derive the price tar et of Three Circle based on P/E valuation method.
We believe major risks for China's MLCC sector include: 1) undershootin earnin s due to industry inventory correction; 2) oversupply caused by capacity expansion, and earnin s contraction due to price competition; 3) rowth of emer in downstream applications may disappoint the market due to uncertainties; 4) Chinese companies' competitiveness relative to Japanese/Korean peers may be sensitive to FX; 5) supply chain stability likely to be disrupted by tariffs and eopolitics.
Main downside risks for Three-Circle include: 1) slower-than-expected recovery in home appliance/industrial MLCC demand; 2) lower-than-expected earnin s from industry inventory correction; 3) slower-than-expected penetration into hi h-end markets; and 4) uncertainty to consumer electronics value chain resultin from eopolitical risks such as tariffs.