PDF 原檔:報告_MS_中國先進封裝_20260915_original.pdf
圖片清單(已驗證 2026-09-16)
| 檔名 | size | 分類 | 親眼所見內容 |
|---|---|---|---|
報告_MS_中國先進封裝_20260915_018.png |
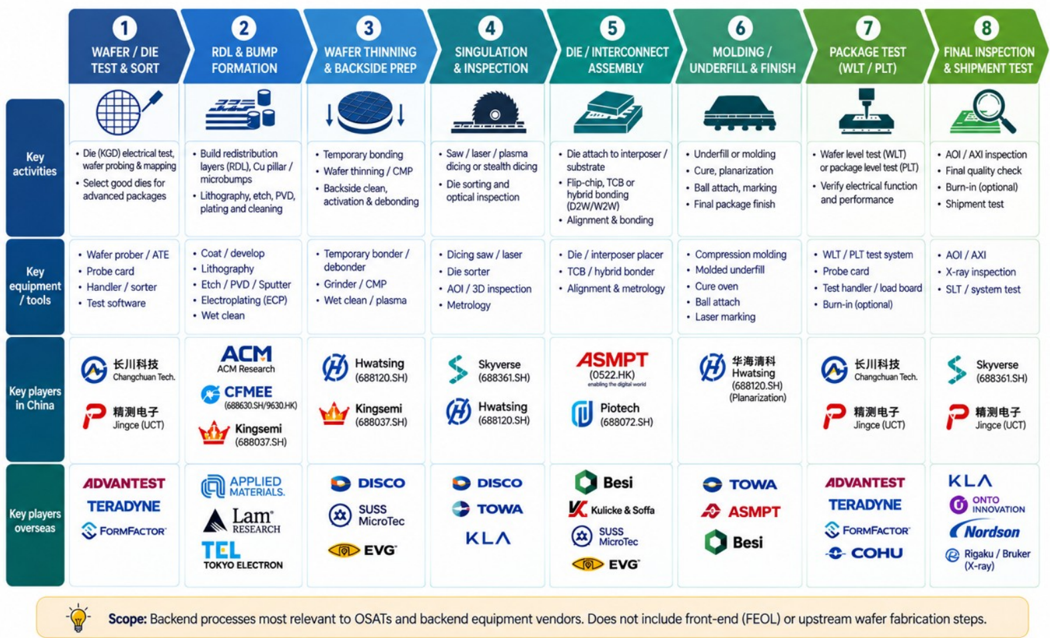
776KB | 真資料圖 | 後段先進封裝八步驟流程總表:1 Wafer/Die Test & Sort → 2 RDL & Bump Formation → 3 Wafer Thinning & Backside Prep → 4 Singulation & Inspection → 5 Die/Interconnect Assembly → 6 Molding/Underfill & Finish → 7 Package Test(WLT/PLT)→ 8 Final Inspection & Shipment Test;每步列關鍵活動、關鍵設備與中國/海外主要廠商(中國:長川科技、精測電子、ACM、CFMEE、Kingsemi、Hwatsing、Skyverse、ASMPT、Piotech、華海清科;海外:Advantest、Teradyne、FormFactor、Applied Materials、Lam、TEL、DISCO、TOWA、KLA、Besi、Kulicke & Soffa、SUSS、EVG、Onto、Nordson、Rigaku/Bruker、COHU) |
本報告共抽出 50 張圖,上表為本次 ingest 實際開圖驗證者;其餘未逐張驗證,不得直接嵌入 lib/。
原始內容
Greater China Technology Semiconductors
China Advanced Packaging: Favor Capex Beneficiaries & Share Gainers
China's advanced packaging industry remains a secular AI-driven growth story. But, we see rising overcapacity risk and prefer equipment vendors and market share gainers.
Advanced packaging is becoming increasingly critical to AI GPU performance, particularly in China. As AI accelerators require greater compute density, memory bandwidth, and system-level integration, advanced packaging provides a key pathway to improve performance. This is particularly important for China, where restrictions on access to leading-edge semiconductor equipment constrain further front-end process scaling, increasing the strategic value of packaging-led performance improvements. We are therefore constructive on the structural growth outlook for China advanced packaging.
However, we are more cautious than consensus on how this TAM growth translates into OSAT earnings . We see a growing risk of moderate overcapacity, as attractive industry growth and margins encourage incumbent OSATs and new entrants to add 2.5D/3D capacity. Our bottom-up analysis suggests China's 2.5D capacity could rise from 120k wafers in 2025 to 436k in 2027, while effective demand remains constrained by advanced-node yields and HBM availability. We estimate industry utilization at only ~63% in 2027, suggesting stronger competition could weigh on pricing and limit margin upside even as industry revenue continues to grow.
We therefore prefer advanced-packaging equipment vendors over broad-based OSAT exposure . The ongoing capacity race requires substantial upfront spending, regardless of whether the resulting OSAT capacity ultimately generates attractive returns. At the same time, the migration from conventional packaging toward 2.5D/3D raises process complexity and equipment intensity per unit of capacity, providing an additional structural growth driver for equipment suppliers. Aggregate OSAT capex is already accelerating, supporting our preference for capex beneficiaries including ASMPT and ACM Research among our covered names.
Within OSATs, we prefer share gainers: upgrade JCET to OW; initiate SJ Semi at EW. We upgrade JCET to Overweight with a Rmb90.2 PT, as we expect the company to emerge as a meaningful share gainer in domestic 2.5D packaging, and continued mix diversification toward computing and automotive. We initiate SJ Semi at Equalweight with a Rmb118.4 PT. While it remains China's leading 2.5D packaging vendor, we believe its premium valuation already discounts much of its technology leadership and AI-driven growth, while increasing competition, customer concentration and HBM availability create a more balanced risk-reward .
| Morgan Stanley Asia Limited+ | Morgan Stanley Asia Limited+ | Morgan Stanley Asia Limited+ |
|---|---|---|
| Daisy Dai, CFA | Daisy Dai, CFA | Daisy Dai, CFA |
| Daisy.Dai@morganstanley.com | Daisy.Dai@morganstanley.com | +852 2848-7310 |
| Morgan Stanley Taiwan Limited+ | Morgan Stanley Taiwan Limited+ | Morgan Stanley Taiwan Limited+ |
| Charlie Chan | Charlie Chan | Charlie Chan |
| Equity Analyst | Equity Analyst | Equity Analyst |
| Charlie.Chan@morganstanley.com | Charlie.Chan@morganstanley.com | +886 2 2730-1725 |
| Daniel Yen, CFA | Daniel Yen, CFA | Daniel Yen, CFA |
| Equity Analyst | Equity Analyst | Equity Analyst |
| Daniel.Yen@morganstanley.com | Daniel.Yen@morganstanley.com | +886 2 2730-2863 |
| Morgan Stanley Asia Limited+ | Morgan Stanley Asia Limited+ | Morgan Stanley Asia Limited+ |
| Henry Zhao | Henry Zhao | Henry Zhao |
| Equity Analyst | Equity Analyst | Equity Analyst |
| Henry.Zhao@morganstanley.com | Henry.Zhao@morganstanley.com | +852 2239-7731 |
| Ethan Jia | Ethan Jia | Ethan Jia |
| Research Associate | Research Associate | Research Associate |
| Ethan.Jia@morganstanley.com | Ethan.Jia@morganstanley.com | +852 3963-2287 |
| Morgan Stanley Taiwan Limited+ | Morgan Stanley Taiwan Limited+ | Morgan Stanley Taiwan Limited+ |
| Lucas Wang | Lucas Wang | Lucas Wang |
| Greater China Technology Semiconductors | Greater China Technology Semiconductors | Greater China Technology Semiconductors |
| Asia Pacific | Asia Pacific | Asia Pacific |
| Industry View Attractive | Industry View Attractive | Industry View Attractive |
| (600584.SS) | From | To |
| Rating | Equal-weight | Overweight |
| Price Target | Rmb50.00 | Rmb90.20 |
| SJ Semiconductor Corp | SJ Semiconductor Corp | SJ Semiconductor Corp |
| (688820.SS) | From | To |
| Rating | NA | Equal-weight |
| Price Target | Rmb0.00 | Rmb118.40 |
Morgan Stanley does and seeks to do business with companies covered in Morgan Stanley Research. As a result, investors should be aware that the firm may have a conflict of interest that could affect the objectivity of Morgan Stanley Research. Investors should consider Morgan Stanley Research as only a single factor in making their investment decision.
For analyst certification and other important disclosures, refer to the Disclosure Section, located at the end of this report.
+= Analysts employed by non-U.S. affiliates are not registered with FINRA, may not be associated persons of the member and may not be subject to FINRA restrictions on communications with a subject company, public appearances and trading securities held by a research analyst account.
M
Key charts
Exhibit 1: China's advanced packaging TAM expected to grow to Rmb100bn in 2029 with chiplet 2.5D at 40% CAGR
Source: CSIA, CIC
Exhibit 3: We expect moderate overcapacity of China's 2.5D packaging
Source: Company data, Morgan Stanley Research estimates
Exhibit 5: We also prefer back-end equipment on the back of surging OSAT capex
Source: Bloomberg, Morgan Stanley Research
Exhibit 2: We expect China's 2.5D packaging annual capacity to grow to 436k wafers in 2027
Source: Company data, Morgan Stanley Research estimates
Exhibit 4: We prefer JCET over SJ Semi because of JCET's market share gain in 2.5D packaging
Source: Company data, Morgan Stanley Research estimates
Exhibit 6: We think SJ Semi's premium valuation already discounts its technology leadership and AI-driven growth
Source: Factset, Morgan Stanley Research estimates
M
Back-end order of preference
Exhibit 7: Order of preference
| ACM Research ACMR.O | ASMPT 0522.HK | JCET 600584.SS | ASE 3711.TW | SJ Semi 688820.SS | |
|---|---|---|---|---|---|
| Rating | Overweight | Overweight | Overweight | Overweight | Equal-weight |
| Trading Currency | USD | HKD | CNY | TWD | CNY |
| Price Target | 130.0 | 248.0 | 90.2 | 628.0 | 118.4 |
| Current Price (Date as of 2026/9/15) | 66.9 | 154.1 | 66.9 | 592.0 | 127.8 |
| Upside/(Downside) (%) | 94% | 61% | 35% | 6% | -7% |
| Market Cap (in USD mm) | 3,955.3 | 7,812.6 | 17,836.3 | 84,148.5 | |
| 35,496.6 | |||||
| Avg Daily Traded Vol (in USD mm) | 84.7 | 54.5 | 974.1 | 307.2 | 665.5 |
| Street View: Ratings | |||||
| Buy/Overweight | |||||||||||||||||||||| 88% ||| 13% | ||||||||||||||||||||| 83% ||| 11% | ||||||||||||||||||||||| 92% || 8% | |||||||||||||||||||||||| 94% | 6% | ||||||||||||||||||||||||| 100% 0% |
| Hold/Equal-weight Sell/Underweight | 0% | | 6% | 0% | 0% | 0% |
| Upside (%) | 206% | 100% | 121% | 18% | 56% |
| Bear Case Value | 45.0 | 90.0 | 60.6 | 380.0 | 80.0 |
| -42% | -9% | -36% | -37% | ||
| Downside (%) | -33% | ||||
| Risk/Reward Skew | 6.3 | 2.4 | 12.8 | 0.5 | 1.5 |
| Morgan Stanley Estimates | |||||
| FY26e | USD | HKD | CNY | TWD | CNY |
| Sales | 1,172 | 19,265 | 44,311 | 836,892 | 7,874 |
| EBITDA | 185 | 3,436 | 7,991 | 188,097 | 4,080 |
| EBIT | 184 | 3,154 | |||
| EPS | 2.82 | 2,513 4.01 | 1.47 | 99,620 17.89 | 1,189 0.59 |
| FY27e | |||||
| Sales | 1,542 | 22,157 | 51,375 | 1,116,816 | 10,371 |
| EBITDA | 294 | 4,800 | 9,017 | 312,710 | 4,861 |
| EBIT | 293 | 3,739 | 4,301 | 178,087 | 1,743 |
| EPS | 4.38 | 6.83 | 2.05 | 30.05 | 0.87 |
| FY26 MSe vs. Consensus Mean | |||||
| Sales | -0.2% | 2.1% | 0.4% | 0.5% | -5.3% |
| EBITDA | -7.2% | 9.8% | 9.7% | 5.3% | 7.9% |
| EBIT | -4.2% | 0.5% | 12.1% | 1.9% | 9.5% |
| EPS | 30.8% | -5.7% | 13.5% | -3.0% | 2.5% |
| FY27 MSe vs. Consensus Mean | |||||
| Sales | 2.3% | 0.0% | 0.6% | 7.9% | -7.7% |
| EBITDA | -3.9% | 18.9% | 3.5% | 16.2% | -1.6% |
| EBIT | 11.1% | 13.6% | 9.4% | 14.9% | 1.1% |
| EPS | 51.2% | 10.9% | 14.3% | 8.2% | -1.7% |
| Valuation Multiples at Last Close | |||||
| FY26e | 23.7x | 38.4x | 45.5x | 33.1x | 216.3x |
| P/E EV/EBIT | 15.2x | 24.2x | 36.0x | 30.0x | 193.7x |
| EV/EBITDA | 15.2x | 17.7x | 14.2x | 15.9x | 56.4x |
| EV/Sales | 2.4x | 3.2x | 2.6x | 3.6x | 29.2x |
| FCF Yield | 18.4% | 0.7% | -0.9% | -5.0% | -0.6% |
| FY27e | |||||
| P/E | 15.3x | 22.6x | 32.6x | 19.7x | 147.2x |
| EV/EBIT | 9.2x | 16.3x | 26.3x | 17.5x | 132.3x |
| EV/EBITDA | 9.2x | 12.7x | 12.5x | 10.0x | 47.4x |
| EV/Sales | 1.8x | 2.7x | 2.2x | 2.8x | 22.2x |
| FCF Yield | 4.8% | 3.7% | 0.0% | -3.1% | -0.2% |
| Implied Multiples on MS Price Target | |||||
| FY26e P/E | 46.2x | 61.8x | 61.4x | 35.1x | 200.4x |
| EV/EBIT | 35.54 | 39.07 | 49.22 | 31.64 | 178.88 |
| 35.39 | 19.43 | 16.76 | |||
| EV/EBITDA | 5.58 | 28.58 5.10 | 3.50 | 3.77 | 52.11 27.00 |
| EV/Sales | |||||
| FY27e P/E | 29.7x | 36.3x | 44.0x | 20.9x | 136.3x |
| EV/EBIT | 39.99 | 28.48 | 41.91 | 16.39 | 147.29 |
| EV/EBITDA | 39.88 | 22.18 | 19.99 | 9.33 | 52.81 |
| EV/Sales | 7.61 | 4.81 | 3.51 | 2.61 | 24.75 |
| Stock Price Performance | |||||
| 1 Month | (16.9%) | (12.4%) | (15.1%) | (3.9%) | (7.3%) |
| 3 Month | (28.8%) | (15.7%) | (10.0%) | 0.3% | (23.9%) |
| YTD | 69.5% | 99.9% | 81.8% | 136.3% | n.a. |
Source: Factset, Morgan Stanley Research estimates. Note: Prices as of Sept 15, 2026.
CAInUll O.
Mi ully value uhlall! ulmla vo..
AI CHIP VALUE CHAIN: CHINA vS. US
M
Tencent
Investment Summary
deepseek
Baidseilse
Moonshot Al
EL Alibaba.com
00 Meta amazon
ORACLE
Hen house
WFE/EDA
1t 75 6 6
ACM
ETTETN
SICARRIER
G AVEC
FSIHNNTE
СПОКЕВЕТО
411 711
China advanced packaging: Structural AI growth, but value capture should favor equipment vendors and OSAT share gainers . China's advanced packaging industry remains a secular AI-driven growth story, but we see a growing divergence between industry TAM growth and earnings capture across the value chain. Advanced packaging is becoming increasingly critical to AI accelerator performance by enabling higher compute density, memory bandwidth and heterogeneous integration through technologies including wafer-level processing, RDL, TSV, chiplets, 2.5D integration, 3DIC and hybrid bonding. This is particularly important in China, where restrictions on access to leadingedge front-end semiconductor equipment increase the strategic value of packaging-led performance improvements. Technology LESEARCH TOKIO ELECTRON ADVANTEST
Exhibit 8: AI chip value chain (China vs. US) - we focus on China advanced packaging in this report
Cauran. Maraon Ctanlou Doonarahl
Source: Morgan Stanley Research
Cambricon
Chicken E
Foundry/OSAT
SMIC
1i÷1
S
SJSEMI
TF
LEHE1
EBNS
GT-HEAD
We expect China's advanced packaging TAM to reach approximately Rmb100bn by
2029 , implying a roughly 13% CAGR over 2025-29, while the chiplet / 2.5D segment should grow substantially faster, reaching Rmb17.7bn by 2029 at a 40% CAGR. However, we are more cautious than consensus on how this growth translates into OSAT earnings. China's 2.5D annual capacity is expected to expand from around 120k wafers in 2025 to 436k wafers in 2027, while effective demand is constrained by advanced-node yields, HBM availability and customer qualification. We therefore estimate industry utilization at only around 63% in 2027, suggesting moderate overcapacity could pressure pricing and limit margin upside even as industry revenue continues to grow.
M
Exhibit 9: China advanced packaging TAM is expect to grow to Rmb100bn in 2029 with chiplet 2.5D at 40% CAGR
Source: CSIA, CIC
Exhibit 10: We expect moderate overcapacity of China 2.5D packaging
Source: Company data, Morgan Stanley Research estimates
Three key debates
1. Will China's advanced packaging industry face oversupply? - We see moderate overcapacity risk, particularly in 2.5D.
The market remains constructive on supply-demand, given strong domestic AI compute growth, but we think capacity additions could run ahead of effective demand. Attractive industry growth and margins are drawing incumbent OSATs and new entrants into 2.5D/3D packaging, while actual packaging demand is constrained by the availability of qualified accelerator dies and HBM. In addition, a shift from CoWoS-S-like to CoWoS-L-like architectures could create a capacity-mix mismatch, with excess S-like capacity even if Llike capacity remains tight. Longer term, greater adoption of 3D integration could also reduce the amount of 2.5D package footprint required per accelerator die
2. Who captures more value - OSATs or equipment vendors? - We prefer equipment vendors.
Our key distinction is that OSAT earnings depend on capacity being filled, while equipment revenues depend primarily on capacity being built. If our moderateovercapacity thesis is correct, aggressive OSAT expansion could dilute utilization and pricing while still creating a strong order environment for equipment suppliers. The technology transition also structurally increases equipment intensity: 2.5D/3D requires additional fine-pitch RDL, TSV, wafer-level processing, temporary bonding/debonding, high-precision die placement, TCB/hybrid bonding and advanced inspection. We therefore expect equipment value per unit of packaging capacity to rise as China migrates toward more complex architectures.
3. How much upside should investors assign to 3DIC, HBM packaging and CPO? - Strategically important, but near-term earnings contribution is likely overstated.
We view the current earnings opportunity as still primarily driven by 2.5D / CoWoS-like capacity expansion, while 3DIC, HBM and CPO remain mainly medium- to long-term
M
optionality. 3DIC could be particularly important in China as a workaround for constrained front-end scaling, but high cost and compound-yield sensitivity remain key barriers. We estimate China's 3DIC market may remain only in the tens of millions of US dollars over the next 2-3 years. HBM is a large volume opportunity, but packaging value is still largely retained within the memory ecosystem, limiting near-term independent OSAT value capture. CPO has attractive long-term potential, but large-scale deployment is more likely in 2027-28, implying limited contribution to China OSAT earnings over the next 1-2 years
Stock implications: Favor capex beneficiaries and share gainers
We therefore see two preferred ways to gain exposure to China advanced packaging.
First, equipment vendors offer the cleaner exposure to the capacity build-out . ACM
Research is a direct beneficiary through electrochemical plating, cleaning and other wet processes, with advanced-packaging revenue already accelerating and panel-level packaging moving closer to volume production. ASMPT is well positioned through TCB, high-precision flip-chip and hybrid bonding, wherein increasing package size, finer interconnect pitch and 3D integration should drive unit demand and mix toward highervalue platforms.
Second, within OSATs, we prefer share gainers rather than broad industry exposure .
JCET is our preferred domestic OSAT as it is building 2.5D capacity from a low base, improving customer visibility and expanding into computing, automotive, CPO and nextgeneration packaging. We expect this to support structural share gains over the medium term. By contrast, SJ Semi remains the domestic technology leader, with roughly 77% share of China's 2.5D market in 2025 and a clear lead in 3DIC commercialization, but we believe its premium valuation already discounts much of this leadership. Competitive capacity additions could also reduce its built-capacity share materially by 2027, while customer concentration remains high.
M
Exhibit 11: Comps Table - Advanced Packaging Related Companies
| Stock Price | Curr- | Market Cap | Revenue Growth (%) | Revenue Growth (%) | Revenue Growth (%) | P/S | P/S | P/S | P/E | P/E | P/E | P/B | P/B | P/B | Price Performance | Price Performance | Price Performance | |
|---|---|---|---|---|---|---|---|---|---|---|---|---|---|---|---|---|---|---|
| (LCU) | ency | (US$mm) | 2026 | 2027 | 2028 | 2026 | 2027 | 2028 | 2026 | 2027 | 2028 | 2026 | 2027 | 2028 | 1M | 3M | 1Y | |
| SJ Semi | 126.8 | CNY | 35,216 | 20.8% | 31.7% | 24.0% | 30x | 23x | 18x | 215x | 146x | 107x | 11.5x | 10.7x | 9.7x | (8.1%) | (18.8%) | -- |
| A-share OSAT | ||||||||||||||||||
| JCET | 66.3 | CNY | 17,696 | 14.0% | 15.9% | 16.5% | 3x | 2x | 2x | 45x | 32x | 25x | 3.7x | 3.4x | 3.0x | (15.7%) | (3.8%) | 75.1% |
| Tongfu Microelectronics | 56.8 | CNY | 12,847 | 23.4% | 15.6% | 12.2% | 3x | 2x | 2x | 44x | 41x | 34x | 4.9x | 4.4x | 3.9x | (9.8%) | (0.8%) | 71.5% |
| Huatian Technology | 16.0 | CNY | 7,938 | 19.5% | 17.5% | 12.4% | 3x | 2x | 2x | 58x | 45x | 37x | n.a. | n.a. | n.a. | (11.0%) | (0.4%) | 42.9% |
| Forehope | 57.6 | CNY | 3,894 | 21.8% | 31.1% | 20.9% | 5x | 4x | 3x | 127x | 78x | 58x | 6.6x | 6.1x | 5.5x | (15.2%) | (1.3%) | 67.4% |
| Mean | 19.7% | 20.0% | 15.5% | 3x | 3x | 2x | 69x | 49x | 38x | 5.1x | 4.6x | 4.1x | ||||||
| Median | 20.7% | 16.7% | 14.4% | 3x | 2x | 2x | 51x | 43x | 35x | 4.9x | 4.4x | 3.9x | ||||||
| China AI GPU thematic players | ||||||||||||||||||
| Hygon | 223.7 | CNY | 77,518 | 55.0% | 39.5% | 31.6% | 23x | 16.7x | 13x | 111x | 74x | 48x | 19.6x | 16.0x | 12.5x | (20.4%) | (20.1%) | 1.7% |
| Cambricon | 1,040.0 | CNY | 97,508 | 178.8% | 112.8% | 33.6% | 36x | 17x | 13x | 99x | 54x | 42x | 36.4x | 23.0x | 15.8x | (4.8%) | (16.1%) | 4.1% |
| MetaX | 461.1 | CNY | 27,479 | 145.9% | 53.5% | 20.5% | 46x | 30x | 25x | n.a. | 350x | 200x | 14.0x | 13.4x | 12.6x | (38.4%) | (33.6%) | -- |
| Illuvatar CoreX | 106.3 | CNY | 3,647 | 190.7% | 206.3% | 45.9% | 8x | 3x | 2x | n.a. | 15x | 8x | 2.1x | 1.8x | 1.5x | (22.6%) | (39.6%) | -- |
| SMIC (H-share) | 61.3 | USD | 90,335 | 26.7% | 13.2% | 9.9% | 8x | 7x | 6x | 58x | 35x | 30x | 9.7x | 7.6x | 6.8x | (13.4%) | (14.4%) | (2.3%) |
| Hua Hong (H-share) | 106.5 | USD | 39,217 | 24.8% | 18.5% | 10.8% | 13x | 11x | 10x | 120x | 68x | 53x | 16.3x | 13.1x | 11.0x | (18.2%) | (23.5%) | 109.2% |
| Mean | 103.6% | 74.0% | 25.4% | 22x | 14x | 11x | 97x | 100x | 63x | 16.4x | 12.5x | 10.0x | ||||||
| Median | 100.5% | 46.5% | 26.0% | 18x | 14x | 11x | 105x | 61x | 45x | 15.2x | 13.3x | 11.7x | ||||||
| Global peers | ||||||||||||||||||
| Amkor | 47.1 | USD | 11,707 | 13.3% | 10.8% | 9.7% | 2x | 1x | 1x | 18x | 20x | 15x | 2.3x | 2.1x | 1.9x | (20.1%) | (43.1%) | 85.1% |
| ASE | 612.0 | TWD | 86,136 | 29.7% | 33.4% | 30.1% | 3x | 2x | 2x | 34x | 21x | 13x | 6.4x | 5.3x | 4.3x | (0.6%) | 3.7% | 266.5% |
| KYEC | 261.5 | TWD | 10,570 | 36.5% | 41.1% | 30.1% | 7x | 5x | 4x | 29x | 19x | 14x | 5.9x | 4.9x | 4.0x | 5.9% | (2.6%) | 65.4% |
| Mean | 26.5% | 28.5% | 23.3% | 4x | 3x | 2x | 27x | 20x | 14x | 4.9x | 4.1x | 3.4x | ||||||
| Median | 29.7% | 33.4% | 30.1% | 3x | 2x | 2x | 29x | 20x | 14x | 5.9x | 4.9x | 4.0x | ||||||
| Back-end Equipment | ||||||||||||||||||
| ASMPT | 154.3 | HKD | 8,251 | 32.7% | 15.0% | 14.6% | 3x | 3x | 3x | 35x | 23x | 16x | 3.6x | 3.3x | 2.9x | (12.3%) | (15.6%) | 117.5% |
| BE Semiconductor | 176.0 | EUR | 16,473 | 67.4% | 42.7% | 9.0% | 14x | 10x | 9x | 41x | 25x | 22x | 18.1x | 12.7x | 9.6x | (24.6%) | (44.5%) | 57.3% |
| Hanmi Semiconductor | 225,000.0 | KRW | 15,920 | 29.9% | 57.5% | 14.7% | 29x | 18x | 16x | 62x | 41x | 36x | 24.4x | 16.6x | 12.2x | (1.7%) | (37.7%) | 147.5% |
| TOWA | 2,105.0 | JPY | 1,023 | 18.0% | 16.7% | 9.4% | 2x | 2x | 2x | 20x | 15x | 14x | 2.0x | 1.8x | 1.6x | (16.2%) | (28.4%) | 8.4% |
| Kulicke & Soffa | 79.5 | USD | 4,158 | 60.7% | 22.4% | n.a. | 3x | 3x | n.a. | 17x | 12x | n.a. | 4.3x | 3.2x | n.a. | (19.8%) | (29.8%) | 105.7% |
| Mean | 38.1% | 31.2% | 12.5% | 10x | 7x | 7x | 36x | 24x | 22x | 10.0x | 7.3x | 6.2x | ||||||
| Median | 31.3% | 27.5% | 14.6% | 7x | 5x | 7x | 37x | 24x | 22x | 6.0x | 4.6x | 4.6x |
Source: Company data, Bloomberg, Morgan Stanley Research. e=Morgan Stanley Research estimates for covered companies, Bloomberg consensus for non-covered companies. Note: Share prices as of Sept 15, 2026.
M
Debate 1: Will China's advanced packaging market face oversupply?
Market view: Unlikely. China remains at the early stage of advanced packaging adoption, while underlying demand is expected to grow rapidly, led by strong domestic AI compute requirements. Looking ahead, structural growth in AI, data centers, cloud computing, autonomous driving and high-end consumer electronics should drive increasing adoption of advanced packaging. Against this backdrop, the market expects demand growth to outpace capacity additions, supporting healthy utilization and favorable industry economics for domestic OSATs.
Our view: Risk of moderate overcapacity. Firstly , more players, intensifying competition , and an attractive growth outlook is drawing more OSATs to enter the market, which could drive capacity ramp-up ahead of demand increase. Secondly , effective demand may be constrained by upstream bottlenecks , including yields at advanced process nodes and the availability of HBM and related components. Thirdly, as domestic accelerator chips migrate toward 3D integration, multiple accelerator dies could be vertically stacked before being packaged alongside HBM. This could reduce the amount of 2.5D packaging required per accelerator die shipped assuming similar die sizes, as more accelerator dies can be integrated within a given 2.5D package.
Where we could be wrong: 1) Domestic AI compute demand scales faster than expected; 2) faster expansion of domestic advanced-node capacity and improved domestic HBM availability; 3) the transition toward 3D integration is slower than expected, resulting in a smaller reduction in 2.5D packaging demand.
Key metrics to monitor: 1) Domestic advanced packaging capacity; 2) domestic advanced node capacity and HBM availability; 3) progress of domestic logic-die 3D stacking technology.
We see a growing risk of moderate overcapacity, particularly in 2.5D packaging. While we remain constructive on the structural growth of China's advanced packaging market, we think the market may be underestimating the pace of domestic capacity additions relative to effective demand. Importantly, we distinguish between strong long-term TAM growth and the near-/medium-term supply-demand balance. A rapidly growing industry can still experience periods of excess capacity if supply is built ahead of customer qualification, upstream component availability and actual accelerator shipments. We see three reasons why this risk could become more visible over the next few years.
First, attractive growth prospects are encouraging increasingly aggressive capacity expansion . Advanced packaging enjoys high gross margin and it has become a strategic focus for incumbent OSATs and new entrants, with multiple domestic players (JCET, Tongfu Micro, Huatian Technology, Forehope etc.) expanding 2.5D/3D-related capacity simultaneously. Companies have an incentive to build ahead of confirmed demand, given long equipment lead times and the strategic importance of securing domestic AI supplychain capacity. This creates a potential timing mismatch. Capacity can ramp relatively
M
quickly once equipment is installed and qualified, while end-demand conversion depends on customer product ramps and utilization. Based on our bottom up analysis, we expect China 2.5D packaging annual capacity to grow to 436k wafers in 2027, up from 120k wafers in 2025, which is around 16% of non-China (TSMC mainly) capacity.
Exhibit 12: China 2.5D advanced packaging supply capacity
Source: Company data, Morgan Stanley Research estimates
Exhibit 13: We expect China 2.5D capacity to reach 16% of global 2.5D capacity in 2027
Source: Company data, Morgan Stanley Research estimates
Second, on the demand side, upstream bottlenecks could constrain effective
packaging demand. The demand-side risk is that the end market demand for AI compute may not translate directly into effective packaging demand. The immediate downstream demand depends on the availability of qualified accelerator dies and HBM. Advanced-node wafer yields are one potential constraint. Domestic AI accelerators increasingly require sophisticated process technologies, and lower yields can reduce the number of knowngood dies available for packaging. We estimate AI GPU shipments by Chinese vendors will reach 4.9mn units in 2027, up from 1.1mn units in 2025. Assuming around 21 chips per wafer and overall yield of 85%, that indicates around 277k wafer demand in 2027.
HBM availability represents another major challenge. High-performance AI accelerators increasingly depend on large amounts of high-bandwidth memory, and shortages in HBM supply could effectively cap package output. In our CXMT initiation report, we estimated 3-4mn unit locally produced HBM units, but that could only support 0.75-1mn units of GPU, with the rest still relying on foreign HBM supply. Other constraints, including on substrates, advanced interconnect materials, thermal solutions and specialized equipment, could have similar effects. In such a scenario, underlying AI demand could remain robust while actual packaging utilization falls short of expectations. This distinction between end demand and effective demand is central to our more cautious industry view.
M
Exhibit 14: We expect China AI GPU shipment to reach ~5mn unit in 2027
Source: Company data, Morgan Stanley Research estimates
Exhibit 15: That translates to around 277k wafer demand in 2027
Source: Company data, Morgan Stanley Research estimates
Exhibit 16: We expect moderate overcapacity of China's 2.5D packaging
Source: Company data, Morgan Stanley Research estimates
Capacity mix is shifting from CoWoS-S-like to CoWoS-L-like solutions
Another important consideration is the mix of 2.5D packaging capacity being built in China. Domestic advanced packaging players have generally started with CoWoS-S-like solutions based on a full silicon interposer, while gradually developing more CoWoS-L-like capabilities as AI packages become larger and more complex. This broadly mirrors the technology evolution seen at TSMC, where CoWoS-S uses a silicon interposer, while CoWoS-L combines an RDL-based interposer with local silicon interconnects to enable greater package scalability and design flexibility. TSMC itself has shifted its development focus toward CoWoS-L as HPC package sizes increase.
This transition could create a capacity-mix mismatch within China's advanced packaging market. CoWoS-S-like capacity is currently more mature domestically and represents a meaningful portion of existing and near-term capacity, whereas CoWoS-L-like capacity remains at an earlier stage of ramp. At the same time, demand from newer generations of
M
high-performance AI accelerators is increasingly moving toward larger and more complex packages, which should favor CoWoS-L-like architectures over time. Recent industry indications suggest domestic CoWoS-L-like products are beginning to enter volume production, while the broader industry is increasingly treating CoWoS-L as the next major technology upgrade for 2.5D packaging.
As a result, we see greater overcapacity risk in CoWoS-S-like capacity than in CoWoS-Llike capacity. S-like demand could begin to moderate as customers migrate toward L-like solutions, potentially leaving some dedicated S-like capacity underutilized even as aggregate advanced packaging demand continues to grow. This distinction is important because headline 2.5D capacity numbers may overstate the supply that is actually suitable for next-generation AI accelerators. A market can therefore simultaneously experience excess S-like capacity and relatively tight L-like capacity.
Domestic players are partly mitigating this risk by building flexibility into portions of their capacity. Where common process modules can support both S-like and L-like flows, capacity initially used for S-like products can potentially be reconfigured toward L-like production as customer demand migrates. This should reduce the risk that all S-like capacity becomes structurally stranded. However, the conversion is unlikely to be completely frictionless, given differences in interposer architecture, process flow, equipment requirements and customer qualification. Therefore, nominally flexible capacity should not necessarily be treated as immediately interchangeable between the two technologies.
The implication for our overcapacity thesis is that the risk may increasingly be one of capacity mix rather than aggregate capacity alone. In the near term, the faster build-out of S-like capacity could result in declining utilization as demand begins to shift toward L-like solutions. Over the medium term, continued growth in L-like demand and the gradual conversion of flexible lines could absorb part of this excess. We would therefore monitor S-like and L-like capacity, utilization and customer qualifications separately, rather than relying solely on aggregate domestic CoWoS-like capacity when assessing the industry's supply-demand balance.
M
Exhibit 17: China 2.5D advanced packaging capacity supply (yearly total, k wafers)
Source: Morgan Stanley Research estimates
Also, the transition from 2.5D toward 3D integration could change the relationship
between accelerator shipments and 2.5D packaging demand . Today, a typical high-end accelerator architecture places compute die(s) and HBM side-by-side on an interposer or equivalent 2.5D platform. As domestic accelerator vendors move toward more advanced 3D architectures, multiple accelerator dies could increasingly be vertically integrated before being packaged alongside HBM. Assuming broadly similar die sizes, this could allow more compute dies to be incorporated within a given 2.5D package footprint, meaning 2.5D packaging demand may grow more slowly than do accelerator die shipments. In other words, rising AI accelerator volumes do not necessarily translate linearly into rising 2.5D packaging units or area over the longer term.
Conclusion
We remain constructive on the structural growth outlook for China's advanced packaging market, while seeing a risk of moderate overcapacity as capacity investment accelerates. The market's bullish view is well supported by rapidly growing domestic AI compute demand, continued semiconductor localization and the increasing importance of advanced packaging in enabling higher system-level performance. Our concern is that effective packaging demand may grow more slowly than AI demand due to component constraints, while industry capacity could expand relatively quickly.
Packaging architecture adds another layer of uncertainty. If domestic AI accelerators increasingly adopt 3D integration, vertically stacking multiple GPU dies could reduce the amount of 2.5D package footprint required per GPU die, assuming broadly stable die sizes and total die volumes.
M
Debate 2: Which vendors are the biggest beneficiaries of China's advanced packaging business?
Market view: OSAT vendors . The market increasingly views advanced packaging as a key technology enabler for domestic AI GPUs, particularly as China's access to advanced node semiconductor production equipment remains constrained. As further transistor scaling becomes more challenging, advanced packaging provides an alternative pathway to enhance system-level performance through chiplets, higher integration density, and higher-bandwidth interconnects. Against this backdrop, OSAT vendors could emerge as key beneficiaries of China's AI compute build-out.
Our view: Equipment vendors. As we discussed in Debate 1, we expect China's advanced packaging to be in a moderate degree of overcapacity over the next few years, so the broad-based capacity build-out could intensify competition, pressure pricing, and constrain gross margin upside. Equipment vendors, by contrast, are better positioned to capture the current capacity expansion cycle. Regardless of whether incremental OSAT capacity ultimately generates attractive returns, the initial capacity build-out requires meaningful equipment investment.
Metrics to monitor: 1) Capex of OSAT vendors; 2) margin trend of OSAT vendors; 3) revenue and earnings growth of OSAT vendors.
Where we could be wrong: 1) Stronger China AI compute demand than our expectation, outpacing the advanced packaging capacity addition, leading to higher gross margin for OSAT vendors; 2) technological breakthrough of OSAT vendors, leading to cost saving and margin expansion.
Equipment vendors are better positioned than OSAT vendors to play China's advanced packaging
In our report on JCET: Slow recovery with share loss; downgrade to UW (Sep 24, 2024), we had already argued that the biggest beneficiaries of China's advanced packaging would be the equipment vendors, rather than the OSAT vendors. Our main argument was that the advanced packaging opportunity for OSAT vendors comes at the expense of higher R&D and capex, weighing on near-term earnings, while the equipment vendors are the beneficiaries from the capex build-up.
What has changed since then is the volume ramp-up of China's AI GPU shipments, and the rising demand for domestic 2.5D advanced packaging demand. As discussed in Debate 1, we see moderate overcapacity as a result, which may intensify competition, pressure pricing, and constrain gross margin upside for OSAT vendors.
Equipment vendors, by contrast, should benefit more directly from the capacity expansion itself. Regardless of whether incremental OSAT capacity ultimately earns an attractive return, building that capacity requires upfront investment in bonding,
M
lithography, deposition, plating, inspection/metrology, wafer handling and other back-end equipment. In other words, OSAT earnings depend on capacity being filled, while equipment revenues depend primarily on capacity being built. This distinction becomes particularly important if our moderate-overcapacity thesis is correct. Aggressive OSAT expansion could be dilutive to industry utilization and pricing while simultaneously creating a strong order environment for equipment suppliers.
Exhibit 18: OSAT capex started to rise from 2024 driven by advanced packaging demand
Exhibit 19: OSAT capex as % of revenue is rising to historical high level
Source: Bloomberg, Morgan Stanley Research. Note: 2026 estimate is Bloomberg consensus estimates
Advanced packaging should also be more equipment-intensive than conventional packaging, providing a second leg to the equipment thesis. The transition toward 2.5D/3D integration requires additional and increasingly sophisticated process steps, including fine-pitch RDL, TSV, wafer-level processing, temporary bonding/debonding, highprecision die placement, thermal compression/hybrid bonding and advanced inspection. As interconnect pitches shrink and package complexity increases, equipment performance becomes increasingly critical to yield and throughput. We therefore expect equipment value per unit of packaging capacity to rise as the domestic industry migrates from conventional packaging toward 2.5D and ultimately 3D integration.
Identifying the key companies among equipment vendors
Source: Bloomberg, Morgan Stanley Research
Key activities
Key
/ tools equipment
Key players in China
Key players overseas
CHINA ADVANCED PACKAGING (BACKEND): KEY STEPS & KEY PLAYERS
M
DIE / INTERCONNECT
ASSEMBLY
Exhibit 20: China's advanced packaging process and key companies
· Die (KGD) electrical test, wafer probing & mapping · Build redistribution layers (RDL), Cu pillar / · Temporary bonding · Wafer thinning / CMP · Saw / laser / plasma dicing or stealth dicing · Die attach to interposer / substrate · Underfill or molding · Cure, planarization · Wafer level test (WLT) or package level test (PLT) · AOI / AXI inspection · Final quality check
• Die sorting and
• Flip-chip, TCB or
ACM Research (ACMR.O, OW) : ACM Research is one of the more direct beneficiaries of China's advanced-packaging capacity build-out because its portfolio addresses several process steps whose equipment intensity rises materially in wafer-level, 2.5D/3D and panel-level packaging, particularly electrochemical plating, cleaning and other wet processes. The exposure is already showing up in reported results: in Q2 2026, ACM's advanced-packaging revenue excluding ECP grew 153% YoY, while its ECP, furnace and other technologies category grew 168% YoY, with management citing ECP and advanced packaging as the key growth drivers. ACM shipped its 2,000th ECP chamber during the quarter, demonstrating an increasingly meaningful installed base across logic, memory and 3D packaging. More importantly for the China capacity-build thesis, ACM received its first production order for a 510×515mm horizontal panel-level electroplating system from an existing advanced-packaging customer in mainland China, moving its panel-level offering closer to volume production. As Chinese OSATs and integrated manufacturers expand 2.5D/3D, fan-out and eventually larger-format panel-level packaging, ACM should benefit from both additional tool demand and increasing process intensity per package, while its local manufacturing, application-development and service infrastructure should support further localization-driven share gains.
ASMPT (0522.HK, OW) : ASMPT should be a major beneficiary of China's advancedpackaging investment through its leading positions in thermo-compression bonding (TCB),
Source: Morgan Stanley Research
• Select good dies for microbumps
MOLDING /
UNDERFILL & FINISH
PACKAGE TEST
(WLT / PLT)
FINAL INSPECTION
& SHIPMENT TEST
M
high-precision flip-chip die bonding and hybrid bonding, technologies that become increasingly critical as AI processors migrate toward larger 2.5D packages, chiplets, HBM and higher-density 3D integration. The operating momentum is already substantial: ASMPT's TCB revenue grew approximately 146% YoY in 2025, while its advancedpackaging business reached a record US$339 million of revenue in 1H 2026, up 17% YoY and representing 30% of group revenue. In July 2026, it received bulk orders for more than 50 chip-to-substrate TCB tools from OSAT customers, highlighting the step-up in equipment requirements as compound die sizes increase for AI workloads. China provides an additional demand vector: ASMPT has reported particularly strong Chinese demand for die- and wire-bonding equipment as domestic AI infrastructure investment and OSAT utilization increase. As Chinese packaging houses move from conventional assembly toward larger packages, finer-pitch interconnects, chip-on-wafer/chip-on-panel architectures and ultimately more TCB and hybrid bonding, equipment value per unit of packaging capacity should rise, creating a favorable mix shift toward ASMPT's highestvalue advanced bonding platforms.
Other major domestic Chinese equipment companies: These span nearly the full advanced-packaging process flow. Circuit Fabology Microelectronics Equipment , or CFMEE (688630.SH; 9630.HK; not covered), provides direct-write lithography for RDL, bumping, TSV and system-on-wafer applications. Its wafer-level packaging tools have secured orders from leading domestic OSATs for large AI packages including CoWoS-like architectures, while its large-format panel-level lithography platform has progressed into customer qualification and commercial orders. Kingsemi (688037.SH; not covered) supplies coat/develop, wafer cleaning, temporary bonding and laser debonding systems specifically designed for advanced packaging and 2.5D/3D integration, giving it exposure to thick-photoresist RDL processes, TSV cleaning and the temporary bond/debond steps required for aggressive wafer thinning. Hwatsing Technology (688120.SH; not covered) is leveraged to CMP, ultra-precision wafer thinning, dicing and wet processing, with its thinning equipment already receiving orders in advanced-memory and Chiplet applications; these steps become increasingly demanding as wafers and dies are thinned for stacked architectures. Skyverse Technology (688361.SH; not covered) provides inspection and metrology equipment, including 3D topography measurement capable of monitoring fineline RDL and TSV-related processes for HBM and 2.5D/3D packaging, a business which could grow through the increase in process-control intensity as package complexity rises. Piotech (688072.SH; not covered) is exposed to the next stage of packaging localization through wafer-to-wafer and die-to-wafer hybrid bonding, surface activation and bonding metrology. Its product portfolio explicitly targets HBM and 3D integration as China moves from conventional packaging localization toward domestic production of the most advanced bonding steps. Collectively, the industry should benefit from the absolute increase in Chinese advanced-packaging capacity and the rising number, precision and value of process steps required per package as the industry migrates toward Chiplets, HBM, 2.5D/3D integration and panel-level packaging.
BE Semiconductor (BESI.AS, OW, covered by Nigel van Putten) : Besi is particularly well positioned for China's move into higher-end 2.5D and 3D packaging because its core franchise is concentrated in the high-accuracy die-placement technologies that become increasingly important as interconnect pitches shrink, including advanced flip-chip, thermo-compression and hybrid bonding. The China linkage is unusually explicit: Besi has cited a 'significant increase' in demand from Chinese subcontractors as the country builds
M
out AI-related infrastructure, while its 2025 annual report identified seven planned advanced-packaging fab projects in China representing approximately US$6.3 billion of investment. This capacity expansion coincides with a favorable technology transition for Besi, as customer roadmaps point toward greater adoption of hybrid bonding and TC Next across HBM4/4E, ASICs, high-performance computing and co-packaged optics. Current results already demonstrate the strength of this cycle, with Q2 2026 revenue up 69% YoY and orders up 129% YoY, driven particularly by hybrid bonding, datacenter and other AIrelated applications. China therefore offers Besi two layers of upside: more absolute advanced-packaging capacity and a shift toward increasingly precise, equipment-intensive bonding architectures where Besi has its strongest competitive positioning. Key risks: 1) hybrid bonding adoption more limited than expected; 2) strength in core business fades; 3) FX headwinds pressure margins
Among Japanese vendors , DISCO (6146.T; OW; covered by Suzune Tamura) is one of the clearest beneficiaries through its leading position in precision wafer grinding, thinning and dicing, process steps that become increasingly important as HBM, chiplets and 2.5D/3D architectures require thinner wafers and more complex singulation. Its portfolio extends to large-format panel dicing as fan-out and panel-level packaging scale. Key risks: 1) sharp slowdown in AI semiconductor investment; 2) weakening in consumer demand.
TOWA (6315.T; EW; covered by Yoshihito Hasegawa) is similarly well positioned through compression molding and molded-underfill equipment used in HBM, chiplet, 2.5D/3D and panel-level packaging, with continued investment by Asian OSATs and memory manufacturers supporting demand for its higher-end molding platforms. TOWA, which has strong competitiveness in molding equipment, recently began sales of its next-generation compression molding system, INNOMS. The system was developed with the goal of reducing mass production costs by approximately 50%. Compared with conventional models, it reduces installation space by 40%, power consumption by around 50%, and consumables usage by approximately 25%. The company plans to deploy the system across a wide range of applications, including memory and logic devices. Key risks: stagnant chip/SPE market; heightened geopolitical risk; reduced China demand; stall in tech advances; slow sales expansion for cutting-edge package/HBM equipment, loss of tech edge due to market changes, margin decline.
Kulicke & Soffa (NASDAQ: KLIC; not covered) offers thermo-compression and emerging hybrid-bonding platforms for logic and HBM and has an established Chinese OSAT customer base. The geographic mix of its current advanced-bonding orders is not disclosed.
M
Debate 3: Besides 2.5D packaging, how much upside can emerging advanced-packaging technologies contribute to China OSATs?
Market view: 3DIC, HBM packaging, CPO could be meaningful drivers. The market is increasingly pricing in meaningful incremental opportunities for Chinese OSATs from next-generation packaging technologies including 3DIC, HBM and CPO, with each potentially creating a sizable new revenue pool as domestic AI infrastructure scales.
Our view: More cautious on the near-term earnings contribution . While all three technologies are strategically important, we believe commercialization remains constrained by either cost, customer ownership of packaging, or technology maturity. As a result, we see the current advanced-packaging earnings story as being driven primarily by 2.5D/CoWoS-type capacity expansion, while 3DIC, HBM and CPO remain mostly medium- to long-term optionality.
Metrics to monitor: 1) Customer qualification and volume-production milestones; 2) dedicated capacity additions; 3) utilization rates; and 4) disclosed revenue contribution from these new technologies.
Where we could be wrong: 1) OSAT technology breakthrough which lower the cost of 3DIC; 2) accelerating HBM outsourcing together with OSAT HBM packaging capability improvement; 3) CPO yield improves faster than expected together with OSAT CPO packaging capability improvement.
3DIC
3DIC - China could over-index in adoption, but high cost remains the key constraint.
TSMC remains the global leader in 3DIC through its SoIC platform, although SoIC capacity is still small relative to its CoWoS footprint. AMD and Apple are the major customers of TSMC SoIC capacity with Nvidia's share increasing next year. China, meanwhile, is seeing a growing number of early 3DIC implementations across edge AI and mobile.
- Rockchip's RK1820 integrates high-bandwidth on-chip DRAM with an NPU, with industry sources describing the memory implementation as a 3D-stacked architecture;
- Xiaomi's recently announced XRING O100 AI accelerator reportedly uses 6nm wafer-to-wafer stacking and hybrid bonding to deliver 1.22TB/s memory bandwidth
- Dongfang Suanxin's DF1000 adopts DRAM-on-logic wafer-level hybrid bonding for near-memory AI computing.
- Huawei launched the Kirin 9050 Pro in September 2026 for the Mate XT 2, the first high-performance processor to use logic folding technology. The design stacks logic units across layers and connects them vertically, shortening signal paths to reduce latency and improve performance.
M
ps™ns
Device
We view Kirin 9050 Pro as potentially the most meaningful domestic proof point given its deployment in a commercial flagship smartphone, the annual sell-through of Huawei Mate XT (using Kirin 9020 chip) is around 300-400k unit in past year. Therefore, we estimate China's 3DIC market will remain at only tens of millions of US dollars over the next 2-3 years. A meaningful expansion in TAM would require either tens of millions of units in consumer electronics applications or million-unit volumes of high-ASP AI accelerators.
TOP Die
Exhibit 21: LogicFolding for Huawei's mobile SoC
Source: Huawei.
The key limitation, in our view, is cost . A true 3D logic stack adds substantially more manufacturing content than conventional packaging: additional active dies/wafers must be fabricated and tested, followed by wafer thinning, CMP/surface preparation, TSV or backside interconnect processing, high-precision alignment, hybrid bonding and significantly more inspection/metrology. More importantly, the economics are highly sensitive to compound yield-a defective die or poor bond can destroy value already embedded in another known-good die. Industry cost studies therefore identify incoming wafer cost and yield loss as major drivers of 3D hybrid-bonding economics, rather than the bonding tool itself. This makes 3DIC very different from conventional OSAT packaging. The package is increasingly incorporating fab-like process steps and expensive processed silicon, meaning the absolute packaging/integration cost can rise materially even if hybridbonding unit costs decline with scale. This is also why global adoption has so far concentrated in products for which performance per watt, bandwidth or form factor can justify the premium-AMD HPC/AI, Apple's high-end M-series and, increasingly, high-value AI accelerators-rather than broad-based semiconductor applications.
M
Exhibit 22: TSMC SoIC capacity
Source: Company data, Morgan Stanley Research estimates
Exhibit 23: TSMC SoIC demand breakdown by customers
Source: Company data, Morgan Stanley Research estimates
China could nevertheless adopt 3DIC more aggressively than global economics alone would imply, as advanced packaging partly substitutes for constrained front-end
scaling . Huawei's -scaling roadmap is the clearest example: Rather than relying purely on geometric transistor scaling, Huawei is explicitly using LogicFolding to shorten signal paths and increase effective transistor density, with the company targeting density equivalent to a 1.4nm-class process by 2031 through system-, circuit- and packaging-level innovation. This is particularly relevant in China, where restricted access to EUV and leading-edge process technology makes architectural and packaging workarounds comparatively more valuable.
HBM
HBM - strong volume opportunity, but limited incremental value capture for OSATs
for now. HBM is arguably the largest potential packaging-related demand pool given rapid AI accelerator growth, but the key debate is who captures the packaging value. CXMT is currently developing domestic HBM capabilities. In our CXMT initiation report, we estimate CXMT can produce 3-4mn units of HBM3E stacks in 2027. However, packaging is currently largely retained within the memory ecosystem, including through affiliated packaging capabilities such as Xinputianying, limiting the immediate addressable market for independent OSATs. Outsourcing could increase as technology matures and volumes scale, but we would view this primarily as a volume-transfer opportunity rather than a major structural uplift in OSAT value capture unless independent OSATs are able to take on higher-value TSV / stacking / advanced integration steps.
LULU lU rUn WOlTlHI LULO
HBM TSV capacity
M
Exhibit 24: CXMT to ramp up HBM capacity from 20k wpm in 2026 to 70k wpm in 2028
(kwpm)
CAIIVAA AMARANNIAATA AINAN VANIANIAAAAIAN AAIMATAA
Source: Company data, Morgan Stanley Research estimates.
nom mlainel ml zuzu anlu cuzl m temtno ut bil ommpinelll
HBM Market Shares estimates
3.8%
48%
56%
Exhibit 25: CXMT's HBM to account for 3.8%/4.4% if the total HBM market in 2026 and 2027 in terms of bit shipment
2023
Source: Companv data. Morgan Stanlev Research estimate.
Source: Company data, Morgan Stanley Research estimates.
CPO - attractive long-term TAM, but unlikely to move near-term earnings. CPO could eventually create a meaningful new integration opportunity for OSATs as AI clusters migrate toward higher-bandwidth and lower-power optical interconnects. However, the technology remains relatively immature, with fiber alignment, thermal management, testing and supply-chain integration still key bottlenecks. Industry forecasts generally point to initial volume production beginning around 2026, but large-scale deployment is more likely in 2027-28, suggesting limited contribution to China OSAT earnings over the next 1-2 years. We therefore see CPO as a credible long-term optionality rather than a near-term earnings catalyst.
4.4%
39%
48%
55%
M
JCET: Upgrade to Overweight; advanced packaging share gain and business diversification
JCET to emerge as a meaningful share gainer in China's 2.5D/CoWoS-like advanced packaging .
- JCET is effectively building its 2.5D business from a low base, leaving substantial room for incremental share gains in a market currently highly concentrated: SJ Semiconductor (SJSemi) held c.85% of China's 2.5D packaging market by revenue in 2024. JCET Microelectronics (Jiangyin), the group's key high-end advanced packaging facility, only began volume ramp-up recently, but the trajectory is encouraging. Revenue reached Rmb212mn in 1H26, while net losses narrowed to Rmb89mn, with utilization continuing to improve. Management expects the business to turn profitable in 2027, while we estimate capacity could reach ~5kwpm by end-2027, providing meaningful headroom for 2.5D revenue and share expansion.
- Customer visibility is improving: JCET already has an anchor CSP customer, while qualification and ramp-up with additional customers are progressing. Management has highlighted a rich pipeline of customer projects and expects the Jiangyin 2.5D business to scale to Rmb billions of annual revenue over the next 1-2 years.
- JCET is broadening its advanced-packaging footprint beyond its existing Jiangyin capacity. The recently announced Rmb7.8bn high-end advanced packaging facility in Shanghai Lingang should provide a second leg of capacity growth, with the company also building capabilities across CPO, panel-level packaging, 2.5D/3D integration and other next-generation technologies.
Taken together, we see JCET transitioning from a relatively small participant to an increasingly scaled supplier in domestic 2.5D advanced packaging, supported by capacity ramp, customer diversification and technology expansion, which should translate into structural market-share gains over the medium to long term.
Exhibit 26: JME (Jiangyin) revenue and net profit trend
Exhibit 27: JCET - 2.5D packaging capacity projection
Source: Company data
Source: Company data, Morgan Stanley Research estimates
JCET is accelerating its business mix diversification away from traditional communications and consumer electronics toward higher-growth, higher-value-added computing and automotive applications . In 1H26, computing revenue grew 40.4% YoY,
M
with its revenue contribution rising sharply to 30% from 22% in 1H25, making computing JCET's largest end-market for the first time. Automotive revenue increased 25.0% YoY to Rmb2bn, with its revenue mix expanding to 11% from 9%. We expect this diversification to continue. JCET's dedicated Lingang automotive packaging facility commenced production in March 2026 and entered volume production in 2Q26. As equipment installation, customer qualification and product ramps progress, incremental capacity should support a continued increase in automotive revenue contribution. In computing, JCET is stepping up capacity and R&D investment across the AI data-center value chain, covering compute, power, storage and interconnect, while continuing to scale advanced packaging platforms such as XDFOI and developing next-generation technologies including CPO.
Exhibit 28: Computing and automotive mix continue to grow
Exhibit 29: Surging capex for advanced packaging
Source: Company data
Source: Company data, Morgan Stanley Research estimates
Domestic market share gain driven by mix upgrade, rather than price-led competition .
In 2025, JCET's China revenue increased ~22% YoY to Rmb8.3bn, outpacing domestic revenue growth at key OSAT peers, including Tongfu Microelectronics at 15% YoY and Huatian Technology at 18% YoY. More importantly, JCET achieved this above-peer growth alongside a 6.6ppt YoY expansion in domestic gross margin to 20.4%, versus only modest margin improvement at Huatian and broadly flat/down margins at Tongfu. This combination of accelerating revenue growth and sharply improving profitability suggests that JCET is not gaining share through aggressive pricing. Rather, we believe it points to structural share gains in higher-value-added segments such as computing, automotive, and industrial applications.
M
Exhibit 30: 2025 China market sales growth, JCET the highest among China OSAT
Source: Company data
Exhibit 31: JCET domestic market gross margin improved 6ppt in 2025
Source: Company data
Key downside risks to our OW view
- The global economy heads into recession, which leads to deteriorating demand for smartphones, PCs and consumer electronics.
- JCET has limited technology breakthrough, which leads to the slower ramp-up of its 2.5D/3D advanced packaging.
- Peers become more aggressive on pricing and JCET loses market share among local customers.
M
JCET: Estimate revisions and quarterly financials
We raise our 2026/27/28 EPS estimates by 2%/3%/12% : We raise our sales forecasts to reflect strong AI and AI peripheral chips demand, and we raise our gross margin assumptions because of favorable OSAT pricing, we also increase the interest expense as the company issued bonds to fund its capacity expansion.
Exhibit 32: JCET: Estimate revisions summary
| (Rmb mn) | New 2026e | Old 2026e | Diff.% | New 2027e | Old 2027e | Diff.% | New 2028e | Old 2028e | Diff.% |
|---|---|---|---|---|---|---|---|---|---|
| Net sales | 44,311 | 43,066 | 3% | 51,375 | 47,702 | 8% | 59,837 | 54,933 | 9% |
| Gross profit | 6,994 | 6,556 | 7% | 8,279 | 7,637 | 8% | 9,931 | 8,692 | 14% |
| Operating profit | 3,154 | 3,027 | 4% | 4,301 | 4,057 | 6% | 5,535 | 4,785 | 16% |
| Pretax income | 2,826 | 2,819 | 0% | 4,078 | 3,975 | 3% | 5,314 | 4,740 | 12% |
| Net income | 2,628 | 2,586 | 2% | 3,670 | 3,578 | 3% | 4,783 | 4,266 | 12% |
| EPS | 1.47 | 1.45 | 2% | 2.05 | 2.00 | 3% | 2.67 | 2.38 | 12% |
| Margins | |||||||||
| Gross margin | 15.8% | 15.2% | 16.1% | 16.0% | 16.6% | 15.8% | |||
| Operating margin | 7.1% | 7.0% | 8.4% | 8.5% | 9.3% | 8.7% | |||
| Pretax margin | 6.4% | 6.5% | 7.9% | 8.3% | 8.9% | 8.6% | |||
| Net margin | 5.9% | 6.0% | 7.1% | 7.5% | 8.0% | 7.8% |
Source: Morgan Stanley Research estimates
Exhibit 33: JCET: Quarterly earnings summary
| (Rmb mn) | 1Q25 | 2Q25 | 3Q25 | 4Q25 | 1Q26 | 2Q26 | 3Q26e | 4Q26e | 2025 | 2026e | 2027e | 2028e |
|---|---|---|---|---|---|---|---|---|---|---|---|---|
| Total Revenues | 9,335 | 9,270 | 10,064 | 10,202 | 9,171 | 10,356 | 12,277 | 12,507 | 38,871 | 44,311 | 51,375 | 59,837 |
| Q/Q% | -15.0% | -0.7% | 8.6% | 1.4% | -10.1% | 12.9% | 18.5% | 1.9% | ||||
| Y/Y% | 36.4% | 7.2% | 6.0% | -7.1% | -1.8% | 11.7% | 22.0% | 22.6% | 8.1% | 14.0% | 15.9% | 16.5% |
| Cost of Sales | (8,156) | (7,944) | (8,630) | (8,643) | (7,837) | (8,732) | (10,301) | (10,447) | (33,372) | (37,317) | (43,096) | (49,906) |
| Percent of Revenues | 87.4% | 85.7% | 85.7% | 84.7% | 85.5% | 84.3% | 83.9% | 83.5% | 85.9% | 84.2% | 83.9% | 83.4% |
| Gross Profit before dep and amort | 2,009 | 2,151 | 2,382 | 2,520 | 2,174 | 2,572 | 3,020 | 3,406 | 9,062 | 11,171 | 12,352 | 14,004 |
| Percent of Revenues | 21.5% | 23.2% | 23.7% | 24.7% | 23.7% | 24.8% | 24.6% | 27.2% | 23.3% | 25.2% | 24.0% | 23.4% |
| Gross Profit | 1,179 | 1,327 | 1,434 | 1,559 | 1,334 | 1,624 | 1,975 | 2,061 | 5,499 | 6,994 | 8,279 | 9,931 |
| Gross Margin | 12.6% | 14.3% | 14.3% | 15.3% | 14.5% | 15.7% | 16.1% | 16.5% | 14.1% | 15.8% | 16.1% | 16.6% |
| Incremental Margins | 17.4% | NM | 13.6% | NM | 21.8% | 24.4% | 18.3% | NM | 27.6% | 27.5% | 18.2% | 19.5% |
| Total Opex | (804) | (867) | (901) | (917) | (891) | (921) | (911) | (1,117) | (3,489) | (3,840) | (3,979) | (4,396) |
| Percent of Revenues | 8.6% | 9.3% | 9.0% | 9.0% | 9.7% | 8.9% | 7.4% | 8.9% | 9.0% | 8.7% | 7.7% | 7.3% |
| Operating Income | 375 | 460 | 533 | 642 | 443 | 703 | 1,064 | 944 | 2,011 | 3,154 | 4,301 | 5,535 |
| Operating margin | 4.0% | 5.0% | 5.3% | 6.3% | 4.8% | 6.8% | 8.7% | 7.5% | 5.2% | 7.1% | 8.4% | 9.3% |
| Total Non-operating Income(Loss) | (104) | (158) | 75 | (85) | (138) | (114) | (39) | (37) | (272) | (329) | (223) | (221) |
| Percent of Revenues | -1.1% | -1.7% | 0.7% | -0.8% | -1.5% | -1.1% | -0.3% | -0.3% | -0.7% | -0.7% | -0.4% | -0.4% |
| Profit Before Taxes | 271 | 302 | 609 | 557 | 305 | 588 | 1,025 | 906 | 1,738 | 2,826 | 4,078 | 5,314 |
| Percent of Revenues | 2.9% | 3.3% | 6.0% | 5.5% | 3.3% | 5.7% | 8.4% | 7.2% | 4.5% | 6.4% | 7.9% | 8.9% |
| Taxes | (67) | (37) | (126) | 62 | (26) | (45) | (79) | (70) | (168) | (220) | (408) | (531) |
| Tax Rate | 24.6% | 12.4% | 20.7% | -11.1% | 8.7% | 7.7% | 7.7% | 7.7% | 9.7% | 7.8% | 10.0% | 10.0% |
| Net Income, Cont Ops | 204 | 265 | 483 | 619 | 279 | 543 | 947 | 837 | 1,570 | 2,605 | 3,670 | 4,783 |
| Cumulative Effects | 0 | 0 | 0 | 0 | 0 | 0 | 0 | 0 | 0 | 0 | 0 | 0 |
| Minority Interest | 1 | (3) | (0) | 7 | (11) | (11) | 0 | 0 | 5 | (23) | 0 | 0 |
| Reported Income | 203 | 267 | 483 | 611 | 290 | 554 | 947 | 837 | 1,565 | 2,628 | 3,670 | 4,783 |
| Percent of Revenues | 2.2% | 2.9% | 4.8% | 6.0% | 3.2% | 5.4% | 7.7% | 6.7% | 4.0% | 5.9% | 7.1% | 8.0% |
| Change vs Year Ago | 50.4% | -44.8% | 5.7% | 14.7% | 42.7% | 107.3% | 96.0% | 36.8% | -2.8% | 67.9% | 39.6% | 30.3% |
| Reported EPS (Rmb) | 0.11 | 0.15 | 0.27 | 0.34 | 0.16 | 0.31 | 0.53 | 0.47 | 0.87 | 1.47 | 2.05 | 2.67 |
| Q/Q% | 31.5% | 80.6% | -52.5% | 91.0% | ||||||||
| -61.9% | -44.8% | 26.6% | 70.8% | -11.6% | ||||||||
| Y/Y% | 50.4% | 5.7% | 14.7% | 42.7% | 107.3% | 96.0% | 36.8% | -2.8% | 67.9% | 39.6% | 30.3% |
Source: Company data, Morgan Stanley Research. e = Morgan Stanley Research estimates
JCET: Valuation methodology
We raise our price target to Rmb90.2 : This reflects the changes in our earnings estimates and increased intermediate growth rate to 19.0% up from 13.5% mainly because of increasing mix from AI-related advanced packaging. We continue to derive our price target using the base-case value from a residual income (RI) model. All of our key assumptions are unchanged, including a cost of equity of 8.6% (beta of 1.2, risk premium of 5.5%, and risk-free rate of 2.0%), and a terminal growth rate of 4.0%.
M
Exhibit 34: JCET: RI model
| 2026e | 2027e | 2028e | 2029e | 2030e | 2031e | 2032e | 2033e | 2034e | 2035e | 2036e | 2037e | |
|---|---|---|---|---|---|---|---|---|---|---|---|---|
| Total Equity | 32,127 | 35,406 | 39,644 | 44,197 | 49,615 | 56,063 | 63,736 | 72,867 | 83,733 | 96,663 | 112,050 | 130,360 |
| Net Profit | 2,628 | 3,670 | 4,783 | 5,692 | 6,773 | 8,060 | 9,591 | 11,414 | 13,582 | 16,163 | 19,234 | 22,888 |
| ROAE | 8.5% | 10.9% | 12.7% | 13.6% | 14.4% | 15.3% | 16.0% | 16.7% | 17.3% | 17.9% | 18.4% | 18.9% |
| Residual Income | (31) | 729 | 1,468 | 1,973 | 2,581 | 3,301 | 4,155 | 5,169 | 6,373 | 7,803 | 9,503 | 11,523 |
| Spread | -0.1% | 2.3% | 4.1% | 5.0% | 5.8% | 6.7% | 7.4% | 8.1% | 8.7% | 9.3% | 9.8% | 10.3% |
| Ending Equity Capital | 32,127 | |||||||||||
| PV of Forecast Period | 24,103 | |||||||||||
| PV of Continuing Value | 105,126 | |||||||||||
| Equity Value | 161,356 | |||||||||||
| No. of Shares | 1,789 | |||||||||||
| Projected Price (Rmb) | 90.2 |
Source: Morgan Stanley Research estimates.
Bull/bear case discussion
Our bull case value is Rmb147.7 (up from Rmb81.9) : In this scenario, we expect fast ramp-up of 2.5D/3D packaging business.
Our bear case value is Rmb60.6 (up from Rmb33.6) : In this scenario, we expect slower ramp-up of 2.5D/3D packaging business.
The magnitude of our bull and bear scenario value changes is in line with our base-case value change.
Source: Factset, Morgan Stanley Research estimates
Source: Factset, Morgan Stanley Research estimates
M
Risk Reward - JCET Group Co Ltd (600584.SS) Risk Reward - JCET Group Co Ltd (600584.SS)
Gaining share in AI GPU packaging
Rmb90.20 PRICE TARGET
Base case, residual income model. We assume a cost of equity of 8.6% (risk free rate of 2%, equity risk premium 5.5% and beta of 1.2%), an intermediate growth rate of 19.0%, and a terminal growth rate of 4.0%.
Rmb95.38
| Consensus Price Target Distribution | Rmb50.00 | Rmb135.00 | |
|---|---|---|---|
| MS PT | |||
| Source: Refinitiv, Morgan Stanley Research | Mean | Morgan Stanley Estimates |
RISK REWARD CHART
Key:
Source: Refinitiv, Morgan Stanley Research
BULL CASE
Rmb147.70
7.5x 2027e BVPS (72x 2027e EPS)
Revenue growth accelerate strongly in
2026: JCET's revenue grows strongly in 2026. JCET enjoys further share gains among both global tier-1 and Chinese customers thanks to advanced packaging ramp-up and improved technology. JCET's share increases meaningfully in the global OSAT market.
BASE CASE
Rmb90.20
4.6x 2027e BVPS (44x 2027e EPS)
Revenue growth accelerates in 2026: 1)
JCET's revenue grows 14% in 2026; 2) pricing in the OSAT segment rises mildly; 3) advanced packaging (2.5D/3D) revenue grows to 5% of mix in 2027.
OVERWEIGHT THESIS
- We expect JCET to be a market share gainer in China's AI GPU advanced packaging industry.
- OSAT companies have hiked prices to reflect higher raw material prices. Overall utilization is high and pricing is favorable, so margins could improve in 2026/27.
- JCET is diversifying its business from
consumer and communication to more highvalue add compute and automotive markets.
Pricing Power:
Positive
Secular Growth:
Positive
View descriptions of Risk Rewards Themes here
Rmb60.60
3.1x 2027e BVPS (30x 2027e EPS)
BEAR CASE
Overall semiconductor downturn : 1) JCET's revenue remains flat in 2026; 2) pricing in the OSAT segment declines; 3) advanced packaging (2.5D/3D) revenue is below 3% of mix in 2027.
M
Risk Reward - JCET Group Co Ltd (600584.SS)
KEY EARNINGS INPUTS
| Drivers | Dec 2025 | Dec 2026e | Dec 2027e | Dec 2028e |
|---|---|---|---|---|
| Gross Margin (%) | 14.1 | 15.8 | 16.1 | 16.6 |
| Revenue from JCET (Rmb, mn) | 17,159 | 17,247 | 17,330 | 17,422 |
| Revenue from STATS (Rmb, mn) | 9,680 | 12,797 | 16,916 | 22,362 |
INVESTMENT DRIVERS
- 2.5D advanced packaging capacity ramp-up
- OSAT pricing
GLOBAL REVENUE EXPOSURE
Source: Morgan Stanley Research Estimate View explanation of regional hierarchies here
MS ALPHA MODELS
5/5
MOST
3 Month
Horizon
Source: Refinitiv, FactSet, Morgan Stanley Research; 1 is the highest favored Quintile and 5 is the least favored Quintile
RISKS TO PT/RATING
RISKS TO UPSIDE
- Better-than-expected demand for communications, computing, and consumer electronics
- Providing 2.5D/3D advanced packaging sooner than we expect
- Faster-than-expected share gains
RISKS TO DOWNSIDE
- Worse-than-expected demand for communications, computing, and consumer electronics
- Providing 2.5D/3D advanced packaging later than we expect
- Slower-than-expected share gains
OWNERSHIP POSITIONING
Inst. Owners, % Active
54.2%
Source: Refinitiv, Morgan Stanley Research
MS ESTIMATES VS. CONSENSUS
M
JCET: Financial summary
Exhibit 37: JCET: Financial summary
Income Statement
Rmb mn (Years End Dec )
Net sales
COGS
Depreciation Expense
Variable Cost
Gross profit
Operating expenses
Operating income
Non-operating income
Pre-tax income
Income tax
Minority Interests
Reported net Income
Adj.wtd.avg.shrs( m)
Reported EPS (Rmb)
Modelware EPS (Rmb)
Balance Sheet
Rmb mn (Years End Dec )
Cash
Mkt Securities
AR/NR
Inventory
Other
Current Assets
Long-term investments
Fixed assets
Other assets
Total Assets
S/T borrowings
AP/NP
Other ST liabilities
LT debt
Other LT liabilities
Total Liabilities
Common stocks
Preferred stocks
Capital Researve
Retained earning
Minority
Total Equity
Total Liab. & Shrhldr's Equity
2025
38,871
(33,372)
(3,562)
(29,810)
5,499
(3,489)
2,011
(272)
1,738
(168)
5
1,565
1,789
0.87
0.87
2025
8,887
2,104
5,483
3,604
815
20,894
802
24,622
6,506
52,824
1,834
6,679
4,315
8,077
2,186
23,093
1,789
0
15,234
10,783
1,925
29,732
52,824
e = Morgan Stanley Research Estimates
Source: Morgan Stanley Research, Company Data
Source: Company data, Morgan Stanley Research. e = Morgan Stanley Research estimates.
2026e
44,311
(37,317)
(4,177)
(33,140)
6,994
(3,840)
3,154
(329)
2,826
(220)
(23)
2,628
1,789
1.47
1.47
2026e
8,336
2,104
5,954
5,491
783
22,669
802
29,485
6,506
59,462
1,834
8,995
5,500
8,819
2,186
27,335
1,789
0
15,234
13,178
1,925
32,127
59,462
2027e
51,375
(43,096)
(4,073)
(39,023)
8,279
(3,979)
4,301
(223)
4,078
(408)
0
3,670
1,789
2.05
2.05
2027e
8,702
2,104
6,903
6,366
808
24,884
802
32,970
6,506
65,162
1,834
10,388
5,785
9,561
2,186
29,755
1,789
0
15,234
16,458
1,925
35,406
65,162
2028e
59,837
(49,906)
(4,073)
(45,833)
9,931
(4,396)
5,535
(221)
5,314
(531)
0
4,783
1,789
2.67
2.67
2028e
10,073
2,104
8,040
7,415
837
28,470
802
36,341
6,506
72,119
1,834
12,030
6,122
10,303
2,186
32,475
1,789
0
15,234
20,695
1,925
39,644
72,119
Cash Flow Statement
Rmb mn (Years End Dec )
Cashflow from Operations
Net profits
Depreciation
Working Capital Change
Other adjustments
Cashflow from Investing
Capex
Change of LT Investment
Change of ST Investment
Other adjustments
Cashflow from financing
Increase in L/T debt
Increase in S/T debt
Cash Dividend Paid
Dir& Emp Bonus Paid
Other adjustments
Exchange rate adjustment
Net change in cash
2025
4,652
1,565
3,966
163
(1,042)
(9,056)
(6,246)
(1,234)
0
(1,577)
732
732
0
(596)
0
596
3,217
-455
2026e
8,640
2,628
4,837
(41)
1,217
(9,700)
(9,700)
0
0
0
509
732
0
(233)
0
10
(0)
-551
2027e
8,215
3,670
4,716
(432)
261
(8,200)
(8,200)
0
0
0
351
732
0
(391)
0
10
0
366
2028e
9,375
4,783
4,830
(544)
307
(8,201)
(8,201)
0
0
0
196
732
0
(545)
0
10
0
1,371
| Financial Ratios | 2025 | 2026e | 2027e | 2028e |
|---|---|---|---|---|
| Growth(%) | ||||
| Turnover | 8.1 | 14.0 | 15.9 | 16.5 |
| Operating profits | 11.8 | 56.9 | 36.3 | 28.7 |
| Pretax profits | 5.4 | 62.5 | 44.3 | 30.3 |
| Net profits | -2.8 | 67.9 | 39.6 | 30.3 |
| EPS | -2.8 | 67.9 | 39.6 | 30.3 |
| Margins (%) | ||||
| Gross Margin | 14.1 | 15.8 | 16.1 | 16.6 |
| Operating Margin | 5.2 | 7.1 | 8.4 | 9.3 |
| EBITA Margin | 13.6 | 15.8 | 15.9 | 15.7 |
| Pretax Margin | 4.5 | 6.4 | 7.9 | 8.9 |
| Net Profit | 4.0 | 5.9 | 7.1 | 8.0 |
| Return (%) | ||||
| ROAE | 5.3 | 8.5 | 10.9 | 12.7 |
| ROAA | 2.9 | 4.7 | 5.9 | 7.0 |
| Gearing (%) | ||||
| Net Debt/Equity | 3.4 | 7.2 | 7.6 | 5.2 |
| Liabilities/Equity | 77.7 | 85.1 | 84.0 | 81.9 |
| Ratios (X) | ||||
| Current ratio | 1.6 | 1.4 | 1.4 | 1.4 |
| Quick ratio | 1.1 | 0.9 | 0.9 | 0.9 |
| Others | ||||
| AR/NR Turnover (days) | 49 | 49 | 49 | 49 |
| Inventory Turnover (days) | 35 | 35 | 37 | 42 |
| AP Turnover (days) | 88 | 88 | 88 | 88 |
| Cash Conversion (days) | -3 | -4 | -1 | 3 |
M
SJ Semi: Leading advanced packaging player, with premium valuation
We initiate coverage on SJ Semi with Equal-weight and a price target of Rmb118.4 . SJ
Semi is a leading advanced packaging vendor in China and the No.1 player in domestic 2.5D packaging, with c.77% market share in 2025. We expect the company to be a key beneficiary of strong China AI GPU demand and increasing adoption of chiplet/ heterogeneous integration, driving 25% revenue CAGR over 2025-28, with a rising 2.5D mix supporting a structurally superior margin profile versus domestic OSAT peers. However, we see a more balanced risk-reward at current valuation. Aggressive capacity expansion by domestic peers could pressure SJ Semi's market share, pricing, and utilization, while high customer concentration and potential bottlenecks in HBM supply add uncertainty to the pace of growth. We believe the stock's premium valuation already reflects its technology leadership and strong advanced-packaging growth outlook, supporting our Equal-weight rating
Investment Positives
A key beneficiary of China's advanced packaging growth . We see SJ Semi as a key beneficiary of the rapid development of China's AI computing ecosystem, in which advanced packaging has become an increasingly critical part of the AI GPU supply chain as chiplet architectures and heterogeneous integration gain adoption. According to CIC, China's advanced packaging market is expected to grow to Rmb100bn in 2029 at 13% CAGR (2025-29), while the chiplet/multi-chip integration segment is expected to expand to Rmb17.7bn in 2029 at 40% CAGR (2025-29). Beyond AI GPUs, advanced packaging demand is also growing across data centers, autonomous driving, smartphones and communications applications, providing SJ Semi with diversified structural growth drivers. Given its leading position in China's 2.5D packaging market, we expect SJ Semi to capture this strong industry beta and deliver 25% revenue CAGR over 2025-28.
Exhibit 38: China advanced packaging TAM is expected to grow to Rmb100bn in 2029 with chiplet 2.5D at 40% CAGR
Exhibit 39: SJ Semi revenue is expected to grow 25% CAGR (2025-28)
Source: CSIA, CIC
Source: Company data, Morgan Stanley Research estimates
Leading position in China's advanced packaging market with a structurally superior margin profile. SJ Semi has established a leading position in China's advanced packaging
M
market, particularly in 2.5D packaging. In particular, the company ranked No.1 in China's 2.5D packaging market with c.77% market share in 2025, while its 12-inch bumping business also ranked No.1 in China, underscoring its leadership across key advanced packaging platforms. We believe SJ Semi is well positioned to benefit from the accelerating adoption of 2.5D/3D packaging driven by AI/HPC demand. Importantly, the increasing revenue mix from 2.5D packaging should support a structurally higher gross margin versus local OSAT peers, given the higher technical barriers and value-add of 2.5D packaging. SJ Semi delivered a c.30% gross margin in 1H26, materially above major domestic peers such as JCET, Tongfu Microelectronics and Huatian Technology, which were generally in the low-to-mid teens. We expect continued 2.5D ramp-up to drive revenue growth and sustained margin outperformance versus domestic peers.
Exhibit 40: SJ Semi's dominant position in China's 2.5D packaging industry (2025)
Exhibit 41: SJ Semi's gross margin higher than its peers due to increasing mix from 2.5D packaging
Source: Company data, Morgan Stanley Research
Source: Company data, Morgan Stanley Research
Leading domestic 3DIC commercialization with a clear first-mover advantage . We believe SJ Semi is currently the most advanced among domestic OSAT peers in 3DIC, with its micro-bump-based SmartPoser®-3DIC-BP platform already in volume production and its hybrid-bonding SmartPoser®-3DIC-HB platform advancing C2W/W2W capabilities. This positions the company well for the next generation of AI accelerators, for which increasing compute density and bandwidth requirements - including architectures implied by Huawei's -scaling roadmap - should drive greater adoption of 3D integration. SJ Semi is moving aggressively on capacity, with its Rmb10bn Shanghai Lingang 3DIC project commencing construction in June 2026. While front-end foundries may have stronger underlying process capabilities, we believe SJ Semi is ahead in 3DIC commercialization and dedicated capacity deployment, supporting a meaningful first-mover advantage as domestic 3DIC demand scales.
M
Exhibit 42: SJ Semi is ahead among OSAT peers in 3DIC commercialization
| Company | Type | 3DIC / Advanced Packaging Initiative | Investment | Start / Status | Expected Completion |
|---|---|---|---|---|---|
| SJ Semi | OSAT | Dongsheng Hexin 3DIntegrated Chip Manufacturing Phase I, Shanghai Lingang | Rmb10bn | Construction started Jun-2026 | N/A |
| JCET | OSAT | Newhigh-end advanced packaging &testing fab at Oriental IC Port, Shanghai Lingang | Rmb7.8bn | Approved / initiated in 2026 | Phase I targeted for 2H28 |
| Tongfu Microelectronics | OSAT | Wafer-level packaging + HPC/communications packaging expansion; parallel development of hybrid bonding | ~Rmb1.47bn across two major expansion projects | Under development in 2026 | ~3-year construction period |
| Huatian Technology | OSAT | R&Dinto 2.5D/3D and hybrid bonding | N/A | R&D/development | N/A |
| Quliang Electronics | OSAT | Jinjiang advanced packaging Phase II | ~Rmb5.6bn for initial Phase II development | Phase II facilities largely completed by 2024; ongoing ramp | Partially completed |
| SMIC | Foundry | Established advanced packaging research institute and Xin3D Semiconductor to develop 2.5D/3D capabilities | N/A | Xin3D established Mar-2026 | N/A |
| XMC | Foundry | Dedicated 3Dheterogeneous integration process platform | N/A | Already in volume production | Operational |
Source: Company data, Morgan Stanley Research
Investment Concerns
Intensifying competition in advanced packaging could pressure market share and
returns. While SJ Semiconductor currently holds a leading position in China's advanced packaging market, competition is likely to intensify as domestic OSAT peers, including JCET, Tongfu Microelectronics, and Forehope Electronic, accelerate capacity expansion and technology upgrades in advanced packaging. As competing capacity comes online and peers narrow the technology gap, SJ Semiconductor could face greater pressure on customer share, pricing and capacity utilization. In addition, aggressive industry-wide capacity additions could increase the risk of oversupply, potentially weighing on margins and returns on invested capital over the medium term.
High customer concentration creates a potential long-term risk . SJ Semiconductor has significant revenue exposure to Huawei, ~74% in 1H25, making its earnings sensitive to Huawei's outsourcing strategy. Meanwhile, Huawei is developing its own advanced packaging capabilities through Quliang and Ruixin. As these in-house platforms scale and mature, Huawei could potentially shift part of its advanced packaging demand away from external suppliers such as SJ Semiconductor. While this may not be an immediate risk given capacity and technology constraints, greater internalization over time could reduce SJ Semiconductor's order visibility, utilization rates and bargaining power..
M
Exhibit 43: SJ Semi market share in terms of built capacity may decline to 34% in 2027 due to aggressive capacity ramp from OSAT peers
Source: Company data, Morgan Stanley Research estimates
Exhibit 44: Huawei accounts for 74% of SJ Semi total revenue in 1H25
Source: Company data, Morgan Stanley Research
U.S. export controls remain a potential supply-chain risk . SJ Semiconductor is currently on the U.S. Entity List, which could restrict its access to certain U.S.-origin equipment, components, software and technologies that require export licenses. While export controls have historically focused more heavily on advanced front-end semiconductor manufacturing equipment and SJ Semiconductor's exposure to restricted back-end packaging equipment appears relatively manageable at present, the U.S. has continued to broaden semiconductor-related controls. As advanced packaging becomes increasingly critical to AI and advanced computing, there is a risk that future restrictions could expand to cover additional advanced packaging equipment or technologies. If SJ Semiconductor's overseas suppliers are unable to obtain required export licenses, or if localization of relevant equipment and components progresses more slowly than expected, the company could face disruptions to capacity expansion, production and R&D, potentially constraining its technology roadmap and long-term growth.
Our estimates vs consensus
What's priced in? Since its listing on April 21, SJ Semi's share price has been volatile, initially rallying sharply through May 26 as strong investor enthusiasm around China's advanced packaging and AI supply-chain localization drove a significant valuation re-rating. From late May through July 9, the shares entered a period of consolidation and elevated volatility as investors digested the rapid post-IPO rerating and increasingly demanding valuation, although continued enthusiasm around advanced packaging supported periodic rebounds. The stock subsequently sold off alongside the broader global technology and semiconductor correction in July, as concerns over elevated AI valuations and the sustainability of the AI capex cycle drove a broad risk-off move across semiconductor equities. Following SJ Semi's 2Q26 results, with quarterly revenue growth slowing to c.2% YoY and net profit declining 16% YoY; the stock fell as results fell short of elevated market expectations.
M
Exhibit 45: SJ Semi: Share price performance since listing
Source: Factset, Morgan Stanley Research
What is the market missing? We think the market is missing three factors:
- Intensifying competition which pressures the margin . OSAT peers were all attracted by secular growth opportunities of advanced packaging. As peers ramp up capacity, we expect a certain level of pricing competition. Therefore, our gross margin assumptions are slightly lower than consensus numbers in 2028.
- HBM tightness and leading-node capacity ramp-up pace and yield . Although we are constructive on China AI GPU shipment growth and local HBM ramp, any hiccup in GPU production or HBM sourcing (local and foreign) will impact final shipments and thus constrain near-term growth and execution
- Over-estimation of 3DIC, HBM sourcing and CPO opportunities . We think expectations for 3DIC, CPO and HBM outsourcing opportunities appear optimistic, with the timing and addressable revenue pool likely overstated, for details, please see Debate 3: Besides 2.5D packaging, how much upside can emerging advancedpackaging technologies contribute to China OSATs?
Exhibit 46: Our earnings estimates are 6%/4% below consensus for 2027/28
| (Rmb mn) | MS 2026e | Cons 2026e | Diff.% | MS 2027e | Cons 2027e | Diff.% | MS 2028e | Cons 2028e | Diff.% |
|---|---|---|---|---|---|---|---|---|---|
| Net sales | 7,874 | 7,976 | -1% | 10,371 | 10,738 | -3% | 12,863 | 13,673 | -6% |
| Gross profit | 2,436 | 2,421 | 1% | 3,247 | 3,356 | -3% | 4,093 | 4,457 | -8% |
| Operating profit | 1,189 | 1,099 | 8% | 1,743 | 1,792 | -3% | 2,365 | 2,438 | -3% |
| Pretax income | 1,125 | 1,099 | 2% | 1,703 | 1,792 | -5% | 2,325 | 2,438 | -5% |
| Net income | 1,101 | 1,093 | 1% | 1,618 | 1,718 | -6% | 2,209 | 2,316 | -5% |
| EPS | 0.59 | 0.59 | 1% | 0.87 | 0.92 | -6% | 1.19 | 1.24 | -4% |
| Margins | |||||||||
| Gross margin | 30.9% | 30.4% | 31.3% | 31.3% | 31.8% | 32.6% | |||
| Operating margin | 15.1% | 13.8% | 16.8% | 16.7% | 18.4% | 17.8% | |||
| Pretax margin | 14.3% | 13.8% | 16.4% | 16.7% | 18.1% | 17.8% | |||
| Net margin | 14.0% | 13.7% | 15.6% | 16.0% | 17.2% | 16.9% |
Source: Factset consensus estimates, Morgan Stanley Research estimates
Peer comparison
We identify three peer groups for SJ Semi: Execution needs to substantiate the high premium over peers:
- OSAT peers : We benchmark SJ Semi against domestic A-share OSATs and global OSAT leaders, reflecting its core exposure to semiconductor packaging and testing. However, SJ Semi's greater focus on wafer-level advanced packaging and 3D integration supports a premium valuation versus conventional OSAT peers. We
M
expect the premium to narrow over the long term as the advanced packaging mix increases at peers.
- China AI GPU thematic peers: We compare SJ Semi with China AI GPU players, given its exposure to the domestic AI/HPC ecosystem through advanced packaging. While not direct business-model peers, this group provides a useful valuation reference for the scarcity premium and growth expectations attached to China's localized AI compute supply chain. SJ Semi's 2027 P/S and P/E are higher than large local GPU companies (Cambricon and Hygon) seems demanding, as the revenue growth of GPU players is expected to be stronger.
- Back-end equipment : SJ Semi sits downstream as a manufacturing/service provider rather than an equipment vendor, but both groups benefit from increasing adoption of 2.5D/3D integration, fine-pitch interconnect and advanced bonding. Overall back-end equipment valuations seem more reasonable vs. SJ Semi.
SJ Semi trades at 31x/24x/19x 2026-28E P/S, far above OSATs (~3x/3x/2x) and equipment peers (~11x/8x/8x), and much closer to China AI GPU supply chain names (~25x/15x/12x). We think the current valuation already prices SJ Semi much more as an AI/advancedpackaging scarcity asset than as an OSAT, so execution needs to substantiate that premium.
Exhibit 47: SJ Semi: Peer comparison
| Stock Price | Curr- | Market Cap | Revenue Growth (%) | Revenue Growth (%) | Revenue Growth (%) | P/S | P/S | P/S | P/E | P/E | P/E | P/B | P/B | P/B | Price Performance | Price Performance | Price Performance | |
|---|---|---|---|---|---|---|---|---|---|---|---|---|---|---|---|---|---|---|
| (LCU) | ency | (US$mm) | 2026 | 2027 | 2028 | 2026 | 2027 | 2028 | 2026 | 2027 | 2028 | 2026 | 2027 | 2028 | 1M | 3M | 1Y | |
| SJ Semi | 126.8 | CNY | 35,216 | 20.8% | 31.7% | 24.0% | 30x | 23x | 18x | 215x | 146x | 107x | 11.5x | 10.7x | 9.7x | (8.1%) | (18.8%) | -- |
| A-share OSAT | ||||||||||||||||||
| JCET | 66.3 | CNY | 17,696 | 14.0% | 15.9% | 16.5% | 3x | 2x | 2x | 45x | 32x | 25x | 3.7x | 3.4x | 3.0x | (15.7%) | (3.8%) | 75.1% |
| Tongfu Microelectronics | 56.8 | CNY | 12,847 | 23.4% | 15.6% | 12.2% | 3x | 2x | 2x | 44x | 41x | 34x | 4.9x | 4.4x | 3.9x | (9.8%) | (0.8%) | 71.5% |
| Huatian Technology | 16.0 | CNY | 7,938 | 19.5% | 17.5% | 12.4% | 3x | 2x | 2x | 58x | 45x | 37x | n.a. | n.a. | n.a. | (11.0%) | (0.4%) | 42.9% |
| Forehope | 57.6 | CNY | 3,894 | 21.8% | 31.1% | 20.9% | 5x | 4x | 3x | 127x | 78x | 58x | 6.6x | 6.1x | 5.5x | (15.2%) | (1.3%) | 67.4% |
| Mean | 19.7% | 20.0% | 15.5% | 3x | 3x | 2x | 69x | 49x | 38x | 5.1x | 4.6x | 4.1x | ||||||
| Median | 20.7% | 16.7% | 14.4% | 3x | 2x | 2x | 51x | 43x | 35x | 4.9x | 4.4x | 3.9x | ||||||
| China AI GPU thematic players | ||||||||||||||||||
| Hygon | 223.7 | CNY | 77,518 | 55.0% | 39.5% | 31.6% | 23x | 16.7x | 13x | 111x | 74x | 48x | 19.6x | 16.0x | 12.5x | (20.4%) | (20.1%) | 1.7% |
| Cambricon | 1,040.0 | CNY | 97,508 | 178.8% | 112.8% | 33.6% | 36x | 17x | 13x | 99x | 54x | 42x | 36.4x | 23.0x | 15.8x | (4.8%) | (16.1%) | 4.1% |
| MetaX | 461.1 | CNY | 27,479 | 145.9% | 53.5% | 20.5% | 46x | 30x | 25x | n.a. | 350x | 200x | 14.0x | 13.4x | 12.6x | (38.4%) | (33.6%) | -- |
| Illuvatar CoreX | 106.3 | CNY | 3,647 | 190.7% | 206.3% | 45.9% | 8x | 3x | 2x | n.a. | 15x | 8x | 2.1x | 1.8x | 1.5x | (22.6%) | (39.6%) | -- |
| SMIC (H-share) | 61.3 | USD | 90,335 | 26.7% | 13.2% | 9.9% | 8x | 7x | 6x | 58x | 35x | 30x | 9.7x | 7.6x | 6.8x | (13.4%) | (14.4%) | (2.3%) |
| Hua Hong (H-share) | 106.5 | USD | 39,217 | 24.8% | 18.5% | 10.8% | 13x | 11x | 10x | 120x | 68x | 53x | 16.3x | 13.1x | 11.0x | (18.2%) | (23.5%) | 109.2% |
| Mean | 103.6% | 74.0% | 25.4% | 22x | 14x | 11x | 97x | 100x | 63x | 16.4x | 12.5x | 10.0x | ||||||
| Median | 100.5% | 46.5% | 26.0% | 18x | 14x | 11x | 105x | 61x | 45x | 15.2x | 13.3x | 11.7x | ||||||
| Global peers | ||||||||||||||||||
| Amkor | 47.1 | USD | 11,707 | 13.3% | 10.8% | 9.7% | 2x | 1x | 1x | 18x | 20x | 15x | 2.3x | 2.1x | 1.9x | (20.1%) | (43.1%) | 85.1% |
| ASE | 612.0 | TWD | 86,136 | 29.7% | 33.4% | 30.1% | 3x | 2x | 2x | 34x | 21x | 13x | 6.4x | 5.3x | 4.3x | (0.6%) | 3.7% | 266.5% |
| KYEC | 261.5 | TWD | 10,570 | 36.5% | 41.1% | 30.1% | 7x | 5x | 4x | 29x | 19x | 14x | 5.9x | 4.9x | 4.0x | 5.9% | (2.6%) | 65.4% |
| Mean | 26.5% | 28.5% | 23.3% | 4x | 3x | 2x | 27x | 20x | 14x | 4.9x | 4.1x | 3.4x | ||||||
| Median | 29.7% | 33.4% | 30.1% | 3x | 2x | 2x | 29x | 20x | 14x | 5.9x | 4.9x | 4.0x | ||||||
| Back-end Equipment | ||||||||||||||||||
| ASMPT | 154.3 | HKD | 8,251 | 32.7% | 15.0% | 14.6% | 3x | 3x | 3x | 35x | 23x | 16x | 3.6x | 3.3x | 2.9x | (12.3%) | (15.6%) | 117.5% |
| BE Semiconductor | 176.0 | EUR | 16,473 | 67.4% | 42.7% | 9.0% | 14x | 10x | 9x | 41x | 25x | 22x | 18.1x | 12.7x | 9.6x | (24.6%) | (44.5%) | 57.3% |
| Hanmi Semiconductor | 225,000.0 | KRW | 15,920 | 29.9% | 57.5% | 14.7% | 29x | 18x | 16x | 62x | 41x | 36x | 24.4x | 16.6x | 12.2x | (1.7%) | (37.7%) | 147.5% |
| TOWA | 2,105.0 | JPY | 1,023 | 18.0% | 16.7% | 9.4% | 2x | 2x | 2x | 20x | 15x | 14x | 2.0x | 1.8x | 1.6x | (16.2%) | (28.4%) | 8.4% |
| Kulicke & Soffa | 79.5 | USD | 4,158 | 60.7% | 22.4% | n.a. | 3x | 3x | n.a. | 17x | 12x | n.a. | 4.3x | 3.2x | n.a. | (19.8%) | (29.8%) | 105.7% |
| Mean | 38.1% | 31.2% | 12.5% | 10x | 7x | 7x | 36x | 24x | 22x | 10.0x | 7.3x | 6.2x | ||||||
| Median | 31.3% | 27.5% | 14.6% | 7x | 5x | 7x | 37x | 24x | 22x | 6.0x | 4.6x | 4.6x |
Source: Company data, Bloomberg, Morgan Stanley Research. e=Morgan Stanley Research estimates for covered companies, Bloomberg consensus for non-covered companies. Note: Share prices as of Sept 15, 2026.
M
Exhibit 48: SJ Semi: NTM P/E ratio
Source: FactSet, Morgan Stanley Research estimates
Exhibit 49: SJ Semi: NTM P/B ratio
Source: FactSet, Morgan Stanley Research estimates
Key catalysts to watch
- 21st Oct 2026: IPO lock-up expiration for certain offline placement investors (7.6% of floating shares)
- Late Oct: 3Q26 financial result
- 4Q26-1Q27: Advanced packaging / 3D integration capacity & customer qualification
M
Risk Reward - SJ Semiconductor Corp (688820.SS) Risk Reward - SJ Semiconductor Corp (688820.SS)
Leading advanced packaging player; premium valuation
Rmb118.40 PRICE TARGET
We derive our price target from a residual income model, as we believe this methodology is best suited to capturing long-term value. We assume an 8.0% cost of equity (beta 1.09, riskfree rate 2.0% and risk premium 5.5%), a payout ratio of 50%, a medium-term growth rate of 26.0%, and a terminal growth rate of 5.0%, all of which are in line with other China AI supply chain companies under our coverage.
RISK REWARD CHART
Key:
Historical Stock Performance
Current Stock Price
Source: Refinitiv, Morgan Stanley Research
18.0x 2026 P/B BULL CASE
Rmb200.00
(1) >40% revenue CAGR in 2025-28 driven by stronger-than-expected domestic AI GPU demand; (2) limited competition risk as peers struggle to ramp up advanced packaging capacity; and (3) gross margin above 35% in 2026-28 thanks to production scale effects and technology breakthrough.
Price Target
BASE CASE
11.0x 2026 P/B
(1) 25% revenue CAGR in 2025-28 driven by strong domestic AI GPU demand; (2) moderate competition risk as peers struggle to ramp up advanced packaging capacity; and (3) gross margin ~31.4% in 2026-28, mildly improving thanks to production scale effects.
Rmb118.40
EQUAL-WEIGHT THESIS
- The leading local advanced packaging vendor, benefiting from strong China AI demand.
- Attractive gross margin of advanced packaging business could lead more OSAT companies to add capacity and compete in this space.
- Final shipment of AI GPUs facing constraints of upstream front-end leading node yield issue and local HBM ramp-up pace.
- Valuation at 12x 2026 P/B or 2x of local OSAT peers looks fair, reflecting technology leadership and robust advanced packaging TAM growth.
Risk Reward Themes
Contrarian: Secular Growth:
Negative Positive
View descriptions of Risk Rewards Themes here
BEAR CASE
7.2x 2026 P/B
(1) <20% revenue CAGR in 2025-28 given slower-than-expected domestic AI GPU demand; (2) significant market share loss in China's advanced packaging market as peers' capacity scales; and (3) gross margin below 25% in 2026 and 2027 due to strong price competition and underutilized capacity.
Rmb80.00
M
Risk Reward - SJ Semiconductor Corp (688820.SS)
KEY EARNINGS INPUTS
| Drivers | 2025 | 2026e | 2027e | 2028e |
|---|---|---|---|---|
| Gross Margin (%) | 31 | 30.9 | 31.3 | 31.8 |
| Chiplet packaging revenue growth (%) | 76 | 28.5 | 47.9 | 32.6 |
| Chiplet packaging gross margin (%) | 30.6 | 31.6 | 31.4 | 32 |
INVESTMENT DRIVERS
- China AI compute demand
- 2.5D/3.D advanced packaging capacity ramp-up
- Technology breakthrough in advanced packaging
GLOBAL REVENUE EXPOSURE
Source: Morgan Stanley Research Estimate View explanation of regional hierarchies here
RISKS TO PT/RATING
RISKS TO UPSIDE
- China front-end leading node yield improves significantly
- Local HBM capacity ramp-up faster than expected, HBM sourcing from overseas market becomes easier.
- Signficant progress in 3D packaging
RISKS TO DOWNSIDE
- Limited improvment in front-end leading node yield
- Local HBM capacity ramp-up slower and tightening restrictions of HBM imports from overseas
- Limited progress in 3D packaging
MS ESTIMATES VS. CONSENSUS
M
M
SJ Semiconductor: Financial Summary
Exhibit 50: SJ Semi: Financial Summary
Income Statement
Rmb mn (Years End Dec )
Net sales
COGS
Depreciation Expense
Variable Cost
Gross profit
Operating expenses
Operating income
Non-operating income
Pre-tax income
Income tax
Minority Interests
Reported net Income
Adj.wtd.avg.shrs( m)
Reported EPS (Rmb)
Modelware EPS (Rmb)
Balance Sheet
Rmb mn (Years End Dec )
Cash
Mkt Securities
AR/NR
Inventory
Other
Current Assets
Long-term investments
Fixed assets
Other assets
Total Assets
S/T borrowings
AP/NP
Other ST liabilities
LT debt
Other LT liabilities
Total Liabilities
Common stocks
Preferred stocks
Capital Researve
Retained earning
Minority
Total Equity
Total Liab. & Shrhldr's Equity
2025
6,521
(4,501)
(1,837)
0
2,021
(1,039)
982
(118)
864
57
0
921
1,607
0.57
0.57
2025
6,061
0
1,141
1,388
604
9,194
0
12,364
1,046
22,603
423
1,917
1,673
3,247
915
8,176
0
0
13,795
489
0
14,428
22,603
e = Morgan Stanley Research Estimates
Source: Morgan Stanley Research, Company Data
Source: Company data, Morgan Stanley Research. e = Morgan Stanley Research estimates.
2026e
7,874
(5,437)
(2,863)
0
2,436
(1,248)
1,189
(63)
1,125
(24)
0
1,101
1,863
0.59
0.59
2026e
9,620
0
1,693
1,724
693
13,731
0
14,587
1,017
29,335
423
1,932
1,564
3,247
1,612
8,778
0
0
18,823
1,589
0
20,557
29,335
2027e
10,371
(7,124)
(3,090)
0
3,247
(1,504)
1,743
(40)
1,703
(85)
0
1,618
1,863
0.87
0.87
2027e
9,258
0
2,230
2,271
722
14,481
0
16,584
989
32,053
423
2,336
1,564
3,247
2,309
9,879
0
0
18,823
3,207
0
22,174
32,053
2028e
12,863
(8,770)
(3,817)
0
4,093
(1,728)
2,365
(40)
2,325
(116)
0
2,209
1,863
1.19
1.19
2028e
10,111
0
2,765
2,817
751
16,444
0
17,854
961
35,258
423
2,635
1,564
3,247
3,006
10,875
0
0
18,823
5,416
0
24,383
35,258
Cash Flow Statement
Rmb mn (Years End Dec )
Cashflow from Operations
Net profits
Depreciation
Working Capital Change
Other adjustments
Cashflow from Investing
Capex
Change of LT Investment
Change of ST Investment
Other adjustments
Cashflow from financing
Increase in L/T debt
Increase in S/T debt
Cash Dividend Paid
Dir& Emp Bonus Paid
Other adjustments
Exchange rate adjustment
Net change in cash
2025
4,151
921
1,837
655
738
(5,729)
(5,087)
(642)
0
(0)
513
683
0
0
0
(170)
(149)
-1,214
2026e
3,618
1,101
2,863
(963)
616
(5,087)
(5,087)
0
0
0
5,028
0
0
0
0
5,028
0
3,559
2027e
4,724
1,618
3,090
(709)
725
(5,087)
(5,087)
0
0
0
0
0
0
0
0
0
0
-362
2028e
5,940
2,209
3,817
(811)
725
(5,087)
(5,087)
0
0
0
0
0
0
0
0
0
0
853
| Financial Ratios | 2025 | 2026e | 2027e | 2028e |
|---|---|---|---|---|
| Growth(%) | ||||
| Turnover | 38.6 | 20.7 | 31.7 | 24.0 |
| Operating profits | 184.7 | 21.0 | 46.6 | 35.7 |
| Pretax profits | 304.2 | 30.2 | 51.4 | 36.5 |
| Net profits | 330.8 | 19.6 | 47.0 | 36.5 |
| EPS | 330.8 | 3.2 | 47.0 | 36.5 |
| Margins (%) | ||||
| Gross Margin | 31.0 | 30.9 | 31.3 | 31.8 |
| Operating Margin | 15.1 | 15.1 | 16.8 | 18.4 |
| EBITA Margin | 43.2 | 51.5 | 46.6 | 48.1 |
| Pretax Margin | 13.2 | 14.3 | 16.4 | 18.1 |
| Net Profit | 14.1 | 14.0 | 15.6 | 17.2 |
| Return (%) | ||||
| ROAE | 6.6 | 6.3 | 7.6 | 9.5 |
| ROAA | 4.3 | 4.2 | 5.3 | 6.6 |
| Gearing (%) | ||||
| Net Debt/Equity | (16.6) | (28.9) | (25.2) | (26.4) |
| Liabilities/Equity | 56.7 | 42.7 | 44.6 | 44.6 |
| Ratios (X) | ||||
| Current ratio | 2.3 | 3.5 | 3.3 | 3.6 |
| Quick ratio | 1.8 | 2.9 | 2.7 | 2.8 |
| Others | ||||
| AR/NR Turnover (days) | 78 | 78 | 78 | 78 |
| Inventory Turnover (days) | 73 | 72 | 72 | 70 |
| AP Turnover (days) | 167 | 140 | 130 | 120 |
| Cash Conversion (days) | -16 | 11 | 21 | 29 |
M
SJ Semi: Earnings Growth Outlook
Revenue growth outlook :
- We forecast overall revenue to increase at a 25% CAGR in 2025-28.
- We expect chiplet/2.5D packaging to increase at a 36% CAGR in 2025-28, because advanced packaging has become an increasingly critical part of the AI GPU supply chain and chiplet architectures and as heterogeneous integration gain adoption.
- We expect mid level wafer processing business to grow at 10% CAGR (2025-28), driven by rising advanced-node wafer volumes and increasing outsourcing of bumping, probing and other mid-end processes as packaging complexity increases .
- We expect SJ Semi's WLP business to grow at a more moderate 5% CAGR over 2025-28, as this segment is more exposed to smartphone relate chips such as Radio Frequency (RF), fingerprint chips.
Earnings growth outlook : We expect SJ semi's earnings to grow at a 34% CAGR (202528), outpacing its sales growth. While the company still needs to invest heavily in capex to expand its capacity and R&D for technology upgrades, we expect operating leverage to emerge as revenue scales significantly.
GM trend : We expect the company's gross margin to improve from 31% in 2025 to 32% in 2028, due to an increasing contribution from chiplet/2.5D packaging which carries structurally higher margins. We anticipate SJ Semi to maintain technology leadership in advanced packaging and China AI GPU demand to remain strong for next 3-5 years. Therefore, SJ Semi's gross margin could improve mildly as capacity scales, but partly offset by increasing competition as peers also ramp-up capacity.
Exhibit 51: SJ Semi: Quarterly financials
| (Rmb mn) | 1Q26 | 2Q26 | 3Q26e | 4Q26e | 2025 | 2026e | 2027e | 2028e |
|---|---|---|---|---|---|---|---|---|
| Total Revenues | 1,698 | 1,708 | 2,497 | 1,970 | 6,521 | 7,874 | 10,371 | 12,863 |
| Q/Q% | 0.0% | 0.6% | 46.2% | -21.1% | ||||
| Y/Y% | 0.0% | 2.0% | 33.5% | 33.6% | 38.6% | 20.7% | 31.7% | 24.0% |
| Cost of Sales | (1,196) | (1,184) | (1,709) | (1,348) | (4,501) | (5,437) | (7,124) | (8,770) |
| Percent of Revenues | 70.4% | 69.3% | 68.4% | 68.4% | 69.0% | 69.1% | 68.7% | 68.2% |
| Gross Profit before dep and amort | 0 | 0 | 0 | 0 | 0 | 0 | 0 | 0 |
| Percent of Revenues | 0.0% | 0.0% | 0.0% | 0.0% | 0.0% | 0.0% | 0.0% | 0.0% |
| Gross Profit | 503 | 524 | 788 | 622 | 2,021 | 2,436 | 3,247 | 4,093 |
| Gross Margin | 29.6% | 30.7% | 31.6% | 31.6% | 31.0% | 30.9% | 31.3% | 31.8% |
| Incremental Margins | 224.5% | 213.9% | 33.4% | NM | 50.3% | 30.7% | 32.5% | 34.0% |
| Total Opex | (270) | (274) | (396) | (308) | (1,039) | (1,248) | (1,504) | (1,728) |
| Percent of Revenues | 15.9% | 16.0% | 15.8% | 15.6% | 15.9% | 15.8% | 14.5% | 13.4% |
| Operating Income | 233 | 250 | 392 | 314 | 982 | 1,189 | 1,743 | 2,365 |
| Operating margin | 13.7% | 14.6% | 15.7% | 15.9% | 15.1% | 15.1% | 16.8% | 18.4% |
| Total Non-operating Income(Loss) | (42) | (1) | (10) | (10) | (118) | (63) | (40) | (40) |
| Percent of Revenues | -2.5% | -0.1% | -0.4% | -0.5% | -1.8% | -0.8% | -0.4% | -0.3% |
| Profit Before Taxes | 190 | 249 | 382 | 304 | 864 | 1,125 | 1,703 | 2,325 |
| Percent of Revenues | 11.2% | 14.6% | 15.3% | 15.4% | 13.2% | 14.3% | 16.4% | 18.1% |
| Taxes | 1 | 9 | (19) | (15) | 57 | (24) | (85) | (116) |
| Tax Rate | -0.5% | -3.6% | 5.0% | 5.0% | -6.5% | 2.2% | 5.0% | 5.0% |
| Net Income, Cont Ops | 191 | 258 | 363 | 288 | 921 | 1,101 | 1,618 | 2,209 |
| Cumulative Effects | 0 | 0 | 0 | 0 | 0 | 0 | 0 | 0 |
| Minority Interest | 0 | 0 | 0 | 0 | 0 | 0 | 0 | 0 |
| Reported Income | 191 | 258 | 363 | 288 | 921 | 1,101 | 1,618 | 2,209 |
| Percent of Revenues | 11.3% | 15.1% | 14.5% | 14.6% | 14.1% | 14.0% | 15.6% | 17.2% |
| Change vs Year Ago | 0.0% | 0.0% | 0.0% | 0.0% | 330.8% | 19.6% | 47.0% | 36.5% |
| Reported EPS (Rmb) | 0.10 | 0.14 | 0.19 | 0.15 | 0.57 | 0.59 | 0.87 | 1.19 |
| Q/Q% | 0.0% | 34.9% | 40.7% | -20.6% | ||||
| Y/Y% | 0.0% | 0.0% | 0.0% | 0.0% | 330.8% | 3.2% | 47.0% | 36.5% |
| Basic shares (mn units) | 1,863 | 1,863 | 1,863 | 1,863 | 1,607 | 1,863 | 1,863 | 1,863 |
| Diluted | 1,863 | 1,863 | 1,863 | 1,863 | 1,607 | 1,863 | 1,863 | 1,863 |
| Basic period End share | 1,863 | 1,863 | 1,863 | 1,863 | 1,607 | 1,863 | 1,863 | 1,863 |
Source: Company data, Morgan Stanley Research. e = Morgan Stanley Research estimates.
M
Valuation Methodology
Our price target is Rmb118.4 : We derive our price target from a residual income model, as we believe this methodology is best suited to capturing long-term value. We assume an 8.0% cost of equity (beta 1.09, risk-free rate 2.0% and risk premium 5.5%), a payout ratio of 50%, a medium-term growth rate of 26.0%, and a terminal growth rate of 5.0%, all of which are in line with other China AI supply chain companies under our coverage.
Our price target implies 11.0x 2026 book value per share, 2.3x the local OSAT peer average. We think its premium valuation already discounts much of SJ Semi's technology leadership and AI-driven growth.
Exhibit 52: Residual income model
| 2026e | 2027e | 2028e | 2029e | 2030e | 2031e | 2032e | 2033e | 2034e | 2035e | 2036e | 2037e | |
|---|---|---|---|---|---|---|---|---|---|---|---|---|
| Total Equity | 20,557 | 22,174 | 24,383 | 25,775 | 27,528 | 29,737 | 32,521 | 36,028 | 40,447 | 46,015 | 53,031 | 61,871 |
| Net Profit | 1,101 | 1,618 | 2,209 | 2,783 | 3,507 | 4,418 | 5,567 | 7,015 | 8,838 | 11,136 | 14,032 | 17,680 |
| ROAE | 6.3% | 7.6% | 9.5% | 11.1% | 13.2% | 15.4% | 17.9% | 20.5% | 23.1% | 25.8% | 28.3% | 30.8% |
| Residual Income | (246) | (87) | 331 | 756 | 1,331 | 2,047 | 2,941 | 4,056 | 5,447 | 7,185 | 9,359 | 12,080 |
| Spread | -1.7% | -0.4% | 1.5% | 3.1% | 5.2% | 7.4% | 9.9% | 12.5% | 15.1% | 17.8% | 20.3% | 22.8% |
| Ending Equity Capital | 20,557 | |||||||||||
| PV of Forecast Period | 18,274 | |||||||||||
| PV of Continuing Value | 181,727 | |||||||||||
| Equity Value | 220,558 | |||||||||||
| No. of Shares | 1,863 | |||||||||||
| Projected Price (Rmb) | 118.4 |
Source: Morgan Stanley Research estimates.
Bull/bear case discussion
Our bull case value is Rmb200: stronger revenue growth with accelerated gross margin expansion
We assume (1) >40% revenue CAGR in 2025-28 driven by stronger-than-expected domestic AI GPU demand; (2) limited competition risk as peers struggle to ramp up advanced packaging capacity; and (3) gross margin above 35% in 2026-28 thanks to production scale effects and technology breakthrough.
Our bear case value is Rmb80: slower revenue growth with gross margin erosion amid intensifying competition
We assume (1) <20% revenue CAGR in 2025-28 given slower-than-expected domestic AI GPU demand; (2) significant market share loss in China's advanced packaging market as peers scale capacity; and (3) gross margin below 25% in 2026 and 2027 due to strong price competition and underutilized capacity.
M
Exhibit 53: SJ Semi: NTM P/E ratio
Source: FactSet, Morgan Stanley Research estimates
Exhibit 54: SJ Semi: NTM P/B ratio
Source: FactSet, Morgan Stanley Research estimates
M
SJ Semi: Company Profile
Established in 2014, SJ Semiconductor is one of the leading advanced semiconductor packaging and testing companies in China, focusing on wafer-level advanced packaging and mid-end wafer processing. The company is among the earliest domestic providers of 12inch bumping services and has expanded into wafer-level packaging (WLP) and Chipletbased heterogeneous integration solutions. SJ Semiconductor provides end-to-end advanced packaging services covering bumping, wafer probing, wafer-level packaging, 2.5D/3DIC, and advanced heterogeneous integration technologies for high-performance computing, AI, data center, automotive and mobile applications. The company completed its IPO on the Shanghai STAR Market in April 2026.
Business overview
SJ Semiconductor specializes in advanced packaging and wafer-level manufacturing technologies. Its major technology platforms include:
- Mid-end wafer processing, including 12-inch bumping, redistribution layer (RDL), wafer probing (CP), TSV and hybrid bonding;
- Wafer-level packaging (WLP), including fan-in WLCSP and advanced wafer-level packaging solutions;
- Chiplet heterogeneous integration, including 2.5D integration (TSV interposer), 3DIC and 3D Package technologies targeting AI accelerators, HPC processors, networking chips and other high-performance applications.
Key Competitors
SJ Semi ranked number 9 in the global OSAT market in terms of revenue in 2025 with a market share of 1.9%, according to Gartner. Major international competitors include ASE Technology and Amkor Technology. Major domestic competitors include JCET, Tongfu Microelectronics, Tianshui Huatian Technology, and Forehope Electronics.
Others
26%
ing up
YEC
2%
latian owertech
4% ngfu Micro
Raw i
ASE
26%
M
Exhibit 55: SJ Semi ranked No. 9 in the global OSAT industry (2025)
Source: Gartner, Morgan Stanley Research
Key customers and COGS
SJ Semiconductor provides advanced packaging services primarily for leading fabless semiconductor companies, foundries and HPC customers. As of 1H25, the top 5 customers accounted for 91% of sales, and top 1 customer Huawei accounts for 74% of total revenue. SJ Semi's revenue is primarily from China customers; overseas revenue accounted for 6% of total revenue in 1H25.
Manufacturing cost accounted for 50% of COGS in 1H25. Advanced packaging requires high levels of clean room, precision, and automation, thus it requires a significant amount of advanced packaging and testing equipment. This equipment and these production lines are typically highly expensive, so manufacturing cost usually accounts for a high proportion of the operating cost structure.
Exhibit 56: SJ Semi customer concentration ratio is high (1H25)
Source: Company data, Morgan Stanley Research
Exhibit 57: COGS breakdown (1H25)
Source: Company data, Morgan Stanley Research
Shareholding Structure
As of the 1H26 reporting, the largest shareholders were Wuxi Chanfa Science &
Labor cost
16%
JCET
Amk
149
M
Technology Venture capital (9.39%), an industry investment fund backed by stated-owned capital. SJ Semiconductor has no controlling shareholder.
SJ Semiconductor was originally established in 2014 as a joint venture between Semiconductor Manufacturing International Corporation (SMIC) and JCET Group, specializing in advanced semiconductor packaging and testing. In 2021, both companies sold their stakes in SJ Semi to a consortium of financial investors. The main reason for these sales was strategic. SMIC stated that the divestment would optimize resource allocation and allow it to focus on its foundry business. JCET exited its investment to monetize its holdings and strengthen its balance sheet while concentrating on its core packaging operations.
Exhibit 58: Top 10 shareholders as of 1H26
| Shareholders | Number of shares | Shareholding% |
|---|---|---|
| 1 Wuxi Chanfa Science &Technology Venture Capital | 175,000,000 | 9.39% |
| 2 Shanghai Yukuang Technology Partnership | 109,600,000 | 5.88% |
| 3 Shenzhen Yuanzhi No.1 Private Equity Investment Fund | 98,666,666 | 5.30% |
| 4 Shanghai Ruisheng Information Technology Partnership | 45,700,000 | 2.45% |
| 5 Suzhou Yuanhe Houwang Changxin No.2 Venture Capital Partnership | 42,400,000 | 2.28% |
| 6 China Mobile Equity Fund Management | 41,522,377 | 2.23% |
| 7 Suzhou Yuanhe Houwang Changxin Venture Capital Partnership | 40,000,000 | 2.15% |
| 8 Golden Link Worldwide Limited | 40,000,000 | 2.15% |
| 9 Shanghai Jinpu Chengji Enterprise Management Partnership | 39,000,000 | 2.09% |
| 10 Suzhou Puhua Chuangyu Equity Investment Partnership | 37,666,666 | 2.02% |
Source: Company data, Morgan Stanley Research
Management Team
Management past experience in front-end and leading OSAT companies. Mr. Cui is the chairman of SJ Semi and he previously worked in Hua Hong and SMIC. Mr. Li, SJ Semi's COO, previously worked in Chartered Semiconductor Manufacturing (being acquired by Global Foundry) and Hua Hong. A deep understanding of wafer fabrication processes, device characteristics, and manufacturing requirements enables the team to optimize advanced packaging technologies, improve yield, and develop solutions that meet the evolving demands of next-generation semiconductor products.
Exhibit 59: SJ Semiconductor: management team
| Name | Role | Experience |
|---|---|---|
| CUI Dong | Chairman&CEO | Worked in Hua Hong (1998-2009); SMIC (2011-15), Joined SJ Semi since establishment in 2014asCEO |
| Worked in China Aerospace Science &Industry Corporation (1994-1995); Chartered Semiconductor Manufacturing | ||
| LI Jianwen | Director&COO | (1995-2003), Hua Hong (2003-2007), Amkor (2007-2014); Joined SJ Semi since establishment in 2014 |
| LIN Cheng-Chung | R&DVP | Worked in Nanya Tech (1994-1999); TSMC(1999-2013); Joined SJ Semi since establishment in 2014 |
| WUWei | VP | Worked in ABB (1998-2007); TE Connectivity (2007-2014); Joined SJ Semi since establishment in 2014 |
| ZHOUYan | VP &Board Secretary | Worked in SMIC (2004-2021); Joined SJ Semi since 2021 |
| WUJihong | VP | Worked in ASE (2004-2006), SMIC (2006-2021); Joined SJ Semi since 2021 |
| Worked in Hua Hong (2003-2007), Cooper Industries (2007-2009), BASF (2009-12), AMEC(2012-2021),OPNOUS | ||
| ZHAOGuohong | VP&CFO | (2021-2023) ; Joined SJ Semi since 2023 |
Source: Company data, Morgan Stanley Research
M
Glossary
2.5D: 2.5-Dimensional Integration . Advanced packaging architecture that places multiple dies, such as AI processors and HBM, side-by-side on an interposer or equivalent highdensity interconnect platform.
3DIC: Three-Dimensional Integrated Circuit . Advanced integration architecture that vertically stacks dies to increase compute density and shorten interconnects, but with higher process complexity, cost and yield sensitivity.
ASIC: Application-Specific Integrated Circuit . Chip designed for a specific workload or application, including custom AI accelerators.
Back-end: Back-end Semiconductor Manufacturing . Semiconductor assembly, packaging and testing processes performed after wafer fabrication. Advanced packaging is making these processes increasingly complex and equipment-intensive.
Bumping: Wafer Bumping . Process of forming conductive bumps on a wafer or die to create electrical connections to another die, interposer or substrate.
C2W: Chip-to-Wafer . 3D integration approach in which individual dies are bonded onto a wafer, allowing tested dies to be selected before stacking.
Chiplet : A smaller functional die designed to be integrated with other dies within one package, enabling system performance to scale without relying solely on larger monolithic chips.
CMP: Chemical Mechanical Planarization . Precision polishing process used to create extremely flat wafer surfaces, important for advanced 3D integration and hybrid bonding.
CoWoS: Chip-on-Wafer-on-Substrate . Family of 2.5D advanced packaging architectures that integrates multiple compute and memory dies through high-density interconnects.
CoWoS-L: Chip-on-Wafer-on-Substrate - Local Silicon Interconnect 2.5D architecture combining an RDL-based interposer with local silicon interconnects, offering greater scalability and design flexibility for larger AI packages.
CoWoS-S: Chip-on-Wafer-on-Substrate - Silicon Interposer 2.5D architecture using a full silicon interposer to connect multiple dies.
CP: Chip Probe Electrical testing of individual dies while they remain on the wafer, helping identify functional dies before downstream packaging.
CPO: Co-Packaged Optics Integration of optical communication components close to compute or switching chips to increase interconnect bandwidth and reduce power consumption.
CSP: Cloud Service Provider Large cloud-computing customer that operates data-center infrastructure and is an important source of demand for AI accelerators and advanced packaging.
Dicing: Wafer Dicing Process of cutting a processed wafer into individual semiconductor dies.
M
ECP: Electrochemical Plating Process that electrochemically deposits conductive metals, typically copper, for structures including RDL and TSV-related interconnects.
EUV: Extreme Ultraviolet Lithography Advanced lithography technology used in leadingedge semiconductor wafer fabrication.
Fab: Semiconductor Fabrication Plant Manufacturing facility in which semiconductor wafers are processed and chips are fabricated.
Fabless: Fabless Semiconductor Company Semiconductor company that designs chips but outsources wafer manufacturing to foundries.
Fan-in: Fan-in Wafer-Level Packaging Wafer-level packaging architecture in which package interconnections remain within the footprint of the original die.
Fan-out: Fan-out Packaging Packaging architecture that redistributes connections beyond the original die footprint, enabling more I/O connections and potentially multi-die integration.
Fine Pitch: Fine Interconnect Pitch Small spacing between electrical interconnects. Finer pitch enables higher interconnect density and bandwidth but requires greater manufacturing precision.
Flip Chip: Flip-Chip Packaging Packaging method in which a die is flipped face-down and electrically connected through bumps rather than conventional wire bonds.
Foundry: Semiconductor Foundry Manufacturer that fabricates semiconductor wafers for chip designers and other customers.
Front-end: Front-end Semiconductor Manufacturing Wafer-fabrication processes used to create transistors and circuitry before semiconductor assembly and packaging.
GPU: Graphics Processing Unit Highly parallel processor widely used for AI workloads and a key source of demand for 2.5D/3D advanced packaging.
HBM: High-Bandwidth Memory Vertically stacked DRAM positioned close to AI processors to provide very high memory bandwidth. HBM availability can constrain AI accelerator and advanced-packaging output.
HBM3E / HBM4 / HBM4E: High-Bandwidth Memory Generations Successive generations of HBM with increasing bandwidth, capacity and packaging complexity.
Heterogeneous Integration Integration of different types of dies, potentially manufactured using different process technologies, into a single package or system.
HPC: High-Performance Computing Compute-intensive applications requiring high processing performance and memory bandwidth, making them major users of advanced packaging.
Hybrid Bonding : High-density bonding technology that directly connects metal interconnects and dielectric surfaces between dies or wafers, enabling finer interconnect pitch for advanced 3D integration.
Interposer : Intermediate layer connecting multiple dies within a package through highdensity electrical interconnects; commonly used in 2.5D packaging.
M
KGD: Known-Good Die : Die that has been tested and confirmed functional before being incorporated into a multi-die package, helping reduce yield-related losses.
Logic Folding : Huawei's logic-stacking approach that uses vertical integration to shorten signal paths and increase effective transistor density through system-, circuit- and packaging-level innovation.
Micro-bump : Very small conductive bump used to create fine-pitch electrical connections between dies in advanced packages.
NPU: Neural Processing Unit Processor optimized specifically for neural-network and AI workloads.
OSAT: Outsourced Semiconductor Assembly and Test Semiconductor service provider specializing in chip assembly, packaging and testing. JCET, SJ Semi, ASE and Amkor are examples discussed in the report.
Panel-Level Packaging : Packaging approach that processes semiconductor packages on large rectangular panels rather than conventional circular wafers, potentially improving manufacturing efficiency and cost at scale.
RDL: Redistribution Layer Fine metal wiring layers that redistribute electrical connections between dies, bumps and other package components.
Singulation Package / Die Singulation Process of separating individual semiconductor dies or packages from a processed wafer or panel.
SoC: System-on-Chip Semiconductor integrating multiple system functions, such as processing, memory control and I/O, onto a single chip.
SoIC: System on Integrated Chips TSMC's 3D integration platform for vertically stacking semiconductor dies using high-density interconnect technologies.
TCB: Thermo-Compression Bonding Precision bonding process that uses heat and pressure to connect dies, increasingly important for HBM and advanced 2.5D/3D packaging.
TSV: Through-Silicon Via Vertical electrical connection passing through silicon, enabling high-density connections through interposers or vertically stacked dies.
UTR: Utilization Rate Proportion of installed manufacturing capacity that is actually being used. A key measure of advanced-packaging supply-demand balance.
W2W: Wafer-to-Wafer 3D integration approach in which two complete wafers are aligned and bonded before being diced into individual devices.
Wafer Thinning: Wafer Thinning / Grinding Process of reducing wafer thickness, enabling thinner dies and tighter vertical stacking in HBM and 3D packages.
WLCSP: Wafer-Level Chip-Scale Package Wafer-level packaging in which the completed package is approximately the same size as the semiconductor die.
WLPL Wafer-Level Packaging Packaging process performed while semiconductor dies remain part of the wafer rather than after individual die singulation.
XDFOI: XDFOI Advanced Packaging Platform JCET's advanced packaging platform used
M
for high-density and heterogeneous integration applications.
M
Important note regarding economic sanctions.
Disclaimer:
This research references U.S. Executive Order 14032 and/or entities or securities that are designated thereunder. U.S. persons may be prohibited from buying certain securities of entities named in this research. Readers are solely responsible for ensuring that their investment activities are carried out in compliance with applicable laws.
This report references export controls and/or entities that may be subject to export control restrictions. Readers are solely responsible for ensuring that their investment or trade activities are carried out in compliance with applicable laws.
This report references U.S. Executive Order 14105 and/or entities that may be in scope of such order. U.S. persons may be prohibited from engaging in certain transactions or otherwise require certain other transactions be notified to the U.S. Department of Treasury. Readers are solely responsible for ensuring that their investment or trade activities are carried out in compliance with applicable laws.
M
Risk Reward Reference links
- View explanation of Options Probabilities methodology -
Options_Probabilities_Exhibit_Link.pdf
-
View descriptions of Risk Rewards Themes - RR_Themes_Exhibit_Link.pdf
-
View explanation of regional hierarchies - GEG_Exhibit_Link.pdf
-
View explanation of Theme/Exposure methodology -
ESG_Sustainable_Solutions_External_Link.pdf
- View explanation of HERS methodology - ESG_HERS_External_Link.pdf
M
Disclosure Section
The information and opinions in Morgan Stanley Research were prepared or are disseminated by Morgan Stanley Asia Limited (which accepts the responsibility for its contents) and/or Morgan Stanley Asia (Singapore) Pte. (Registration number 199206298Z) and/or Morgan Stanley Asia (Singapore) Securities Pte Ltd (Registration number 200008434H), regulated by the Monetary Authority of Singapore (which accepts legal responsibility for its contents and should be contacted with respect to any matters arising from, or in connection with, Morgan Stanley Research), and/or Morgan Stanley Taiwan Limited and/or Morgan Stanley & Co International plc, Seoul Branch, and/or Morgan Stanley Australia Limited (A.B.N. 67 003 734 576, holder of Australian financial services license No. 233742, which accepts responsibility for its contents), and/or Morgan Stanley Wealth Management Australia Pty Ltd (A.B.N. 19 009 145 555, holder of Australian financial services license No. 240813, which accepts responsibility for its contents), and/or Morgan Stanley India Company Private Limited having Corporate Identification No (CIN) U22990MH1998PTC115305, regulated by the Securities and Exchange Board of India ('SEBI') and holder of licenses as a Research Analyst (SEBI Registration No. INH000001105); Stock Broker (SEBI Stock Broker Registration No. INZ000244438), Merchant Banker (SEBI Registration No. INM000011203), and depository participant with National Securities Depository Limited (SEBI Registration No. IN-DP-NSDL-567-2021) having registered office at Altimus, Level 39 & 40, Pandurang Budhkar Marg, Worli, Mumbai 400018, India; Telephone no. +91-22-61181000; Compliance Officer Details: Mr. Tejarshi Hardas, Tel. No.: +91-22-61181000 or Email: tejarshi.hardas@morganstanley.com; Grievance officer details: Mr. Tejarshi Hardas, Tel. No.: +91-22-61181000 or Email: msic-compliance@morganstanley.com which accepts the responsibility for its contents and should be contacted with respect to any matters arising from, or in connection with, Morgan Stanley Research, and their affiliates (collectively, "Morgan Stanley"). Morgan Stanley India Company Private Limited (MSICPL) may use AI tools in providing research services. All recommendations contained herein are made by the duly qualified research analysts.
For important disclosures, stock price charts and equity rating histories regarding companies that are the subject of this report, please see the Morgan Stanley Research Disclosure Website at www.morganstanley.com/eqr/disclosures/webapp/generalresearch, or contact your investment representative or Morgan Stanley Research at 1585 Broadway, (Attention: Research Management), New York, NY, 10036 USA.
For valuation methodology and risks associated with any recommendation, rating or price target referenced in this research report, please contact the Client Support Team as follows: US/Canada +1 800 303-2495; Hong Kong +852 2848-5999; Latin America +1 718 754-5444 (U.S.); London +44 (0)20-7425-8169; Singapore +65 6834-6860; Sydney +61 (0)2-9770-1505; Tokyo +81 (0)3-6836-9000. Alternatively you may contact your investment representative or Morgan Stanley Research at 1585 Broadway, (Attention: Research Management), New York, NY 10036 USA.