PDF 原檔:報告_JPM_奇鋐3017_20260929_original.pdf
圖片清單(已驗證 2026-09-30)
ingest 時建立的「眼見為憑」圖片索引,是 lib/ 嵌圖的唯一真相來源;嵌入時只從這裡挑分類為「真資料圖」的,不照 trimmed 引用順序猜。
| 檔名 | size | 分類 | 親眼所見內容 |
|---|---|---|---|
報告_JPM_奇鋐3017_20260929_001.png |
44KB | 真資料圖 | Price Performance 折線圖:3017.TW 股價(藍線)vs TSE rebased(灰線),2025-10 至 2026-10 |
報告_JPM_奇鋐3017_20260929_003.png |
88KB | 真資料圖 | AVC (3017.TW) Price vs Taiex 折線圖(Figure 1),2025-01 至 2026-09,深綠線為 AVC 股價(NTD)、淺藍線為 TAIEX rebased |
報告_JPM_奇鋐3017_20260929_008.png |
42KB | 真資料圖 | 長條圖+折線圖(Figure 6):AVC 營收(NT$bn,柱)與營收 YoY 成長率(%,折線),2018-2028E,2028E 營收 428、YoY 21% |
報告_JPM_奇鋐3017_20260929_009.png |
44KB | 真資料圖 | 長條圖+折線圖(Figure 8):AVC 營業利益(NT$bn,柱)與營益率(%,折線),2018-2028E,2028E OP 140、OPM 32.2% |
報告_JPM_奇鋐3017_20260929_010.png |
43KB | 真資料圖 | 長條圖+折線圖(Figure 7):AVC 毛利(NT$bn,柱)與毛利率(%,折線),2018-2028E,2028E GP 158、GM 37.0% |
報告_JPM_奇鋐3017_20260929_011.png |
46KB | 真資料圖 | 長條圖+折線圖(Figure 9):AVC EPS(NT$,柱)與 EPS YoY 成長率(%,折線),2018-2028E,2028E EPS 236.3、YoY 26% |
<40KB(002/004/005/006/007)未逐張 Read,預設 logo/裝飾圖,未列入清單。
原始內容
Asia Vital Components
New wave of cold plate upgrades with double-sided design + diamond and copper; A C the biggest winner; assume coverage at OW with PT of NT$5,200
A new wave of cold-plate upgrades is setting up a multi-year content step-up in AI server liquid cooling and we see AVC as the clearest winner. We assume coverage at Overweight with a Street-high December 2027 price target of NT$5 200 based on a 22x 2028E P/E which implies ~55% upside from the current share price. Our 2026/27/28 estimares are 3%/16%/16% higher than Bloomberg consensus driven by the four tangible earnings levers we expect: (1) ASP increases on select switch-tray cold plates that lift 2H26 revenue and gross margin via a better mix/yield; (2) double-sided cold-plate designs plus diamond and copper adoption that raises content in Nvidia VR Ultra (VRU) systems from 2Q/2H27; (3) broader ASIC cooling complexity into 2H27/2028 (Google TPU v9 AWS Trn4 etc.) and (4) rising liquid cooling adoption in OSFP (Octal Small Form-factor Pluggable)/ELSFP (External Laser Small Form-Factor Pluggable) optical modules. We expect AVC's share price to continue outperforming with faster earnings upgrades over the next 6-12 months. With this note we transfer coverage of Asia Vital Components to Megan Hsueh.
- Double-sided cold plate design potentially for Nvidia VRU and Google TPU v9, in addition to A S Trn3 and AMD MI450; diamond copper to add value. We believe the double-sided cold plate design is already set to be adopted in Trn3 and MI450 compute trays from 4Q26 onwards and will likely be adopted in VRU compute trays as well from 2Q/2H27 onwards suggesting incremental cold plates for backside cooling. In addition we believe VRU cold plates may start adopting the diamond and copper material. Both the additional cold plate units and the new material adoption would increase the cooling content meaningfully for VRU compute trays (US$3k-3.5k per tray 50% higher vs the previous generation). TPU v8 also creates decent cooling content due to its gold-plating design for TPU cold plates as well as additional cold plate units for surrounding ICs. As for TPU v9 we believe a larger die size and higher TDP will increase the likelihood of double-sided cold plate adoption. In our view AVC has secured major shares in these GPU and ASIC projects with meaningful spec upgrades making it the main beneficiary of higher content growth than market expectations.
- More GM upside on enhanced mix and yield, along with a successful ASP increase for certain cold plate projects. We expect AVC to deliver further GM upside into 3Q and 4Q26 by reaching the 34% and 35% level (vs consensus at ~33% and 34%) suggesting solid growth vs 1Q/2Q GM of 30% and 33% driven by a better product mix (more ASIC contribution) and increasing yield/ automation. Also we believe AVC has successfully raised ASP for some of its cold plate products (mainly for Nvidia/Mellanox switch trays in our view) to reflect higher costs from materials and labor overtime pay helping to maintain its margin while benefiting its revenue growth momentum. Coupled with the mass production of VR200 and the liquid-cooled ASICs (Trn3 and TPU v8) in 3Q and 4Q26 we model AVC's revenue to grow 18% QoQ and another 19% growth rates which are above consensus by 1% and 5%.
Sour es for: Style Exposure - J.P. Morgan Global Markets Strategy; all other tables are ompany data and J.P. Morgan estimates.
See page 13 for a alyst certificatio a d importa t disclosures, i cludi g o -US a alyst disclosures.
Overweight
017.TW, 017 TT Price (29 Sep 26):NT$3,400.00
▲Price Target (Dec-27):NT$5,200.00 Prior (Jun-27):NT$4,000.00
Technology
Megan Hsueh AC
(886-2) 2725-9249 megan.hsueh@jpmorgan.com
J.P. Morgan Securities (Taiwan) Limited
Gokul Hariharan
(852) 2800-8564 gokul.hariharan@jpmorgan.com J.P. Morgan Securities (Asia Pacific) Limited/ J.P. Morgan Broking (Hong Kong) Limited
Albert Hung
(886-2) 2725-9875 albert.hung@jpmchase.com
J.P. Morgan Securities (Taiwan) Limited/ J.P. Morgan Securities (Asia Pacific) Limited/ J.P. Morgan Broking (Hong Kong) Limited
| Key Changes (FYE Dec) | Key Changes (FYE Dec) - Prev | Key Changes (FYE Dec) - Cur | Key Changes (FYE Dec) - Δ |
|---|---|---|---|
| Adj. EPS - 27E (NT$) | 162.77 | 186.82 | 14.8% |
| Quarterly Forecasts (FYE Dec) | Quarterly Forecasts (FYE Dec) | Quarterly Forecasts (FYE Dec) | Quarterly Forecasts (FYE Dec) |
| Adj. | 2025A | 2026E | 2027E |
| Q1 | 8.28 | 20.17A | 35.29 |
| Q2 | 10.30 | 24.37A | 41.53 |
| Q3 | 13.67 | 28.60 | 51.68 |
| Q4 | 17.01 | 35.12 | 58.32 |
| FY | 49.29 | 108.25 | 186.82 |
Style Exposure
| Quant - Factors | Current - %Rank | Hist %Rank (1=Top) - 6M | Hist %Rank (1=Top) - 1Y | Hist %Rank (1=Top) - 3Y | Hist %Rank (1=Top) - 5Y |
|---|---|---|---|---|---|
| Value | 65 | 99 | 51 | 53 | 24 |
| Growth | 7 | 4 | 4 | 24 | 35 |
| Momentum | 24 | 16 | 6 | 4 | 31 |
| Quality | 1 | 12 | 12 | 22 | 22 |
| Low Vol | 74 | 80 | 90 | 84 | 75 |
— 3017.TW Price (NT$)
— TSE (rebased)
| YTD | 1m | 3m | 12m | |
|---|---|---|---|---|
| Abs | 125.2% | 1.2% | 47.8% | 261.3% |
| Rel | 60.7% | -1.6% | 42.0% | 176.8% |
Company Data
| Shares O/S (mn) | 393 |
|---|---|
| 52-week range (NT$) | 3,600.00-955.05 |
| Market ap ($ mn) | 42,001 |
| Ex hange rate | 31.78 |
| Free float (%) | 74.6% |
| 3M ADV (mn) | 4.09 |
| 3M ADV ($ mn) | 360.0 |
| Volatility (90 Day) | 71 |
| Index | TAIEX |
| BBG ANR (Buy | Hold | Sell) | 20|1|0 |
Key Metrics (FYE Dec)
| NT$ i millio s | FY25A | FY26E | FY27E | FY28E |
|---|---|---|---|---|
| Fi a cial Estimates | ||||
| Revenue | 139,639 | 224,423 | 352,117 | 427,716 |
| Adj. EBIT | 27,556 | 62,445 | 109,252 | 137,601 |
| Adj. EBITDA | 30,802 | 67,175 | 115,351 | 144,926 |
| Adj. net in ome | 19,186 | 42,490 | 73,325 | 92,736 |
| Adj. EPS | 49.29 | 108.25 | 186.82 | 236.28 |
| BBG EPS | 49.50 | 104.74 | 161.19 | 204.05 |
| Cashflow from operations | 36,818 | 43,397 | 89,076 | 103,570 |
| FCFF | 29,528 | 30,222 | 79,429 | 93,899 |
| Margi s a d Growth | ||||
| Revenue Growth Y/Y (%) | 94.6% | 60.7% | 56.9% | 21.5% |
| EBIT margin | 19.7% | 27.8% | 31.0% | 32.2% |
| EBIT Growth Y/Y (%) | 154.6% | 126.6% | 75.0% | 25.9% |
| EBITDA margin | 22.1% | 29.9% | 32.8% | 33.9% |
| EBITDA Growth Y/Y (%) | 131.8% | 118.1% | 71.7% | 25.6% |
| Net margin | 13.7% | 18.9% | 20.8% | 21.7% |
| Adj. EPS growth | 131.9% | 119.6% | 72.6% | 26.5% |
| Ratios | ||||
| Adj. tax rate | 27.2% | 27.2% | 28.0% | 28.0% |
| Interest over | NM | NM | NM | NM |
| Net debt/Equity | NM | NM | NM | NM |
| Net debt/EBITDA | NM | NM | NM | NM |
| ROE | 45.7% | 65.6% | 68.9% | 56.3% |
| Valuatio | ||||
| FCFF yield | 2.2% | 2.3% | 6.0% | 7.0% |
| Dividend yield | 0.3% | 0.6% | 1.4% | 2.4% |
| EV/Revenue | 4.3 | 4.4 | 2.7 | 2.1 |
| EV/EBITDA | 19.3 | 14.7 | 8.1 | 6.1 |
| Adj. P/E | 69.0 | 31.4 | 18.2 | 14.4 |
Summary Investment Thesis and Valuation
Investment Thesis
We are OW on AVC for its strong earnings growth potential which we think is supported by the content increase in AI servers. We expect AVC to see increasing upside from more liquid cooling opportunities with much higher ASP and margin while its competitive advantages vs. peers could give it further market share gains as the industry's structural trends develop.
Valuation
Our Dec-27 PT of NT$5 200 is based on 22x 2028E P/E. The target multiple is at the mid to high end of AVC's historical average trading range of 15-25x P/E since the start of the AI server boom as we expect an earnings upgrade cycle (based on our above-consensus estimates in 2027-28) to support this valuation.
| Factors | 6M Corr | 1Y Corr |
|---|---|---|
| Market: MSCI Asia Pac ex JP | 0.19 | 0.32 |
| Region: Taiwan | 0.70 | 0.51 |
| Macro: | ||
| Citi Economic Surprise - EM | 0.17 | 0.27 |
| JPM China A-shares Sentiment | 0.25 | 0.24 |
| US 10 Year Yield | 0.26 | 0.23 |
| Quant Styles: | ||
| Quality | 0.25 | 0.24 |
| Momentum | 0.03 | 0.08 |
| LowVol | 0.13 | 0.06 |
- Undemanding valuation as the key winner in the stronger-than-expected cold plate upgrades. AVC is now trading at ~20x 12-month forward P/E largely in line with its past trading average since the start of the AI server boom. We apply a 22x 2028E P/E valuation to reflect a multi-quarter earnings upgrade path tied to both Nvidia VRU and multiple ASIC-driven content expansions. The upside case strengthens if TPU v9 adopts doublesided designs and Trn4 adds incremental cold plates for NPO/CPO. Key investment risks include slower-than-expected spec upgrades market share loss from the current leading position (~50% in each AI project) and pricing pressure.
Earnings estimates
JPM's above-consensus forecasts
Our 2026/27/28 EPS forecasts are 3%/16%/16% above Bloomberg consensus reflecting (1) ASP increases of select switch-tray cold plates (2) double-sided cold-plate designs plus 'diamond copper' adoption potentially in Nvidia VRU (3) broader ASIC cooling complexity into 2H27/2028 and (4) structural margin expansion.
Table 1: J.P. Morga estimates vs Bloomberg co se sus
| (NT$M) | JPMe - 3Q26E | JPMe - 4Q26E | JPMe - 2026E | JPMe - 2027E | JPMe - 2028E | Bloomberg - 3Q26E | Bloomberg - 4Q26E | Bloomberg - 2026E | Bloomberg - 2027E | Bloomberg - 2028E | Diff - 3Q26E | Diff - 4Q26E | Diff - 2026E | Diff - 2027E | Diff - 2028E |
|---|---|---|---|---|---|---|---|---|---|---|---|---|---|---|---|
| Sales | 57,770 | 68,493 | 224,423 | 352,117 | 427,716 | 57,349 | 65,404 | 221,582 | 314,967 | 393,577 | 1% | 5% | 1% | 12% | 9% |
| Gross profit | 19,653 | 23,949 | 74,197 | 127,221 | 158,179 | 19,117 | 22,207 | 71,458 | 107,810 | 133,234 | 3% | 8% | 4% | 18% | 19% |
| GM | 34.0% | 35.0% | 33.1% | 36.1% | 37.0% | 33.3% | 34.0% | 32.2% | 34.2% | 33.9% | 68 bps | 101 bps | 81 bps | 190 bps | 313 bps |
| Operating profit | 16,562 | 20,387 | 62,445 | 109,252 | 137,601 | 16,072 | 18,619 | 59,800 | 91,980 | 116,022 | 3% | 9% | 4% | 19% | 19% |
| OPM | 28.7% | 29.8% | 27.8% | 31.0% | 32.2% | 28.0% | 28.5% | 27.0% | 29.2% | 29.5% | 64 bps | 130 bps | 84 bps | 182 bps | 269 bps |
| Net Income | 11,225 | 13,783 | 42,490 | 73,325 | 92,736 | 11,135 | 12,802 | 41,232 | 63,520 | 80,340 | 1% | 8% | 3% | 15% | 15% |
| EPS (NT$) | 28.6 | 35.1 | 108.3 | 186.8 | 236.3 | 28.1 | 32.4 | 104.7 | 161.2 | 204.1 | 2% | 8% | 3% | 16% | 16% |
Sour e: Bloomberg Finan e L.P., J.P. Morgan estimates.
Key risks to ourestimates, price target and rating
- Slower-than-expected spec upgrades in future AI systems: We believe AI GPU and ASIC customers' new product generation launches will be the main driver of continued cooling spec upgrades. However if the launch timing of next-gen products is delayed or spec improvement is limited AVC's growth estimates may have to be slightly moderated.
- Market share loss: We regard share loss as a milder risk as the entry barrier for cold plate modules has become higher especially because the AI server migration cadence remains at the short 1-2 year cycle. Coupled with customers' preference for a limited numbers of suppliers (usually 2-3) we do not think there will be a major market share shift.
- ASP/margin pressure: As Nvidia has put cold plates into its 'Group A' components meaning standardization from the VR200 generation investors may be worried about the potential ASP and GM pressure given less differentiation among peers. However we believe AVC's 2Q26 and potentially 2H26 GM may continue to beat investor expectations with stronger expansion thanks to its continued yield enhancement better-than-expected cooling content growth with its stable market share and rising ASIC contribution (with higher content and margin vs GPU projects).
Performance and aluation
Share price performance
Figure 1: AVC's share price vs the Taiex
Sour e: Bloomberg Finan e L.P.
- In 2025 AVC's share price underperformed in 1H given market concerns about cold plate ASP/margin decline when Nvidia added cold plates to its Group A components for VR200 (implying standardization). However the share price outperformed in 2H given the confirmation of a total content value increase of 'tray level' thanks to the fanless design of VR200 with an additional number of cold plates being adopted per tray.
- In 1H26 AVC's share price continued to outperform the Taiex with new TAM expansion opportunities from both ASICs and Nvidia's new rack solutions such as LPX rack Vera CPU rack and CPO-related solutions.
- In 3Q26 AVC's share price corrected meaningfully (even more than other AI subsectors) in July given the overall market pullback from de-leveraging and incrementally from the delay of VR200. However it has rebounded rapidly since August thanks to 1) a reported GM/EPS numbers beat 2) a smoother VR200 ramp in late 3Q26 and 3) the higher-content ASIC projects being expected to enter mass production in 4Q26 to drive further revenue and margin expansion.
Valuation
We derive our Dec-27 price target of NT$5 200 based on a 22x 2028E P/E. The target multiple is at the mid to high end of AVC's historical average trading range of 15-25x P/ E since the start of the AI server boom as we expect an earnings upgrade cycle (based on our above-consensus estimates in 2027-28) to support this valuation.
Table 2: AVC's tradi g multiple (from Ja uary 2023 to date, whe the AI server boom started)
| x | 12M trailing P/E | 12M fwd P/E | 12M trailing P/B | 12M fwd P/B |
|---|---|---|---|---|
| Standard deviation | 8.5 | 4.6 | 4.3 | 2.5 |
| Max | 47.1 | 24.7 | 19.5 | 11.7 |
| Minimum | 8.8 | 5.3 | 2.1 | 1.5 |
| Median | 26.8 | 14.3 | 7.4 | 5.2 |
| Average | 26.5 | 14.3 | 8.2 | 5.5 |
Sour e: Bloomberg Finan e L.P., J.P. Morgan estimates.
Figure 2: AVC's 1yr forward P/E
Sour e: Bloomberg Finan e L.P., J.P. Morgan estimates.
Figure 4: AVC's 1yr forward P/B
Sour e: Bloomberg Finan e L.P., J.P. Morgan estimates.
Figure 3: AVC's 1yr forward P/E vs mea
Sour e: Bloomberg Finan e L.P., J.P. Morgan estimates
Figure 5: AVC's 1yr forward P/B vs mea
Sour e: Bloomberg Finan e L.P., J.P. Morgan estimates.
100%
90%
80%
70%
60%
50%
40%
30%
20%
10%
Financial Analysis
We forecast AVC's revenue to increase 61%/57%/22% YoY in 2026/27/28 supported by the stronger-than-expected cold plate spec upgrades and content growth in both GPU and ASIC systems with the company's continued leading share in these high-spec projects.
AVC's 2Q26 gross margin expanded to 33% thanks to continued yield enhancement of liquid cooling products. We believe the company's margin will continue to surprise ro the upside in 2H26-2028 driven by the near-term favorable product mix from VR200 and multiple new ASIC project ramp along with longer-term continued spec upgrades which support our gross margin forecast of 33%/36%/37% in 2026/27/28. The stronger GM growth also serves as the key driver of our bottom-line EPS growth forecasts of 120%/73%/27% in 2026/27/28.
Figure 6: AVC's reve ue a d reve ue YoY growth
NT$bn, %
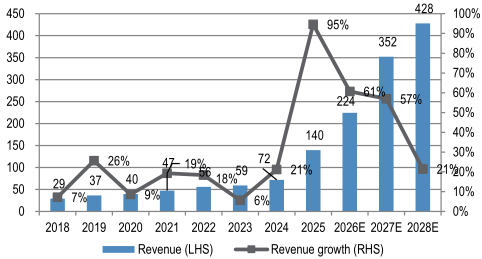
Sour e: Company data, J.P. Morgan estimates.
Figure 8: AVC's OP a d OPM
Sour e: Company data, J.P. Morgan estimates.
Figure 7: AVC's GP a d GPM
NT$bn, %
Sour e: Company data, J.P. Morgan estimates.
Figure 9: AVC's EPS a d EPS YoY growth
NT$bn, %
Sour e: Company data, J.P. Morgan estimates.
160.0
140.0
120.0
100.0
80.0
60.0
40.0
20.0
Table 3: I come stateme t
| (NT$ in Mn, year-end December) | 2024 - 1Q | 2024 - 2Q | 2024 - 3Q | 2024 - 4Q | 2025 - 1Q | 2025 - 2Q | 2025 - 3Q | 2026E - 4Q | 2026E - 1Q | 2026E - 2Q | 2026E - 3QE | 4QE | 1QE | 2QE | 4QE 2027E | 3QE 1QE | 2QE | 3QE | 2024 | 4QE 2028E | 4QE 2028E | 4QE 2028E - 2025 | 4QE 2028E - 2026E | 2027E | 2028E | 2028E | 2028E | 2028E | 2028E | 2028E | 2028E | 2028E | 2028E | ||||
|---|---|---|---|---|---|---|---|---|---|---|---|---|---|---|---|---|---|---|---|---|---|---|---|---|---|---|---|---|---|---|---|---|---|---|---|---|---|
| Revenue | 15,309 | 16,484 | 19,065 | 20,904 | 23,333 | 29,595 | 38,937 | 47,775 | 49,038 | 49,121 | 57,770 | 68,493 | 69,271 | 79,928 | 96,381 | 106,537 | 92,408 | 101,446 | 111,776 | 122,085 71,761 | 139,639 224,423 | 352,117 | 427,716 | 427,716 | 427,716 | 427,716 | 427,716 | 427,716 | 427,716 | 427,716 | 427,716 | ||||||
| Depreciation | 537 | 572 | 609 | 666 | 748 | 727 | 815 | 896 | 996 | 1,120 | 1,226 | 1,293 | 1,381 | 1,462 | 1,528 | 1,604 | 1,682 | 1,757 | 1,831 | 1,906 | 2,384 3,186 | 4,634 | 5,974 | 7,176 | 7,176 | 7,176 | 7,176 | 7,176 | 7,176 | 7,176 | 7,176 | 7,176 | |||||
| COGS | 11,936 | 12,690 | 14,584 | 15,680 | 17,305 | 22,370 | 28,765 | 35,165 | 34,441 | 33,122 | 38,118 | 44,545 | 44,924 | 51,477 | 61,314 | 67,182 | 58,809 | 63,982 | 70,317 | 76,430 | 54,891 103,605 | 150,225 | 224,896 | 269,537 | 269,537 | 269,537 | 269,537 | 269,537 | 269,537 | 269,537 | 269,537 | 269,537 | |||||
| Gross profit | 3,372 | 3,794 | 4,480 | 5,224 | 6,028 | 7,224 | 10,172 | 12,610 | 14,597 | 15,999 | 19,653 | 23,949 | 24,348 | 28,451 | 35,067 | 39,355 | 33,599 | 37,464 | 41,460 | 45,656 | 16,870 | 36,034 | 74,197 | 127,221 | 158,179 | 158,179 | 158,179 | 158,179 | 158,179 | 158,179 | 158,179 | 158,179 | 158,179 | ||||
| Operating expense | 1,437 | 1,367 | 1,372 | 1,871 | 1,667 | 2,130 | 2,086 | 2,595 | 2,578 | 2,521 | 3,562 | 3,091 | 3,671 | 4,156 | 4,867 | 5,274 | 4,620 | 4,971 | 5,309 | 5,677 | 6,048 | 11,752 | 17,968 | 8,478 20,578 | 8,478 20,578 | 8,478 20,578 | 8,478 20,578 | 8,478 20,578 | 8,478 20,578 | 8,478 20,578 | 8,478 20,578 | 8,478 20,578 | |||||
| Operating income | 1,935 | 2,427 | 3,108 | 3,353 | 4,361 | 5,095 | 8,085 | 10,015 | 12,019 | 13,478 | 16,562 | 20,387 | 20,676 | 24,294 | 30,200 | 34,082 | 28,979 32,493 | 36,150 | 10,823 | 39,979 27,556 | 62,445 | 109,252 | 137,601 | 137,601 | 137,601 | 137,601 | 137,601 | 137,601 | 137,601 | 137,601 | 137,601 | ||||||
| Net Interest Income | -6 | 49 | 18 | 53 | -31 | 34 | -15 | 103 | -10 | 255 | 70 | 36 | -13 | 25 | 66 | 73 | 135 178 | 234 | 219 | 114 | 91 | 351 | 152 | 766 | |||||||||||||
| Net Other Income | 401 | 460 | 302 | 253 | 291 | 768 | 146 | -66 | -30 | 202 | 0 | 0 | 0 | 0 | 0 | 0 | 0 | 0 | 0 | 0 | 1,415 | 172 | 1,140 | 0 | 0 | 0 | 0 | 0 | |||||||||
| Non-op gain (loss) | 395 | 508 | 320 | 306 | 259 | 802 | 132 | 38 | -40 | 457 | 70 | 36 | -13 | 25 | 66 | 73 | 135 | 178 | 234 219 | 1,529 | 523 | 1,231 | 62,969 | 152 | 766 | 766 | 766 | 766 | 766 | ||||||||
| Pre-tax profit | 2,330 | 2,935 | 3,428 | 3,659 | 4,620 | 5,896 | 8,217 | 10,053 | 11,979 13,935 | 16,632 | 20,423 | 20,664 | 24,319 | 30,266 | 34,155 | 29,113 | 32,671 | 36,385 | 40,198 | 28,786 | 12,352 | 109,404 | 138,367 | 138,367 | 138,367 | 138,367 | 138,367 | ||||||||||
| Tax expense (credit) | 579 | 775 | 826 | 978 | 1,110 | 1,624 | 2,307 | 2,794 3,304 | 3,657 | 4,574 | 5,616 | 5,786 | 6,809 | 8,475 | 9,563 | 8,152 | 9,148 | 10,188 | 11,255 | 3,159 | 7,836 17,151 | 30,633 | 38,743 | ||||||||||||||
| Net profit reported | 1,564 | 1,947 | 2,324 | 2,338 | 3,214 | 3,997 | 5,339 | 6,636 | 7,916 | 9,567 | 11,225 | 13,783 | 13,849 | 16,299 | 20,285 | 22,891 | 19,512 | 21,897 | 24,386 | 8,172 | 42,490 | 26,941 | 19,186 | 73,325 | 92,736 | ||||||||||||
| EPS (NT$) | 4.1 | 5.1 | 6.0 | 6.1 | 8.3 | 10.3 | 13.7 | 17.0 | 20.2 | 24.4 | 28.6 | 35.1 | 35.3 | 41.5 | 51.7 | 58.3 | 49.7 | 55.8 | 62.1 | 68.6 | 21.3 49.3 | 108.3 | 236.3 | 186.8 | |||||||||||||
| Margins (%) | |||||||||||||||||||||||||||||||||||||
| Gross Margin | 22.0 | 23.0 | 23.5 | 25.0 | 25.8 | 24.4 | 26.1 | 29.8 | 32.6 | 26.4 34.0 | 35.0 | 35.1 | 35.6 | 36.9 | 36.4 | 36.4 | 36.9 | 37.1 | 37.4 23.5 | 25.8 | 33.1 36.1 | 37.0 | 37.0 | 37.0 | 37.0 | 37.0 | 37.0 | 37.0 | 37.0 | ||||||||
| - Opex ratio | 9.4 | 8.3 | 7.2 | 8.9 | 7.1 | 7.2 | 5.4 | 5.4 | 5.1 | 5.4 | 5.3 5.2 | 5.3 | 5.2 | 5.0 | 5.1 | 5.0 | 4.9 8.4 | 4.8 | 4.7 | 6.1 | 5.1 | 5.2 4.8 | |||||||||||||||
| Operating Margin | 12.6 | 14.7 | 16.3 | 16.0 | 18.7 | 17.2 | 20.8 | 21.0 | 24.5 | 27.4 | 28.7 29.8 | 29.8 | 30.4 | 31.3 | 32.0 | 31.4 | 32.0 | 32.3 | 32.7 | 15.1 | 19.7 | 27.8 | 31.0 | 32.2 | 32.2 | ||||||||||||
| EBITDA Margin | 16.1 | 18.2 | 19.5 | 19.2 | 21.9 | 19.7 | 22.9 | 22.8 13.9 | 26.5 | 29.7 | 30.8 31.7 | 31.8 | 32.2 | 32.9 | 33.5 | 33.2 | 33.8 34.3 | 22.0 | 34.0 | 18.4 | 29.9 32.7 | 20.8 | 33.8 21.7 | ||||||||||||||
| Net Margin | 10.2 | 11.8 | 12.2 | 11.2 | 13.8 | 13.5 | 13.7 | 16.1 | 19.5 | 19.4 | 20.1 | 20.0 | 20.4 | 21.0 | 21.5 | 21.1 | 21.6 | 21.8 | 22.1 11.4 | 13.7 | 18.9 | ||||||||||||||||
| Sequential Growth (%) | |||||||||||||||||||||||||||||||||||||
| Revenue | -8.4 | 7.7 | 15.7 9.6 | 11.6 | 26.8 | 31.6 | 22.7 | 2.6 | 0.2 | 17.6 | 18.6 | 1.1 | 15.4 | 20.6 | 10.5 | -13.3 | 9.8 | 10.2 | 9.2 | ||||||||||||||||||
| Gross Profit | -7.5 | 12.5 | 18.1 | 16.6 | 15.4 | 19.8 | 40.8 | 24.0 | 15.8 | 9.6 | 22.8 | 21.9 | 1.7 | 16.9 | 23.3 | 12.2 | -14.6 | 11.5 | 10.7 | 10.1 | |||||||||||||||||
| EBIT EPS | -19.9 -8.2 | 25.4 24.5 | 28.1 | 7.9 0.8 | 30.1 36.5 | 16.8 24.4 | 58.7 32.8 | 24.4 | 20.0 18.6 | 12.1 20.8 | 17.4 | 23.9 22.9 | 23.1 22.8 | 1.4 0.5 | 17.5 | 17.7 | 24.3 | 12.9 | -15.0 | -14.8 | 12.1 12.2 | 11.4 | 11.3 | 10.6 | 10.5 | ||||||||||||
| YoY Growth (%) Revenue | 29.4 79.5 | 10.8 | 18.5 20.9 | 25.0 | 52.4 | 104.2 | 128.5 | 110.2 | 66.0 | 48.4 43.4 | 41.3 | 62.7 | 24.5 | 66.8 | 12.8 55.5 | 33.4 | 26.9 | 16.0 | 14.6 | 94.6 | 21.2 | 60.7 | 56.9 21.5 | 56.9 21.5 | 56.9 21.5 | 56.9 21.5 | 56.9 21.5 | ||||||||||
| Gross Profit | 44.4 43.1 | 26.9 | 31.2 | 43.3 38.8 | 78.7 125.4 | 109.9 | 127.0 160.2 | 198.7 | 141.4 | 142.2 121.5 175.6 | 93.2 164.5 104.8 | 89.9 | 66.8 | 77.8 | 78.4 82.3 | 64.3 | 90.4 | 40.2 | 38.0 | 31.7 | 18.2 36.2 | 17.3 | 16.0 | 113.6 | 105.9 | 71.5 | 24.3 | ||||||||||
| EBIT EPS | 56.8 59.8 | 47.6 61.8 | 36.5 | 127.1 | 143.6 | 103.6 | 72.0 | 80.3 | 67.2 | 33.7 | 19.7 | 20.2 | 45.8 131.9 | 119.6 | 75.0 | 154.6 25.9 | 154.6 25.9 | 154.6 25.9 | 154.6 25.9 | 126.6 | 154.6 25.9 | 154.6 25.9 | 154.6 25.9 | 154.6 25.9 | |||||||||||||
| Sales mix (%) Thermal Solutions Consumer Telecom Server Others Chassis PC/AIO Server System Assembly Fositek (Hinge) | 43.2 51% 60% 15% 12% 14% 9% 20% 36% 3% 2% 13% 17% 2% 2% 11% 15% 25% 15% 11% 9% | 55% 16% 13% 23% 3% 13% 2% 11% 22% 10% | 58% 14% 13% 27% 4% 12% 2% 10% 19% 10% | 52% 12% 10% 27% 3% 15% 2% 13% 20% 13% | 102.9 59% 13% 11% 32% 3% 16% 2% 13% 16% 10% | 102.7 | 63% 15% 39% 17% 15% 11% | 180.3 11% 6% 34% 2% 2% 20% 9% | 64% 47% 20% 19% | 136.6 62% 8% 6% 46% 2% 21% 1% 20% 9% 8% | 63% 66% 9% 8% 5% 3% 48% 53% 1% 1% 21% 19% 1% 1% 21% 18% 8% 7% 8% 8% | 109.2 51% 4% 2% 21% 1% 20% 8% | 106.5 9% 6% 1% 1% 8% 9% | 66% 7% 4% 53% 1% 19% 1% 18% 7% 9% | 68% 6% 4% 57% 1% 17% 1% 16% 6% 9% | 75.0 | 70.4 72% 5% 3% 63% 1% 15% 0% 14% 5% 8% | 80.7 74% 5% 2% 66% 1% 14% 0% 13% 5% 8% | 66.1 70% 5% 3% 61% 1% 16% 0% 15% 5% 9% | 40.9 70% 4% 2% 63% 1% 15% 0% 15% 5% 10% | 72% 4% 2% 64% 1% 14% 0% 14% 4% 10% | 34.3 73% 4% 2% 66% 1% 13% 0% 13% 4% 9% | 17.7 54% 14% 12% 25% 3% 13% 2% 11% 21% 11% | 57% 13% 7% 35% 2% 18% 2% 16% 16% 9% | 49.3 | 64% 8% 5% 49% 1% 20% 1% 19% 8% 8% | 64% 8% 5% 49% 1% 20% 1% 19% 8% 8% | 64% 8% 5% 49% 1% 20% 1% 19% 8% 8% | 64% 8% 5% 49% 1% 20% 1% 19% 8% 8% | 64% 8% 5% 49% 1% 20% 1% 19% 8% 8% |
Sour e: Company data, J.P. Morgan estimates.
Table 4: Bala ce sheet
| (NT$ in million, year-end December) | 2024 - 1Q | 2024 - 2Q | 2024 - 3Q | 2024 - 4Q | 2025 - 1Q | 2025 - 2Q | 2025 - 3Q | 2025 - 4Q | 2026E - 1Q | 2026E - 2Q | 2026E - 3QE | 2026E - 4QE 1QE | 2027E | 2027E - 2QE | 2027E - 3QE | 2027E - 4QE | 2028E - 1QE 2QE | 2028E - 3QE | 2028E - 4QE | 2028E | 2024 2025 2026E | 2024 2025 2026E | 2024 2025 2026E | 2027E | 2028E | 2028E |
|---|---|---|---|---|---|---|---|---|---|---|---|---|---|---|---|---|---|---|---|---|---|---|---|---|---|---|
| Cash and Cash Equivalents | 31,032 | 31,482 | 31,992 | 31,999 | 38,456 | 36,110 | 47,219 | 60,442 | 69,282 | 78,402 | 69,137 | 84,458 | 99,354 | 115,888 | 118,779 | 143,277 | 160,587 | 183,185 | 177,017 | 205,278 31,999 | 60,442 84,458 | 143,277 | 205,278 | 205,278 | ||
| Account Receivables | 5,460 | 4,384 | 6,274 | 7,767 | 4,909 | 7,770 | 8,735 | 12,133 | 11,406 | 9,488 | 12,662 | 15,012 | 15,183 | 17,518 | 21,125 | 23,351 | 20,254 | 22,235 | 24,499 | 26,758 7,767 | 12,133 15,012 | 23,351 | 26,758 | 26,758 | ||
| Inventory | 18,524 | 21,064 | 25,206 | 33,397 | 39,585 | 42,305 | 49,040 | 49,572 | 50,968 | 57,874 | 83,546 | 97,632 | 98,463 | 112,826 | 134,387 | 147,248 | 128,897 | 140,234 | 154,118 | 167,517 | 33,397 | 49,572 97,632 | 147,248 | 167,517 | 167,517 | |
| Total Other Current Assets | 2,077 | 2,035 | 2,467 | 2,929 | 3,267 | 3,533 | 4,320 | 4,029 | 4,216 | 4,106 | 5,197 | 5,883 | 5,978 | 6,904 | 8,395 | 9,207 7,998 | 8,786 | 9,687 | 10,568 | 2,929 | 4,029 5,883 | 9,207 | 10,568 | 10,568 | ||
| Total Current Assets | 57,093 | 58,964 | 65,940 | 76,092 | 86,217 | 89,718 | 109,314 | 126,176 | 135,872 | 149,870 | 170,542 | 202,985 | 218,977 | 253,137 | 282,685 | 323,082 | 317,735 | 354,439 | 365,322 | 410,121 | 76,092 126,176 | 202,985 | 323,082 | 410,121 | 410,121 | |
| Gross Fixed Assets | 18,335 | 18,475 | 19,943 | 20,405 | 22,230 | 21,377 | 25,157 | 27,232 | 29,149 | 33,089 | 35,212 | 37,335 | 39,458 | 41,581 | 43,704 | 45,827 | 47,951 | 50,074 | 52,197 | 54,320 | 20,405 | 27,232 | 37,335 | 45,827 | 54,320 | 54,320 |
| Accumulated Depreciation | 8,321 | 8,394 | 8,960 | 9,143 | 9,812 | 9,350 | 10,314 | 10,888 | 11,935 | 12,985 | 14,211 | 15,504 | 16,884 | 18,347 | 19,875 | 21,478 23,160 | 24,917 | 26,748 | 28,655 9,143 | 10,888 | 15,504 | 21,478 | 28,655 | 28,655 | ||
| Construction in Progress | 1,703 | 1,900 | 2,142 | 2,543 | 2,290 | 2,184 | 1,564 | 1,505 | 3,730 | 3,715 | 4,206 | 4,464 | 4,721 | 4,978 | 5,236 | 5,493 | 5,751 | 6,008 | 6,266 | 6,523 | 2,543 | 1,505 4,464 | 5,493 | 6,523 | 6,523 | |
| Acquisition/(Divestures) | 0 | 0 | 0 | 0 | 0 | 0 | 0 | 0 | 0 | 0 | 0 | 0 | 0 | 0 | 0 | 0 | 0 | 0 | 0 | 0 | 0 | 0 | 0 | 0 | 0 | 0 |
| Net Fixed Assets | 11,716 | 11,980 | 13,125 | 13,805 | 14,708 | 14,211 | 16,407 | 17,849 | 20,943 | 23,818 | 25,207 | 26,295 | 27,295 | 28,213 | 29,066 | 29,843 | 30,541 | 31,165 | 31,715 | 32,189 13,805 | 17,849 | 26,295 | 29,843 | 32,189 | 32,189 | |
| Other Long Term Assets | 5,265 | 5,726 | 7,616 | 8,576 | 9,530 | 9,522 | 12,510 | 15,125 | 18,228 | 20,018 | 16,470 | 17,460 | 18,044 | 17,998 | 17,493 | 17,749 | 17,821 | 17,765 | 17,707 | 17,761 | 8,576 15,125 | 17,460 | 17,749 | 17,761 | 17,761 | |
| Long Term Investments and Associates | 713 | 1,329 | 1,420 | 1,432 | 1,370 | 1,191 | 1,022 | 986 | 951 | 871 | 871 | 871 | 871 | 871 | 871 | 871 | 871 | 871 | 871 | 871 | 1,432 | 986 871 | 871 | 871 | 871 | |
| Total Long Term Assets | 17,694 | 19,035 | 22,160 | 23,813 | 25,608 | 24,924 | 29,940 | 33,960 | 40,122 | 44,707 | 42,548 | 44,626 | 46,210 | 47,082 | 47,430 | 48,463 | 49,234 | 49,801 | 50,293 50,821 | 23,813 33,960 | 44,626 | 48,463 | 50,821 | 50,821 | ||
| Total Assets | 74,786 | 77,999 | 88,100 | 99,906 | 111,825 | 114,643 | 139,254 | 160,137 | 175,993 | 194,577 | 213,090 | 247,611 | 265,187 | 300,219 | 330,115 | 371,544 | 366,969 | 404,241 | 415,615 | 460,941 | 99,906 160,137 | 247,611 | 371,544 | 460,941 | 460,941 | |
| ST Debt and Current Portion of LT Debt | 6,781 | 6,175 | 12,063 | 13,130 | 13,876 | 13,323 | 16,128 | 16,311 | 17,608 | 19,007 | 19,007 | 19,007 | 19,007 | 19,007 | 19,007 | 19,007 | 19,007 | 19,007 | 19,007 | 19,007 | 13,130 16,311 | 19,007 | 19,007 | 19,007 | 19,007 | |
| Accounts Payable | 19,209 | 19,585 | 24,633 | 28,884 | 32,663 | 33,497 | 45,081 | 48,109 | 48,857 | 53,027 | 62,660 | 73,224 | 73,847 | 84,620 | 100,790 | 110,436 | 96,673 | 105,175 | 115,589 125,638 | 28,884 48,109 | 73,224 | 110,436 | 125,638 | 125,638 | ||
| Other Current Liabilities | 14,739 | 14,806 | 13,206 | 16,275 | 23,856 | 25,807 | 26,293 | 33,075 | 46,233 | 46,843 | 45,899 | 56,931 | 60,618 | 68,709 | 80,860 | 90,649 | 79,095 | 86,359 | 94,922 | 103,994 | 16,275 33,075 | 56,931 | 90,649 | 103,994 | 103,994 | |
| Total Current Liabilities | 40,728 | 40,567 | 49,902 | 58,288 | 70,395 | 72,627 | 87,502 | 97,495 | 112,699 | 118,878 | 127,566 | 149,162 | 153,472 | 172,336 | 200,658 | 220,092 | 194,775 | 210,541 | 229,518 | 248,639 | 58,288 | 97,495 149,162 | 220,092 | 248,639 | 248,639 | |
| Long Term Debt | 5,165 | 5,817 | 2,546 | 3,349 | 3,324 | 3,547 | 5,558 | 6,949 | 7,190 | 7,735 | 7,735 | 7,735 | 7,735 | 7,735 | 7,735 | 7,735 | 7,735 | 7,735 | 7,735 7,735 | 3,349 | 6,949 7,735 | 7,735 | 7,735 | 7,735 | ||
| Other Long Term Liabilities | 3,666 | 3,745 | 4,733 | 4,796 | 4,753 | 4,397 | 4,603 | 5,128 | 4,789 | 5,839 | 12,676 | 11,817 | 11,233 | 11,102 | 10,631 | 9,735 | 10,963 | 10,572 | 10,058 | 9,322 | 4,796 5,128 | 11,817 | 9,735 | 9,322 | 9,322 | |
| Total Long Term Liabilities | 8,831 | 9,563 | 7,278 | 8,145 | 8,077 | 7,944 | 10,160 | 12,076 | 11,979 | 13,574 | 20,410 | 19,552 | 18,968 | 18,837 | 18,366 | 17,469 18,698 | 18,307 | 17,793 17,057 | 8,145 | 12,076 | 19,552 | 17,469 | 17,057 | 17,057 | ||
| Total Liabilities | 49,559 | 50,130 3,833 | 57,181 4,044 | 66,433 | 78,472 | 80,571 | 97,662 | 109,572 | 124,678 | 132,452 | 147,976 | 168,714 | 172,440 3,932 | 191,173 3,932 | 219,024 | 237,561 3,932 | 213,473 | 228,848 3,932 | 247,311 3,932 | 265,696 3,932 | 66,433 3,883 | 109,572 3,983 | 168,714 | 237,561 3,932 | 3,932 | 3,932 |
| Share Capital | 3,833 | 3,883 | 3,900 | 3,882 | 4,067 | 3,983 | 3,941 | 3,932 | 3,932 | 3,932 | 3,932 | 3,932 | 3,932 | |||||||||||||
| Share Premium | 0 | 0 | 0 | 0 | 0 | 0 | 0 | 0 | 0 | 0 | 0 | 0 | 0 | 0 | 0 | 0 | 0 | 0 | 0 | 0 | 0 | 0 | 0 | 0 | 0 | 0 |
| Other Reserves Retained Earnings | 8,853 12,540 | 10,411 13,626 | 10,926 15,949 | 11,290 18,300 | 10,652 18,800 | 7,368 22,821 | 9,365 28,161 | 11,774 34,808 | 11,710 35,664 | 14,918 43,276 | 14,918 46,265 | 14,918 60,048 | 14,918 73,897 | 14,918 90,196 | 14,918 92,242 | 14,918 14,918 115,134 | 134,646 | 14,918 156,543 | 14,918 149,454 | 14,918 176,395 | 11,290 18,300 | 11,774 34,808 | 14,918 60,048 | 14,918 115,134 | 176,395 | 176,395 |
| Preferred Stock | 0 | 0 | 0 | 0 | 0 | 0 | 0 | 0 | 0 | 0 | 0 | 0 | 0 | 0 | 0 | 0 | ||||||||||
| 0 | 0 | 0 | 0 | 0 | 0 | 0 | 0 | 0 | 0 | |||||||||||||||||
| Total Equity | 25,227 | 27,869 | 30,919 | 33,473 | 33,353 | 34,072 | 41,592 | 50,565 | 51,315 | 62,126 | 65,115 | 78,897 | 92,747 | 109,046 | 111,092 | 133,983 | 153,496 | 175,392 | 168,304 | 195,245 33,473 | 50,565 | 78,897 133,983 | 195,245 | 195,245 | 195,245 | |
| BVPS | 66 | 73 | 80 | 87 | 86 | 88 | 107 | 130 | 131 | 158 | 166 | 201 | 236 | 278 | 283 | 341 391 | 447 | 429 | 497 | 87 130 | 201 | 341 | 497 |
Sour e: Company data, J.P. Morgan estimates.
Table 5: Cash flow stateme t
| Cash flow statement - NT$ in billions, year-end Dec | Cash flow statement - FY16A | Cash flow statement - FY17A | Cash flow statement - FY18A | Cash flow statement - FY19A | Cash flow statement - FY20A | Cash flow statement - FY21A | Cash flow statement - FY22A | Cash flow statement - FY23A | Cash flow statement - FY24A | Cash flow statement - FY25A | Cash flow statement - FY26E | Cash flow statement - FY27E | Cash flow statement - FY28E |
|---|---|---|---|---|---|---|---|---|---|---|---|---|---|
| Net Income | 0.9 | 0.9 | 0.7 | 1.0 | 1.9 | 2.9 | 4.2 | 5.3 | 8.2 | 19.2 | 42.5 | 73.3 | 92.7 |
| Depr. & Amortisation | 0.7 | 0.6 | 0.8 | 1.2 | 1.2 | 1.6 | 1.7 | 2.0 | 2.5 | 3.2 | 4.7 | 6.1 | 7.3 |
| Change in working capital | 0.0 | 0.0 | -0.4 | 0.4 | 1.3 | -2.3 | 3.1 | 2.4 | -2.4 | 14.4 | -3.8 | 9.7 | 3.5 |
| Other | 0.0 | 0.0 | 0.0 | 0.0 | 0.0 | 0.0 | 0.0 | 0.0 | 0.0 | 0.0 | 0.0 | 0.0 | 0.0 |
| Cash flow from operations | 1.5 | 1.5 | 1.1 | 2.5 | 4.5 | 2.2 | 9.0 | 9.6 | 8.3 | 36.8 | 43.4 | 89.1 | 103.6 |
| Capex | -1.2 | -0.6 | -1.4 | -1.4 | -2.2 | -1.5 | -3.7 | -3.6 | -4.9 | -7.3 | -13.2 | -9.6 | -9.7 |
| Disposal/ (purchase) | 0.0 | -0.5 | 0.1 | -0.5 | -0.8 | -0.8 | -0.8 | -0.1 | -4.6 | -6.1 | -2.2 | -0.3 | 0.0 |
| Cash flow from investing | -1.1 | -1.2 | -1.3 | -1.9 | -3.1 | -2.3 | -4.5 | -3.7 | -9.5 | -13.4 | -15.4 | -9.9 | -9.7 |
| Free cash flow | 0.3 | 0.9 | -0.2 | 1.1 | 2.2 | 0.7 | 5.3 | 6.0 | 3.3 | 29.5 | 30.2 | 79.4 | 93.9 |
| Equity raised/ (repaid) | 0.0 | 0.0 | 0.0 | 0.0 | 0.0 | 0.0 | 0.0 | 0.0 | 0.0 | 0.0 | 0.0 | 0.0 | 0.0 |
| Debt raised/ (repaid) | 0.3 | -0.1 | 1.0 | 1.2 | 0.6 | 1.8 | 4.1 | -1.6 | 3.5 | 6.8 | 3.5 | 0.0 | 0.0 |
| Other | -0.7 | -0.2 | 0.0 | -0.1 | 1.7 | 1.2 | 0.9 | 5.1 | 3.3 | 2.1 | 0.8 | -2.1 | -0.4 |
| Dividends paid | -0.4 | -0.4 | -0.5 | -0.4 | -0.5 | -1.0 | -1.5 | -1.9 | -2.7 | -3.9 | -8.2 | -18.2 | -31.5 |
| Cash flow from financing | -0.8 | -0.8 | 0.5 | 0.8 | 1.8 | 2.0 | 3.5 | 1.5 | 4.2 | 5.0 | -4.0 | -20.3 | -31.9 |
| Net change in cash | -0.4 | -0.4 | 0.4 | 1.3 | 3.2 | 2.0 | 8.0 | 7.5 | 2.9 | 28.4 | 24.0 | 58.8 | 62.0 |
| Beginning cash | 7.7 | 7.3 | 6.8 | 7.2 | 8.5 | 11.7 | 13.7 | 21.6 | 29.1 | 32.0 | 60.4 | 84.5 | 143.3 |
| Ending cash | 7.3 | 6.9 | 7.3 | 8.5 | 11.7 | 13.7 | 21.6 | 29.1 | 32.0 | 60.4 | 84.5 | 143.3 | 205.3 |
Sour e: Company data, J.P. Morgan estimates.
Investment Thesis, aluation and Risks
Asia Vital Components(Overweight; Price Target: NT$5,200.00)
Investment Thesis
We are OW on AVC for its strong earnings growth potential which we think is supported by the content increase in AI servers. We expect AVC to see increasing upside from more liquid cooling opportunities with much higher ASP and margin while its competitive advantages vs. peers could give it further market share gains as the industry's structural trends develop.
Valuation
Our Dec-27 PT of NT$5 200 is based on 22x 2028E P/E. The target multiple is at the mid to high end of AVC's historical average trading range of 15-25x P/E since the start of the AI server boom as we expect an earnings upgrade cycle (based on our above-consensus estimates in 2027-28) to support this valuation.
Risks to Rating and Price Target
Key downside risks are: (1) slower-than-expected spec upgrades to future AI systems; (2) market share losses; and (3) ASP/margin pressure from the competition.
Asia Vital Compo e ts: Summary of Fi a cials
I come Stateme t FY24A FY25A FY26E FY27E FY28E
Reve ue
71,761 139,639 224,423 352,117 427,716
COGS
(54,891)(103,605)(150,225)(224,896)(269,537)
Gross profit
16,870 36,034 74,197 127,221 158,179
SG&A
(1,947) (3,086) (4,318) (6,469) (7,353)
Adj. EBITDA
13,285 30,802 67,175 115,351 144,926
D&A
(2,463) (3,246) (4,729) (6,099) (7,325)
Adj. EBIT
10,823 27,556 62,445 109,252 137,601
Net Interest
114
91
351
152
766
Adj. PBT
12,352 28,786 62,969 109,404 138,367
Tax
(3,159) (7,836) (17,151) (30,633) (38,743)
Minority Interest
-
-
-
-
-
Adj. Net I come
8,172 19,186 42,490 73,325 92,736
Reported EPS
21.26 49.29 108.25 186.82 236.28
Adj. EPS
21.26 49.29 108.25 186.82 236.28
DPS
7.00
9.99 20.68 46.38 80.05
Payout ratio
32.9% 20.3% 19.1% 24.8% 33.9%
Shares outstanding
384
389
393
392
392
Bala ce Sheet FY24A FY25A FY26E FY27E FY28E
Cash and ash equivalents
31,999 60,442 84,458 143,277 205,278
A ounts re eivable
7,767 12,133 15,012 23,351 26,758
Inventories
33,397 49,572 97,632 147,248 167,517
Other urrent assets
2,929 4,029 5,883 9,207 10,568
Curre t assets
76,092 126,176 202,985 323,082 410,121
PP&E
13,805 17,849 26,295 29,843 32,189
LT investments
1,432
986
871
871
871
Other non urrent assets
8,576 15,125 17,460 17,749 17,761
Total assets
99,906 160,137 247,611 371,544 460,941
Short term borrowings
13,130 16,311 19,007 19,007 19,007
Payables
28,884 48,109 73,224 110,436 125,638
Other short term liabilities
16,275 33,075 56,931 90,649 103,994
Curre t liabilities
58,288 97,495 149,162 220,092 248,639
Long-term debt
3,349 6,949 7,735 7,735 7,735
Other long term liabilities
4,796 5,128 11,817 9,735 9,322
Total liabilities
66,433 109,572 168,714 237,561 265,696
Shareholders' equity
33,473 50,565 78,897 133,983 195,245
Minority interests
-
-
-
-
-
Total liabilities & equity
99,906 160,137 247,611 371,544 460,941
BVPS
87.06 129.90 201.01 341.37 497.46
y/y Growth
25.5% 49.2% 54.7% 69.8% 45.7%
Net debt/( ash)
(15,521) (37,182) (57,716)(116,535)(178,536)
Sour e: Company reports and J.P. Morgan estimates.
Note: NT$ in millions (ex ept per-share data).Fis al year ends De . o/w - out of whi h
| Cash Flow Stateme t | FY24A | FY25A | FY26E | FY27E | FY28E |
|---|---|---|---|---|---|
| Cash flow from operati g activities | 8,250 | 36,818 | 43,397 | 89,076 | 103,570 |
| o/w Depre iation & amortization | 2,463 | 3,246 | 4,729 | 6,099 | 7,325 |
| o/w Changes in working apital | (2,385) | 14,385 | (3,823) | 9,653 | 3,509 |
| Cash flow from i vesti g activities | (9,501) | (13,393) | (15,395) | (9,936) | (9,683) |
| o/w Capital expenditure | (4,918) | (7,290) | (13,175) | (9,647) | (9,671) |
| as % of sales | 6.9% | 5.2% | 5.9% | 2.7% | 2.3% |
| Cash flow from fi a ci g activities | 4,158 | 5,018 | (3,986) | (20,322) | (31,887) |
| o/w Dividends paid | (2,683) | (3,877) | (8,236) | (18,239) | (31,475) |
| o/w Shares issued/(repur hased) | 0 | 0 | 0 | 0 | 0 |
| o/w Net debt issued/(repaid) | 3,519 | 6,781 | 3,482 | 0 | 0 |
| Net cha ge i cash | 2,908 | 28,443 | 24,016 | 58,819 | 62,001 |
| Adj. Free cash flow to firm | 3,333 | 29,528 | 30,222 | 79,429 | 93,899 |
| y/y Growth | (44.8%) | 786.0% | 2.4% | 162.8% | 18.2% |
| Ratio A alysis | FY24A | FY25A | FY26E | FY27E | FY28E |
| Gross margin | 23.5% | 25.8% | 33.1% | 36.1% | 37.0% |
| EBITDA margin | 18.5% | 22.1% | 29.9% | 32.8% | 33.9% |
| EBIT margin | 15.1% | 19.7% | 27.8% | 31.0% | 32.2% |
| Net profit margin | 11.4% | 13.7% | 18.9% | 20.8% | 21.7% |
| ROE | 27.6% | 45.7% | 65.6% | 68.9% | 56.3% |
| ROA | 9.5% | 14.8% | 20.8% | 23.7% | 22.3% |
| ROCE | 18.1% | 32.4% | 50.6% | 59.1% | 51.8% |
| SG&A/Sales | 2.7% | 2.2% | 1.9% | 1.8% | 1.7% |
| Net debt/Equity | NM | NM | NM | NM | NM |
| Net debt/EBITDA | NM | NM | NM | NM | NM |
| Sales/Assets (x) | 0.8 | 1.1 | 1.1 | 1.1 | 1.0 |
| Assets/Equity (x) | 2.9 | 3.1 | 3.1 | 2.9 | 2.5 |
| Interest over (x) | NM | NM | NM | NM | NM |
| Operating leverage | 215.9% | 163.5% | 208.5% | 131.7% | 120.9% |
| Tax rate | 25.6% | 27.2% | 27.2% | 28.0% | 28.0% |
| Revenue y/y Growth | 21.2% | 94.6% | 60.7% | 56.9% | 21.5% |
| EBITDA y/y Growth | 41.7% | 131.8% | 118.1% | 71.7% | 25.6% |
| EPS y/y Growth | 49.3% | 131.9% | 119.6% | 72.6% | 26.5% |
| Valuatio | FY24A | FY25A | FY26E | FY27E | FY28E |
| P/E (x) | 160.0 | 69.0 | 31.4 | 18.2 | 14.4 |
| P/BV (x) | 39.1 | 26.2 | 16.9 | 10.0 | 6.8 |
| EV/EBITDA (x) | 18.0 | 19.3 | 14.7 | 8.1 | 6.1 |
| Dividend Yield | 0.2% | 0.3% | 0.6% | 1.4% | 2.4% |
Analyst Certification: The Research Analyst(s) denoted by an 'AC' on the cover of this report certifies (or where multiple Research Analysts are primarily responsible for this report the Research Analyst denoted by an 'AC' on the cover or within the document individually certifies with respect to each security or issuer that the Research Analyst covers in this research) that: (1) all of the views expressed in this report accurately reflect the Research Analyst's personal views about any and all of the subject securities or issuers; and (2) no part of any of the Research Analyst's compensation was is or will be directly or indirectly related to the specific recommendations or views expressed by the Research Analyst(s) in this report. For all Korea-based Research Analysts listed on the front cover if applicable they also certify as per KOFIA requirements that the Research Analyst's analysis was made in good faith and that the views reflect the Research Analyst's own opinion without undue influence or intervention.
All authors named within this report are Research Analysts who produce independent research unless otherwise specified. In Europe Sector Specialists (Sales and Trading) may be shown on this report as contacts but are not authors of the report or part of the Research Department.