PDF 原檔:報告_Daiwa_聖暉5536_首次覆蓋_20261007_original.pdf
圖片清單(已驗證 2026-10-12)
ingest 時建立的「眼見為憑」圖片索引,是 lib/ 嵌圖的唯一真相來源;<40KB 未 Read 者免列(預設 logo)。
| 檔名 | size | 分類 | 親眼所見內容 |
|---|---|---|---|
報告_Daiwa_聖暉5536_首次覆蓋_20261007_008.png |
105KB | 真資料圖 | 聖暉集團持股架構圖:Acter(5536)持 Nova Technology(6613)55.52%;朋億下轄 Winmega 100%、Suzhou Winmax 86.59%、Rayzher(7703)41.46%、Dadewin 80%、Theory High Tech 53%、Xuanfu Tech 80%,及 Winmax 馬來西亞/新加坡子公司與 Rayzher 各國子公司 |
報告_Daiwa_聖暉5536_首次覆蓋_20261007_011.png |
44KB | 真資料圖 | 依產品別營收占比堆疊圖 2020–2028E(無塵室機電 59/56/58/53/57/71/64/60/57%,水氣化學供應系統 27/29/28/35/34/20/26/30/33%);屬營收結構圖,不嵌 lib |
報告_Daiwa_聖暉5536_首次覆蓋_20261007_012.png |
43KB | 真資料圖 | 在手訂單長條圖(2022 30、2023 31、2024 38、2025 46、2Q26 末 60、2026 年 7 月底 66,TWDbn)與訂單產業圓餅(半導體 63%、電子組裝 11%、民生 9%、其他 17%);屬訂單財務圖,不嵌 lib |
報告_Daiwa_聖暉5536_首次覆蓋_20261007_027.png |
274KB | 真資料圖 | EPCM 服務示意:Engineering/Procurement/Construction/Management 四階段,下列機電工程、無塵室工程、統包、Hi-Tech 製程整合(水氣化學供應)四類服務與現場照片 |
報告_Daiwa_聖暉5536_首次覆蓋_20261007_028.png |
91KB | 真資料圖 | 全球據點圖:Acter/NTC/RAYZHER 分布於台灣、中國、泰國、印度、馬來西亞、越南、印尼、新加坡、日本、美國,標示 11 個地區、34 家公司(新增德國 RAYZHER);文字稱 33 家,圖為 34 家 |
報告_Daiwa_聖暉5536_首次覆蓋_20261007_031.png |
49KB | 真資料圖 | 外資持股比走勢(Oct-16 至 Oct-26,約 43%)與股權結構圓餅(外資 43%、本地法人 5%、管理層 9%、其他 43%);非 lib 嵌圖 |
原始內容
Acter (5536TT)
Acter
Target price: TWD1,415.00
Shareprice(7Oct):TWD1,045.00 | Up/downside:+35.4%
Initiation: acting on the demand for cleanrooms
- Key beneficiary of the cleanroom shortage in the high-tech industry
- Fast-growing order backlog likely to be realised over 2026-28E
- Initiating with a Buy (1) rating and a 12-month TP of TWD1,415
Investment case: We initiate coverage of Acter, an established multinational cleanroom engineering, procurement, construction and management (EPCM) turnkey service provider, with a Buy (1) rating. Its core business includes cleanroom electromechanical engineering, water/gas/chemical delivery systems, and other cleanroom services. We believe now is a good time to revisit the stock as it underperformed the TAIEX Index by 32.7% in 3Q26, mainly on weaker-than-expected 2Q26 results and soft sector sentiment. Given its stronger revenue momentum over recent months and upcoming TSMC results on 15 October, which may drive sentiment, we suggest investors to buy the stock. We forecast a 24.6% revenue CAGR and 36.9% net profit CAGR over 2026-28E.
Intact global demand for cleanroom technology, the edge AI market, and rapid cleanroom expansion in Asia further support Acter's order backlog. Its backlog reached TWD66bn in July 2026 vs. TWD46bn in 2025 and TWD30bn in 2022 (15.3% 2022-25 CAGR), which largely outpaced the global cleanroom technology market's forecast CAGR over 2023-2032E, according to Precedence Research.
Strong competitive edge supports order share gains across multiple segments. Acter's competitive edge lies in 1) intelligent management enabled by digital twins and AI, using 3D building information modelling (BIM) and AI-driven digital twin management; 2) intellectualisation of green engineering, which comprises green design, green procurement, and green techniques; 3) experience across multiple industries (ie, data centres and electromechanical engineering for the consumer industry) which supports better integration; and 4) a complete network, enabling on-the-spot support. Acter believes it has the highest market share among the operators of three major US data centre players due largely to its capabilities in liquid cooling and its expertise in electromechanical and cleanroom engineering.
Catalysts: Near-term: project wins from key clients, supporting stronger monthly revenue momentum; mid- to long-term: an improving operatingmargin trend and a resilient order backlog.
Valuation: We are the first non-domestic broker to cover Acter. We initiate coverage with a 12-month TP of TWD1,415, based on a target PER of 20x (equivalent to a 0.54x PEG over 2026-28E). We believe our valuation is fair, given Acter's strong earnings visibility, which we believe warrants a rerating. Our TP is supported by a DCF valuation of TWD1,454.
Risks: 1) weaker-than-expected expansion in the semiconductor industry; and 2) project delays or cancellations.
3
2
1
Helen Chien (886) 2 8758 6254 helen.chien@daiwacm-cathay.com.tw
Neil Teng, CFA (886) 2 8758 6256 neil.teng@daiwacm-cathay.com.tw
| 12-month range | 618.00-1,435.00 |
|---|---|
| Market cap (USDbn) | 4.08 |
| 3m avg daily turnover (USDm) | 31.93 |
| Shares outstanding (m) | 124 |
| Major shareholder | Xiang-Hui Development (4.4%) |
Financial summary (TWD)
| Year to 31 Dec | 26E | 27E | 28E |
|---|---|---|---|
| Revenue (m) | 53,844 | 66,983 | 83,593 |
| Operating profit (m) | 9,853 | 13,598 | 18,014 |
| Net profit (m) | 6,325 | 8,797 | 11,851 |
| Core EPS (fully-diluted) | 50.788 | 70.635 | 95.161 |
| EPS change (%) | 79.3 | 39.1 | 34.7 |
| Daiwa vs Cons. EPS (%) | (6.4) | (5.4) | n.a. |
| PER (x) | 20.6 | 14.8 | 11.0 |
| Dividend yield (%) | 3.4 | 4.7 | 6.4 |
| DPS | 35.7 | 49.6 | 66.9 |
| PBR (x) | 9.3 | 7.2 | 5.5 |
| EV/EBITDA (x) | 11.6 | 8.3 | 6.1 |
| ROE (%) | 46.8 | 54.9 | 56.8 |
Source: FactSet, Daiwa forecasts
Growth outlook
Acter: net profit and net-profit growth
We forecast Acter to record a 36.9% net profit CAGR over 2026-28E, on the back of a 24.6% revenue CAGR over the same period, driven by 1) larger project scale, as strong demand for cleanroom EPCM services from the high-tech sector is likely to support continued growth in Acter's order backlog and 2) improving gross margins and operating efficiency. We expect operating margin to expand by 2.0pp in 2027E and 1.3pp in 2028E, driven by favourable gross margins on new projects and operating leverage.
Valuation
Source: Company, Daiwa forecasts
Acter: 1-year-forward PER bands
レ
Our 12-month TP of TWD1,415 is based on a target PER of 20x, applied to our 1-year-forward EPS forecast. Our target multiple of 20x is higher than the stock's past-3-year 1-year-forward PER (12.2x) and past-5-year 1-yearforward PER (9.6x) and implies a PEG of 0.54x on our 36.9% net profit CAGR forecast over 2026-28E. We believe the stock deserves a rerating in the next 12 months, largely supported by resilient cleanroom demand globally.
Our TP is also supported by an alternative DCF-derived valuation of TWD1,454/share.
Earnings revisions
Acter: Bloomberg consensus EPS forecast revisions
Bloomberg consensus EPS estimates for 2026E and 2027E have risen 24.8% and 24.3% YTD, respectively. This is likely due to upward revisions to order backlog and earnings forecasts following better-than-expected industry outlook. We are the first foreign broker to cover Acter.
Source: Bloomberg
Financial summary
Key assumptions
| Year to 31 Dec | 2021 | 2022 | 2023 | 2024 | 2025 | 2026E | 2027E | 2028E |
|---|---|---|---|---|---|---|---|---|
| Cleanroomeletromechanical revenue growth (%) | 36.9 | 44.1 | (19.0) | 30.6 | 70.7 | 18.0 | 15.1 | 15.8 |
| Water, gas and chemical delivery systems revenue growth (%) | 58.5 | 35.0 | 11.0 | 14.8 | (16.8) | 67.7 | 46.7 | 40.4 |
| Consumer industry electromechanical revenue growth (%) | 55.2 | 32.4 | (7.3) | 5.7 | (4.7) | 78.7 | 38.8 | 33.1 |
| Biomedical revenue growth (%) | (10.8) | 83.7 | (27.6) | (38.5) | 68.0 | 52.5 | 8.3 | 33.1 |
| High-tech equipment and materials sales and services revenue growth (%) | 143.9 | 2.5 | (54.0) | 14.7 | 98.0 | (44.9) | (5.5) | 0.0 |
Profit and loss (TWDm)
| Year to 31 Dec | 2021 | 2022 | 2023 | 2024 | 2025 | 2026E | 2027E | 2028E |
|---|---|---|---|---|---|---|---|---|
| Cleanroom electromechanical | 11,279 | 16,256 | 13,173 | 17,200 | 29,359 | 34,641 | 39,859 | 46,141 |
| Water, gas and chemical delivery systems | 5,915 | 7,985 | 8,861 | 10,174 | 8,467 | 14,198 | 20,829 | 29,253 |
| Other Revenue | 3,024 | 4,021 | 3,026 | 2,879 | 3,656 | 5,005 | 6,296 | 8,198 |
| Total Revenue | 20,217 | 28,262 | 25,061 | 30,254 | 41,482 | 53,844 | 66,983 | 83,593 |
| Other income | 0 | 0 | 0 | 0 | 0 | 0 | 0 | 0 |
| COGS | (16,934) | (23,484) | (20,143) | (23,676) | (33,634) | (41,190) | (50,238) | (61,859) |
| SG&A | (892) | (1,121) | (1,292) | (1,616) | (1,718) | (2,369) | (2,646) | (3,093) |
| Other op.expenses | (252) | (335) | (362) | (555) | (427) | (431) | (502) | (627) |
| Operating profit | 2,139 | 3,323 | 3,264 | 4,407 | 5,703 | 9,853 | 13,598 | 18,014 |
| Net-interest inc./(exp.) | 9 | 7 | 95 | 160 | 164 | 227 | 50 | 50 |
| Assoc/forex/extraord./others | 30 | 90 | 157 | 290 | 195 | 92 | 42 | 42 |
| Pre-tax profit | 2,179 | 3,420 | 3,516 | 4,857 | 6,062 | 10,172 | 13,690 | 18,106 |
| Tax | (625) | (921) | (916) | (1,269) | (1,458) | (2,447) | (3,293) | (4,355) |
| Min. int./pref. div./others | (349) | (566) | (761) | (971) | (1,077) | (1,400) | (1,600) | (1,900) |
| Net profit (reported) | 1,204 | 1,933 | 1,838 | 2,617 | 3,527 | 6,325 | 8,797 | 11,851 |
| Net profit (adjusted) | 1,204 | 1,933 | 1,838 | 2,617 | 3,527 | 6,325 | 8,797 | 11,851 |
| EPS (reported)(TWD) | 21.079 | 16.838 | 15.027 | 21.093 | 28.424 | 50.976 | 70.897 | 95.513 |
| EPS (adjusted)(TWD) | 21.079 | 16.838 | 15.027 | 21.093 | 28.424 | 50.976 | 70.897 | 95.513 |
| EPS (adjusted fully-diluted)(TWD) | 19.548 | 15.477 | 14.585 | 20.982 | 28.325 | 50.788 | 70.635 | 95.161 |
| DPS (TWD) | 15.034 | 8.823 | 6.087 | 10.000 | 14.500 | 35.683 | 49.628 | 66.859 |
| EBIT | 2,139 | 3,323 | 3,264 | 4,407 | 5,703 | 9,853 | 13,598 | 18,014 |
| EBITDA | 2,292 | 3,556 | 3,595 | 4,893 | 6,097 | 10,482 | 14,182 | 18,610 |
Cash flow (TWDm)
| Year to 31 Dec | 2021 | 2022 | 2023 | 2024 | 2025 | 2026E | 2027E | 2028E |
|---|---|---|---|---|---|---|---|---|
| Profit before tax | 2,179 | 3,420 | 3,516 | 4,857 | 6,062 | 10,172 | 13,690 | 18,106 |
| Depreciation and amortisation | 123 | 144 | 174 | 196 | 199 | 537 | 542 | 554 |
| Tax paid | (490) | (638) | (943) | (804) | (1,249) | (2,447) | (3,293) | (4,355) |
| Change in working capital | (1,809) | (1,544) | 2,386 | (2,536) | 421 | (2,122) | (1,006) | (1,946) |
| Other operational CF items | (82) | 304 | (775) | 530 | 368 | (227) | (50) | (50) |
| Cash flow from operations | (80) | 1,686 | 4,358 | 2,244 | 5,801 | 5,913 | 9,883 | 12,309 |
| Capex | (24) | (147) | (137) | (151) | (128) | (150) | (180) | (180) |
| Net (acquisitions)/disposals | (116) | (413) | (285) | (194) | (120) | (122) | (122) | (122) |
| Other investing CF items | (36) | 22 | 4 | 21 | 35 | 0 | 0 | 0 |
| Cash flow from investing | (176) | (537) | (418) | (324) | (213) | (272) | (302) | (302) |
| Change in debt | (231) | 470 | 197 | (80) | 115 | 0 | 0 | 0 |
| Net share issues/(repurchases) | 0 | 0 | 0 | 0 | 0 | 0 | 0 | 0 |
| Dividends paid | (686) | (859) | (1,416) | (1,303) | (1,861) | (1,799) | (4,428) | (6,158) |
| Other financing CF items | (211) | 1,883 | (55) | 127 | (721) | 0 | 0 | 0 |
| Cash flow from financing | (1,128) | 1,494 | (1,274) | (1,256) | (2,467) | (1,799) | (4,428) | (6,158) |
| Forex effect/others | 0 | 0 | 0 | 0 | 0 | 0 | 0 | 0 |
| Change in cash | (1,384) | 2,643 | 2,665 | 664 | 3,120 | 3,841 | 5,153 | 5,849 |
| Free cash flow | (31) | 1,228 | 4,900 | 1,403 | 5,141 | 5,763 | 9,703 | 12,129 |
Source: FactSet, Daiwa forecasts
Financial summary continued …
Balance sheet (TWDm)
| Year to 31 Dec | 2021 | 2022 | 2023 | 2024 | 2025 | 2026E | 2027E | 2028E |
|---|---|---|---|---|---|---|---|---|
| Cash & short-term investment | 3,699 | 6,411 | 8,951 | 9,899 | 12,996 | 16,838 | 21,991 | 27,839 |
| Inventory | 1,560 | 2,904 | 2,615 | 2,302 | 1,862 | 2,907 | 2,848 | 3,612 |
| Accounts receivable | 6,027 | 8,416 | 6,619 | 9,150 | 11,517 | 15,574 | 18,958 | 23,919 |
| Other current assets | 5,971 | 7,405 | 6,419 | 8,614 | 9,972 | 1,833 | 1,833 | 1,833 |
| Total current assets | 17,258 | 25,136 | 24,604 | 29,964 | 36,346 | 37,153 | 45,630 | 57,204 |
| Fixed assets | 573 | 690 | 768 | 833 | 890 | 4,464 | 4,101 | 3,728 |
| Goodwill & intangibles | 108 | 92 | 75 | 81 | 71 | 71 | 71 | 71 |
| Other non-current assets | 765 | 1,199 | 2,139 | 3,199 | 4,012 | 4,012 | 4,012 | 4,012 |
| Total assets | 18,704 | 27,117 | 27,587 | 34,078 | 41,320 | 45,700 | 53,814 | 65,015 |
| Short-term debt | 651 | 896 | 541 | 524 | 591 | 591 | 591 | 591 |
| Accounts payable | 6,568 | 8,708 | 7,727 | 9,454 | 11,676 | 14,657 | 16,975 | 20,754 |
| Other current liabilities | 2,554 | 4,893 | 4,977 | 6,160 | 8,199 | 7,403 | 7,403 | 7,403 |
| Total current liabilities | 9,773 | 14,497 | 13,245 | 16,138 | 20,467 | 22,652 | 24,970 | 28,749 |
| Long-term debt | 0 | 0 | 0 | 3 | 3 | 3 | 3 | 3 |
| Other non-current liabilities | 1,635 | 1,820 | 1,257 | 1,211 | 1,433 | 1,433 | 1,433 | 1,433 |
| Total liabilities | 11,408 | 16,318 | 14,502 | 17,351 | 21,902 | 24,088 | 26,405 | 30,184 |
| Share capital | 572 | 586 | 620 | 620 | 620 | 1,241 | 1,241 | 1,241 |
| Reserves/R.E./others | 5,063 | 6,998 | 8,191 | 10,350 | 12,499 | 12,673 | 16,870 | 22,391 |
| Shareholders' equity | 5,635 | 7,585 | 8,812 | 10,970 | 13,119 | 13,913 | 18,110 | 23,632 |
| Minority interests | 1,661 | 3,214 | 4,273 | 5,756 | 6,299 | 7,699 | 9,299 | 11,199 |
| Total equity & liabilities | 18,704 | 27,117 | 27,587 | 34,078 | 41,320 | 45,700 | 53,814 | 65,015 |
| EV | 128,278 | 127,364 | 125,527 | 126,048 | 123,561 | 121,120 | 117,566 | 113,618 |
| Net debt/(cash) | (3,048) | (5,514) | (8,410) | (9,373) | (12,402) | (16,244) | (21,397) | (27,245) |
| BVPS (TWD) | 98.613 | 66.063 | 72.041 | 88.411 | 105.729 | 112.132 | 145.957 | 190.453 |
Key ratios (%)
| Year to 31 Dec | 2021 | 2022 | 2023 | 2024 | 2025 | 2026E | 2027E | 2028E |
|---|---|---|---|---|---|---|---|---|
| Sales (YoY) | 44.6 | 39.8 | (11.3) | 20.7 | 37.1 | 29.8 | 24.4 | 24.8 |
| EBITDA (YoY) | 30.5 | 55.2 | 1.1 | 36.1 | 24.6 | 71.9 | 35.3 | 31.2 |
| Operating profit (YoY) | 25.8 | 55.3 | (1.8) | 35.0 | 29.4 | 72.8 | 38.0 | 32.5 |
| Net profit (YoY) | 24.2 | 60.5 | (4.9) | 42.4 | 34.8 | 79.3 | 39.1 | 34.7 |
| Core EPS (fully-diluted) (YoY) | 18.1 | (20.8) | (5.8) | 43.9 | 35.0 | 79.3 | 39.1 | 34.7 |
| Gross-profit margin | 16.2 | 16.9 | 19.6 | 21.7 | 18.9 | 23.5 | 25.0 | 26.0 |
| EBITDA margin | 11.3 | 12.6 | 14.3 | 16.2 | 14.7 | 19.5 | 21.2 | 22.3 |
| Operating-profit margin | 10.6 | 11.8 | 13.0 | 14.6 | 13.7 | 18.3 | 20.3 | 21.6 |
| Net profit margin | 6.0 | 6.8 | 7.3 | 8.7 | 8.5 | 11.7 | 13.1 | 14.2 |
| ROAE | 22.3 | 29.2 | 22.4 | 26.5 | 29.3 | 46.8 | 54.9 | 56.8 |
| ROAA | 7.1 | 8.4 | 6.7 | 8.5 | 9.4 | 14.5 | 17.7 | 19.9 |
| ROCE | 28.7 | 33.8 | 25.8 | 28.5 | 30.6 | 46.7 | 54.2 | 56.8 |
| ROIC | 50.5 | 50.9 | 48.5 | 54.1 | 60.3 | n.a | n.a | n.a |
| Net debt to equity | n.a. | n.a. | n.a. | n.a. | n.a. | n.a. | n.a. | n.a. |
| Effective tax rate | 28.7 | 26.9 | 26.1 | 26.1 | 24.1 | 24.1 | 24.1 | 24.1 |
| Accounts receivable (days) | 91.7 | 93.3 | 109.5 | 95.1 | 90.9 | 91.8 | 94.1 | 93.6 |
| Current ratio (x) | 1.8 | 1.7 | 1.9 | 1.9 | 1.8 | 1.6 | 1.8 | 2.0 |
| Net interest cover (x) | n.a. | n.a. | n.a. | n.a. | n.a. | n.a. | n.a. | n.a. |
| Net dividend payout | 71.3 | 52.4 | 40.5 | 47.4 | 51.0 | 70.0 | 70.0 | 70.0 |
| Free cash flow yield | n.a. | 0.9 | 3.8 | 1.1 | 4.0 | 4.4 | 7.5 | 9.4 |
Source: FactSet, Daiwa forecasts
Company profile
Established in 1979, Acter Group (Acter) is a leading engineering services provider specialising in cleanroom, electromechanical, and high-tech facility integration solutions for semiconductor, optoelectronics, biotech, green energy, and advanced manufacturing clients across Taiwan, China and the rest of the world. As of 2025, its revenue comprised cleanroom electromechanical (71%), water, gas and chemical delivery systems (20%), consumer industry electromechanical (4%), biomedical (2%) and high-tech equipment & materials sales & services (3%).
Cleanrooms are a bottleneck in the hightech industry, including semiconductor foundry, memory, and electronic assembling
Acting on the demand for cleanrooms
Why are cleanrooms a bottleneck in the high-tech industry?
In recent years, cleanrooms have become a critical bottleneck for high-tech industries, especially semiconductor manufacturing, OSAT, AI hardware, and PCB, mainly because of its indispensable nature, severe supply-demand imbalance, labour shortages, and high technical and regulatory barriers.
Cleanrooms are an indispensable core infrastructure as they determine product yield and quality stability. Advanced manufacturing nodes in semiconductors, optoelectronics, and biopharmaceuticals require highly particle-free, constant-temperature, and constant-humidity environments to ensure reliable production. As process technologies continue to advance, such as 2nm node (or even newer nodes) and advanced packaging, existing cleanrooms must be rebuilt, and the complexity of building new ones thus increases. This keeps overall demand for cleanrooms at high levels.
A severe global supply-demand imbalance with demand for cleanroom construction outpacing supply. The surge in AI servers, high-performance computing (HPC), and highbandwidth memory (HBM) has triggered a global expansion for front-end wafer fabs, packaging and testing facilities, and PCB manufacturing. Order visibility remains extremely strong across the industry. According to Markets and Markets, the global cleanroom market size is set to expand at a CAGR of 6.6% over 2025-31E. At the same time, the global semiconductor cleanroom market size is set to grow at a CAGR of 8.0% over 2025-30E. For instance, Acter's order backlog exceeded TWD66bn at the end of July 2026, up from TWD46bn at the end of 2025, showing the urgency of demand for cleanroom construction.
Global: cleanroom market size and growth
Global: semiconductor cleanroom market size and growth
Source: Markets and Markets
Source: Markets and Markets
Human resources are an additional limitation to capacity growth. Cleanroom engineering is highly technical and labour-intensive, relying on specialised on-site installation and supervision that cannot be replaced by robots. At the same time, the industry faces severe labour shortages and an aging workforce, and younger generations are reluctant to join field operations. Cross-border staff deployment is also less costefficient than local hiring.
Cleanrooms involve complex system integration, creating high barriers to entry. A cleanroom construction includes 4 sequential phases, where each phase usually requires totally different areas of expertise. Therefore, the competitive landscape in each area differs. The process begins with civil & structural (C&S) works to establish the physical plant, followed by mechanical, electrical, and plumbing (MEP) works for essential utility generation, where Acter is one of the leading global experts. After MEP is finished, chemicals/gas/water are then distributed via main systems through primary piping network and finally delivered to production equipment through hook-up systems. As Acter provides integrated cleanroom solutions via various subsidiaries global supply chains restructure under N+1 (domestic market + 1) strategies, companies building overseas facilities in places like the US face strict and complicated licensing processes, particularly on fire safety and hazardous chemicals. Without experience dealing with such engineering and safety issues, construction timelines can be severely delayed.
As a result, even with advanced equipment and chip designs, a high-tech company cannot begin production without adequate cleanroom space, skilled engineers, and systemintegration capabilities. Therefore, cleanroom engineering contractors hold significant bargaining power and capacity allocation leverage in today's tech supply chain.
IC foundry
In the foundry sector, where the cleanroom supply-demand shortage is the tightest, project activity remains centred on advanced process capacity expansion in Taiwan and Arizona. Simultaneously, domestic advanced node development remains intense, with multi-phase fab builds advancing across Hsinchu, Taichung, and Kaohsiung. Local cleanroom and MEP integration demand is further boosted by advanced packaging facilities in Taiwan (such as Chiayi and Tainan) and upcoming projects in the US are set to contribute revenue for the cleanroom providers in the following years.
Memory
The memory segment is exhibiting robust momentum as well, mainly catalysed by HBM capacity additions. Projects such as the plant in Japan, transitioned to contribution for the cleanroom EPCM providers starting from 2026. In Taiwan, turnkey engineering contracts in Miaoli are also actively underway. This trend is reinforced by stronger-than-expected expansion activity from memory producers in China.
OSAT, PCB and ODM/OEM
For OSAT companies, demand is also surging due to the spill-over effect of advanced packaging protocols and N+1 supply chain restructuring. The OSAT names are expanding their footprint both in Southern Taiwan and in overseas locations including in the US and Southeast Asia. Major engineering contracts signed between OSAT clients and Acter show stable long-term workload for strong cleanroom demand over our forecast horizon. Similarly, overseas expansion for PCB manufacturing is peaking in Southeast Asia, especially in Thailand. We expect Chinese PCB players to also increase their capacity, just like memory companies in the past year. Except for front-end and back-end chip manufacturing, ODM/OEM and data centre infrastructure is also a key growth engine for the EPCM industry. Major Taiwanese ODMs are building production facilities in Texas and Mexico to meet local manufacturing needs. Cleanroom contractors, such as Acter, providing MEP and system integration in Texas are directly benefiting from these projects. The shift toward liquid cooling systems has also increased engineering complexity, favouring few cleanroom companies with the expertise to deliver complex integration for CSPs in both North America and Southeast Asia.
Acter: an integrated cleanroom solutions provider
Acter Group (Acter), an integrated cleanroom solutions provider, maintains its competitive positioning within the high-tech cleanroom and MEP engineering sector, driven by its group synergy and global footprint. Acter operates as a comprehensive vendor through a group business model. The parent company, Acter, supervises overall cleanroom and MEP services, while subsidiary Nova Technology (Novatech, 6613 TT, not rated) mainly provides chemical primary system and hook-up, and Novatech's subsidiary Rayzher (7703 TT, not rated) provides gas primary system, hook-up and equipment. In China, Acter operates through Acter Technology Integration Group (603163 CH, not rated) and Suzhou Winmax (not listed) for Chinese EPCM (engineering, procurement, construction, and management) and equipment business. Except for C&S (civil and structural) works, where the margin is low (7-8%) and the contract duration is long, Acter's services span nearly the entire cleanroom construction process. Its one-stop solutions model supports customer retention Acter provides cleanroom services for numerous industries, across multiple regions and improves bid-win rates, particularly for overseas expansion, where customers have few reliable providers to choose from.
Acter: organisational chart
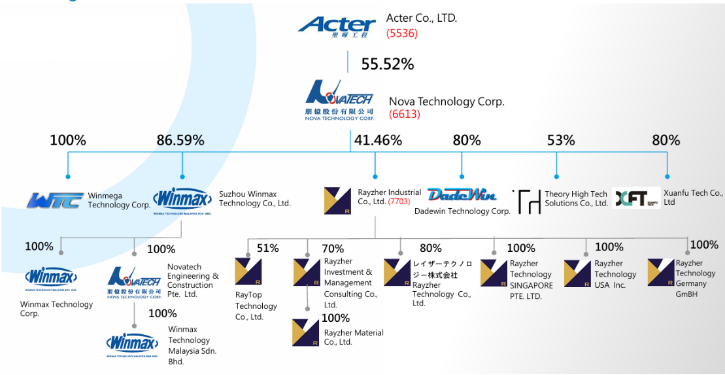
Source: Company, Daiwa
To avoid the risk of over-concentration, Acter diversifies its client portfolio across semiconductor foundries, memory, PCB, OSAT, ODM hardware assembly, CSP data centres and the consumer industry. By sector, semiconductor projects represent the largest share of Acter's portfolio, accounting for 66% of total revenue in 1H26, vs. 69% in 2025. Foundry manufacturing is the largest source of demand for cleanrooms in Taiwan, especially as advanced-node capacity expands at sites in Hsinchu, Taichung and Kaohsiung. In the memory segment, the company executes turnkey engineering builds to expand its capacity aggressively, creating cleanroom opportunities across Taiwan, Japan and Singapore. This multi-sector coverage decreases the risk of cyclical downturns in any individual segment, in our view.
By establishing 33 operating entities across 11 international regions, the company effectively captures capex migration driven by global N+1 supply chain diversification. This allows Acter to support Taiwanese and international clients as they expand manufacturing capacity from Taiwan into Southeast Asia, Japan and the US. Due to the complexity of advanced-node IC manufacturing, packaging and testing, it is especially important for these Taiwanese semiconductor companies to work with familiar cleanroom builders when expanding in the US. This is one of the reasons why Taiwanese cleanroom companies are receiving overseas orders and starting to set up global bases, in our view. Despite higher management, material, and manpower costs in the US, most cleanroom companies are benefitting from the trend by improving margins, given the higher complexity and risks to operate overseas. Across overseas hubs in Texas and Phoenix (expected to begin from 2027), Acter prioritises local hiring and partners with regional civil contractors to shorten the learning curve and to avoid the high overhead. To further address the potential labour shortages in the future, the company has established cross-border academic and vocational partnerships to bring Southeast Asian talent to Taiwan for technical training before deploying them back to their home markets, securing future human capacity to support global expansion projects.
Acter: revenue by clients' industry
Source: Company, Daiwa
Semiconductor-related business in Taiwan is the major revenue stream for Acter
Source: Company, Daiwa
By product, cleanroom electromechanical services remain Acter's largest source of revenue (accounting for 66% of 1H26 revenue, per the company). These services include cleanroom architectural and MEP engineering, which powers airflow, filtration, environmental regulation and utility controls. Water, gas and chemical delivery systems are its second-largest source of revenue (accounting for 24% of 1H26 revenue, per the company). Contributed mainly by Novatech (6613 TT, not rated) and Rayzher (7703 TT, not rated), these services cover the main systems and hook-up systems, for ultra-pure water (UPW), specialty gases, chemical piping, etc., all of which require highly precise build-up work. Except for cleanroom electromechanical and water, gas and chemical delivery systems, the rest of Acter's revenue comes from the consumer industry services electromechanical (5%), biomedical (3%), and high-tech equipment and materials sales and services (1%).
Acter: revenue by product
Source: Company, Daiwa
Technically, Acter integrates digital transformation and green engineering into its business model, helping it differentiate from peers. Acter deploys digital twin technology and 1:1 3D BIM modelling to detect piping interferences and optimise spatial layout before installation, minimising schedule delays. This makes Acter a more reliable option, in our view, and thus being a favourable supplier, especially for the semiconductor clients that have extremely high quality and swiftness criterion.
Bright outlook: strong order visibility
Rising orders on hand due to supply-demand imbalance for cleanrooms
Acter's order backlog has increased from TWD55bn in 1Q26 to TWD60bn in 2Q26 and TWD66bn in July 2026. We expect this figure to further increase in the following quarters, given the supply-demand imbalance in the cleanroom sector. This is composed of semiconductor (63%), electronic assembly (11%), consumer (9%) and others (17%), per the company. In 2H25, the company accelerated the digestion of small-scale projects below TWD1bn, and, as a result, starting from 1H26, it successfully shifted its project
Source: Company, Daiwa
selection strategy to focus on large-scale projects valued at TWD1bn or above while reducing smaller contracts. This drives the growth in top-line.
OSAT customers have large order backlogs with Acter, which should drive future growth for the company
Source: Company, Daiwa
Back-end packaging, cloud infrastructure and hardware assembly are additional growth drivers. Acter serves as a contractor for both Taiwanese and overseas OSAT providers, including TWD21.7bn contracts YTD, awarded by a major OSAT client vs. TWD16.6bn contract obtained from the same client in 2025. In cloud infrastructure, Acter maintains qualified supplier status with US CSPs, providing mechanical, electrical and plumbing (MEP) integration, especially for those data centres that implement liquid-cooling systems. The company also wins factory construction projects for Taiwanese ODMs across the US and Southeast Asia, as well as PCB facility projects in Thailand and China. Non-tech sectors, including biotechnology, commercial buildings, smart logistics hubs and medical facilities, comprise 9% of the total backlog, per management.
Acter: contracts signed with one major OSAT client
| Date of announcement | Type | Constructor | Amount (TWDm) |
|---|---|---|---|
| 2026/1/7 | EPCM | Acter | 596 |
| 2026/1/16 | EPCM | Acter | 969 |
| 2026/1/22 | EPCM | Acter | 880 |
| 2026/2/23 | EPCM | Acter | 659 |
| 2026/4/15 | EPCM | Acter | 1,166 |
| 2026/4/27 | EPCM | Acter | 1,075 |
| 2026/5/6 | EPCM & equipment | Acter | 365 |
| 2026/5/19 | EPCM | Acter | 535 |
| 2026/5/27 | EPCM | Novatech | 947 |
| 2026/6/1 | EPCM | Acter | 550 |
| 2026/6/22 | EPCM & equipment | Acter | 349 |
| 2026/6/25 | EPCM | Novatech | 508 |
| 2026/7/2 | EPCM | Acter | 662 |
| 2026/7/8 | EPCM | Acter | 679 |
| 2026/7/13 | EPCM | Acter | 1,990 |
| 2026/7/20 | EPCM | Acter | 1,074 |
| 2026/8/5 | EPCM | Acter | 2,046 |
| 2026/8/5 | EPCM | Novatech | 714 |
| 2026/8/10 | EPCM | Acter | 841 |
| 2026/8/12 | EPCM | Acter | 582 |
| 2026/8/17 | EPCM & equipment | Acter | 389 |
| 2026/9/2 | EPC | Acter | 542 |
| 2026/9/17 | EPC & equipment | Acter | 462 |
| 2026/9/30 | EPC | Acter | 2,037 |
| 2026/10/1 | EPC | Acter | 1,055 |
| Total for 2026 YTD | 21,675 | ||
| Total for 2025 | 16,554 |
Source: Companies, Daiwa
The supply of cleanroom services is limited due to high entry barriers in the segment
Competitive advantages
High entry barriers to the segment
Comprehensive product portfolio, empowered by subsidiaries
Acter provides a one-stop EPCM solution, leveraging its subsidiaries to deliver complete solutions. Within the group, the parent company Acter focuses on overall cleanroom and MEP system integration; subsidiary Novatech provides primary chemical systems and hook-up systems; and sub-subsidiary Rayzer specialises in primary specialty-gas systems and hook-up systems. In China, Suzhou Winmax, also a subsidiary of Novatech, focuses on the supply of wet processing and chemical handling equipment. This integrated model covers cleanroom engineering integration, water, power, chemical and gas-utility systems, as well as post-completion validation and maintenance, ensuring cross-system compatibility while mitigating risks associated with multi-contractor hiring.
Under global supply chain diversification trends, this unified group strategy strengthens order-winning capabilities in overseas markets. Clients expanding internationally face regulatory, linguistic and supply-chain complexities, favouring partners that offer one-stop services with a proven cross-border track record.
A diverse client base helps Acter weather economic cycles
Acter's main competitive advantage is its diversification of clients by industry and region. This guides the company through the peaks and troughs of the economy, which is especially crucial given the strong cyclicality of the semiconductor/high-tech industry. Acter serves a broad client base across semiconductors, OSAT, PCB, electronics assembly (ODM), CSP data centres, biopharmaceuticals and even the consumer industry (including commercial real estate and logistics), whereas many peers rely on a few large foundry clients. When semiconductor demand slows, capacity expansion in the PCB or data centre sectors offset the decline. Additionally, Acter avoids concentration risk and margin compression from major foundry accounts, as projects from leading foundries yield lower margins; by serving niche markets like US-based CSPs, the company achieves higher gross margins.
Geographically, Acter operates across Taiwan, China, Southeast Asia, the US and other countries. The company has OSAT and foundry customers in Taiwan and China, PCB clients expanding into Thailand, and ODM and data centre clients establishing operations in the US. Across different countries, local hiring and local supply chain implementation can further reduce costs and increase efficiency relative to peers reliant on a cross-border labour force.
Labour shortages
Amid global labour shortages, Acter minimises the operational impact and turns workforce constraints into a moat through localised talent development. Since engineering labour cannot easily be automated, Acter has built a cross-border talent pipeline via industryacademia partnerships. The company recruits Southeast Asian students for specialised M&E engineering training in Taiwan, deploying them to global project sites after their graduation to solve labour bottlenecks. This structure maintains an engineering team with an average tenure of more than 7 years, creating an operational barrier in an industry with a high employee turnover rate.
Compared with peers relying on high-cost personnel sent from Taiwan, we note that Acter's local hiring strategy creates cost and efficiency advantages. Prioritising compliant local hiring across overseas markets reduces travel expenses while accelerating integration with local supply chains and regulations. Localised teams also handle post-completion services and technical support directly on-site, building long-term client trust in overseas markets.
Some competitors, unlike Acter, lack a diversified client base
Numerous competitors, each with different specialisation
Acter faces different competitors across its main product lines. In the EPCM segment, including cleanroom and MEP works, key competitors include UIS (2404 TT, not rated), L&K (6139 TT, not rated), Yankey (6691 TT, not rated) and Jiuhan (6903 TT, not rated). Despite having business models similar to Acter, UIS, Yankey and Jiuhan focus more on major semiconductor players in both Taiwan and the US, and L&K concentrates on ASEAN semiconductor projects. In the equipment/material sales and agency space, Acter mainly competes with Marketech (6196 TT, not rated). In the water, gas and chemical delivery systems area, through Novatech and Rayzher, Acter group competes with Marketech, Mega Union (6944 TT, not rated), Taiwan Puritic (6826 TT, not rated), Trusval (6667 TT, not rated) and Cica-Huntek (6725 TT, not rated).
In our view, despite the competitive environment, Acter maintains a formidable competitive moat built on several key advantages. We attribute this to its more than 45 year experience in the industry, enabling it to develop specialised expertise that is hard for competitors to replicate.
Acter: peer comparison (cleanroom related)
| Company | Ticker | Market Cap (USDm) | Market | Main thermal product | 2025 Product mix | 2025 Segment breakdown | 2025 Market breakdown |
|---|---|---|---|---|---|---|---|
| Acter | 5536 TT | 4,070 | Taiwan | EPCM turnkey solutions | Cleanroom electromechanical (71%), water, gas and chemical delivery systems (20%), consumer industry electromechanical (4%), biomedical (2%) and high-tech equipment & materials sales & services (3%). (4%) | Semiconductor (69%), electronics assembly (17%), optoelectronics (10%), others | Taiwan (57%), China (29%), others (14%) |
| Novatech | 6613 TT | 708 | Taiwan | Gas and chemical delivery systems and wet processing equipment | Equipment (46%), engineering (47%), eco- integration (7%) | Semiconductor (85%), optoelectronics (7%), others (8%) | China (50%), Taiwan (45%), others (5%) |
| Rayzher | 7703 TT | 225 | Taiwan | Gas delivery systems | Hook-up systems (52%), primary system (28%), small-scale works (18%), equipment & material sales (3%) | Semiconductor, equipment and material providers, gas system providers, optoelectronics | Taiwan (99%), China & Japan (1%) |
| Acter Technology Integration | 603163 CH | 1,102 | China | EPCM turnkey solutions | Cleanroom electromechanical (65%), other electromechanical (32%), equipment & material sales (2%) | Semiconductor (60%), precision manufacturing (34%), optoelectronics (2%), others (4%) | China (58%), others (42%) |
| UIS | 2404 TT | 7,957 | Taiwan | EPCM turnkey solutions | System integration (100%) | Foundries, memory | Taiwan (67%), U.S. (25%), China (3%), Singapore (3%), Japan (1%) |
| L&K | 6139 TT | 5,820 | Taiwan | EPCM turnkey solutions | Turnkey solutions (63%), electromechanical (25%), cleanroom builds (8%), delivery systems (4%) | Semiconductor (74%), railway/highway/airport (10%), MRT (7%), commercial (4%), energy (2%), expropriation (2%), others (1%) | ASEAN (59%), Taiwan (34%), China (7%) |
| Marketech | 6196 TT | 4,634 | Taiwan | Gas and chemical delivery systems, Cleanroom equipment manufacturing/representative, EPCM turnkey solutions | Gas and chemical delivery systems (39%), representative for equipment (25%), equipment manufacturing (18%), turnkey solutions (18%) | Semiconductor (81%), optoelectronics (6%), others (13%) | Taiwan (45%), China (18%), U.S. (17%), others (20%) |
| Yankey | 6691 TT | 3,253 | Taiwan | EPCM turnkey solutions | CSA (civil, structural & architectural), MEP (mechanical, electrical & plumbing), CR (cleanroom) | Semiconductor (58%), PCB (15%), optoelectronics (11%), data centres (6%), office (6%), electronic components (2%), others (1%) | Taiwan (89%), China (6%), others (5%) |
| Jiuhan | 6903 TT | 684 | Taiwan | EPCM turnkey solutions | EPCM turnkey solutions (100%) | AI-related (83%), public works (17%) | Taiwan (100%) |
| Mega Union | 6944 TT | 2,842 | Taiwan | UWS (ultrapure water systems), wastewater recycling, water treatment engineering | Water treatment engineering (80%), O&M/chemicals/consumables (20%) | Semiconductor and other high- tech industry | Taiwan (69%), U.S. (19%), Singapore (10%), China (2%) |
| Taiwan Puritic | 6826 TT | 1,223 | Taiwan | Gas delivery systems | Gas primary system (83%), gas equipment (17%) | High-tech industry (100%) | Taiwan (73%), Americas (18%), Asia (9%) |
| Trusval | 6667 TT | 468 | Taiwan | Water, gas and chemical delivery systems | Primary and hook-up systems (92%), eco- integration (4%) | Taiwan (96%), others (6%) | |
| Cica-Huntek | 6725 TT | 253 | Taiwan | Chemical delivery systems | Primary and hook-up systems (73%), system integration engineering (20%), system maintenance (7%) | Taiwan (87%), Asia (13%) |
Source: Companies, Bloomberg, Daiwa
We forecast Acter's revenue to record a CAGR of 24.6% over 2026-28E
We forecast an upward operating-margin trend over 2026-28E
We forecast a net profit CAGR of 36.9% for Acter over 2026-28E
Financial analysis
We forecast the company's net profit to rise at a CAGR of 36.9% over 2026-28E, driven by a revenue CAGR of 24.6% due to surging demand from the high-tech industry (an increase in the order backlog to TWD66bn at the end of July 2026 vs. TWD46bn at end-2025) and a 3.3pp expansion in operating margin over 2026-28E, driven by the gross margin improvement from more favourable project wins and operating leverage.
Strong order visibility, with revenue expected to grow across all sectors over 2026-28E
We forecast Acter's revenue to increase at a CAGR of 24.6% over 2026-28E, driven by scale expansion and a growing demand from various industries, including semiconductor, electronic assembly, optoelectronics and others.
Acter: revenue growth trend
Source: Company, Daiwa forecasts
Gross- and operating-margin expansion trend
Over 2026-28E, we forecast Acter's gross and operating margins to expand on rising revenue scale and a higher complexity of cleanrooms for advanced manufacturing. We note that the gross margin from high-tech cleanrooms is higher than that from consumer industries, such as commercial buildings and biopharmaceuticals. Thus, we estimate the company's gross margin to reach 26.0% in 2028E from 18.9% in 2025 and its operating margin to reach 21.6% in 2028E from 13.7% in 2025.
Acter: gross- and operating-margin trend
Source: Company, Daiwa forecasts
Net margin likely to rise over 2026-28E
We forecast Acter's net profit to rise to TWD8,797m in 2027E and TWD11,851m in 2028E (from TWD6,325m in 2026E). We expect its net margin to come in at 13.1% in 2027E and 14.2% in 2028E (vs. 11.7% in 2026E) and for its net profit to grow at a CAGR of 36.9% over 2026-28E.
Acter: quarterly P&L
Acter: net profit trend
Source: Company, Daiwa forecasts
Quarterly P&L
| (TWDm) | 1Q26 | 2Q26 | 3Q26E | 4Q26E | 1Q27E | 2Q27E | 3Q27E | 4Q27E |
|---|---|---|---|---|---|---|---|---|
| Revenue | 11,603 | 13,381 | 13,959 | 14,900 | 14,900 | 16,128 | 17,242 | 18,713 |
| Gross profit | 2,945 | 2,762 | 3,211 | 3,736 | 3,427 | 4,032 | 4,310 | 4,976 |
| Operating profit | 2300 | 2126 | 2499 | 2930 | 2697 | 3258 | 3517 | 4125 |
| Profit before tax | 2371 | 2232 | 2569 | 3000 | 2720 | 3281 | 3540 | 4148 |
| Net profit | 1583 | 1361 | 1547 | 1835 | 1786 | 2092 | 2269 | 2651 |
| Basic EPS (TWD) | 12.76 | 10.97 | 12.46 | 14.79 | 14.39 | 16.86 | 18.28 | 21.36 |
| Margin | ||||||||
| Gross margin | 25.4% | 20.6% | 23.0% | 25.1% | 23.0% | 25.0% | 25.0% | 26.6% |
| Operating margin | 19.8% | 15.9% | 17.9% | 19.7% | 18.1% | 20.2% | 20.4% | 22.0% |
| Pre-tax margin | 20.4% | 16.7% | 18.4% | 20.1% | 18.3% | 20.3% | 20.5% | 22.2% |
| Net margin | 13.6% | 10.2% | 11.1% | 12.3% | 12.0% | 13.0% | 13.2% | 14.2% |
| YoY | ||||||||
| Revenue | 35.6% | 22.7% | 26.4% | 35.8% | 28.4% | 20.5% | 23.5% | 25.6% |
| Gross profit | 91.7% | 31.5% | 63.1% | 66.6% | 16.4% | 46.0% | 34.3% | 33.2% |
| Operating profit | 124.6% | 35.5% | 58.3% | 91.1% | 17.3% | 53.3% | 40.8% | 40.8% |
| Profit before tax | 109.3% | 45.8% | 46.2% | 82.8% | 14.7% | 47.0% | 37.8% | 38.3% |
| Net profit | 146.3% | 57.9% | 51.6% | 83.1% | 12.8% | 53.7% | 46.7% | 44.5% |
| QoQ | ||||||||
| Revenue | 5.7% | 15.3% | 4.3% | 6.7% | 0.0% | 8.2% | 6.9% | 8.5% |
| Gross profit | 31.3% | -6.2% | 16.3% | 16.4% | -8.3% | 17.7% | 6.9% | 15.4% |
| Operating profit | 50.0% | -7.6% | 17.5% | 17.2% | -7.9% | 20.8% | 8.0% | 17.3% |
| Profit before tax | 44.5% | -5.9% | 15.1% | 16.8% | -9.3% | 20.6% | 7.9% | 17.2% |
| Net profit | 58.0% | -14.1% | 13.7% | 18.6% | -2.7% | 17.1% | 8.5% | 16.8% |
Source: Company, Daiwa forecasts
We expect stronger cash balances and FCF over 2026-28E due to better profitability
Strong ROE outlook over 2026-28E
Intact demand to support revenue growth over our forecast horizon; ROE expansion underway
We forecast Acter's total cash and equivalents to reach TWD16,838m (36.8% of its total assets) in 2026E and increase to TWD27,839m in 2028E (42.8% of total assets) with net cash likely to come in at TWD16,244m in 2026E and TWD27,245m in 2028E.
After factoring in our 2027 and 2028 capex assumptions of TWD180m, we expect Acter's free cash flow (FCF) to improve to TWD12,129m in 2028E, from TWD5,763m in 2026E. We believe the capacity expansion cost will initially be low and that the company will continue to benefit from the better profitability.
We expect Acter's ROE to improve to a record-high of 56.8% in 2028E from 29.3% in 2025 (following steady annual increases to 46.8% in 2026E and 54.9% in 2027E), which we attribute to margin expansion from the revenue size increase and gross margin expansion led by increases in cleanroom complexity.
Acter: ROAE and ROAA trend
Source: Company, Daiwa forecasts
12-month TP of TWD1,415, based on a target PER of 20x
Valuation and risks
Undemanding valuation, alongside its leading global positions in the OSAT and memory segments and an optimistic industry outlook
We initiate coverage of Acter with a Buy (1) rating and 12-month TP of TWD1,415, based on a target PER of 20x applied to our one-year-forward EPS forecast. This target multiple is higher than the average of its past-3-year 1-year-forward PER of 12.2x (ranged from 7.4x to 23.5x) and the average of its past-5-year 1-year-forward PER of 9.6x (ranged from 4.4x to 23.5x), which we view as undemanding as we forecast a 36.9% net profit CAGR over 2026-28E, implying a 0.54x PEG. This is supported by its business expansion in the next 2-3 years. We see potential for a rerating of the stock, given Acter's global leadership in cleanroom EPCM, particularly in the OSAT and memory industries.
The stock is trading currently at a 15.8x 1-year-forward PER vs. its earnings CAGR of 36.9% over 2026-28E, translating to a 0.43x PEG ratio. Its share price has underperformed TAIEX Index by 32.7% in 3Q26, mainly due to its weaker-than-expected 2Q26 results. However, given the potential improvement in sector sentiment following TSMC's results on 15 October 2026, along with the likelihood that Acter's revenue momentum will strengthen in the coming months, we recommend that investors buy the stock.
Acter: past-3-year-forward PER (average: 12.0x)
Acter: past-5-year-forward PER (average: 9.5x)
Source: Bloomberg, Daiwa estimates
Stronger earnings growth outlook and more room to grow vs. peers
We compare Acter with other leading cleanroom EPCM companies such as UIS (2404 TT, TWD1,330.0, not rated), L&K (6139 TT, TWD787.0, not rated) and Yankey (6691 TT, TWD776.0, not rated). UIS, L&K and Yankey are trading at a PER of 14.7x (earnings CAGR of 40.7% over 2025-27E), 9.5x (earnings CAGR of 36.9% over 2026-28E) and 15.1x (earnings CAGR of 53.6% over 2025-27E), on their 1-year-forward EPS, respectively.
Acter's peers are trading at 18.7x for 2026E and 14.2x for 2027E. We forecast Acter to deliver an EPS CAGR of 36.9% over 2026-28E vs. 31.5% CAGR for the segment over the same period.
We believe our target one-year-forward PER of 20x (equivalent to a 0.54x PEG using 2026-28E EPS CAGR) is undemanding as: 1) Acter is ramping up capacity to meet growing demand from high-tech customers and is in an expansion cycle; and 2) its leading position among OSAT and memory clients warrants a valuation premium, compared to its global peers.
Acter: 1-year-forward PER bands
Acter: earnings revision trend
Source: Bloomberg, Daiwa forecasts
UIS: 1-year-forward PER bands
Source: Bloomberg, Daiwa
UIS: earnings revision trend
Source: Bloomberg, Daiwa forecasts
L&K: 1-year-forward PER bands
Source: Bloomberg, Daiwa
L&K: earnings revision trend
Source: Bloomberg, Daiwa forecasts
Yankey: 1-year-forward PER bands
Source: Bloomberg, Daiwa
Yankey: earnings revision trend
Source: Bloomberg, Daiwa forecasts
Source: Bloomberg, Daiwa
Acter: peers valuation comparison
| Companies | Bloomberg code | Price (lc) - 7/10/26 | Daiwa rating | Market cap - (USDm) | D. turnover - (USDm) | PER (x) - 2026E | PER (x) - 2027E | PER (x) - 2028E | EPS CAGR - 2026-28E | ROE (%) - 2026E | ROE (%) - 2027E | ROE (%) - 2028E | PBR (x) - 2026E | PBR (x) - 2027E | PBR (x) - 2028E | Dividend yield (%) - 2026E | Dividend yield (%) - 2027E | Dividend yield (%) - 2028E |
|---|---|---|---|---|---|---|---|---|---|---|---|---|---|---|---|---|---|---|
| Acter* | 5536 TT | 1,045.0 | Buy | 4,070 | 33.4 | 20.6 | 14.8 | 11.0 | 36.9 | 46.8 | 54.9 | 56.8 | 9.3 | 7.2 | 5.5 | 3.4 | 4.7 | 6.4 |
| Novatech | 6613 TT | 290.0 | Non rated | 708 | 3.8 | 15.5 | 11.6 | 8.1 | 38.4 | 27.9 | 34.3 | n.a. | n.a. | n.a. | n.a. | 5.1 | 6.8 | n.a. |
| Rayzher | 7703 TT | 206.0 | Non rated | 225 | 0.6 | n.a. | n.a. | n.a. | n.a. | n.a. | n.a. | n.a. | n.a. | n.a. | n.a. | n.a. | n.a. | n.a. |
| Acter Technology Integration | 603163 CH | 73.9 | Non rated | 1,102 | 9.6 | 33.8 | 22.3 | 17.6 | 38.5 | 17.0 | 22.4 | 24.9 | 5.7 | 4.9 | 4.2 | 1.6 | 2.4 | 3.7 |
| UIS | 2404 TT | 1,330.0 | Non rated | 7,957 | 68.0 | 17.9 | 13.5 | 11.0 | 27.7 | 56.0 | 48.0 | 47.3 | n.a. | n.a. | n.a. | 4.6 | 5.5 | n.a. |
| L&K | 6139 TT | 787.0 | Non rated | 5,820 | 81.6 | 13.3 | 8.8 | 7.1 | 36.9 | 64.0 | 64.1 | n.a. | n.a. | n.a. | n.a. | 5.2 | 8.3 | n.a. |
| Marketech | 6196 TT | 670.0 | Non rated | 4,634 | 27.8 | 23.5 | 20.5 | 19.3 | 10.4 | 34.5 | 32.3 | 30.2 | 7.2 | 6.1 | 5.4 | 2.3 | 2.6 | 2.6 |
| Yankey | 6691 TT | 776.0 | Non rated | 3,253 | 16.8 | 16.9 | 14.2 | n.a. | n.a. | 67.2 | 62.1 | n.a. | 8.6 | 5.5 | n.a. | 4.9 | 5.8 | n.a. |
| Jiuhan | 6903 TT | 327.0 | Non rated | 684 | 4.7 | 9.8 | 7.4 | n.a. | n.a. | 46.9 | 42.7 | n.a. | n.a. | n.a. | n.a. | n.a. | n.a. | n.a. |
| Mega Union | 6944 TT | 908.0 | Non rated | 2,842 | 12.2 | 22.9 | 18.2 | n.a. | n.a. | 44.1 | 46.0 | n.a. | 6.6 | 8.2 | n.a. | 2.7 | 3.2 | n.a. |
| Taiwan Puritic | 6826 TT | 455.5 | Non rated | 1,223 | 1.6 | n.a. | n.a. | n.a. | n.a. | n.a. | n.a. | n.a. | n.a. | n.a. | n.a. | n.a. | n.a. | n.a. |
| Trusval | 6667 TT | 278.5 | Non rated | 468 | 2.4 | n.a. | n.a. | n.a. | n.a. | n.a. | n.a. | n.a. | n.a. | n.a. | n.a. | n.a. | n.a. | n.a. |
| Cica-Huntek | 6725 TT | 217.0 | Non rated | 253 | 0.8 | 12.5 | 10.5 | n.a. | n.a. | n.a. | n.a. | n.a. | n.a. | n.a. | n.a. | n.a. | n.a. | n.a. |
| Industry average | 18.7 | 14.2 | 12.4 | 31.5 | 44.9 | 45.2 | 39.8 | 7.5 | 6.4 | 5.0 | 3.7 | 4.9 | 4.2 |
Source: Bloomberg; *Daiwa forecasts
Our 12-month TP of TWD1,415 is also supported by our DCF valuation
Acter: DCF calculation
We also reference a DCF methodology (see charts below), which indicates a DCF-derived fair value estimate of TWD1,454/share, which supports our 12-month TP of TWD1,415.
In our DCF calculation, we apply a WACC of 19.3% to Acter's FCF over 2026-35E and a terminal growth rate of 7.0% thereafter. We expect the company to continue to record steadily increasing FCF over 2026-35E.
Acter: DCF sensitivity
| Target gearing (debt/capital) | 0.7% |
|---|---|
| Market risk premium (%) | 18.0% |
| Risk-free rate (%) | 5.0% |
| Cost of debt (%) | 5.0% |
| Cost of equity (%) | 19.4% |
| WACC (%) | 19.3% |
| Terminal growth rate | 7.0% |
| Terminal WACC | 19.3% |
| Enterprise value (TWDm) | 167,994 |
| Less: net debt (as of end-2025) (TWDm) | -12,402 |
| Equity value (TWDm) | 180,396 |
| No. shares (m) | 124 |
| Per share equity value (TWD) | TWD1,454 |
Source: Company, Daiwa estimates
| WACC (%) | WACC (%) - 18.9 | WACC (%) - 19.1 | WACC (%) - 19.3 | WACC (%) - 19.5 | WACC (%) - 19.7 | |
|---|---|---|---|---|---|---|
| Terminal growth rate (%) | 8.0 | 1,571 | 1,545 | 1,520 | 1,496 | 1,473 |
| Terminal growth rate (%) | 7.5 | 1,533 | 1,509 | 1,486 | 1,463 | 1,442 |
| Terminal growth rate (%) | 7.0 | 1,498 | 1,476 | 1,454 | 1,433 | 1,413 |
| Terminal growth rate (%) | 6.5 | 1,466 | 1,445 | 1,425 | 1,405 | 1,386 |
| Terminal growth rate (%) | 6.0 | 1,437 | 1,417 | 1,398 | 1,379 | 1,361 |
Source: Daiwa estimates
Acter: free cash flow forecasts
| (TWDm) | 2026E | 2027E | 2028E | 2029E | … | 2035E |
|---|---|---|---|---|---|---|
| EBITDA | 10,482 | 14,182 | 18,610 | 22,332 | … | 66,683 |
| Less: taxation (EBIT*tax rate) | -2,447 | -3,293 | -4,355 | -5,226 | … | -15,605 |
| Plus: decrease in working capital | -2,122 | -1,006 | -1,946 | -1,946 | … | -1,946 |
| Less: capital expenditure | -150 | -180 | -180 | -180 | … | -180 |
| Free cash flow (TWDm) | 5,763 | 9,703 | 12,129 | 14,980 | … | 48,952 |
| Discount rate | 19.3% | 19.3% | 19.3% | 19.3% | … | 19.3% |
| Discount factor | 0.96 | 0.80 | 0.67 | 0.56 | … | 0.20 |
| NPV of free cash flow | 5,510 | 7,776 | 8,145 | 8,432 | … | 9,558 |
Source: Daiwa estimates and forecasts
Risks to our call
Primary/key risks:
Weaker-than-expected expansion in semiconductor industry
The biggest downside risk to our call for Acter is weaker-than-expected expansion from semiconductor clients, especially in advanced-node foundries, advanced packaging and OSAT. If global demand for AI servers, HPC or HBM slows, or if clients delay fab build-ups and overseas expansion plans, it will directly pressure order inflows and backlog conversion for Acter.
Project execution delays or cancellations
Acter's revenue recognition is tied to large, complex EPCM and integrated engineering projects, which are often subject to customer-driven delays. Any postponement in project Key risks to our call: weaker-than-expected expansion in semiconductor industry, project delays or cancellations, and higher-than-expected raw-material price hikes schedule, construction bottlenecks or cancellation of large projects could defer revenue recognition and hurt overall profit. This risk is more obvious in overseas projects, where licensing, fire-safety approvals and hazardous-chemical regulations are more complicated.
Higher-than-expected raw-material price hikes
Raw-material costs (especially copper and oil-related costs) account for 50-60% of COGS and thus the price volatility makes costs difficult to manage. Acter needs to maintain supplier relations, negotiate appropriate price-adjustment mechanisms with clients, and invest in R&D to identify composite material substitutes, thereby reducing reliance on any single component.
Secondary risks:
Labour issues or larger-than-expected increases in labour costs
Cleanroom engineering is highly labour-intensive and relies on on-site installation and supervision. Although Acter has built a local hiring and talent-development model, a largerthan-expected shortage of engineers or rising wage pressure could still raise costs and constrain capacity expansion. Any inability to secure enough skilled labour may also limit the company's ability to convert orders into revenue in time.
Margin pressure from lower-margin projects or mix shift
Acter's business mix includes a few low-margin C&S services as well as larger EPCM and system integration contracts. If the company takes on a higher proportion of lower-margin projects, or if competition intensifies in certain geographies or customer segments, gross margin could come under pressure. In addition, an unfavourable product mix shift towards less profitable work could offset benefits from backlog growth.
Overseas expansion and regulatory risks
Acter is expanding across markets in the US, Southeast Asia, Japan and China, which exposes it to FX movements, local compliance requirements, tax complexity and regulatory uncertainty. Delays in licensing, changes in safety standards or local-content requirements could increase project costs and reduce execution efficiency. Any misstep in managing overseas operations could damage profitability and client retention.
Comprehensive cleanroom EPCM provider in Taiwan; dominates both hightech market and consumer industry
Appendix
Company background
History
Acter (5536 TT), founded in 1979 and headquartered in Taichung, Taiwan, is a cleanroom EPCM provider with over four decades of experience. Starting with early mechanical and electrical (M&E) engineering through vertical and horizontal integration, Acter has now developed into an engineering technology group with cross-border execution capabilities. A cleanroom building process begins with civil & structural (C&S) works to establish the physical plant, followed by mechanical, electrical, and plumbing (MEP) works for essential utility generation, where Acter is one of the experts. After MEP is finished, chemicals/gas/water are then distributed via main systems through primary piping networks, and finally delivered to production equipment through hook-up systems. The company's core competency is providing one-stop integrated total solutions, spanning services, primary piping networks and hook-up systems, leaving C&S services to other engineering peers, given the nature of the latter segment's low margin and long timespan.
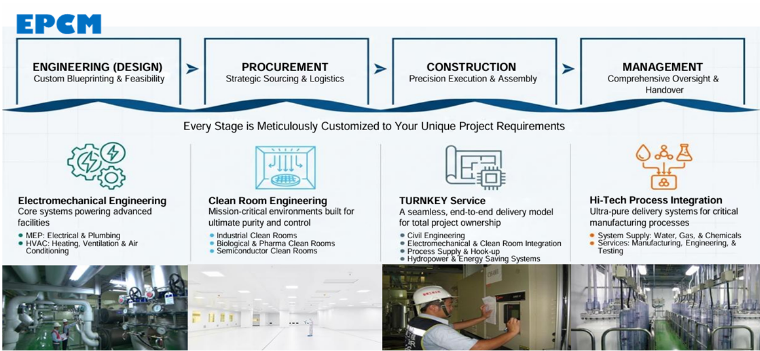
In terms of business model, Acter delivers EPCM (Engineering, Procurement, Construction, Management) capabilities. From initial customised planning and feasibility assessments to strategic procurement, installation, and post-completion maintenance, Acter builds production environments tailored to client process requirements.
Acter: EPCM solutions offered
Source: Company, Daiwa
Regarding global expansion, Acter actively responds to the global supply chain's 'N+1' strategy, operating across 11 regions with 33 companies globally. Its service network spans Taiwan, China, Southeast Asia (including Thailand, Malaysia, Vietnam, Indonesia, and Singapore), Japan, India, and the US. The company leverages a group synergy strategy by integrating resources from key subsidiaries - such as Novatech (6613 TT, not rated; provides chemical primary and hook-up systems), Rayzher (7703 TT, not rated; provides special gas primary and hook-up supply systems), and Acter Group (603163 CH, not rated; provides cleanroom engineering in China) - to form a complete technical ecosystem, ensuring cross-border capability and quality.
Young, capable human resource is a crucial asset for Acter
Acter: number of employees
Acter: global footprint
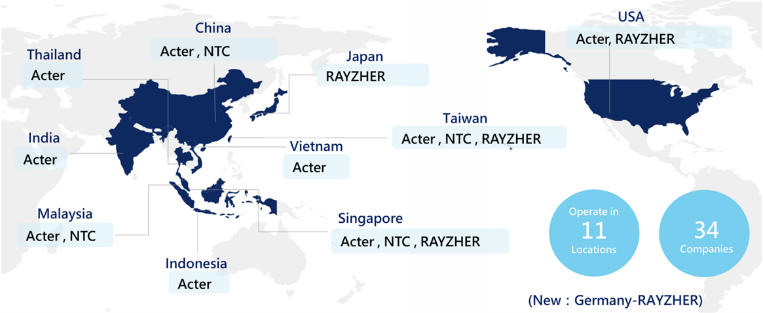
Source: Company, Daiwa
In 2Q26, Acter classified revenue as: cleanroom electromechanical (63%), water, gas and chemical delivery systems (28%), consumer industry electromechanical (6%), biomedical (2%) and high-tech equipment & materials sales & services (1%). In 2025, the product mix was: cleanroom electromechanical (71%), water, gas and chemical delivery systems (20%), consumer industry electromechanical (4%), biomedical (2%) and high-tech equipment & materials sales & services (3%).
Acter serves a diversified client base divided into high-tech and consumer divisions. The high-tech division focuses on advanced sectors including semiconductors, OSAT, PCB, AI data centres (for CSPs), and electronics assembly. The consumer division extends into healthcare, premium commercial properties, logistics facilities, and green engineering. This multi-industry strategy allows the company to capitalise on tech sector upgrades while maintaining resilient operations across technology (especially semiconductor) cycles.
Acter adopts a management strategy involving local hiring in overseas markets, prioritising collaboration with local supply chains and compliance with local regulations to reduce cross-border deployment costs and thus build strong local teams. Acter has more than 2,600 employees worldwide (average age: 42 years; average length of service: 7 years). With more than 45 years of experience in EPCM, the company plays a reliable role for both high-tech and consumer industry.
Acter: location of employees (as of June 2026)
Source: Company, Daiwa
Furthermore, Acter integrates ESG sustainability into its core corporate identity and technological innovation. As a green engineering provider, the company develops energysaving construction methods, digital twins, ice-storage energy conservation, wastewater recycling, and AI smart facility management systems to help clients achieve carbon neutrality while expanding capacity. Backed by solid corporate governance, Acter Acter integrates ESG capabilities into its core corporate value
Acter: QFII holdings
Acter: shareholding structure (as of September 2026)
Glossary of terms
EPCM (engineering, procurement, construction, and management): Cleanroom construction services that cover the whole process including project design, purchasing, construction and management.
BIM (building information modelling): A digital modelling system of a building and its key information used in cleanroom construction.
C&S (civil & structural): Site infrastructure and the design and construction of loadbearing elements.
MEP (mechanical, electrical, and plumbing): Building essential systems for environment control, power, lighting, water, and drainage.
Source: TEJ
Source: TEJ
consistently ranks among the top performers in Taiwan's corporate governance evaluations, maintaining a stable dividend payout policy and strong ROE as one of the leading facility engineering vendors.
Acter: management team (according to 2025 annual report)
| Management | Position | Background and experience |
|---|---|---|
| Liang, Chin-Li | Chairman/CEO | Director since founding the company in 2008. Liang possesses working experience related to refrigeration and air-conditioning; graduated from EMBA, National Chiao Tung University, and Department of Electrical Engineering - Refrigerating and Air-conditioning, Taipei Tech |
| Hu, Tai-Tsen | Director | Director since founding the company in 2009. Hu possesses working experience related to refrigeration and air-conditioning; graduated from EMBA, Tunghai University, and Department of Electrical Engineering - Refrigerating and Air-conditioning, Taipei Tech |
| Lai, Ming-Kun | President | Graduated from EMBA, National Taiwan University of Science and Technology, and Department of Electrical Engineering - Refrigerating and Air-conditioning, Taipei Tech |
| Wang, Chun-Sheng | President | Graduated from EMBA, Feng Chia University, and Department of Electrical Engineering - Refrigerating and Air-conditioning, Taipei Tech |
Source: Company
Acter: major shareholders (as of August 2026)
| Holder | Share (%) |
|---|---|
| Xiang-Hui Development Co., Ltd. | 4.35% |
| Chiu-Chang Investment Co., Ltd. | 3.96% |
| Liang, Chin-Li | 3.72% |
| JFE Engineering Co., Ltd. | 2.23% |
Source: TEJ
ESG analysis
ESG risks
| Risks | Management | Analystcomments |
|---|---|---|
| Executive/board quality | 1 | Acter maintains a structured governance framework that supports disciplined management. The chairman is Chin-Li Liang. The company operates with defined responsibility across the board, management, cyber security oversight, operations, and audit functions. It has established an organisation function led by the President, a Chief Cyber Security Officer, a Response Team, an Operations and Policy Enforcement Team, and an Audit Team to supervise policy execution and review security implementation. |
| G | Capital management 1 | Acter manages capital in a stable and shareholder-friendly manner. Over the past several years, Acter has typically maintained a dividend payout ratio of 65-80%. It also maintains a strong financing network across multiple banks, supporting flexibility for project execution and expansion while preserving financial stability. |
| Related party & transaction | 1 | Acter's business is supported by a transparent network of suppliers, project partners, and financial counterparties, including companies with equity ties and reciprocal business relationships that are common in its operating ecosystem. These relationships are managed through formal internal procedures for fund lending, endorsements and guarantees, and asset acquisition and disposal, all of which are approved through shareholder mechanisms and company rules. Such a structure helps keep inter-company and supply-chain transactions organised and traceable, reducing the risk of unclear dealings. |
| E Productquality& safety | 1 | Acter executes its projects through a complete, disciplined process covering bidding assessment, project planning, design, procurement, construction management, verification and testing, completion and acceptance, closing review, and warranty service. Its cleanroom and electromechanical engineering business is built around maintaining temperature, humidity, and dust-free environments that support high-precision manufacturing. The company strengthens quality control through BIM, Revit, simulation software, ISO drawing output tools, and automated modeling, which improve design accuracy, construction efficiency, and project consistency. |
| E | Ecological impacts 1 | Acter has built a concrete sustainability programme with measurable environmental outcomes. The company completed Scope 1, 2, and 3 greenhouse gas emissions calculation, obtained third-party verification under ISO 14064-1:2018, and publicly disclosed energy consumption and emissions data. It also implemented a strong waste reduction programme, achieving a 95% wastepaper recycling rate at headquarters in 2025 and 100% paper recycling at the 19F and 20F floors after establishing paper segregation and reuse procedures. The company also promoted sustainability measures through emissions inventory management, environmental disclosures, and resource-efficiency practices. These actions show active environmental management and a clear commitment to lowering operational impact. |
| Health & | safety |
Update Date: 7 Oct 2026
Source: Daiwa, Company
Daiwa's Asia Pacific Research Directory
| HONG KONG | ||
|---|---|---|
| Hiroyuki GOTO Regional Head of Equity, Regional Head | (852) 2773 8870 Asia & Oceania; | hiroyuki.goto@hk.daiwacm.com of Asia Pacific Research |
| John HETHERINGTON | (852) 2773 8787 | john.hetherington@hk.daiwacm.com |
| Co-Head of Asia Pacific Research and Head of Research Publications | ||
| Li XIONG Strategy (Hong | (852) 2773 8878 Kong/China) | li.xiong@hk.daiwacm.com |
| Kelvin LAU | (852) 2848 4467 | kelvin.lau@hk.daiwacm.com |
| Regional Head of Automobiles, Industrials and Transportation | ||
| Evelyn ZHANG | (852) 2848 4970 | evelyn.zhang@hk.daiwacm.com |
| Automobiles and Components (Hong Kong/China) | ||
| Carol XIA | (852) 2532 4349 | carol.xia@hk.daiwacm.com |
| Head of China Consumer; Consumer (Hong Kong/China) | ||
| Steven NIE | (852) 2848 4464 | steven.nie@hk.daiwacm.com |
| Consumer (Hong Kong/China); Global Cryptocurrency | ||
| Siman CHEN | (852) 2532 4350 | siman.chen@hk.daiwacm.com |
| Consumer (Hong Kong/China) | ||
| Jing YANG | (852) 2532 4308 | jing.yang@hk.daiwacm.com |
| Head of China Healthcare | ||
| John CHOI Head of China Internet; of Emerging | (852) 2773 8730 Regional Head | john.choi@hk.daiwacm.com Opportunities |
| Lily LIU | (852) 2848 4435 | lily.liu@hk.daiwacm.com |
| Internet (Hong Kong/China) | ||
| Dennis IP | (852) 2848 4068 | dennis.ip@hk.daiwacm.com |
| Head of Asia ex-Japan Power, Utilities, Renewables & ESS (PURE) Research; US & China Power Equipment (Gas, Nuclear, Solar, Grid, Battery & Rare Earth Materials); | ||
| Derek | ||
| Power, Utilities, Renewables and ESS (PURE) - Gas & Gas Equipment, Rare Earth | ||
| Materials | 2848 | |
| Power, Utilities, Renewables and ESS (PURE) - US Power, PCB (China) | ||
| (852) | ||
| Marco ZENG | ||
| 4430 | ||
| marco.zeng@hk.daiwacm.com | ||
| (China), | ||
| Equipment (US) | ||
| ZHANG | ||
| (852) 2532 4341 derek.zhang@hk.daiwacm.com | ||
| Utilities (Hong | ||
| Kong), Power | ||
| (China) | ||
| Tech Hardware - AIDC Power, PCB, Optical Fiber |
| CHINA | CHINA | CHINA |
|---|---|---|
| Louis LUO | (86) 21 6841 3282 | louis.luo@daiwacm.cn |
| Automobiles and Components, Industrials (China) | Automobiles and Components, Industrials (China) | Automobiles and Components, Industrials (China) |
| William WU Banking, Property | (86) 21 6841 3200 (China/Hong Kong) | william.wu@daiwacm.cn |
| Mavis MA Battery Components; | (86) 21 6841 3288 Industrials (China) | mavis.ma@daiwacm.cn |
| Leo LU Power, Utilities, | (86) 21 6841 3286 Renewables and ESS (PURE) | leo.lu@daiwacm.cn - Solar, ESS, Lithium, AIDC Power (China) |
| Skye LIANG Power, Utilities, | (86) 21 6841 3207 Renewables and ESS (PURE) | skye.liang@daiwacm.cn - Grid, Wind and Optical Fibre (China) |
| Bintuo NI Tech Hardware and | (86) 21 6841 3228 Semiconductors (China) | bintuo.ni@daiwacm.cn |
| SOUTH KOREA | SOUTH KOREA | SOUTH KOREA |
|---|---|---|
| Yoonki BAE Automobile Components, | (82) 2 787 9168 Healthcare | yoonki.bae@kr.daiwacm.com |
| Mike OH Banking, Capital Goods | (82) 2 787 9179 - Defence, Construction | mike.oh@kr.daiwacm.com and Shipbuilding, and Utilities |
| Youngho JANG Consumer, Healthcare | (82) 2 787 9838 | youngho.jang@kr.daiwacm.com |
| Henny JUNG EV Batteries and Battery Components | (82) 2 787 9182 Materials, IT/Electronics | henny.jung@kr.daiwacm.com (Small/Mid Cap), Automobiles and |
| Daeho SON Industrials - Robotics | (82) 2 787 9176 | dh.son@kr.daiwacm.com |
| Joon LEE Media, Software and IT | (82) 2 787 9151 Services | hj.lee@kr.daiwacm.com |
| Thomas Y KWON Pan-Asia Head of Internet | (82) 2 787 9181 & Telecommunications; | yskwon@kr.daiwacm.com Online Games |
| SK KIM Head of Global Memory; | (82) 2 787 9173 IT/Electronics - | sk.kim@kr.daiwacm.com Semiconductors/Displays and Tech Hardware |
| TAIWAN | TAIWAN | TAIWAN |
|---|---|---|
| Rick HSU | (886) 2 8758 6261 | rick.hsu@daiwacm-cathay.com.tw |
| Head of Regional Technology; Head of Taiwan Research; Semiconductors (Regional) | Head of Regional Technology; Head of Taiwan Research; Semiconductors (Regional) | Head of Regional Technology; Head of Taiwan Research; Semiconductors (Regional) |
| Sheng CHENG IT/Technology Hardware | (886) 2 8758 6253 (Automation, Datacentre | sheng.cheng@daiwacm-cathay.com.tw Components and PCB/CCL) (Greater |
| China) Leon CHEN | (886) 2 8758 6247 | leon.chen@daiwacm-cathay.com.tw |
| IT/Technology - Semiconductors Supply Chain (Taiwan) | IT/Technology - Semiconductors Supply Chain (Taiwan) | IT/Technology - Semiconductors Supply Chain (Taiwan) |
| Stacy LIN | (886) 2 8758 6252 | stacy.lin@daiwacm-cathay.com.tw |
| IT/Technology - Semiconductors Supply Chain (Taiwan) | IT/Technology - Semiconductors Supply Chain (Taiwan) | IT/Technology - Semiconductors Supply Chain (Taiwan) |
| Helen CHIEN Small/Mid Cap | (886) 2 8758 6254 | helen.chien@daiwacm-cathay.com.tw |
Daiwa's Offices
| Office / Branch / Affiliate | Address | Tel | Fax |
|---|---|---|---|
| DAIWA SECURITIES GROUP INC | |||
| HEAD OFFICE | Gran Tokyo North Tower, 1-9-1, Marunouchi, Chiyoda-ku, Tokyo, 100-6753 | (81) 3 5555 3111 | (81) 3 5555 0661 |
| Daiwa Securities Trust Company | One Evertrust Plaza, Jersey City, NJ 07302, U.S.A. | (1) 201 333 7300 | (1) 201 333 7726 |
| Daiwa Securities Trust and Banking (Europe) PLC (Head Office) | 5 King William Street, London EC4N 7JB, United Kingdom | (44) 207 320 8000 | (44) 207 410 0129 |
| Daiwa Europe Trustees (Ireland) Ltd | Level 3, Block 5, Harcourt Centre, Harcourt Road, Dublin 2, Ireland | (353) 1 603 9900 | (353) 1 478 3469 |
| Daiwa Capital Markets America Inc. New York Head Office | 1251 Avenue of the Americas, 49th Floor, New York, NY 10020 | (1) 212 612 7000 | (1) 212 612 7100 |
| Daiwa Capital Markets America Inc. San Francisco Branch | 1 California St, Suite 200, San Francisco, CA 94111, U.S.A. | (1) 415 955 8100 | (1) 415 956 1935 |
| Daiwa Capital Markets Europe Limited, London Head Office | 5 King William Street, London EC4N 7AX, United Kingdom | (44) 20 7597 8000 | (44) 20 7597 8600 |
| Daiwa Capital Markets Deutschland GmbH | Tower 185, 26 O.G., Friedrich-Ebert-Anlage 35-37, 60327 Frankfurt am Main, Germany | (49) 69 27139 8100 | (49) 69 27139 8190 |
| Daiwa Capital Markets Europe Limited, Paris Representative Office | 40 rue du Colisée, 75008 Paris, France | (33) 1 56 262 200 | (33) 1 47 550 808 |
| Daiwa Capital Markets Europe Limited, Bahrain Branch | Office 3503, 35th Floor, United Tower, Bahrain Bay, P.O. Box 30069, Manama, Bahrain | (973) 17 534 452 | (973) 17 535 113 |
| Daiwa Capital Markets Hong Kong Limited | Level 26, One Pacific Place, 88 Queensway, Hong Kong | (852) 2525 0121 | (852) 2845 1621 |
| Daiwa Capital Markets Singapore Limited | 7 Straits View, Marina One East Tower, #16-05 & #16-06, Singapore 018936, Republic of Singapore | (65) 6387 8888 | (65) 6282 8030 |
| Daiwa Capital Markets Australia Limited | Level 34, Rialto North Tower, 525 Collins Street, Melbourne, Victoria 3000, Australia | (61) 3 9916 1300 | (61) 3 9916 1330 |
| Daiwa-Cathay Capital Markets Co Ltd | 14/F, 200, Keelung Road, Sec 1, Taipei, Taiwan, R.O.C. | (886) 2 2723 9698 | (886) 2 2345 3638 |
| Daiwa Securities Capital Markets Korea Co., Ltd. | 20 Fl.& 21Fl. One IFC, 10 Gukjegeumyung-Ro, Yeongdeungpo-gu, Seoul, Korea | (82) 2 787 9100 | (82) 2 787 9191 |
| Daiwa Securities Co. Ltd., Beijing Representative Office | Room 301/302,Kerry Center,1 Guanghua Road,Chaoyang District, Beijing 100020, People's Republic of China | (86) 10 6500 6688 | (86) 10 6500 3594 |
| Daiwa (Shanghai) Corporate Strategic Advisory Co. Ltd. | 7th Floor, Hang Seng Bank Tower, 1000 Lujiazui Ring Road, Pudong, Shanghai, People's Republic of China | (86) 21 3858 2000 | (86) 21 3858 2111 |
| Daiwa Securities Co. Ltd., Bangkok Representative Office | 18 th Floor, M Thai Tower, All Seasons Place, 87 Wireless Road, Lumpini, Pathumwan, Bangkok 10330, Thailand | (66) 2 252 5650 | (66) 2 252 5665 |
| Daiwa Securities Co. Ltd., Hanoi Representative Office | Suite 1101, Tower 2, Capital Place Building, 29 Lieu Giai, Ba Dinh District, Hanoi, Vietnam | (84) 4 3946 0460 | (84) 4 3946 0461 |
| DAIWA INSTITUTE OF RESEARCH LTD | |||
| HEAD OFFICE | 15-6, Fuyuki, Koto-ku, Tokyo, 135-8460, Japan | (81) 3 5620 5100 | (81) 3 5620 5603 |
| MARUNOUCHI OFFICE | Gran Tokyo North Tower, 1-9-1, Marunouchi, Chiyoda-ku, Tokyo, 100-6756 | (81) 3 5555 7011 | (81) 3 5202 2021 |
| New York Research Center | 11th Floor, Financial Square, 32 Old Slip, NY, NY 10005-3504, U.S.A. | (1) 212 612 6100 | (1) 212 612 8417 |
| London Research Centre | 3/F, 5 King William Street, London, EC4N 7AX, United Kingdom | (44) 207 597 8000 | (44) 207 597 8550 |