PDF 原檔:報告_Citi_鴻勁7769_3Q26_20261028_original.pdf
圖片清單(已驗證 2026-10-29)
| 檔名 | size | 分類 | 親眼所見內容 |
|---|---|---|---|
報告_Citi_鴻勁7769_3Q26_20261028_001.png |
17.3KB | 真資料圖 | Price Performance 圖:7769.TW 股價走勢線(TWD 軸 1,000-8,000,橫軸 Dec/Mar/Jun/Sep),股價由約 2,000 升至約 8,000 高點後回落至約 5,000 出頭 |
報告_Citi_鴻勁7769_3Q26_20261028_002.png |
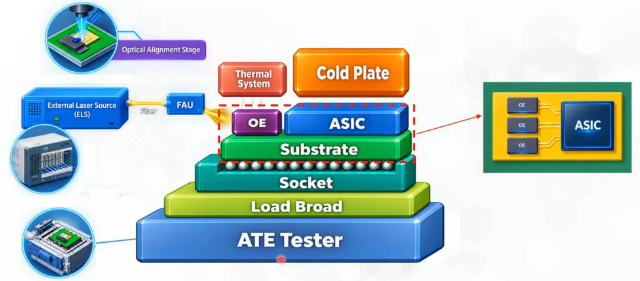
156.6KB | 真資料圖 | Figure 1「Hon - CPO INS4 OE solutions」CPO Insertion 4 OE 測試堆疊示意:由下而上為 ATE Tester、Load Board、Socket、Substrate,基板上並排 ASIC 與 OE(右側放大圖為 ASIC 周邊 3 顆 OE),上方 Thermal System 與 Cold Plate 壓在 OE/ASIC 上;左側 External Laser Source (ELS) 經 Fiber 連 FAU,上方 Optical Alignment Stage 對位 OE |
報告_Citi_鴻勁7769_3Q26_20261028_003.png |
59.5KB | 真資料圖 | Figure 4「Hon - Forward P/E band」:股價(藍)對 24.2x/30.8x/37.4x/44.0x 四條 P/E 帶,Nov-24 至 Oct-26,股價 2026 年中高點約 NT$8,000 後回落至約 NT$5,000 出頭 |
報告_Citi_鴻勁7769_3Q26_20261028_004.png |
68.5KB | 真資料圖 | Figure 5「Hon - Forward P/B band & ROE」:股價對 5.4x/8.0x/10.6x/13.2x/15.7x P/B 帶,並疊 ROE 折線(右軸 0-50%),Nov-24 至 Oct-26 |
報告_Citi_鴻勁7769_3Q26_20261028_005.png |
93.6KB | 真資料圖 | Bull/Bear 圖:Bull NT$13,000(上行 134%)、Base NT$10,000(上行 80%)、Bear NT$5,000(下行 10%),現價 NT$5,565(28 Oct 26),歷史股價線自 Oct 25 起、2026 年中高點約 NT$8,000+ |
報告_Citi_鴻勁7769_3Q26_20261028_006.png |
127.4KB | 真資料圖 | Citi 評等與目標價沿革(分析師 Nicholas Lai):上圖 Rating/TP 僅 1 個事件(28-May-26,評等 1、TP 11,000、收盤 7,700);下圖 Short-Term View/Catalyst Watch:28-May-26 Add CW(Upside,90 天,收盤 7,700)、26-Aug-26 Remove CW(收盤 6,335) |
原始內容
[讀者資訊已遮蔽] citi
28 Oct 2026 09:38:18 ET │ 14 pages
Hon Precision (7769.TW)
CPO and new mega tray design to drive stronger growth
CITI'S TAKE
Hon's 3Q26 net profit of NT$6,717m (+23% QoQ/+86% YoY) was better than our and Street (Bloomberg) expectation by 8-16% as revenues reached a quarterly record high of NT$16bn. GM/OPM of 57%/50% are largely in line with Street's estimates. During the analyst meeting today, we believe one of the major takeaways was management's positive comments on CPO INS4 development as Hon remains the only supplier to enter final verification stage (end-2026) with clients targeting early mass production in FY1Q27. Hon also showcased its comprehensive ATC products offerings. Its products roadmap has been extended to cover 12kW and even 25kW for next-generation high power chips. Looking ahead, aside from its +50% capacity expansion, we see more upside from content expansion on mega tray adoption and new opportunities in CPO. Reiterate Buy rating.
Progressing well in CPO INS4 OE - Its INS4 OE co-test handler is currently in data collection stage, and the company expects the final whole system verification (integrating ATE, handler/thermal handler to run target device at test program) would be completed by the end of this year with end customer targeting mass production from FY1Q27. Due to the tight ramping schedule, Hon has already secured the longlead time components in advance. Given more customized design, including two thermal systems required for main chip and OEs, mechanical parts for optical set-up and optical alignment instrument, we estimate these new products' pricing can reach around NT$30m, compared with its current model's ASP at NT$12-15m.
Mega tray to drive stronger content growth into next year - Given mega tray design, higher automation, AOI adoption and thermal requirement, The company expects its mega tray handler to carry +30% higher ASP vs. current model. We are also seeing accelerating adoption by customers as they have allocated 20-30% of 2027 order into this new design. Overall, together with CPO handler and upgrading trend for ATC specs, we expect mid-teens content value growth in 2027.
Maintain Buy with TP at NT$10,000 - We raise our 2026 earnings forecast by 7% to factor in better than expected 3Q results and keep our 2027/28 estimates largely unchanged. Given sector-wide multiple compression due to current uncertain macro outlook, we slightly revise down our target PER to 31x (from 35x) 2027/28E EPS. Our TP is at NT$10,000 (from NT$11,000), and we reiterate Buy on its secular growth outlook in AI chips testing and development in CPO business.
Earnings Summary
| Year to 31 Dec | Net Profit (NT$M) | Diluted EPS (NT$) | EPS growth (%) | P/E (x) | P/B (x) | ROE (%) | Yield (%) |
|---|---|---|---|---|---|---|---|
| 2024A | 5,286 | 32.63 | na | 170.6 | 66.2 | na | na |
| 2025A | 12,362 | 76.30 | 133.9 | 72.9 | 15.7 | 34.5 | 0.3 |
| 2026E | 23,799 | 132.28 | 73.4 | 42.1 | 14.2 | 37.0 | 0.6 |
| 2027E | 42,117 | 234.09 | 77.0 | 23.8 | 8.9 | 46.0 | 1.2 |
| 2028E | 71,555 | 397.71 | 69.9 | 14.0 | 5.4 | 48.2 | 2.1 |
Source: Powered by dataCentral
n Buy
Price (28 Oct 26 13:30) NT$5,565.00
Target price NT$10,000.00↓
from NT$11,000.00
Expected share price return
79.7%
Expected dividend yield
0.6%
Expected total return
80.3%
Market Cap NT$1,001,310M US$30,884M
Price Performance (RIC: 7769.TW, BB: 7769 TT)
Nicholas Lai AC
+886-2-8726-9093 nicholas.lai@citi.com
Laura (Chia Yi) Chen +886-2-8726-9090 laura.cy.chen@citi.com
Jack Chen
+886-2-8726-9091
jack1.chen@citi.com
Michael Hung
+886-2-8726-9092 michael.hung@citi.com
See Appendix A-1 for Analyst Certification, Important Disclosures and Research Analyst Affiliations.
[讀者資訊已遮蔽] [讀者資訊已遮蔽]
| Profit & Loss (NT$m) | 7769.TW: Fiscal year end 31-Dec - 2024 | 2025 | 2026E | 2027E | 2028E | Price: NT$5,565.00; TP: NT$10,000.00; Market Cap: NT$1,001,310m; - Valuation ratios | Recomm: Buy - 2024 | Recomm: Buy - 2025 | Recomm: Buy - 2026E | Recomm: Buy - 2027E | Recomm: Buy - 2028E |
|---|---|---|---|---|---|---|---|---|---|---|---|
| Sales revenue | 13,992 | 30,271 | 57,307 | 95,658 | 158,382 | PE (x) | na | 72.9 | 42.1 | 23.8 | 14.0 |
| Cost of sales | -6,293 | -13,157 | -24,540 | -38,082 | -61,043 | PB (x) | 66.2 | 15.7 | 14.2 | 8.9 | 5.4 |
| Gross profit | 7,700 | 17,114 | 32,766 | 57,577 | 97,339 | EV/EBITDA (x) | na | 64.3 | 32.7 | 17.7 | 9.8 |
| Gross Margin (%) | 55.0 | 56.5 | 57.2 | 60.2 | 61.5 | FCF yield (%) | 0.2 | 1.8 | 2.3 | 3.4 | 5.8 |
| EBITDA (Adj) | 6,330 | 15,107 | 28,779 | 51,799 | 88,772 | Dividend yield (%) | na | 0.3 | 0.6 | 1.2 | 2.1 |
| EBITDA Margin (Adj) (%) | 45.2 | 49.9 | 50.2 | 54.2 | 56.0 | Payout ratio (%) | 0 | 19 | 25 | 28 | 29 |
| Depreciation | -46 | -62 | -183 | -411 | -392 | ROE (%) | na | 34.5 | 37.0 | 46.0 | 48.2 |
| Amortisation | 0 | 0 | 0 | 0 | 0 | Cashflow (NT$m) | 2024 | 2025 | 2026E | 2027E | 2028E |
| EBIT (Adj) | 6,285 | 15,046 | 28,596 | 51,388 | 88,380 | EBITDA | 6,330 | 15,107 | 28,779 | 51,799 | 88,772 |
| EBIT Margin (Adj) (%) | 44.9 | 49.7 | 49.9 | 53.7 | 55.8 | Working capital | -5,641 | 3,900 | 501 | -6,741 | -11,936 |
| Net interest | 160 | 306 | 767 | 767 | 767 | Other | 1,618 | -2,652 | -4,765 | -9,239 | -16,793 |
| Associates | 0 | 0 | 0 | 0 | 0 | Operating cashflow | 2,308 | 16,356 | 24,515 | 35,819 | 60,043 |
| Non-Op/Except/Other Adj | 239 | 232 | 507 | 708 | 668 | Capex | -133 | -286 | -1,458 | -1,530 | -1,607 |
| Pre-tax profit | 6,683 | 15,584 | 29,871 | 52,863 | 89,815 | Net acq/disposals | -413 | -465 | 560 | 0 | 0 |
| Tax | -1,397 | -3,222 | -6,071 | -10,746 | -18,260 | Other | -777 | 0 | 0 | 0 | 0 |
| Extraord./Min.Int./Pref.div. | 0 | 0 | 0 | 0 | 0 | Investing cashflow | -1,322 | -751 | -898 | -1,530 | -1,607 |
| Reported net profit | 5,286 | 12,362 | 23,799 | 42,117 | 71,555 | Dividends paid | 0 | -2,586 | -6,047 | -11,641 | -20,601 |
| Net Margin (%) | 37.8 | 40.8 | 41.5 | 44.0 | 45.2 | Financing cashflow | -3,759 | 31,886 | -11,184 | 0 | 0 |
| Core NPAT | 5,286 | 12,362 | 23,799 | 42,117 | 71,555 | Net change in cash | -2,769 | 47,491 | 12,433 | 34,289 | 58,436 |
| Per share data | 2024 | 2025 | 2026E | 2027E | 2028E | Free cashflow to s/holders | 2,175 | 16,070 | 23,057 | 34,289 | 58,436 |
| Reported EPS ($) | 32.63 | 76.30 | 132.28 | 234.09 | 397.71 | ||||||
| Core EPS ($) | 32.63 | 76.30 | 132.28 | 234.09 | 397.71 | ||||||
| DPS ($) | 0 | 14.37 | 33.61 | 64.70 | 114.50 | ||||||
| CFPS ($) | 14.24 | 100.95 | 136.26 | 199.09 | 333.73 | ||||||
| FCFPS | 13.43 | 99.19 | 128.16 | 190.58 | 324.79 | ||||||
| ($) BVPS ($) | 84.10 | 355.39 | 391.84 | 625.93 | 1,023.64 | ||||||
| Wtd avg ord shares (m) | 161 | 162 | 180 | 180 | 180 | ||||||
| Wtd avg diluted shares (m) | 162 | 162 | 180 | 180 | 180 | ||||||
| Growth rates | 2024 | 2025 | 2026E | 2027E | 2028E | ||||||
| Sales revenue (%) | na | 116.3 | 89.3 | 66.9 | 65.6 | ||||||
| EBIT (Adj) (%) | na | 139.4 | 90.1 | 79.7 | 72.0 | ||||||
| Core NPAT (%) | na | 133.9 | 92.5 | 77.0 | 69.9 | ||||||
| Core EPS (%) | na | 133.9 | 73.4 | 77.0 | 69.9 | ||||||
| Balance Sheet (NT$m) | 2024 | 2025 | 2026E | 2027E | 2028E | ||||||
| Cash & cash equiv. | 6,025 | 53,427 | 66,447 | 100,704 | 159,108 | ||||||
| Accounts receivables | 2,913 | 2,935 | 8,081 | 13,370 | 22,680 | ||||||
| Inventory | 8,444 | 12,641 | 15,841 | 25,602 | 42,618 | ||||||
| Net fixed & other tangibles | 2,234 | 2,810 | 2,726 | 3,845 | 5,060 | ||||||
| Goodwill & intangibles | 29 | 91 | 127 | 127 | 127 | ||||||
| Financial & other assets | 2,221 | 1,366 | 4,638 | 10,221 | 20,049 | ||||||
| Total assets | 21,866 | 73,270 | 97,860 | 153,869 | 249,642 | ||||||
| Accounts payable | 3,181 | 3,402 | 5,319 | 8,837 | 14,969 | ||||||
| Short-term debt | 157 | 0 | 0 | 0 | 0 | ||||||
| Long-term debt | 0 | 0 | 0 | 0 | 0 | ||||||
| Provisions & other liab | 4,796 | 11,837 | 21,961 | 32,336 | 50,422 | ||||||
| Total liabilities | 8,134 | 15,239 | 27,280 | 41,173 | 65,391 | ||||||
| Shareholders' equity interests | 13,732 0 | 58,031 0 | 70,499 | 112,616 | 184,171 | ||||||
| Minority | 80 | 80 | 80 | ||||||||
| Total equity | 13,732 | 58,031 -53,427 | 70,579 | 112,696 | 184,251 | ||||||
| Net debt (Adj) | -5,868 | -66,447 | -100,704 | -159,108 | |||||||
| Net debt to equity (Adj) (%) | -42.7 | ||||||||||
| For definitions of the items in this | table, please click here. | -92.1 | -94.1 | -89.4 | -86.4 |
Figure 1. Hon - CPO INS4 OE solutions
© 2026 Citigroup Inc. No redistribution without Citigroup's written permission.
Source: Citi Research, Company Reports
Figure 2. Hon - 3Q26 Results Comparison
| (NT$mn) | 3Q26 Actual | 2Q26 Actual | Q/Q | 3Q25 Actual | 3Q26 Citi | Diff. | 3Q26 Cons | Diff. | |
|---|---|---|---|---|---|---|---|---|---|
| Revenue | 16,194 | 13,794 | 17% | 8,198 | 98% | 13,892 | 17% | 15,078 | 7% |
| Gross profit | 9,220 | 7,737 | 19% | 4,730 | 95% | 7,872 | 17% | 8,599 | 7% |
| Gross margin | 56.9% | 56.1% | +0.8 ppt | 57.7% | -0.8 ppt | 56.7% | +0.3ppt | 57.0% | -0.1ppt |
| Op. profit | 8,041 | 6,686 | 20% | 4,166 | 93% | 7,061 | 14% | 7,610 | 6% |
| OPmargin | 49.7% | 48.5% | +1.2ppt | 50.8% | -1.2 ppt | 50.8% | -1.2 ppt | 50.5% | -0.8ppt |
| Netincome | 6,717 | 5,476 | 23% | 3,617 | 86% | 5,809 | 16% | 6,201 | 8% |
| EPS (NT$) | 37.33 | 30.44 | 23% | 22.39 | 67% | 32.29 | 16% | 34.61 | 8% |
Source: Citi Research, Bloomberg
Figure 3. Hon - Estimates Revisions
| (NT$mn) | 2026E - New | 2026E - Old | 2026E - Chg. | 2027E - New | 2027E - Old | 2027E - Chg. | 2028E - New | 2028E - Old | 2028E - Chg. |
|---|---|---|---|---|---|---|---|---|---|
| Sales | 57,307 | 53,735 | 7% | 95,658 | 94,814 | 1% | 158,382 | 159,627 | -1% |
| YoY growth | 89% | 78% | 67% | 76% | 66% | 68% | |||
| Gross profit | 32,766 | 30,476 | 8% | 57,577 | 56,288 | 2% | 97,339 | 97,342 | 0% |
| Opex | -4,170-3,700 | 13%-6,189-5,439 | 14% | -8,959 | -7,881 | 14% | |||
| Operating profit | 28,596 | 26,777 | 7% | 51,388 | 50,849 | 1% | 88,380 | 89,461 | -1% |
| Pre-tax profit | 29,871 | 28,086 | 6% | 52,863 | 52,102 | 1% | 89,815 | 90,674 | -1% |
| Net income | 23,799 | 22,225 | 7% | 42,117 | 41,336 | 2% | 71,555 | 71,936 | -1% |
| EPS (NT$) | 132.28 | 123.54 | 7% | 234.09 | 229.77 | 2% | 397.71 | 399.86 | -1% |
| Gross margin | 57.2% | 56.7%+0.5 | ppt | 60.2% | 59.4%+0.8 | ppt | 61.5% | 61.0%+0.5 | ppt |
| Opex ratio | -7.3% | -6.9% | -0.4 ppt | -6.5% | -5.7% | -0.7 ppt | -5.7% | -4.9% | -0.7 ppt |
| Operating margin | 49.9% | 49.8% | +0.1 ppt | 53.7% | 53.6% | +0.1 ppt | 55.8% | 56.0% | -0.2 ppt |
| Net margin | 41.5% | 41.4%+0.2 | ppt | 44.0% | 43.6%+0.4 | ppt | 45.2% | 45.1% | +0.1 ppt |
Source: Citi Research [讀者資訊已遮蔽]
© 2025 Citigroup Inc. No redistribution without Citigroup's written permission. Source: Citi Research, company data
© 2025 Citigroup Inc. No redistribution without Citigroup's written permission. Source: Citi Research, company data
Figure 6. Hon - Forecast Summary
| (NT$inMn,year-endDec) | 2025 - 1Q | 2025 - 2Q | 2025 - 3Q | 2025 - 4Q | 2026 - 1Q | 2026 - 2Q | 2026 - 3Q | 2026 - 4QE | 1QE | 2QE | 3QE | 4QE | 2027 - 2025 | 2027 - 2026E | 2027 - 2027E | 2027 - 2028E |
|---|---|---|---|---|---|---|---|---|---|---|---|---|---|---|---|---|
| Revenue | 5,913 | 6,885 | 8,198 | 9,276 | 10,725 | 13,794 | 16,194 | 16,594 | 18,333 | 22,254 | 26,538 | 28,533 | 30,271 | 57,307 | 95,658 | 158,382 |
| COGS | -2,419 | -2,847 | -3,468 | -4,423 | -4,693 | -6,057 | -6,974 | -6,815 | -7,573 | -8,737 | -10,548 | -11,223 | -13,157 | -24,540 | -38,082 | -61,043 |
| Gross Profit | 3,494 | 4,037 | 4,730 | 4,852 | 6,032 | 7,737 | 9,220 | 9,778 | 10,760 | 13,517 | 15,990 | 17,310 | 17,114 | 32,766 | 57,577 | 97,339 |
| Operating Expense | -360 | -394 | -565 | -672 | -1,050 | -1,179 | -1,269 | -1,014 | -1,477 | -1,687 | -2,011 | -2,068 | -4,170 | -6,189 | -8,959 | |
| SG&A expenses | -218 | -185 | -276 | -398 | -315 | -451 | -567 | -630 | -446 | -623 | -796 | -940 | -1,077 | -1,962 | -2,805 | -3,848 |
| R&D expenses | -208 | -163 | -239 | -430 | -374 | -524 | -562 | 1 | -584 | -778 | -841 | -1,151 | -1,039 | -2,179 | -3,354 | -5,082 |
| EBIT | 3,133 | 3,643 | 4,166 | 4,104 | 5,360 | 6,686 | 8,041 | 8,509 | 9,747 | 12,040 | 14,303 | 15,299 | 15,046 | 28,596 | 51,388 | 88,380 |
| Pre-TaxProfit | 3,235 | 3,156 | 4,524 | 4,669 | 5,798 | 6,892 | 8,396 | 8,784 | 10,182 | 12,497 | 14,579 | 15,604 | 15,584 | 29,871 | 52,863 | 89,815 |
| Tax | -667 | -690 | -907 | -958 | -1,174 | -1,416 | -1,679 | -1,802 | -2,061 | -2,568 | -2,916 | -3,201 | -3,222 | -6,071 | -10,746 | -18,260 |
| Net Profit | 2,568 | 2,466 | 3,617 | 3,711 | 4,624 | 5,476 | 6,717 | 6,982 | 8,120 | 9,930 | 11,664 | 12,403 | 12,362 | 23,799 | 42,117 | 71,555 |
| EPS (NT$) | 15.89 | 15.26 | 22.39 | 22.73 | 25.70 | 30.44 | 37.33 | 38.81 | 45.13 | 55.19 | 64.83 | 68.94 | 76.30 | 132.28 | 234.09 | 397.71 |
| Margins (%) | ||||||||||||||||
| Gross Margin | 59.1% | 58.6% | 57% | 52.3% | 56.2% | 56.1% | 56.9% | 58.9% | 58.7% | 60.7% | 60.3% | 60.7% | 56.5% | 57.2% | 60.2% | 61.5% |
| Operating Margin | 53.0% | 52.9% | 50.8% | 44.2% | 50.0% | 48.5% | 49.7% | 51.3% | 53.2% | 54.1% | 53.9% | 53.6% | 49.7% | 49.9% | 53.7% | 55.8% |
| Net Margin | 43.4% | 35.8% | 44.1% | 40.0% | 43.1% | 39.7% | 41.5% | 42.1% | 44.3% | 44.6% | 44.0% | 43.5% | 40.8% | 41.5% | 44.0% | 45.2% |
| Sequential Growth (%) | ||||||||||||||||
| Revenue | 19% | 16% | 19% | 13% | 16% | 29% | 17% | 2% | 10% | 21% | 19% | %8 | 116% | %68 | 67% | 66% |
| Gross Profit | 30% | 16% | 17% | 3% | 24% | 28% | 19% | %9 | 10% | 26% | 18% | %8 | 122% | 91% | 76% | 69% |
| EBIT | 43% | 16% | 14% | -1% | 31% | 25% | 20% | 6% | 15% | 24% | 19% | % | 139% | 90% | 80% | 72% |
| Net Profit | 31% | -4% | 47% | 3% | 25% | 18% | 23% | 4% | 16% | 22% | 17% | 6% | 134% | %ε6 | 77% | %0% |
| EPS | 30% | -4% | 47% | 2% | 13% | 18% | 23% | 4% | 16% | 22% | 17% | 6% | 134% | 73% | 77% | 70% |
© 2025 Citigroup Inc. No redistribution without Citigroup's written permission.
Source: Citi Research, company data [讀者資訊已遮蔽]
Bull/Bear: Hon Precision (7769.TW)
Spread 144pp
■
Current Price and expected returns (upside/downside) as of 28 Oct 2026
BULL Assumptions
- New growth opportunity in new projects
- Faster-than-expected capacity ramp for its new facilities
- Faster-than-expected development in its CPO business
BASE Assumptions
- Solid 3-year sales CAGR of ~70%
- Strong 3-year earnings CAGR of >75%
BEAR Assumptions
- Unexpected share loss at its major Al projects
- Slower-than-expected capacity ramp for its new facilities
- Weaker-than-expected development in its CPO busines
[讀者資訊已遮蔽]
Hon Precision
Company description
Hon Precision is a leading Taiwanese manufacturer specializing in IC semiconductor automation equipment. Headquartered in Taichung City, Taiwan, it is most known globally for providing high-precision IC test handlers, temperature control solutions, and complete automated integrated solutions for major OSAT and IDM customers.
Investment strategy
We have a Buy rating on Hon Precision as we view it sitting in a structurally protected position at the heart of the AI/HPC back-end test cycle, with growth visibility extending well into the next few years - the company holds >90% share of the AI/HPC FT handler market and 60-70% of the ASIC SLT market. We forecast a solid strong sales revenue CAGR in 2025-28E with gross margin continuing to expand. In our view, the binding constraint on Hon Precision's near-term trajectory is now capacity, rather than demand - placing the company in the early phase of a multi-year structural growth and margin-expansion cycle.
Valuation
Our target price of NT$10,000 is based on a target PER multiple of 31x applied to the average of our 2027E/28E EPS estimates. Our PER target of 31x is set at 0.5-std above its 1-year PER average, justified by its high share of the AI/HPC testing handler market, which we estimate could support an earnings CAGR of >75% in 2025-28, higher than its 3-year CAGR at c40% in 2022-25. Our estimated >75% earning CAGR is also higher than the +40% average (Bloomberg consensus) of its global testing equipment peers. As its peers have been trading at average 35x PER on 2027/28 consensus EPS in the past 1 year, we believe Hon Precision deserves a further re-rating to our target PER.
Risks
Our quantitative risk rating system, which looks at historical share price volatility, rates Hon Precision High Risk. However, we are not assigning a High Risk rating as we forecast an earnings CAGR of >75%, significantly stronger than the growth outlook for its global peers. Also, we note its dominant position in AI/HPC handler market and expanding market TAM opportunity, which support our constructive view over its growth outlook.
Key downside risks that could impede the shares from reaching our target price: 1) Global AI demand slowdown driving weaker capacity build for semiconductor equipment; 2) unexpected share losses at its major AI projects; 3) slower-than-expected capacity ramp at its new facilities, or the company taking a long time to find/secure new sites; 4) slower-thanexpected development of its CPO business; 5) shorter-than-expected testing time leading to lower demand for its products; 6) weak adoption of high- [讀者資訊已遮蔽] premium cold plate products; and 7) increasing competition from new entrants.
If you are visually impaired and would like to speak to a Citi representative regarding the details of the graphics in this document, please call USA 1-888-500-5008 (TTY: 711), from outside the US +1-210-677-3788