PDF 原檔:報告_UBS_玉晶光3406_20260713_original.pdf
圖片清單(已驗證 2026-07-15)
| 檔名 | size | 分類 | 親眼所見內容 |
|---|---|---|---|
報告_UBS_玉晶光3406_20260713_001.png |
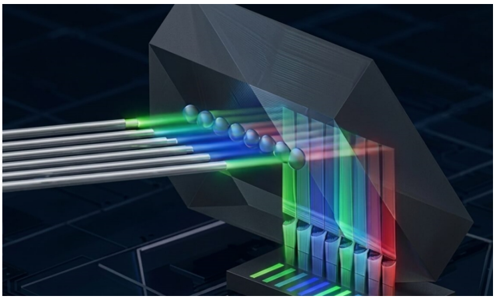
155KB | 真資料圖 | Figure 1:高精密度稜鏡示意圖,多根光纖束匯入稜鏡並折射出彩色光譜進入下方晶片 |
報告_UBS_玉晶光3406_20260713_002.png |
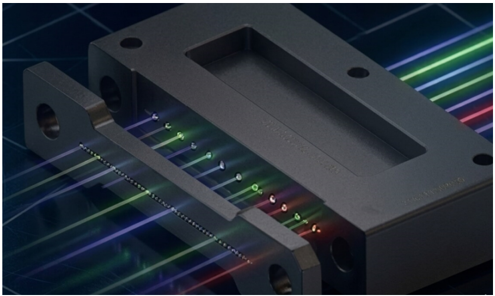
107KB | 真資料圖 | Figure 3:V-groove 樣品,金屬梳狀溝槽結構搭配綠色雷射光束 |
報告_UBS_玉晶光3406_20260713_003.png |
181KB | 真資料圖 | Figure 2:MT 插芯樣品,金屬塊體開孔搭配多色光纖對位標記 |
報告_UBS_玉晶光3406_20260713_004.png |
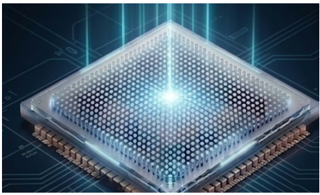
115KB | 真資料圖 | Figure 4:超穎透鏡(Meta-lens)開發示意,晶片表面呈金字塔狀奈米結構陣列並發出藍光 |
報告_UBS_玉晶光3406_20260713_005.png |
122KB | 真資料圖 | Figure 5:微透鏡陣列,藍色圓形透鏡規則排列特寫 |
報告_UBS_玉晶光3406_20260713_006.png |
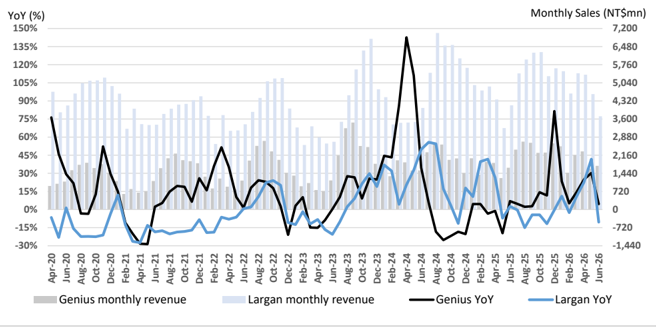
101KB | 真資料圖 | Figure 10:玉晶光與大立光月營收 YoY 成長率及營收金額走勢對比圖(2020/04–2026/06) |
報告_UBS_玉晶光3406_20260713_007.png |
56KB | 真資料圖 | Figure 11:玉晶光季營收依產品別(<8mp、8mp、10mp+、VR lens、Camera component)堆疊走勢圖 |
報告_UBS_玉晶光3406_20260713_008.png |
46KB | 真資料圖 | Figure 12:玉晶光 2010–2026E 營收/費用長條圖疊加毛利率/營益率折線圖 |
報告_UBS_玉晶光3406_20260713_009.png |
45KB | 真資料圖 | Figure 15:玉晶光營運現金流/資本支出長條圖疊加 FCF/股利每股折線圖(2010–2026E) |
報告_UBS_玉晶光3406_20260713_010.png |
33KB | 未驗證(<40KB) | 未逐張 Read,預設非資料圖 |
報告_UBS_玉晶光3406_20260713_011.png |
60KB | 真資料圖 | Figure 19:玉晶光股價與 P/B 倍數歷史走勢圖(2008–2026),標示平均 2x 與 ±1 標準差 |
報告_UBS_玉晶光3406_20260713_012.png |
43KB | 真資料圖 | Figure 20:玉晶光股價與遠期每股淨值(FWD BVPS)走勢對比圖 |
報告_UBS_玉晶光3406_20260713_013.png |
97KB | 真資料圖 | UBS 評等與目標價歷史圖(玉晶光,股價區間約 NT$320–800,2023/04–2026/07,含 Buy 評等區間標示) |
報告_UBS_玉晶光3406_20260713_014.png |
92KB | 真資料圖 | UBS 評等與目標價歷史圖(同業,股價區間約 NT$2,000–5,000,疑為大立光;揭露附錄評等歷史圖) |
分類只有三類:
真資料圖/裝飾·logo·banner/文字卡。<40KB 未 Read 者免列(預設 logo)。
原始內容
First Read
Genius Electronic Optical
Supplementing core lens with CPO components
Q226 smartphone lens strength lifts sales above seasonal despite slower VR
Genius' Q226 sales was above seasonal at NT$5.7bn, -8% QoQ, between UBSe/Street -3%/-12% QoQ, with smartphone lens resilient from a strong iPhone 17 cycle, although light of UBSe due to sharper decline in VR lens. Sales in Q226 grew 19% YoY, outpacing the +16% YoY growth from Largan as Genius gained share for periscope lens for premium models. We expect Q2 GM/OpM to stay resilient at 33.1%/17.4% with some upside on improving product mix with less lower-margin VR declining from ~10% of revenue to <5% in 2026, and forecast Q2 EPS of NT$7.90.
H226 lens demand tracking broadly in line with last year
We expect H226 builds flattish YoY, with smartphone demand from its largest customer tracking in-line with last year despite concerns over handset price hikes. Initial pull-ins started in June and will begin ramping from July, while foldable shipments in H226 could provide incremental support. We model Q326 up 4% YoY and 41% QoQ to NT$8bn and full year 2026-27 at +8%/11% YoY growth, reflecting continued spec upgrades, partially offset by a slowdown in VR demand while AR projects could drive growth in 2027-28. We keep GM/OpM improving YoY to 34%/20% as yield improvements and solid UT help price down components on existing models. Management noted raw materials stocked up in advance and see better pricing on new products to support margins. We see 2027 boosted by full-year foldable ramps, potential new lens spec noted on Largan's recent result and new product introduction for AR lens products to offset weaker volumes from high component costs lifting smartphone prices.
CPO component samples delivered to address a potential US$1bn TAM
Genius is now sampling three components for CPO, including: 1) high-precision prism to collimate light from the PIC into the fibers, 2) V-groove/key slot to precisely hold the fibers in place, and 3) MT ferrules (high density plastic connector bundling and aligning fibers. The company sent samples to its FAU partner at the end of May for customer evaluation. Similar to Largan, we see a wide range of outcomes on this market, with TAM potentially reaching US$960mn on our base case by 2028 at 100k switches x 64 FAUs per switch x US$150 ASP with an side downside range of US$600mn to US$3.8bn. We estimate base case for Genius could scale to NT$2.1bn revenue by 2028 if it can secure 10% share of its components.
Introducing SOTP to Reflect CPO optionality; maintain Buy and lift PT to NT$700
We revise our PT from NT$610 to NT$700 based on NT$600 base business + and NT $100 option for the CPO earnings. For core Genius, we lower 2026-27E EPS from NT $38/NT$42 to NT$37.4/NT$41.8 reflecting lower VR sales and valuation from NT$610 to NT$600 at same 2.2x 2027E PB and ROE of 15% (and also implying 14x 2027 P/E). We add NT$100 for CPO reflecting Genius' CPO base case for 10% share at NT$2.1bn sales, NT$430mn Op Profit and NT$2.8 EPS and 36x P/E in-line with optical peers.
| Highlights (NT$m) | 12/23 | 12/24 | 12/25 | 12/26E | 12/27E | 12/28E | 12/29E | 12/30E |
|---|---|---|---|---|---|---|---|---|
| Revenues | 21,675 | 23,187 | 24,989 | 26,918 | 29,765 | 32,628 | 35,001 | 37,578 |
| EBIT (UBS) | 4,131 | 4,671 | 4,773 | 5,458 | 6,031 | 6,595 | 7,089 | 7,624 |
| Net earnings (UBS) | 3,003 | 3,732 | 4,090 | 4,393 | 4,713 | 5,031 | 5,405 | 5,810 |
| EPS (UBS, diluted) (NT$) | 26.64 | 33.10 | 36.28 | 38.97 | 41.80 | 44.63 | 47.94 | 51.53 |
| DPS (net) (NT$) | 7.99 | 12.00 | 18.00 | 17.00 | 18.70 | 20.90 | 22.31 | 23.97 |
| Net (debt) / cash | 575 | 6,007 | 7,653 | 11,436 | 15,249 | 19,302 | 23,812 | 28,653 |
| Profitability/valuation | 12/23 | 12/24 | 12/25 | 12/26E | 12/27E | 12/28E | 12/29E | 12/30E |
| EBIT (UBS) margin% | 19.1 | 20.1 | 19.1 | 20.3 | 20.3 | 20.2 | 20.3 | 20.3 |
| ROIC (EBIT)% | 19.7 | 24.3 | 26.0 | 30.9 | 37.0 | 44.0 | 52.5 | 64.5 |
| EV/EBITDA (UBS core) x | 5.5 | 5.7 | 4.6 | 6.0 | 5.2 | 4.4 | 3.8 | 3.5 |
| P/E (UBS, diluted) x | 14.6 | 14.7 | 11.7 | 15.6 | 14.6 | 13.6 | 12.7 | 11.8 |
| Equity FCF (UBS) yield% | 11.5 | 17.1 | 12.0 | 8.3 | 8.6 | 9.3 | 10.2 | 11.0 |
| Dividend yield (net)% | 2.1 | 2.5 | 4.2 | 2.8 | 3.1 | 3.4 | 3.7 | 3.9 |
Source: Company accounts, LSEG Eikon, UBS estimates. Metrics marked as (UBS) have had analyst adjustments applied. Valuations: based on an average share price that year, (E): based on a share price of NT$ 609.00 on 13-Jul-2026
Equities
Taiwan
Electric Components & Equipment
| 12-month rating | 12-month rating | Buy |
|---|---|---|
| 12m price target | 12m price target | NT$700.00 Prior : NT$610.00 |
| Price (13 Jul 2026) | Price (13 Jul 2026) | NT$609.00 |
| RIC: | 3406.TW BBG: 3406 TT |
Trading data and key metrics
| 52-wk range | NT$774.00-396.00 |
|---|---|
| Market cap. | NT$68.7b/US$2.14b |
| Shares o/s | 113m (ORD) |
| Free float | 64% |
| Avg. daily volume ('000) | 3,228 |
| Avg. daily value (m) | NT$2,035.1 |
| Common s/h equity (12/26E) | NT$28.8b |
| P/BV (12/26E) | 2.4x |
| Net debt to EBITDA (12/26E) | NM |
| EPS (UBS, diluted) (NT$) | EPS (UBS, diluted) (NT$) | EPS (UBS, diluted) (NT$) | EPS (UBS, diluted) (NT$) | EPS (UBS, diluted) (NT$) |
|---|---|---|---|---|
| From | To | %ch | Cons. | |
| 12/26E | 39.57 | 38.97 | -2 | 36.21 |
| 12/27E | 42.00 | 41.80 | -0 | 39.09 |
| 12/28E | 44.69 | 44.63 | -0 | 43.67 |
Randy Abrams
Analyst randy.abrams@ubs.com +886-2-8722 7338
Diana Chang
Analyst diana.chang@ubs.com +886-2-8722 7335
Annie Chen
Associate Analyst annie.chen@ubs.com +886-2-8722 7281
Commentary
Optical signal path of the FAU (fiber array unit)
The optical receive path begins at the MT ferrule , a high-density plastic connector that bundles and precisely aligns multiple optical fibers carrying data signals from outside the module. The fibers extending from the MT ferrule are then secured with epoxy within the V-groove , a precision alignment structure designed to maintain accurate fiber positioning. As light exits the ends of the bare fibers in the V-groove, it naturally begins to diverge. To prevent signal degradation, the optical beams pass through a micro-lens array , a grid of miniature curved lenses that collimates the light, transforming the diverging beams into parallel rays. The resulting parallel optical beams then enter a 45degree prism , which redirects the light by 90 degrees downward to transmit into the silicon photonic chip. The transmit path would follow through in reverse.
Sampling progress on-track with potential for broader CPO penetration
According to our checks, Genius delivered samples of the prism, V-groove, and MT ferrule to FOCI (3363.TWO) at the end of May, while its development of a meta-lens remains at an earlier stage. Initial feedback on the sampled components has been ontrack with no major issues reported to date. However, meaningful progress is likely to take another one to two months, as the timeline depends on the FAU partner's assembly, integration, and validation process. In parallel, Genius is developing other glass-molded optical components and exploring opportunities to become a secondary supplier for an existing plastic optical component. The company also noted that it is currently engaged in discussions with three additional potential FAU customers while the timing and likelihood of qualification remain uncertain.
Figure 1: Genius doing high-precision prisms for the FAU with samples sent
Source: Genius
Figure 3: V-groove samples sent for qualification

Source: Genius
Figure 2: Genius penetrating the MT ferrule with samples sent
Source: Genius
Figure 4: Meta-lens in development
Source: Genius
Figure 5: Genius also working on the micro-lens array

Source: Genius
Sizing up the market opportunity and competitive landscape
Genius' opportunity would scale up based on # of FAUs per switch, # of CPO switches adopted, the range of components the company is able to provide, and its own market share relative to peers also looking to capture this market given the high premium investors are paying for emerging growth opportunity.
- FAUs to scale up with switch bandwidth. FAU count should rise as switch bandwidth increases as it requires more optical engines around the ASIC to transmit the required bandwidth out to other switches in the network. The initial switches on the market include Broadcom Tomahawk 5 Bailly 51.2T switch with 16 FAUs, NVIDIA Quantum X Q3450 115.2T switch with 72 FAUs, and NVIDIA Spectrum X 102.4T switch with 32-36 FAUs / 409.6T switch with 128-144 FAUs.
- CPO switch adoption. For adoption of switches, we view scenarios ranging from slow adoption in 2028-29 at 50k switches (vs. 90k NVL 72 racks already in 2027), base case at 100k switches and bull case at 200k switches. Switch adoption is sensitive to improvements in reliability and also alternatives that extend the length of copper within a data center (ALC cables), NPO (near packaged optics) or XPO options that expand capacity of switches without CPO.
- Pricing based on component integration and leadership. ASPs should scale based on integration toward a full FAU, precision, ability to offer a spec that can deliver higher density (multi-row) and accuracy for least loss, highest bandwidth and reliability. Based on market feedback, FAU ASPs can range from US$50-200.
Figure 6: FAUs scale up with switch bandwidth
| CPO Platform Example | Public optical engine data | FAU per switch | Comment |
|---|---|---|---|
| Broadcom TH5 / Bailly 51.2T | 8 × 6.4T OEs | 16 FAUs | Each optical engine requires 2 FAUs |
| NVIDIA Quantum - X Q3450 115.2T | 72 × 1.6T OEs | 72 FAUs | 4 ASICs, 6 detachable optical subassemblies per ASIC, 3 OEs per subassembly = 72 Oes and FAUs. |
| NVIDIA Spectrum - X SN6810 102.4T | 32 active × 3.2T OEs; 36 incl. redundancy | 32-36 FAUs | 36 OEs per 102.4T package, 32 active. |
| NVIDIA Spectrum - X SN6800 409.6T | 4 × 102.4T packages | 128-144 FAUs | 4 packages × 32 active and 36 total OEs. |
Source: UBS estimates
We estimate Genius' TAM in the bear case to be US$48mn at low product penetration and ASP if the market continues to push out CPO due to reliability concerns relative to pluggables and NPO/XPO options, US$672mn in a base case with 100k switches and 64 FAUs per switch at a total US$105 ASP of Genius-provided components, and US$3bn in a bull case with 200k switches and 96 FAUs per switch at US$160 ASP for Genius per FAU. Using the base case market and a scenario of 10% share, we estimate a sales opportunity of NT$2.1bn, Op profit of NT$430mn and NT$2.8 EPS. The company could still have a wide range of outcomes from limited success in a slow growth scenario (NT $0.1 EPS) to high share of an upside scenario yielding NT$19.4bn sales and NT$25.8 EPS where it would be more meaningful against the NT$42 earnings from the core business.
Figure 7: Genius base/upside/downside case for its opportunity and share
| Annual Scenario | CPO switch (k) | FAU/switch | FAU (mn) | Genius' components | ASP (US$) | TAM (US$mn) | Share | Sales (NT$mn) | Op Profit | EPS |
|---|---|---|---|---|---|---|---|---|---|---|
| Downside / Slow adoption | 50 | 32 | 1.6 | Micro-Lens Array | $20 | $32 | 5% | $51 | $10 | $0.07 |
| Downside / Slow adoption | 50 | 32 | 1.6 | V-groove | $7.5 | $12 | 5% | $19 | $4 | $0.03 |
| Downside / Slow adoption | 50 | 32 | 1.6 | MT Ferrule | $2.5 | $4 | 5% | $6 | $1 | $0.01 |
| Downside / Slow adoption | 50 | 32 | 1.6 | Meta-Lens / Others | $0 | $0 | 5% | $0 | $0 | $0.00 |
| Downside / Slow adoption | 50 | 32 | 1.6 | Total | $30 | $48 | 5% | $76 | $15 | $0.10 |
| Base | 100 | 64 | 6.4 | Micro-Lens Array | $60 | $384 | 10% | $1,213 | $246 | $1.61 |
| Base | 100 | 64 | 6.4 | V-groove | $20 | $128 | 10% | $404 | $82 | $0.54 |
| Base | 100 | 64 | 6.4 | MT Ferrule | $10 | $64 | 10% | $202 | $41 | $0.27 |
| Base | 100 | 64 | 6.4 | Meta-Lens / Others | $15 | $96 | 10% | $303 | $61 | $0.40 |
| Base | 100 | 64 | 6.4 | Total | $105 | $672 | 10% | $2,124 | $430 | $2.82 |
| Upside / Fast adoption | 200 | 96 | 19.2 | Micro-Lens Array | $100 | $1,920 | 20% | $12,134 | $2,459 | $16.14 |
| Upside / Fast adoption | 200 | 96 | 19.2 | V-groove | $25 | $480 | 20% | $3,034 | $615 | $4.03 |
| Upside / Fast adoption | 200 | 96 | 19.2 | MT Ferrule | $15 | $288 | 20% | $1,820 | $369 | $2.42 |
| Upside / Fast adoption | 200 | 96 | 19.2 | Meta-Lens / Others | $20 | $384 | 20% | $2,427 | $492 | $3.23 |
| Upside / Fast adoption | 200 | 96 | 19.2 | Total | $160 | $3,072 | 20% | $19,415 | $3,934 | $25.82 |
Source: UBS estimates
While we remain optimistic about the long-term FAU market opportunity and Genius' progress in developing key CPO components, it should be noted that the company is entering a highly competitive landscape with several established optical and fiberinterconnect suppliers already possessing qualified manufacturing capabilities and customer relationships. Largan disclosed during its 2Q call (link) that it has secured a mass-production order for its fiber array (FA) while its subsidiary AOET manufactures the corresponding V-groove. Given Largan's involvement in the FA, AOET may benefit from an integrated solution offering and a stronger position within the optical assembly value chain. Meanwhile, players in the prism and micro-lens array segments include Himax, AGC, Focuslight, and other glass-moulding / micro-optics vendors with Largan's PMLA also in development. The MT ferrule market is similarly served by established players such as US Conec, SENKO, Sumitomo, Corning, and participants within the Foxconn/ Fabrinet ecosystem. While this backdrop may limit near-term visibility, we believe there are opportunities for Genius to gain share as a secondary source if demand scales faster than expected or if incumbent suppliers encounter capacity or yield constraints.
Regarding market discussions around Corning's glass bridge potentially replacing the FAU, we view the impact as limited as the glass bridge is likely to complement certain applications rather than serve as a full substitute. The glass bridge is designed for edgecoupling (EC) architectures and therefore would not directly replace grating-coupling (GC) solutions, which is expected to remain the dominant coupling approach over the next several years. In addition, the technology remains at an early stage of development with fiber arrays still likely to be required in EC-based designs, albeit with lower precision requirements than those used in current GC-based architectures.
Core lens business intact with margins upside
With CPO revenue contribution <5% in 2026 per management guidance, Genius' lens business should remain its primary earnings anchor in recent years. 1H saw strong iPhone 17s supporting topline beat vs street benefited by share gains in periscope lens, and while we view this cycle slightly fading as iPhone sell-through units YTD YoY slowed from +9.5% in April to 8% in May, the company still views handset lens demand healthy amidst concerns of surging component prices impacting consumer electronics. With foldables shipping in 2H, 3Q shipment orders are broadly in line with historical patterns but should be watchful on near-term demand trends as customers tend to adjust orders quickly in response to new product sell-through. VR contribution has declined from 510% in 2025 to <5% in 2026 on demand slowdown, partially offsetting strength in phone lens while the mix shift would enhance Genius' overall margin profile. On the other hand, AR is seeing traction supported by ongoing Ray-Ban shipments with nextgen products in development.
Figure 8: UBS vs. VA Consensus Q126A-Q326E and 2025A-27E
| Q126 | Q226E | Q226E | Q226E | Q326E | Q326E | Q326E | 2025 | 2026E | 2026E | 2026E | 2027E | 2027E | 2027E | |
|---|---|---|---|---|---|---|---|---|---|---|---|---|---|---|
| (NT$m) | Actual | UBSe | UBSe prior | VA | UBSe | UBSe prior | VA | Actual | UBSe | UBSe prior | VA | UBSe | UBSe prior | VA |
| Revenue | 6,141 | 5,683 | 5,963 | 6,002 | 8,011 | 8,044 | 7,907 | 24,989 | 26,918 | 27,338 | 27,865 | 29,765 | 29,778 | 30,380 |
| - QoQ / YoY | -14.1% | -7.5% | -2.9% | -2.3% | 41.0% | 34.9% | 31.7% | 7.8% | 7.7% | 9.4% | 11.5% | 10.6% | 8.9% | 9.0% |
| Gross profit | 2,061 | 1,881 | 1,956 | 1,973 | 2,752 | 2,767 | 2,702 | 8,125 | 9,098 | 9,198 | 9,352 | 9,932 | 9,925 | 9,854 |
| - Gross margin | 33.6% | 33.1% | 32.8% | 32.9% | 34.4% | 34.4% | 34.2% | 32.5% | 33.8% | 33.6% | 33.6% | 33.4% | 33.3% | 32.4% |
| Operating profit | 1,201 | 989 | 1,020 | 1,088 | 1,791 | 1,842 | 1,703 | 4,773 | 5,458 | 5,549 | 5,562 | 6,031 | 6,064 | 5,894 |
| - OP margin | 19.6% | 17.4% | 17.1% | 18.1% | 22.4% | 22.9% | 21.5% | 19.1% | 20.3% | 20.3% | 20.0% | 20.3% | 20.4% | 19.4% |
| Non-op profit | 39 | 85 | 85 | 97 | 85 | 85 | 91 | 217 | 292 | 292 | 321 | 338 | 338 | 405 |
| Pre-tax profit | 1,239 | 1,073 | 1,104 | 1,185 | 1,875 | 1,926 | 1,794 | 4,990 | 5,751 | 5,841 | 5,883 | 6,369 | 6,403 | 6,299 |
| Tax | -348 | -268 | -276 | -284 | -527 | -539 | -461 | -1,282 | -1,534 | -1,556 | -1,491 | -1,656 | -1,667 | -1,546 |
| - Tax rate | 28% | 25% | 25% | 24% | 28% | 28% | 26% | 26% | 27% | 27% | 25% | 26% | 26% | 25% |
| Net profit | 891 | 805 | 828 | 284 | 1,348 | 1,387 | 461 | 3,702 | 4,216 | 4,285 | 1,491 | 4,713 | 4,735 | 1,546 |
| EPS (NT$) | 7.90 | 7.14 | 7.35 | 7.98 | 11.96 | 12.30 | 11.81 | 32.84 | 37.40 | 38.00 | 38.92 | 41.80 | 42.00 | 42.12 |
Source: Company data, UBSe, Visible Alpha. Note: EPS shown in this table is basic EPS (reported EPS), which is different from the front-page recurring EPS due to a different calculation and methodology.
Figure 9: Genius core business and units trends
| Segment Totals (NT$mn) | Q126 | Q226E | Q326E | Q426E | Q127E | Q227E | Q327E | Q427E | 2024 | 2025 | 2026E | 2027E |
|---|---|---|---|---|---|---|---|---|---|---|---|---|
| 8mp and below lens shipment (mn units) | 43 | 43 | 55 | 47 | 47 | 44 | 65 | 60 | 162 | 156 | 187 | 215 |
| 8mp and below lens ASP (US$) | $0.5 | $0.5 | $0.5 | $0.5 | $0.6 | $0.5 | $0.5 | $0.5 | $0.6 | $0.6 | $0.5 | $0.5 |
| 8mp and below lens revenue (NT$mn) | $696 | $707 | $955 | $763 | $827 | $722 | $1,123 | $971 | $2,899 | $2,658 | $3,122 | $3,643 |
| YoY (%) | 18% | 66% | 5% | 4% | 19% | 2% | 18% | 27% | 2% | -8% | 17% | 17% |
| QoQ (%) | -5% | 1% | 35% | -20% | 8% | -13% | 56% | -14% | ||||
| 10mp and above lens shipment (mn units) | 82 | 74 | 106 | 91 | 80 | 78 | 120 | 111 | 216 | 323 | 353 | 389 |
| 10mp and above lens ASP (US$) | $1.3 | $1.3 | $1.4 | $1.4 | $1.3 | $1.2 | $1.4 | $1.4 | $1.3 | $1.3 | $1.4 | $1.4 |
| 10mp and above lens revenue (NT$mn) | $3,376 | $2,919 | $4,744 | $4,023 | $3,270 | $3,045 | $5,405 | $4,903 | $8,726 | $12,665 | $15,062 | $16,623 |
| YoY (%) | 46% | 62% | 5% | 0% | -3% | 4% | 14% | 22% | 0% | 45% | 19% | 10% |
| QoQ (%) | -16% | -14% | 63% | -15% | -19% | -7% | 78% | -9% | ||||
| VR/Glasses lens revenue (NT$mn) | $592 | $471 | $487 | $383 | $424 | $376 | $427 | $376 | $3,519 | $3,240 | $1,933 | $1,603 |
| YoY (%) | -27% | -37% | -41% | -55% | -28% | -20% | -12% | -2% | 3% | -8% | -40% | -17% |
| QoQ (%) | -30% | -20% | 3% | -21% | 11% | -11% | 14% | -12% | ||||
| Other lens revenue (NT$mn) | $1,476 | $1,586 | $1,824 | $1,916 | $1,724 | $1,724 | $2,069 | $2,379 | $8,043 | $6,425 | $6,802 | $7,896 |
| YoY (%) | -8% | -12% | 23% | 23% | 17% | 9% | 13% | 24% | 20% | -20% | 6% | 16% |
| QoQ (%) | -5% | 7% | 15% | 5% | -10% | 0% | 20% | 15% | ||||
| Total Revenue (NT$mn) | $6,141 | $5,683 | $8,011 | $7,084 | $6,246 | $5,867 | $9,024 | $8,629 | $23,187 | $24,989 | $26,918 | $29,765 |
| YoY (%) | 15% | 19% | 4% | -1% | 2% | 3% | 13% | 22% | 7% | 8% | 8% | 11% |
| QoQ (%) | -14% | -7% | 41% | -12% | -12% | -6% | 54% | -4% | ||||
| Sales %by Product | Q126 | Q226E | Q326E | Q426E | Q127E | Q227E | Q327E | Q427E | 2024 | 2025 | 2026E | 2027E |
| 8mp and below lens | 11% | 12% | 12% | 11% | 13% | 12% | 12% | 11% | 13% | 11% | 12% | 12% |
| 10mp and above lens | 55% | 51% | 59% | 57% | 52% | 52% | 60% | 57% | 38% | 51% | 56% | 56% |
| VR/Glasses lens | 10% | 8% | 6% | 5% | 7% | 6% | 5% | 4% | 15% | 13% | 7% | 5% |
| Other lens | 24% | 28% | 23% | 27% | 28% | 29% | 23% | 28% | 35% | 26% | 25% | 27% |
| Total | 100% | 100% | 100% | 100% | 100% | 100% | 100% | 100% | 100% | 100% | 100% | 100% |
Source: Company data, UBSe
Figure 10: Genius and Largan monthly sales trending broadly in line YTD
Source: Company data, UBSe
Figure 11: 10MP+ cameras driving the business
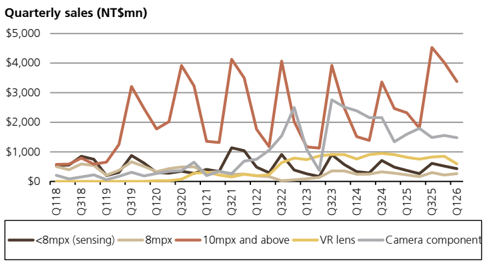
Source: Company data, UBSe
Figure 12: Genius margins stabilizing
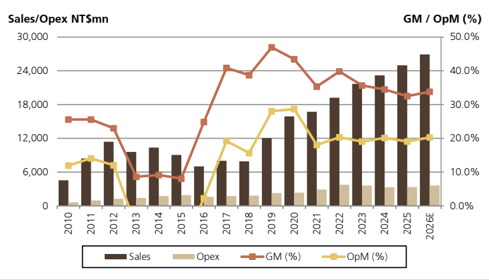
Source: Company data, UBSe
Figure 13: UBS P&L summary table for Genius
| Ticker Shares outstanding (mn) | Ticker Shares outstanding (mn) | 3406.TW 112.7 | Current Price (NT$) Mkt cap (NT$ mn) | Current Price (NT$) Mkt cap (NT$ mn) | Current Price (NT$) Mkt cap (NT$ mn) | $609 $68,660 |
|---|---|---|---|---|---|---|
| Year | 2025 | 2026E | 2027E | 2028E | 2029E | 2030E |
| Revenues (NT$ mn) | $24,989 | $26,918 | $29,765 | $32,628 | $35,001 | $37,578 |
| YoY Growth (%) | 7.7% | 10.6% | 9.6% | 7.3% | 7.4% | |
| Gross profit (NT$mn) | $8,125 | $9,098 | $9,932 | $10,864 | $11,669 | $12,541 |
| GM (%) | 32.5% | 33.8% | 33.4% | 33.3% | 33.3% | 33.4% |
| Operating profit (NT$mn) | $4,773 | $5,458 | $6,031 | $6,595 | $7,089 | $7,624 |
| OPM (%) | 19.1% | 20.3% | 20.3% | 20.2% | 20.3% | 20.3% |
| Net profit (NT$ mn) | $3,702 | $4,216 | $4,713 | $5,031 | $5,405 | $5,810 |
| EPS (NT$) | $32.84 | $37.40 | $41.80 | $44.63 | $47.94 | $51.53 |
| EPS growth (%) | 14% | 12% | 7% | 7% | 7% | |
| P/E (x) | 18.5 | 16.3 | 14.6 | 13.6 | 12.7 | 11.8 |
| Dividend yield (%) | 3.0% | 2.8% | 3.1% | 3.4% | 3.7% | 3.9% |
| P/B (x) | 2.6 | 2.4 | 2.2 | 2.0 | 1.9 | 1.7 |
| ROE (%) | 14% | 15% | 15% | 15% | 15% | 15% |
| Quarters | Q325 | Q425 | Q126 | Q226E | Q326E | Q426E |
|---|---|---|---|---|---|---|
| Revenues (NT$ mn) | $7,740 | $7,152 | $6,141 | $5,683 | $8,011 | $7,084 |
| QoQ Growth (%) | -7.6% | -14.1% | -7.5% | 41.0% | -11.6% | |
| Gross profit (NT$mn) | $2,641 | $2,449 | $2,061 | $1,881 | $2,752 | $2,404 |
| GM (%) | 34.1% | 34.3% | 33.6% | 33.1% | 34.4% | 33.9% |
| Operating profit (NT$mn) | $1,814 | $1,466 | $1,201 | $989 | $1,791 | $1,478 |
| OPM (%) | 23.4% | 20.5% | 19.6% | 17.4% | 22.4% | 20.9% |
| Net profit (NT$ mn) | $1,414 | $1,176 | $891 | $805 | $1,348 | $1,172 |
| EPS (NT$) | $12.54 | $10.43 | $7.90 | $7.14 | $11.96 | $10.40 |
Source: Company data, UBSe
Figure 14: UBS cash flow summary
| Annual (NT$mn) | 2021 | 2022 | 2023 | 2024 | 2025 | 2026E | 2027E | 21-25 Avg |
|---|---|---|---|---|---|---|---|---|
| Revenue | $16,736 | $19,215 | $21,675 | $23,187 | $24,989 | $26,918 | $29,765 | $21,160 |
| Capital spending | $3,414 | $5,674 | $3,599 | $1,390 | $1,602 | $2,503 | $2,679 | $3,136 |
| Capex/revenue (%) | 20% | 30% | 17% | 6% | 6% | 9% | 9% | 16% |
| Dep and amort | $2,639 | $3,252 | $3,779 | $4,187 | $4,009 | $4,307 | $4,465 | $3,573 |
| Depr/revenue (%) | 16% | 17% | 17% | 18% | 16% | 16% | 15% | 17% |
| Operating cash flow | $3,973 | $7,038 | $8,575 | $10,649 | $7,312 | $8,203 | $8,600 | $7,509 |
| Free cash flow | $559 | $1,364 | $4,976 | $9,259 | $5,709 | $5,700 | $5,921 | $4,373 |
| FCF and Dividends | 2021 | 2022 | 2023 | 2024 | 2025 | 2026E | 2027E | 21-25 Avg |
| FCF / share (NT$) | $5 | $12 | $44 | $82 | $51 | $51 | $53 | $39 |
| FCF / EV Yield (%) | 1% | 2% | 8% | 16% | 10% | 10% | 10% | 7% |
| FCF Yield (%) | 1% | 2% | 7% | 13% | 8% | 8% | 9% | 6% |
| Dividend/share (NT$) | $10.10 | $8.06 | $12.00 | $12.00 | $18.00 | $17.00 | $18.70 | $12.03 |
| Payout rate (%) | 43% | 36% | 49% | 28% | 44% | 47% | 52% | 40% |
| Dividend amount (NT$) | $1,131 | $908 | $1,353 | $1,353 | $2,029 | $1,917 | $2,108 | $1,355 |
| Pre-Dividend close (NT$) | $733 | $550 | $343 | $396 | $656 | $612 | $612 | |
| Dividend Yield (%) | 1.4% | 1.5% | 3.5% | 3.0% | 2.7% | 2.8% | 3.1% | 2.4% |
Source: Company data, UBSe
Figure 15: Genius generating positive FCF
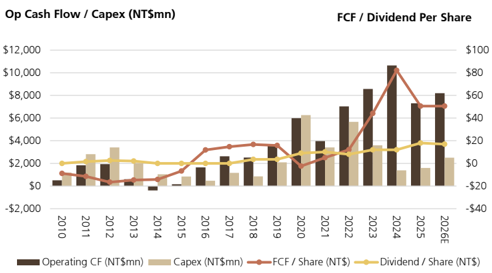
Source: Company data, UBSe
Figure 16: Net cash built up the past two years
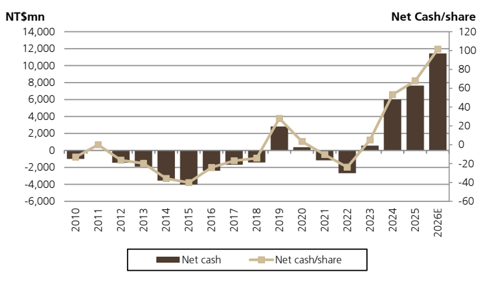
Source: Company data, UBSe
Reiterate Buy and raise PT to NT$700 valuing in CPO optionality
We revise our PT from NT$610 to NT$700 based on NT$600 base business + and NT $100 option for the CPO earnings. For core Genius, we lower 2026-27E EPS from NT $38/NT$42 to NT$37.4/NT$41.8 reflecting lower VR sales and valuation from NT$610 to NT$600 at same 2.2x 2027E PB and ROE of 15% (and also implying 14x 2027 P/E). We add NT$100 for CPO reflecting Genius' CPO base case for 10% share at NT$2.1bn sales, NT$430mn Op Profit and NT$2.8 EPS and 36x P/E in-line with optical peers.
Figure 17: UBS Base, Upside, and Downside Spectrum for Genius using SOTP valuation
| New UBS | New UBS | Prior UBS | Prior UBS | Upside Case | Upside Case | Downside Case | Downside Case | ||
|---|---|---|---|---|---|---|---|---|---|
| 2025 | 2026 | 2027 | 2026 | 2027 | 2026 | 2027 | 2026 | 2027 | |
| Sales YoY Growth Gross Profit | $24,989 7.8% $8,125 | $26,918 7.7% | $29,765 10.6% | $27,338 9.4% $9,198 | $29,778 8.9% | $27,457 9.9% | $30,956 12.7% $10,700 | $26,111 4.5% $8,668 | $28,277 8.3% $9,152 |
| $9,098 | $9,932 | $9,925 | $9,445 | ||||||
| GM% | 32.5% | 33.8% | 33.4% | 33.6% | 33.3% | 34.4% | 34.6% | 33.2% | 32.4% |
| Opex Op Profit | $3,352 | $3,640 | $3,901 $6,031 | $3,649 $5,549 | $3,860 $6,064 | $3,676 5,769 | $3,979 6,721 | $3,580 5,089 | $3,794 5,359 |
| $4,773 | $5,458 | 21.0% | 21.7% | 19.0% | |||||
| OpM% Non-Op | 19.1% $217 $4,990 | 20.3% $292 $5,751 | 20.3% $338 $6,369 | 20.3% $292 | 20.4% $338 | $292 $6,061 | $338 $7,060 | 19.5% $292 | $338 26% |
| Pretax Tax Rate Tax | 26% ($1,282) $3,702 | 27% ($1,534) | 26% $4,713 41.8 113 | $5,841 27% $4,285 38.0 | $6,403 26% | 27% ($1,617) | 26% ($1,836) | $5,381 27% | $5,697 ($1,482) $4,215 |
| 0 | $4,216 | 113 | 12 | ||||||
| ($1,435) | |||||||||
| Net income | ($1,656) | ($1,556) | ($1,667) $4,735 | $4,444 | $5,224 | $3,945 | |||
| EPS | 32.8 | 37.4 | 42.0 | 39.4 | 46.3 | 35.0 | 37.4 | ||
| Shares | 113 | 113 | 113 | 113 | |||||
| EPS vs. base case | 113 | 113 | 113 | ||||||
| -10.6% | |||||||||
| 5.4% | 10.8% | -6.4% | |||||||
| Current Price P/E P/B | 2.2 235 $506 | $609 | 14 2.2 | 14 2.2 279 | 14 2.3 283 $650 | 1.6 274 | |||
| BV/Share Implied Share | 278 | $610 | |||||||
| Upside/Downside | -17% | $600 | $430 | ||||||
| Price | |||||||||
| -1% | 7% | ||||||||
| -29% | |||||||||
| $2.8 | $9.6 | $1.9 | |||||||
| CPO Expected Value EPS EPS vs. base case P/E | 36 | 239.3% 36 $340 | -32.1% 34 $65 | ||||||
| Implied Valuation | $100 | ||||||||
| Total Genius | $495 | ||||||||
| $700 | $990 | ||||||||
| Implied Share Price Upside/Downside | |||||||||
| 15% | 63% | -19% |
Source: UBS estimates
Figure 18: FAU / optical peers trading at an average 36x 2027E P/E
| Company name | Ticker | Market Cap | Share Price | EPS (LC$) | EPS (LC$) | P/E (x) | P/E (x) | P/BV (x) | P/BV (x) | ROE (%) | ROE (%) |
|---|---|---|---|---|---|---|---|---|---|---|---|
| (US$m) | (LC$) | 2026E | 2027E | 2026E | 2027E | 2026E | 2027E | 2026E | 2027E | ||
| Lens | |||||||||||
| Genius Electronic Optical | 3406.TW | 2,604 | 728 | 38.00 | 42.00 | 16.0 | 14.5 | 2.4 | 2.2 | 16.1 | 15.7 |
| Largan Precision | 3008.TW | 18,413 | 4,420 | 195.00 | 220.00 | 22.7 | 20.1 | 2.9 | 2.7 | 12.6 | 13.8 |
| Optical supply chain players | |||||||||||
| FOCI Fiber Optic Communications Inc | 3363.TWO | 2,128 | 601 | 0.73 | 16.76 | 825.9 | 35.9 | 26.0 | 15.9 | 3.2 | 56.1 |
| Ezconn Corp | 6442.TW | 3,386 | 1,375 | 51.42 | 130.00 | 26.7 | 10.6 | 13.8 | 6.8 | 45.2 | 63.9 |
| Browave Corp | 3163.TWO | 1,882 | 750 | 7.57 | 18.27 | 99.1 | 41.1 | 18.0 | 12.7 | 19.1 | 35.4 |
| VisEra Technologies Co Ltd | 6789.TW | 5,305 | 535 | 6.50 | 7.82 | 82.3 | 68.4 | 9.2 | 8.8 | 11.0 | 13.6 |
| LandMark Optoelectronics Corp | 3081.TWO | 5,735 | 1,990 | 19.25 | 40.17 | 103.4 | 49.5 | 34.7 | 22.2 | 32.8 | 45.8 |
| Visual Photonics Epitaxy Co Ltd | 2455.TW | 1,895 | 329 | 5.36 | 8.90 | 61.4 | 37.0 | 16.6 | 13.6 | 26.3 | 38.8 |
| Corning Inc | GLW.N | 164,287 | 191 | 3.19 | 4.22 | 59.9 | 45.2 | 12.3 | 11.0 | 21.3 | 25.4 |
| Coherent Corp | COHR.N | 63,485 | 325 | 5.46 | 8.31 | 59.4 | 39.1 | 6.1 | 5.5 | 10.8 | 13.7 |
| Lumentum Holdings Inc | LITE.OQ | 62,396 | 802 | 8.11 | 17.91 | 98.9 | 44.8 | 25.6 | 15.2 | 33.9 | 53.4 |
| Marvell Technology Inc | MRVL.OQ | 206,514 | 236 | 2.83 | 4.06 | 83.4 | 58.1 | 14.1 | 11.7 | 17.3 | 17.0 |
| MACOM Technology Solutions Holdings Inc | MTSI.OQ | 23,539 | 309 | 5.03 | 6.85 | 61.4 | 45.1 | 14.5 | 11.3 | 23.6 | 26.6 |
| Fabrinet | FN.N | 16,880 | 471 | 13.78 | 17.10 | 34.2 | 27.6 | 7.1 | 5.9 | 21.8 | 22.5 |
| Senko Group Holdings Co Ltd | 9069.T | 2,286 | 2,104 | 118.42 | 140.51 | 17.8 | 15.0 | 1.6 | 1.5 | 9.2 | 10.1 |
| Sumitomo Corp | 8053.T | 45,989 | 1,556 | 119.58 | 135.26 | 13.0 | 11.5 | 1.6 | 1.5 | 12.2 | 13.2 |
| AGC Inc | 5201.T | 8,524 | 6,339 | 401.34 | 476.83 | 15.8 | 13.3 | 0.9 | 0.8 | 5.7 | 6.6 |
| Suzhou TFC Optical Communication Co Ltd | 300394.SZ | 41,741 | 259 | 3.33 | 5.48 | 77.9 | 47.3 | 33.1 | 21.8 | 46.5 | 49.1 |
| Average | 100.7 | 35.9 | 14.0 | 9.9 | 20.7 | 29.6 |
Source: UBS estimates, Eikon
Figure 19: Genius trading at 2.3x P/B, in-line with its historical average
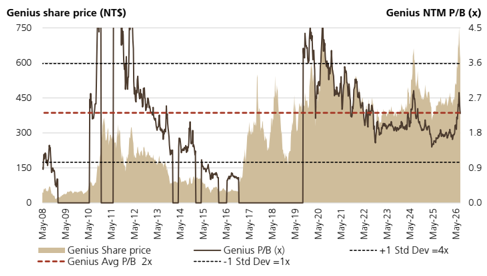
Source: Eikon
Figure 20: Stock price running slightly ahead of its fwd BVPS
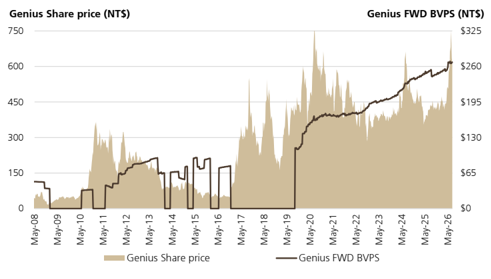
Source: Eikon
Forecast returns
| Forecast price appreciation | 14.9% |
|---|---|
| Forecast dividend yield | 2.8% |
| Forecast stock return | 17.7% |
| Market return assumption | 6.3% |
| Forecast excess return | 11.5% |
Company Description
Founded in 1989, Genius Electronic Optical (GSEO) is a leading global manufacturer of camera lenses, providing full service optical solutions, including mobile lenses, automotive lenses and AR/VR optics. Its production sites are in Taichung (one plant) and Xiamen (two plants). The Taichung plant mainly manufactures VR lenses, while the Xiamen plants produce compact lenses for consumer electronics. Optical lens products accounted for 73% of 2023 total revenue, and others include TOF lenses, flash lenses, VR lenses and LED lighting products. Its major client is Apple and it supplies lenses for iPhones and iPads.
UBS EPS and Consensus EPS
The UBS EPS is an adjusted diluted EPS metric. It is calculated using the UBS analyst's interpretation of earnings suitable for valuation purposes divided by the diluted number of shares. This may differ to the way the consensus EPS metric has been calculated.
Valuation Method and Risk Statement
Our price target is based on PE multiple.
Genius' growth is highly leveraged to the overall handset industry and could be affected by volatility in handset demand, as well as whether handset OEMs will continue upgrading their camera design. Genius' margins could be affected by increasing competition and the rise of new technologies, ASP pressure from customers and fluctuating material and labour costs.
Downside risks include competitors catching up in technology, yield rate issues for new products and uncertain iPhone demand.
Quantitative Research Review
UBS Global Research publishes a quantitative assessment of its analysts' responses to certain questions about the likelihood of an occurrence of a number of short term factors in a product known as the 'Quantitative Research Review'. The views for this month can be found below. Views contained in this assessment on a particular stock reflect only the views on those short term factors which are a different timeframe to the 12-month timeframe reflected in any equity rating set out in this note. For previous responses please make reference to (i) previous UBS Global Research reports; and (ii) where no applicable research report was published that month, the Quantitative Research Review which can be found at https://neo.ubs.com/quantitative, or contact your UBS sales representative for access to the report or the Quantitative Research Team on ubs-quant-answers@ubs.com. A consolidated report which contains all responses is also available and again you should contact your UBS sales representative for details and pricing or the Quantitative Research Team on the email above.
Genius Electronic Optical
| Question | Response |
|---|---|
| 1. Is the industry structure facing the firm likely to improve or deteriorate over the next six months? Rate on a scale of 1-5 (1 = getting worse, 3 = no change, 5 = getting better, N/A = no view) | 3 |
| 2. Is the regulatory/government environment facing the firm likely to improve or deteriorate over the next six months? Rate on a scale of 1-5 (1 = getting tougher 3 = no change, 5 = getting better, N/A = no view) | 3 |
| 3. Over the last 3-6 months in broad terms have things been improving/no change/getting worse for this stock? Rate on a scale of 1-5 (1 = getting a lot worse, 3 = not much change, 5 = getting a lot better, N/A = no view) | 4 |
| 4. Relative to the current CONSENSUS EPS forecast, is the next company EPS update likely to lead to: (1 = negative surprise vs consensus, 3 = in-line with consensus, 5 = positive surprise vs consensus expectations, N/A = no view) | 4 |
| 5. What's driving the difference? | |
| 6. Relative to YOUR current earnings forecast, is there relatively greater risk at the next earnings result of:(1 = downside skew risk to earnings, 3 = equal upside or downside risk to earnings, 5 = upside skew risk to earnings, N/A = no view) | 5 |
| 7. What's driving the difference? | |
| 8. Is there an upcoming catalyst for the company over the next three months? | |
| 9. Is there an actual or approximate date for the catalyst? | |
| 10. Is the catalyst date an actual or approximate date? | |
| 11. What is the catalyst? |
Required Disclosures
This document has been prepared by UBS Securities Pte. Ltd., Taipei Branch, an affiliate of UBS AG. UBS AG, its subsidiaries, branches and affiliates, including former Credit Suisse AG and its subsidiaries, branches and affiliates are referred to herein as "UBS".
For information on the ways in which UBS manages conflicts and maintains independence of its UBS Global Research product; historical performance information; certain additional disclosures concerning UBS Global Research recommendations; and terms and conditions for certain third party data used in research report, please visit https://www.ubs.com/disclosures. Unless otherwise indicated, information and data in this report are based on company disclosures including but not limited to annual, interim, quarterly reports and other company announcements. The figures contained in performance charts refer to the past; past performance is not a reliable indicator of future results. Additional information will be made available upon request. UBS Securities Co. Limited is licensed to conduct securities investment consultancy businesses by the China Securities Regulatory Commission. UBS acts or may act as principal in the debt securities (or in related derivatives) that may be the subject of this report. This recommendation was finalized on: 13 July 2026 02:47 PM GMT. UBS has designated certain UBS Global Research department members as Derivatives Research Analysts where those department members publish research principally on the analysis of the price or market for a derivative, and provide information reasonably sufficient upon which to base a decision to enter into a derivatives transaction. Where Derivatives Research Analysts coauthor research reports with Equity Research Analysts or Economists, the Derivatives Research Analyst is responsible for the derivatives investment views, forecasts, and/or recommendations. Quantitative Research Review: UBS Global Research publishes a quantitative assessment of its analysts' responses to certain questions about the likelihood of an occurrence of a number of short term factors in a product known as the 'Quantitative Research Review'. Views contained in this assessment on a particular stock reflect only the views on those short term factors which are a different timeframe to the 12-month timeframe reflected in any equity rating set out in this note. For the latest responses, please see the Quantitative Research Review Addendum at the back of this report, where applicable. For previous responses please make reference to (i) previous UBS Global Research reports; and (ii) where no applicable research report was published that month, the Quantitative Research Review which can be found at https://neo.ubs.com/ quantitative, or contact your UBS sales representative for access to the report or the Quantitative Research Team on ubs-quantanswers@ubs.com. A consolidated report which contains all responses is also available and again you should contact your UBS sales representative for details and pricing or the Quantitative Research team on the email above.