PDF 原檔:報告_UBS_力成6239_20260728_original.pdf
圖片清單(已驗證 2026-07-29)
| 檔名 | size | 分類 | 親眼所見內容 |
|---|---|---|---|
報告_UBS_力成6239_20260728_001.png |
57KB | 真資料圖 | Powertech 股價(NT$)與 NTM P/E 倍數雙軸圖,含平均 P/E(10x)、+1/-1 標準差帶(13x/8x),橫軸 2006年至2026年 |
報告_UBS_力成6239_20260728_002.png |
47KB | 真資料圖 | Powertech 股價(NT$)與 QFII 持股比例(%)雙軸圖,橫軸 2008年至2026年 |
報告_UBS_力成6239_20260728_003.png |
100KB | 真資料圖 | Powertech 股價與目標價(Price Target)歷史沿革圖,下方標示評等區間(Neutral/Sell/No Rating),橫軸 2023年4月至2026年 |
本份報告因漏跑自動 pdf_trim(該檔案缺 .trimmed.md),改由 Claude 於 2026-07-29 手動比照
scripts/pdf_trim.py邏輯(保留分析內容與財務表格、砍除 Required Disclosures 起之免責聲明全文)完成 Raw_data 落地。
原始內容
First Read
Powertech Technology
FOPLP expansion facing challenges
Q226 results mixed, Q3 sales guided in-line
Q226 EPS of NT$3.00 came in below UBSe/Street on higher tax and minority interests, despite stronger OP . Q226 sales of NT$23.1 bn was up 8.5% QoQ, slightly ahead of UBSe/Street. GM expanded by 2.4ppt QoQ to 21.8% driven by ASP hikes, higher loading, and forex tailwind. Management highlighted Q226's GM reached a record high post 2021 and believe its 2026 EPS should be better than prior cycle peak in 2022. For H226F, it guided Q326F sales to grow single digit % QoQ on sustained memory cycle and improving ASP, while automotive and industrial logic demand remains robust. Q326 GM and EPS are also guided to improve QoQ, and it expects sales momentum to sustain into Q426F. We forecast Q326 sales to grow 5% QoQ, while GM may expand 0.3ppt QoQ to 22.1%. 2026F capex remains unchanged at NT$50bn and we believe Powertech will use its internal cash flow and bank facilities to support its expansions.
FOPLP expansion facing challenges; AMD on track to be the first customer
Powertech remained confident that it will be the first company globally to commence mass production of FOPLP for AI chips, although both timing and scale of the ramp appears to be pushed out. The company cited equipment delivery delays, tool installation issues, NPI requirements, and qualification processes are the primary bottlenecks. It now aims to install 2K/mth capacity first, followed by an additional 4-5K/ mth capacity before end-2027 (vs prior 3K/mth by end-2026 and 3K/mth in H127). Nevertheless, management indicated it is already capable of achieving 5x reticle-size and remains on track to reach its 9x reticle-size target by end-2026. It remains committed to support its key customer AMD to ramp FOPLP AI chip before mid-2027, and we believe it will be mostly for CPU, while orders for GPU/accelerator has not been confirm.
Partnered with Broadcom on FOPLP and CPO
Management provided limited details regarding its planned NT$40bn JV with Broadcom due to NDA restrictions, but noted the capital injection will be phased in over four quarters. Powertech said the partnership will also help it to enter into optical communication field. It has been working with Broadcom on micro-bump based OE (optical engine) for pilot production before end-2026, and aims to integrate the OE with switch (H227 mass production) and AI chips (late-2028 mass production) in the next phase. As the JV's capacity will be dedicated for Broadcom products and its Taiwan facility focuses on AMD-related programs, we see a potential risk that Powertech's own FOPLP capacity may face utilization challenges during the initial ramp phase.
Valuation: Raise PT to NT$260, retain Neutral
We revise 2026/27/28E EPS by 1%/1%/0% on better OPM, offset by higher tax and minority interest from Greatek/Teraprobe. We raise our PT to NT$260 (from NT$240) with 17x 2027E PE (from 16x) on improving margin profiles and CPO opportunities. We will monitor its progress on FOPLP/CPO and price improvement sustainability.
| Highlights (NT$m) | 12/23 | 12/24 | 12/25 | 12/26E | 12/27E | 12/28E | 12/29E | 12/30E |
|---|---|---|---|---|---|---|---|---|
| Revenues | 70,441 | 73,315 | 74,929 | 93,254 | 103,336 | 113,425 | 119,285 | 125,212 |
| EBIT (UBS) | 8,154 | 9,382 | 8,132 | 14,204 | 17,028 | 19,599 | 21,151 | 22,443 |
| Net earnings (UBS) | 8,009 | 6,789 | 5,536 | 9,298 | 11,259 | 13,159 | 14,453 | 15,632 |
| EPS (UBS, diluted) (NT$) | 10.72 | 9.08 | 7.47 | 12.58 | 15.24 | 17.81 | 19.56 | 21.16 |
| DPS (net) (NT$) | 8.81 | 8.20 | 8.43 | 4.60 | 6.29 | 7.62 | 8.91 | 9.78 |
| Net (debt) / cash | (2,751) | 3,510 | (13,741) | (39,950) | (53,160) | (54,987) | (47,076) | (37,277) |
| Profitability/valuation | 12/23 | 12/24 | 12/25 | 12/26E | 12/27E | 12/28E | 12/29E | 12/30E |
| EBIT (UBS) margin% | 11.6 | 12.8 | 10.9 | 15.2 | 16.5 | 17.3 | 17.7 | 17.9 |
| ROIC (EBIT)% | 14.0 | 13.6 | 10.8 | 14.1 | 13.1 | 13.3 | 13.7 | 14.4 |
| EV/EBITDA (UBS core) x | 3.7 | 5.9 | 5.9 | 8.3 | 7.4 | 6.4 | 6.1 | 5.7 |
| P/E (UBS, diluted) x | 9.4 | 17.0 | 18.0 | 20.0 | 16.5 | 14.1 | 12.9 | 11.9 |
| Equity FCF (UBS) yield% | 14.2 | 10.0 | (8.9) | (13.1) | (5.8) | 0.7 | 6.2 | 7.5 |
| Dividend yield (net)% | 8.7 | 5.3 | 6.3 | 1.8 | 2.5 | 3.0 | 3.5 | 3.9 |
Source: Company accounts, LSEG Eikon, UBS estimates. Metrics marked as (UBS) have had analyst adjustments applied. Valuations: based on an average share price that year, (E): based on a share price of NT$ 251.50 on 28-Jul-2026
| Equities | Equities | Equities | Equities |
|---|---|---|---|
| Taiwan Semiconductors | Taiwan Semiconductors | Taiwan Semiconductors | Taiwan Semiconductors |
| 12-month rating | 12-month rating | 12-month rating | Neutral |
| 12m price target | 12m price target | 12m price target | NT$260.00 Prior : NT$240.00 |
| Price (28 Jul 2026) | Price (28 Jul 2026) | Price (28 Jul 2026) | NT$251.50 |
| RIC: 6239.TW BBG: 6239 TT | RIC: 6239.TW BBG: 6239 TT | RIC: 6239.TW BBG: 6239 TT | RIC: 6239.TW BBG: 6239 TT |
| Trading data and key metrics | Trading data and key metrics | Trading data and key metrics | Trading data and key metrics |
| 52-wk range | 52-wk range | 52-wk range | NT$379.00-116.50 |
| Market cap. | Market cap. | Market cap. | NT$191b/US$5.89b |
| Shares o/s | Shares o/s | Shares o/s | 759m (ORD) |
| Free float | Free float | Free float | 90% |
| Avg. daily volume ('000) | Avg. daily volume ('000) | Avg. daily volume ('000) | 29,287 |
| Avg. daily value (m) | Avg. daily value (m) | Avg. daily value (m) | NT$8,991 |
| Common s/h equity (12/26E) | Common s/h equity (12/26E) | Common s/h equity (12/26E) | NT$62.5b |
| P/BV (12/26E) | P/BV (12/26E) | P/BV (12/26E) | 3.0x |
| Net debt to EBITDA (12/26E) | Net debt to EBITDA (12/26E) | Net debt to EBITDA (12/26E) | 1.4x |
| EPS (UBS, diluted) (NT$) | EPS (UBS, diluted) (NT$) | EPS (UBS, diluted) (NT$) | EPS (UBS, diluted) (NT$) |
| From | To | %ch Cons. | |
| 12/26E | 12.44 | 12.58 | 1 12.51 |
| 12/27E | 15.02 | 15.24 | 1 18.16 |
| 12/28E | 17.83 | 17.81 | -0 19.33 |
Jerry Su
Analyst jerry.su@ubs.com +886-28-722 7306
Annie Chen
Associate Analyst annie.chen@ubs.com +886-2-8722 7281
Figure 1: UBS vs. VA Consensus Q226/Q326E and 2025A-27E
| 1Q26 | 2Q26 | 2Q26 | 2Q26 | 3Q26E | 3Q26E | 3Q26E | |
|---|---|---|---|---|---|---|---|
| (NT$m) | Actual | Actual | UBSe prior | VA | UBSe | UBSe prior | VA |
| Revenue | 21,314 | 23,116 | 23,111 | 23,009 | 24,219 | 23,958 | 24,459 |
| - QoQ / YoY | -0.4% | 8.5% | 8.4% | 8.0% | 4.8% | 3.7% | 6.3% |
| Gross profit | 4,144 | 5,031 | 4,709 | 4,742 | 5,355 | 5,041 | 5,219 |
| - Gross margin | 19.4% | 21.8% | 20.4% | 20.6% | 22.1% | 21.0% | 21.3% |
| Operating profit | 2,761 | 3,531 | 3,361 | 3,430 | 3,887 | 3,673 | 3,821 |
| - OP margin | 13.0% | 15.3% | 14.5% | 14.9% | 16.1% | 15.3% | 15.6% |
| Non-Op | 396 | 130 | 120 | 108 | 113 | 92 | 81 |
| Pre-tax profit | 3,157 | 3,661 | 3,482 | 3,538 | 4,000 | 3,766 | 3,903 |
| Tax | 770 | 811 | 644 | 697 | 760 | 697 | 777 |
| - Tax rate | -24% | -22% | -19% | -20% | -19% | -19% | -20% |
| Net profit | 1,844 | 2,219 | 2,301 | 2,342 | 2,578 | 2,521 | 2,582 |
| EPS (NT$) | 2.50 | 3.00 | 3.11 | 3.19 | 3.49 | 3.40 | 3.44 |
Source: Company data, UBS estimates, Visible Alpha
Figure 2: Powertech annual P&L summary
| Ticker Shares outstanding (mn) | 6239.TW 738.8 | Current Price (NT$) Mkt cap (NT$ mn) | Current Price (NT$) Mkt cap (NT$ mn) | $251.5 $185,807 | ||
|---|---|---|---|---|---|---|
| Year | 2025 | 2026E | 2027E | 2028E | 2029E | 2030E |
| Revenues (NT$ mn) | $74,929 | $93,254 | $103,336 | $113,425 | $119,285 | $125,212 |
| YoY Growth (%) | 24.5% | 10.8% | 9.8% | 5.2% | 5.0% | |
| Gross profit (NT$mn) | $12,729 | $20,022 | $23,008 | $25,724 | $27,548 | $29,067 |
| GM (%) | 17.0% | 21.5% | 22.3% | 22.7% | 23.1% | 23.2% |
| Operating profit (NT$mn) | $8,132 | $14,204 | $17,028 | $19,599 | $21,151 | $22,443 |
| OPM (%) | 10.9% | 15.2% | 16.5% | 17.3% | 17.7% | 17.9% |
| Net profit (NT$ mn) | $5,536 | $9,298 | $11,259 | $13,159 | $14,453 | $15,632 |
| EPS (NT$) | $7.47 | $12.58 | $15.24 | $17.81 | $19.56 | $21.16 |
| EPS growth (%) | 68.5% | 21.1% | 16.9% | 9.8% | 8.2% | |
| P/E (x) | 33.7 | 20.0 | 16.5 | 14.1 | 12.9 | 11.9 |
| Dividend yield (%) | 3.3% | 1.8% | 2.5% | 3.0% | 3.5% | 3.9% |
| P/B (x) | 3.3 | 3.0 | 2.7 | 2.4 | 2.2 | 2.0 |
| ROE (%) | 9.8% | 14.9% | 16.3% | 17.2% | 17.1% | 16.8% |
Source: UBS estimates, company data
Figure 3: Powertech annual and quarterly forecast summary
| Quarters | 1Q25 | 2Q25 | 3Q25 | 4Q25 | 1Q26 | 2Q26 | 3Q26E | 4Q26E |
|---|---|---|---|---|---|---|---|---|
| Revenues (NT$ mn) | $15,494 | $18,060 | $19,968 | $21,407 | $21,314 | $23,116 | $24,219 | $24,605 |
| Sequential change (%) | -9.4% | 16.6% | 10.6% | 7.2% | -0.4% | 8.5% | 4.8% | 1.6% |
| YoY change (%) | -15.5% | -7.8% | 9.1% | 25.2% | 37.6% | 28.0% | 21.3% | 14.9% |
| Gross profit | $2,641 | $2,875 | $3,222 | $3,991 | $4,144 | $5,031 | $5,355 | $5,492 |
| -- Gross Margin (%) | 17.0% | 15.9% | 16.1% | 18.6% | 19.4% | 21.8% | 22.1% | 22.3% |
| Operating profit | $1,547 | $1,836 | $2,052 | $2,696 | $2,761 | $3,531 | $3,887 | $4,025 |
| -- Operating Margin (%) | 10.0% | 10.2% | 10.3% | 12.6% | 13.0% | 15.3% | 16.1% | 16.4% |
| Non-op | $256 | ($268) | $318 | $354 | $396 | $130 | $113 | $73 |
| Pre-tax profit (NT$ mn) | $1,803 | $1,568 | $2,370 | $3,050 | $3,157 | $3,661 | $4,000 | $4,098 |
| Tax | $225 | $293 | $335 | $719 | $770 | $811 | $760 | $779 |
| -- tax rate (%) | 12.5% | 18.7% | 14.1% | 23.6% | 24.4% | 22.2% | 19.0% | 19.0% |
| Net profit (NT$ mn) | $1,175 | $960 | $1,538 | $1,864 | $1,844 | $2,219 | $2,578 | $2,657 |
| -- QoQ Growth (%) | -22.9% | -18.3% | 60.2% | 21.2% | -1.0% | 20.3% | 16.2% | 3.1% |
| -- YoY Growth (%) | -32.3% | -47.5% | -9.6% | 22.3% | 56.9% | 131.2% | 67.6% | 42.6% |
| EPS (NT$) | $1.58 | $1.30 | $2.08 | $2.52 | $2.50 | $3.00 | $3.49 | $3.60 |
Source: UBS estimates, company data
Figure 4: Powertech trading above historical PE range
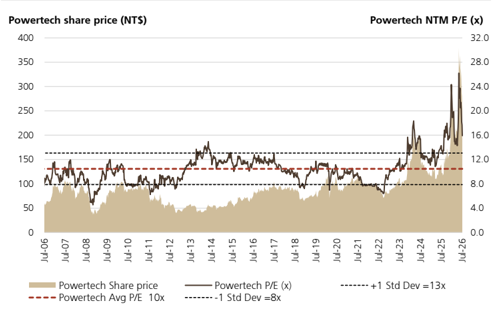
Source: LSEG
| 2024 | 2025 | 2026E | 2027E | 2028E |
|---|---|---|---|---|
| $73,315 | $74,929 | $93,254 | $103,336 | $113,425 |
| 4.1% $13,991 19.1% $9,382 12.8% | 2.2% $12,729 17.0% $8,132 | 24.5% $20,022 21.5% $14,204 15.2% | 10.8% $23,008 22.3% $17,028 16.5% $204 $17,233 $3,400 | 9.8% $25,724 22.7% $19,599 |
| $1,295 | 10.9% $660 $8,792 | $712 | $19 $19,618 $3,874 | |
| $2,178 | $1,572 17.9% | $3,120 20.9% | 17.3% | |
| $10,677 20.4% $6,789 | $14,917 | 19.7% | ||
| 19.7% | ||||
| $5,536 | $9,298 | $11,259 | $13,159 | |
| 1.9% | -37.8% | 7.0% | 40.6% | 93.8% |
| $9.08 | $7.47 | $12.58 | $15.24 | $17.81 |
Figure 5: Powertech's FINI ownership rebounding from trough
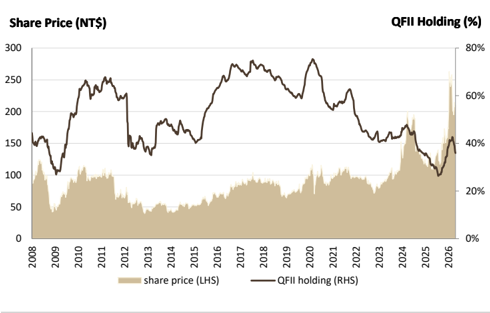
Source: TEJ
| 2025 | 2026E | 2026E | 2026E | 2027E | 2027E | 2027E |
|---|---|---|---|---|---|---|
| Actual | UBSe | UBSe prior | VA | UBSe | UBSe prior | VA |
| 74,929 | 93,254 | 92,426 | 93,004 | 103,336 | 102,013 | 107,747 |
| 2.2% | 24.5% | 23.4% | 24.1% | 10.8% | 10.4% | 15.9% |
| 12,729 | 20,022 | 19,052 | 19,324 | 23,008 | 22,074 | 23,774 |
| 17.0% | 21.5% | 20.6% | 20.8% | 22.3% | 21.6% | 22.1% |
| 8,132 | 14,204 | 13,576 | 13,793 | 17,028 | 16,300 | 17,794 |
| 10.9% | 15.2% | 14.7% | 14.8% | 16.5% | 16.0% | 16.5% |
| 660 | 712 | 658 | 660 | 204 | 291 | 337 |
| 8,792 | 14,917 | 14,233 | 14,453 | 17,233 | 16,591 | 18,131 |
| 1,572 | 3,120 | 2,819 | 3,028 | 3,400 | 3,152 | 3,704 |
| -18% | -21% | -20% | -21% | -20% | -19% | -20% |
| 5,536 | 9,298 | 9,213 | 9,282 | 11,259 | 11,127 | 12,108 |
| 7.47 | 12.58 | 12.44 | 12.28 | 15.24 | 15.02 | 15.73 |
Forecast returns
| Forecast price appreciation | 3.4% |
|---|---|
| Forecast dividend yield | 1.8% |
| Forecast stock return | 5.2% |
| Market return assumption | 6.3% |
| Forecast excess return | -1.1% |
Company Description
Powertech is a semiconductor back-end supplier with 75-80% of its sales from DRAM and NAND packaging and testing and has been growing its logic back-end business.
Valuation Method and Risk Statement
Powertech: We value Powertech using PE methodology. Upside/downside risks: 1) A stronger/weaker pricing environment; 2) slower-than expected tech end demand and memory market recovery; and 3) faster/slower ramp of FOPLP and CPO businesses.
Quantitative Research Review
UBS Global Research publishes a quantitative assessment of its analysts' responses to certain questions about the likelihood of an occurrence of a number of short term factors in a product known as the 'Quantitative Research Review'. The views for this month can be found below. Views contained in this assessment on a particular stock reflect only the views on those short term factors which are a different timeframe to the 12-month timeframe reflected in any equity rating set out in this note. For previous responses please make reference to (i) previous UBS Global Research reports; and (ii) where no applicable research report was published that month, the Quantitative Research Review which can be found at https://neo.ubs.com/quantitative, or contact your UBS sales representative for access to the report or the Quantitative Research Team on ubs-quant-answers@ubs.com. A consolidated report which contains all responses is also available and again you should contact your UBS sales representative for details and pricing or the Quantitative Research Team on the email above.
Powertech Technology
| Question | Response |
|---|---|
| 1. Is the industry structure facing the firm likely to improve or deteriorate over the next six months? Rate on a scale of 1-5 (1 = getting worse, 3 = no change, 5 = getting better, N/A = no view) | 3 |
| 2. Is the regulatory/government environment facing the firm likely to improve or deteriorate over the next six months? Rate on a scale of 1-5 (1 = getting tougher 3 = no change, 5 = getting better, N/A = no view) | 3 |
| 3. Over the last 3-6 months in broad terms have things been improving/no change/getting worse for this stock? Rate on a scale of 1-5 (1 = getting a lot worse, 3 = not much change, 5 = getting a lot better, N/A = no view) | 3 |
| 4. Relative to the current CONSENSUS EPS forecast, is the next company EPS update likely to lead to: (1 = negative surprise vs consensus, 3 = in-line with consensus, 5 = positive surprise vs consensus expectations, N/A = no view) | 3 |
| 5. What's driving the difference? | |
| 6. Relative to YOUR current earnings forecast, is there relatively greater risk at the next earnings result of:(1 = downside skew risk to earnings, 3 = equal upside or downside risk to earnings, 5 = upside skew risk to earnings, N/A = no view) | 3 |
| 7. What's driving the difference? | |
| 8. Is there an upcoming catalyst for the company over the next three months? | No Catalyst |
| 9. Is there an actual or approximate date for the catalyst? | |
| 10. Is the catalyst date an actual or approximate date? | N/A |
| 11. What is the catalyst? |
Trim 說明
此份 UBS 報告未經過 pdf_trim.py 自動處理(原始檔缺 .trimmed.md),Claude 於 2026-07-29 依同一腳本邏輯手動砍除「Required Disclosures」標題起的免責聲明全文(原文分析、財務表格、Quantitative Research Review 均完整保留在上方)。