PDF 原檔:報告_Nomura_順德2351_20260911_original.pdf
已驗證圖片清單(Step 2.5)
| 檔名 | 內容 | 類別 |
|---|---|---|
報告_Nomura_順德2351_20260911_006.png |
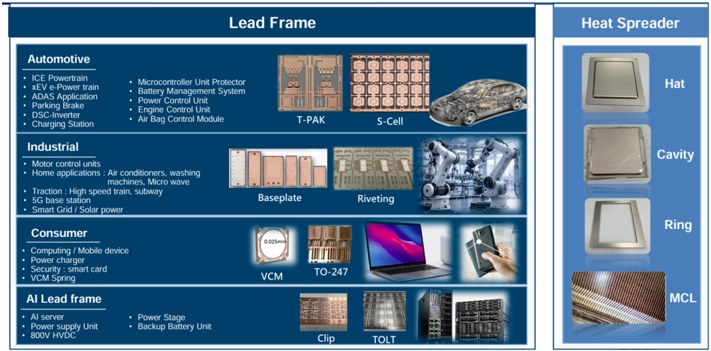
順德產品全景:導線架四大應用(車用 T-PAK/S-Cell、工業 Baseplate/Riveting、消費 VCM/TO-247、AI 導線架 Clip/TOLT/800V HVDC)+ Heat Spreader 四型(Hat/Cavity/Ring/MCL 微流道蓋) | 真資料圖,可嵌入公司頁 |
報告_Nomura_順德2351_20260911_007.png |
功率分立元件 ASP 與交期熱力圖(Diodes/LV・HV MOSFET/Small signal MOS/WBG MOSFET/IGBT,1Q22–3Q26) | 真資料圖,可嵌入供應鏈頁 |
報告_Nomura_順德2351_20260911_011.png |
Nomura 評等與目標價三年歷史圖(揭露附錄) | 揭露圖,不嵌入 |
| 其餘 8 張 | 股價相對走勢、損益表配圖等 | 裝飾/低資訊 |
原始內容
Relative performance chart
EQUITY: TECHNOLOGY
Price
(TWD)
225
2001
1751
1501
125 -
100-
75-
-150
÷125
- 100
SDI Corporation 2351.TW 2351 TT
EQUITY: TECHNOLOGY
Courra. 1 CEC Namura
Stronger power lead frame outlook in 2H26-2027F
Heat spreader products the cherry on top; maintain Buy
We see further 2026/27F growth potential from power lead frame and heat spreader
Our recent industry channel checks suggests: 1) stronger power lead frame demand, especially from AI datacenter related in 2H26-2027F: As mentioned in our previous note , global integrated device manufacturers' (IDM) 3Q26E sales outlook continues to show strength (3Q26E weighted average revenue y-y of +17% / q-q of +7%, vs +18% / +11% in 2Q26; this implies the fifth quarter of y-y expansion since 3Q25). Specifically, a few of SDI's key IDM customers at their 2Q26 earnings calls raised 2026-27E AI datacenter revenue with stronger demand and faster capacity expansion (two customers' 2027E-related sales should double y-y, according to our channel checks). We expect SDI's 2027F power lead frame revenue from AIrelated field to realize 134% y-y growth (15% of total sales vs 8% in 2026F), with 60 ongoing projects currently; and 2) favorable pricing and product mix leading to better 2026/27F margin profile: Given supply tightness across several end markets, we expect further pricing improvement for SDI in 2H26F, after two rounds of price hikes in 1H26. In addition, given stronger demand from auto and AI datacenter (with GM better than other end markets), we expect SDI's 2H26F/FY27F GM to reach 22.1%/23.0% vs 20.0% in 1H26.
2026-27F to mark the milestone of heat spreader business development
In addition to continued capacity expansion for power lead frame products, SDI's management has decided to add more stamping equipment (ranging from 100-ton, 200-ton, to500-ton) in 2026-27E to handle increasing demand for its newly-developed product - heat spreader (including hat, cavity, ring/stiffener, and micro-channel lid, or MCL). The company will focus on automotive, ASIC/CPU, and networking in AI datacenter fields. Given superior manufacturing capability (20-30µ coplanarity vs 50-70µ of industrial average), it has secured four major orders from OSAT, auto, and IC design customers, with management expecting major revenue contribution from 2027E (we estimate 3%/7% of 2027/28F total sales). We believe there can be sales and earnings contribution upside once we are able to confirm more order receiving from higher-end products.
Raise 2026/27F EPS assumptions by 8%/17%; TP raised to TWD327
We raise 2026/27F sales and earnings growth (Fig. 1 ) with stronger order placing from global IDM customers, along with initial revenue contribution from heat spreader products. Our new TP of TWD327 is based on an unchanged multiple of 28x 2027F EPS of TWD11.68 (previously 28x 2H26-1H27F EPS of TWD8.96), vs SDI's historical average of 22.5x since 2015 (a range of 5.6x to 70.6x). The stock currently trades at 20x/16x 2027/28F EPS.
| Year-end 31 Dec Currency (TWD) | FY25 Actual | Old | FY26F New | Old | FY27F New | Old | FY28F New |
|---|---|---|---|---|---|---|---|
| Revenue (mn) | 10,247 | 14,127 | 14,830 | 16,927 | 19,185 | 18,882 | 23,860 |
| Reported net profit (mn) | 303 | 1,348 | 1,455 | 1,931 | 2,263 | 2,296 | 2,871 |
| Normalised net profit (mn) | 303 | 1,348 | 1,455 | 1,931 | 2,263 | 2,296 | 2,871 |
| FD normalised EPS | 1.66 | 6.96 | 7.51 | 9.97 | 11.68 | 11.85 | 14.82 |
| FD norm. EPS growth (%) | -55.1 | 318.1 | 351.3 | 43.2 | 55.5 | 18.9 | 26.8 |
| FD normalised P/E (x) | 141.5 | - | 31.3 | - | 20.2 | - | 15.9 |
| EV/EBITDA (x) | 39.1 | - | 17.0 | - | 12.2 | - | 10.0 |
| Price/book (x) | 5.9 | - | 5.3 | - | 4.6 | - | 4.1 |
| Dividend yield (%) | 1.1 | - | 0.5 | - | 1.9 | - | 3.0 |
| ROE (%) | 4.1 | 17.2 | 18.4 | 21.6 | 24.7 | 23.0 | 27.3 |
| Net debt/equity (%) | 7.2 | 3.5 | 5.1 | net cash | 3.9 | net cash | 3.0 |
Source: Company data, Nomura estimates
Sep
| Rating Remains | Buy |
|---|---|
| Target price Increased from TWD 251.00 | TWD 327.00 |
| Closing price 10 September 2026 | TWD 235.50 |
| Implied upside | +38.9% |
| Market Cap (USD mn) | 1,447.6 |
| ADT (USD mn) | 38.7 |
Relative performance chart
Source: LSEG, Nomura
Research Analysts
Taiwan Technology
Kenny Chen - NITB kenny.chen@nomura.com +886 2 21769978
Aaron Jeng, CFA - NITB
aaron.jeng@nomura.com +886(2) 21769962
Production Complete: 2026-09-11 13:14 UTC
Key data on SDI Corporation
Performance
| (%) | 1M | 3M | 12M | ||
|---|---|---|---|---|---|
| Absolute (TWD) | 39.8 | 34.6 | 190 | M cap (USDmn) | 1,447.6 |
| Absolute (USD) | 42.8 | 34.9 | 178.5 | Free float (%) | 80.0 |
| Rel to Taiwan TAIEX Index | 34.7 | 25.4 | 102.7 | 3-mth ADT (USDmn) | 38.7 |
Income statement (TWDmn)
| Year-end 31 Dec | FY24 | FY25 | FY26F | FY27F | FY28F |
|---|---|---|---|---|---|
| Revenue | 10,815 | 10,247 | 14,830 | 19,185 | 23,860 |
| Cost of goods sold | -9,094 | -8,882 | -11,683 | -14,764 | -18,296 |
| Gross profit | 1,721 | 1,365 | 3,147 | 4,421 | 5,565 |
| SG&A | -892 | -866 | -1,231 | -1,471 | -1,833 |
| Employee share expense | |||||
| Operating profit | 829 | 499 | 1,917 | 2,950 | 3,732 |
| EBITDA | 1,535 | 1,200 | 2,690 | 3,762 | 4,583 |
| Depreciation | -707 | -701 | -773 | -812 | -851 |
| Amortisation | |||||
| EBIT | 829 | 499 | 1,917 | 2,950 | 3,732 |
| Net interest expense | -50 | -52 | -47 | -44 | -44 |
| Associates & JCEs | 122 | -19 | 25 | 0 | 0 |
| Other income | -4 | 12 | 38 | 46 | 46 |
| Earnings before tax | 897 | 439 | 1,933 | 2,952 | 3,734 |
| Income tax | -167 | -95 | -415 | -620 | -784 |
| Net profit after tax | 730 | 345 | 1,519 | 2,332 | 2,950 |
| Minority interests | -55 | -42 | -63 | -69 | -79 |
| Other items | |||||
| Preferred dividends | |||||
| Normalised NPAT | 675 | 303 | 1,455 | 2,263 | 2,871 |
| Extraordinary items | 0 | 0 | |||
| Reported NPAT | 675 | 303 | 1,455 | 2,263 | 2,871 |
| Dividends | -474 | -455 | -213 | -873 | -1,358 |
| Transfer to reserves | 202 | -152 | 1,242 | 1,390 | 1,513 |
| Valuations and ratios | |||||
| Reported P/E (x) | 63.5 | 141.5 | 31.3 | 20.2 | 15.9 |
| Normalised P/E (x) | 63.5 | 141.5 | 31.3 | 20.2 | 15.9 |
| FD normalised P/E (x) | 63.5 | 141.5 | 31.3 | 20.2 | 15.9 |
| Dividend yield (%) | 1.1 | 1.1 | 0.5 | 1.9 | 3.0 |
| Price/cashflow (x) | 36.1 | 33.4 | 28.4 | 28.1 | 21.7 |
| Price/book (x) | 5.8 | 5.9 | 5.3 | 4.6 | 4.1 |
| EV/EBITDA (x) | 28.3 | 39.1 | 17.0 | 12.2 | 10.0 |
| EV/EBIT (x) | 49.3 | 96.1 | 23.7 | 15.6 | 12.3 |
| Gross margin (%) | 15.9 | 13.3 | 21.2 | 23.0 | 23.3 |
| EBITDA margin (%) | 14.2 | 11.7 | 18.1 | 19.6 | 19.2 |
| EBIT margin (%) | 7.7 | 4.9 | 12.9 | 15.4 | 15.6 |
| Net margin (%) | 6.2 | 3.0 | 9.8 | 11.8 | 12.0 |
| Effective tax rate (%) | 18.6 | 21.5 | 21.5 | 21.0 | 21.0 |
| Dividend payout (%) | 70.1 | 150.2 | 14.6 | 38.6 | 47.3 |
| ROE (%) | 9.3 | 4.1 | 18.4 | 24.7 | 27.3 |
| ROA (pretax %) | 8.4 | 4.1 | 15.7 | 21.4 | 24.2 |
| Growth (%) | |||||
| Revenue | -0.4 | -5.2 | 44.7 | 29.4 | 24.4 |
| EBITDA | -7.0 | -21.9 | 124.2 | 39.9 | 21.8 |
| Normalised EPS | -9.1 | -55.1 | 351.3 | 55.5 | 26.8 |
| Normalised FDEPS | -9.1 | -55.1 | 351.3 | 55.5 | 26.8 |
Source: Company data, Nomura estimates
Cashflow statement (TWDmn)
| Year-end 31 Dec | FY24 | FY25 | FY26F | FY27F | FY28F |
|---|---|---|---|---|---|
| EBITDA Change in | 1,535 | 1,200 | 2,690 | 3,762 | 4,583 |
| working capital Other operating cashflow | -472 126 | -74 | -621 | -1,454 | -1,619 -861 |
| Cashflow from operations | 1,190 | 158 1,284 | -461 1,608 | -687 1,621 | 2,102 |
| Capital expenditure | -700 | ||||
| -587 | -933 | -1,300 | -700 | ||
| Free cashflow | 603 | 351 | 308 | 921 | 1,402 |
| Reduction in investments | -69 | 33 | 0 | 0 | 0 |
| Net acquisitions | 8 | -16 | 100 | 100 | |
| Dec in other LT assets Inc in other LT liabilities | 24 | -13 1,137 | 0 | 0 | 0 |
| Adjustments | 67 | -1,229 | 16 | -100 | -100 |
| CF after investing acts | 633 | 280 | 308 | 921 | 1,402 |
| Cash dividends | -474 | -455 | -213 | -873 | -1,358 |
| Equity issue | 0 | 0 | 0 | 0 | 0 |
| Debt issue | 121 | -997 | 300 | 200 | 300 |
| Convertible debt issue Others | -45 | 1,127 | 0 | 0 | 0 |
| CF from financial acts | -398 | -326 | 87 | -673 | -1,058 |
| Net cashflow | 236 | -46 | 395 | 248 | 344 |
| Beginning cash | 837 | 1,073 | 1,026 | 1,421 | 1,669 |
| Ending cash | 1,073 | 1,026 | 1,421 | 1,669 | 2,013 |
| Ending net debt | 431 | 383 | |||
| 526 | |||||
| Balance sheet As at 31 Dec | |||||
| (TWDmn) | 1,298 | 339 | |||
| FY24 1,073 | FY25 1,026 | FY26F 1,421 | FY27F 1,669 | FY28F 2,013 | |
| Cash & equivalents Marketable securities | 89 2,112 | 58 2,012 | 58 2,224 | 58 2,878 | 58 3,579 |
| Accounts receivable Inventories | 3,654 | 5,463 | 6,769 | ||
| Other current | 121 | 3,807 | 4,323 165 | 165 | 165 |
| assets | 7,049 | 165 | 8,191 | 10,232 | 12,584 |
| Total current assets | 7,068 | ||||
| LT investments | 23 | 21 | 21 | 21 | 21 |
| Fixed assets | 5,232 | 5,759 | 5,647 | 5,496 | |
| Goodwill | 5,062 0 | 0 | 0 | 0 | 0 |
| Other intangible assets Other LT assets | 402 | 431 | 331 | 231 | |
| Total assets | 415 12,736 | 14,402 1,377 | 16,231 1,577 | 18,332 1,877 | |
| Short-term debt | 12,535 836 | 1,077 | |||
| Accounts payable Other current | 915 | 1,178 | 1,285 | 1,624 1,013 | 2,013 |
| liabilities | 1,253 | 1,013 | 1,013 | 1,013 | |
| Total current | 3,676 | 4,903 | |||
| liabilities | 3,004 | 3,269 | 4,215 | ||
| Long-term debt | 1,535 | 475 | 475 | 475 | 475 |
| Convertible debt Other LT | 578 | 1,715 | 1,715 | 1,715 6,405 | 1,715 |
| liabilities Total liabilities | 5,117 | 5,459 | 5,866 | ||
| 7,093 | |||||
| Minority interest Preferred stock Common stock Retained earnings Proposed dividends | 1,821 4,812 785 | 1,821 4,656 | 1,937 5,798 800 | 1,937 7,088 800 9,826 | 1,937 8,501 800 |
| Other equity and reserves Total shareholders' equity Total equity & liabilities | 7,418 12,535 | 800 7,277 12,736 | 8,536 14,402 | 16,231 | 11,239 18,332 |
| Liquidity (x) | |||||
| 2.35 | 2.16 | 2.23 | 2.43 67.1 | 2.57 84.8 | |
| Current ratio Interest cover | 16.4 0.85 17.5 | 9.5 0.44 7.2 | 41.2 0.16 5.1 | 0.10 3.9 | 0.07 3.0 |
| Leverage Net debt/EBITDA (x) Net debt/equity (%) | |||||
| Per share Reported EPS (TWD) | 3.71 3.71 | 1.66 | 7.51 7.51 | 11.68 11.68 | 14.82 14.82 |
| Norm EPS (TWD) | 3.71 | 1.66 | |||
| FD norm EPS (TWD) | 40.73 | 1.66 | 7.51 | 11.68 | 14.82 |
| BVPS (TWD) DPS (TWD) | 39.96 | 44.06 | 50.72 | 58.01 | |
| 2.60 | 2.50 | 1.10 | 4.51 | 7.01 | |
| Activity (days) | |||||
| Days receivable | 68.0 | 73.5 | 52.1 | 48.5 | 49.5 |
| 145.1 | 121.0 | 122.4 | |||
| Days inventory | 153.3 43.0 | 127.0 | |||
| Days payable | 36.5 | 38.5 | 36.0 | 36.4 | |
| 176.6 | 183.8 | 140.7 | 135.5 | ||
| Cash cycle | 133.5 |
Source: Company data, Nomura estimates
Company profile
SDI is a leading global semiconductor lead frame supplier headquartered in Taiwan. The company is the largest power semiconductor lead frame manufacturer in the world, with its primary focus on automotive, industrial and AI applications.
Valuation Methodology
Our target price of TWD327 is based on 28x 2027F EPS of TWD11.68 vs historical average of 22.5x since 2015 with a range of 5.6x to 70.6x. The benchmark for is this stock is TAIEX.
Risks that may impede the achievement of the target price
Downside risks: 1) slower-than-expected auto, industrial, and consumer electronic demand recovery, 2) delays of new products' mass production, 3) pricing competition from global peers, and 4) dramatic copper price drop in short periods, which should be a negative impact on SDI's near-term GM.
ESG
With the core philosophy of 'sincerity, stability, challenge, and innovation,' SDI is dedicated to environmental protection, social responsibility, respecting human rights, and transparent corporate governance
25,000
20,000
15,000
10,000
5,000
3,500
3,000
10,000
9,000
Financial analysis and forecasts
1,500
Fig. 1: SDI: earnings forecast revision
500
5,000
4,000
3,000
2,000
| New forecasts | New forecasts | New forecasts | Previous forecasts | Previous forecasts | Previous forecasts | Change (%) | Change (%) | Change (%) | |
|---|---|---|---|---|---|---|---|---|---|
| TWDmn | 2025A | 2026F | 2027F | 2025A | 2026F | 2027F | 2025A | 2026F | 2027F |
| Total sales | 10,247 | 14,830 | 19,185 | 10,247 | 14,127 | 16,927 | - | 5.0 | 13.3 |
| Gross profit | 1,365 | 3,147 | 4,421 | 1,365 | 2,967 | 3,836 | - | 6.1 | 15.3 |
| Operating profit | 499 | 1,917 | 2,950 | 499 | 1,778 | 2,529 | - | 7.8 | 16.7 |
| Pre-tax profit | 439 | 1,933 | 2,952 | 439 | 1,797 | 2,531 | - | 7.6 | 16.6 |
| Net profit | 303 | 1,455 | 2,263 | 303 | 1,348 | 1,931 | - | 8.0 | 17.2 |
| EPS (TWD) | 1.66 | 7.51 | 11.68 | 1.66 | 6.96 | 9.97 | - | 7.9 | 17.2 |
| Margins (%) | |||||||||
| Gross margin | 13.3 | 21.2 | 23.0 | 13.3 | 21.0 | 22.7 | - | 0.2 | 0.4 |
| Operating margin | 4.9 | 12.9 | 15.4 | 4.9 | 12.6 | 14.9 | - | 0.3 | 0.4 |
| Pretax margin | 4.3 | 13.0 | 15.4 | 4.3 | 12.7 | 15.0 | - | 0.3 | 0.4 |
| Net margin | 3.0 | 9.8 | 11.8 | 3.0 | 9.5 | 11.4 | - | 0.3 | 0.4 |
Source: Company data, Nomura estimates
Fig. 2: SDI: quarterly financial highlights
| (TWDmn) | 2024 | 2025 | 2026F | 2027F | 2028F 24 4Q24 | 1Q25 | 2Q25 | 3Q25 | 4Q25 | 1Q26 | 2Q26 | 3Q26F | 4Q26F | 1Q27F | 2Q27F | 3Q27F | 4Q27F |
|---|---|---|---|---|---|---|---|---|---|---|---|---|---|---|---|---|---|
| Net sales | 10,815 | 10,247 | 14,830 | 19,185 | 23,860 | 2,526 | 2,595 | 2,543 | 2,584 | 2,805 | 3,559 | 4,126 | 4,340 | 4,367 | 4,717 | 5,009 | 5,092 |
| COGS | 9,094 | 8,882 | 11,683 | 14,764 | 18,296 | 2,158 | 2,323 | 2,227 | 2,175 | 2,269 | 2,822 | 3,228 | 3,364 | 3,367 | 3,628 | 3,848 | 3,921 |
| Gross profit | 1,721 | 1,365 | 3,147 | 4,421 | 5,565 | 368 | 272 | 316 | 408 | 536 | 737 | 898 | 976 | 1,000 | 1,089 | 1,161 | 1,171 |
| Op expenses | 892 | 866 | 1,231 | 1,471 | 1,833 | 221 | 201 | 213 | 231 | 265 | 321 | 318 | 328 | 345 | 363 | 381 | 382 |
| Op profit | 829 | 499 | 1,917 | 2,950 | 3,732 | 147 | 71 | 104 | 177 | 272 | 417 | 580 | 648 | 655 | 726 | 781 | 789 |
| Non-op income | 68 | (59) | 17 | 2 | 2 | 5 | (109) | 23 | 21 | 20 | (3) | 0 | (1) | (1) | 2 | 2 | (1) |
| Pre-tax profit | 897 | 439 | 1,933 | 2,952 | 3,734 | 152 | (38) | 127 | 198 | 292 | 414 | 580 | 647 | 654 | 728 | 783 | 788 |
| Net profit | 675 | 303 | 1,455 | 2,263 | 2,871 | 113 | (42) | 87 | 146 | 222 | 303 | 437 | 494 | 501 | 559 | 598 | 605 |
| EPS (TWD) | 3.71 | 1.66 | 7.51 | 11.68 | 14.82 | 0.62 | -0.23 | 0.48 | 0.80 | 1.14 | 1.56 | 2.25 | 2.55 | 2.59 | 2.89 | 3.09 | 3.12 |
| Operating ratios (%) | |||||||||||||||||
| Gross margin | 15.9% | 13.3% | 21.2% | 23.0% | 23.3% | 14.6% | 10.5% | 12.4% | 15.8% | 19.1% | 20.7% | 21.8% | 22.5% | 22.9% | 23.1% | 23.2% | 23.0% |
| Operating margin | 7.7% | 4.9% | 12.9% | 15.4% | 15.6% | 5.8% | 2.7% | 4.1% | 6.9% | 9.7% | 11.7% | 14.1% | 14.9% | 15.0% | 15.4% | 15.6% | 15.5% |
| Pre-tax profit margin | 8.3% | 4.3% | 13.0% | 15.4% | 15.6% | 6.0% | -1.5% | 5.0% | 7.7% | 10.4% | 11.6% | 14.1% | 14.9% | 15.0% | 15.4% | 15.6% | 15.5% |
| Net profit margin | 6.2% | 3.0% | 9.8% | 11.8% | 12.0% | 4.5% | -1.6% | 3.4% | 5.6% | 7.9% | 8.5% | 10.6% | 11.4% | 11.5% | 11.9% | 11.9% | 11.9% |
| Year-to-year (%) | |||||||||||||||||
| Net sales | 0% | -5% | 45% | 29% | 24% | 6% | -7% | -12% | -6% | 11% | 37% | 62% | 68% | 56% | 33% | 21% | 17% |
| Gross profit | -7% | -21% | 131% | 40% | 26% | -6% | -49% | -31% | 18% | 46% | 171% | 184% | 139% | 86% | 48% | 29% | 20% |
| Operating profit | -15% | -40% | 284% | 54% | 26% | -12% | -76% | -54% | 32% | 85% | 486% | 460% | 266% | 141% | 74% | 35% | 22% |
| Pre-tax profit | -10% | -51% | 340% | 53% | 26% | -30% | -112% | -36% | 12% | 92% | N.M. | 357% | 226% | 124% | 76% | 35% | 22% |
| Net profit | -9% | -55% | 380% | 56% | 27% | -31% | -119% | -44% | 7% | 97% | N.M. | 400% | 239% | 126% | 84% | 37% | 22% |
| Qtr-to-Qtr (%) | |||||||||||||||||
| Net sales | -8% | 3% | -2% | 2% | 9% | 27% | 16% | 5% | 1% | 8% | 6% | 2% | |||||
| Gross profit | 6% | -26% | 16% | 29% | 31% | 37% | 22% | 9% | 2% | 9% | 7% | 1% | |||||
| Operating profit | 9% | -52% | 46% | 71% | 54% | 53% | 39% | 12% | 1% | 11% | 8% | 1% | |||||
| Pre-tax profit | -14% | -125% | N.M. | 56% | 47% | 42% | 40% | 12% | 1% | 11% | 7% | 1% | |||||
| Net profit | -17% | -138% | N.M. | 67% | 52% | 37% | 44% | 13% | 1% | 12% | 7% | 1% |
Source: Company data, Nomura estimates
Fig. 3: Quarterly sales comparison
Source: Company data, Nomura estimates
Fig. 4: Quarterly auto sales
Source: Company data, Nomura estimates
1,600
1,400
1,200
1,000
800
600
400
200
TWDmn
30,000
25,000
Automotive
20,000
15,000
10,000
Charging Station
25.0%
20.0%
Fig. 5: SDI: sales mix by end application
• Power Control Unit
Engine Control Unit
Air Bag Control Module
5,000
Industrial
• Motor control units
• Home applications: Air conditioners, washing
• Traction: High speed train, subway
• 5G base station
Smart Grid / Solar power
•Automotive Industrial Consumer Al datacenter Heat spreader Others
Consumer
Computing / Mobile device
Power charger
• Security : smart card
VCM Spring
Al Lead frame
• Al server
• Power supply Unit
800V HVDO
10.0%
S-Cell
5.0%
0.0%
T-PAK
Clip
TOLT
Source: Company data, Nomura estimates
Fig. 7: SDI's electronic product offerings
Source: Company data, Nomura research
Fig. 8: Power discrete ASP and lead time
Source: Future Electronics, Nomura research
Lead Frame
Heat Spreader
Fig. 6: SDI: quarterly GM and OPM
Source: Company data, Nomura estimates
(x)
0088&81888888
Jan-15 +
Ju-15 •
Jan-16
Ju-16
— +1 SD
-2 SD
- P/B
-1 SD
Fig. 9: Select IDMs' AI datacenter revenue outlook
4
| IDM | AI datacenter outlook |
|---|---|
| Infineon | During 3Q26 earnings call, the company raised AI datacenter related revenue target to be more than €1.6bn/€2.5bn in FY26/27E vs €700mn in FY25. |
| STM | STM expects datacenter and AI infrastructure revenue to reach USD1bn/2bn in 2026/27E during 2Q26 earnings call (previous 2026E outlook: nicely above USD500mn) |
| Renesas | Renesas expects AI and IT infrastructure will drive 40% of its total revenue within the next 3 to 4 years (by 2029-30E) |
| Onsemi | Onsemi expects its AI-related revenue to raise from USD250mn in 2025 to more than double in 2026E |
Source: Company data, Nomura research
Fig. 10: SDI: 12M forward P/E
Source: Company data, Nomura estimates
(x)
Average
+2 SD
— +1 SD
-2SD
Fig. 11: SDI: 12M forward P/B
Source: Company data, Nomura estimates
Rating and target price chart (three year history)
SDI Corporation
Appendix A-1
Di
06
07
03
03
05
07
This report has been produced by Nomura International (Hong Kong) Ltd., Taipei Branch (NITB), Taiwan. See Disclaimers for Nomura Group entity details.