PDF 原檔:報告_MS_能源算力Supercycle_20260521_original.pdf
原始內容
M May 21, 2026 09:00 PM GMT
Asia Energy Security and AI
Energy Meets Compute: Supercycle Recharges
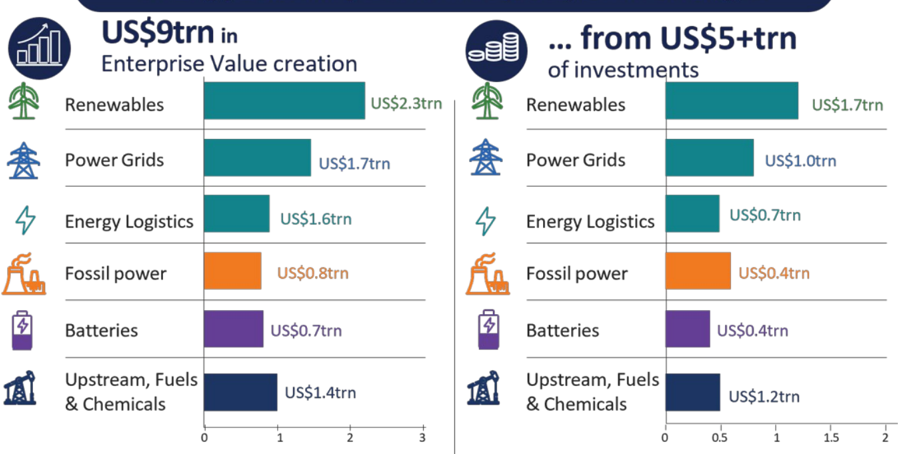
Energy shocks have become more frequent making energy and economic security critical in an AI world. US$5 trillion-plus investment needs should kick-start a golden age in dependable energy investments to secure AI, food and tech supply chains after a decade of underinvestment. An investment supercycle unlocking US$9 trillion in value beckons.

Morgan Stanley does and seeks to do business with companies covered in Morgan Stanley Research. As a result, investors should be aware that the firm may have a conflict of interest that could affect the objectivity of Morgan Stanley Research. Investors should consider Morgan Stanley Research as only a single factor in making their investment decision.
For analyst certification and other important disclosures, refer to the Disclosure Section, located at the end of this report.
- = Analysts employed by non-U.S. affiliates are not registered with FINRA, may not be associated persons of the member and may not be subject to NASD/NYSE restrictions on communications with a subject company, public appearances and trading securities held by a research analyst account.
M
Contributors
Morgan Stanley Asia (Singapore) Pte.+ Mayank Maheshwari Equity Analyst +65 6834-6719
Mayank.Maheshwari@morganstanley.com
Morgan Stanley & Co. International plc+ Martijn Rats, CFA Equity Analyst and Commodities Strategist +44 20 7425-6618 Martijn.Rats@morganstanley.com
Morgan Stanley Asia Limited+
Eva Hou Equity Analyst +852 2848-6964 Eva.Hou@morganstanley.com
Morgan Stanley India Company Private Limited+ Pranitha Shetty Research Associate +91 22 6118-3022 Pranitha.Shetty@morganstanley.com
Morgan Stanley & Co. International plc, Seoul Branch+ Young Suk Shin Equity Analyst +82 2 399-4994 Young.Shin@morganstanley.com
Morgan Stanley India Company Private Limited+ Girish Achhipalia Equity Analyst +91 22 6118-1124 Girish.Achhipalia@morganstanley.com
Morgan Stanley & Co. LLC Joe Laetsch, CFA Equity Analyst +1 212 761-8804 Joe.Laetsch@morganstanley.com
Morgan Stanley MUFG Securities Co., Ltd.+ Takeshi Kitaura Equity Analyst +81 3 6836-5427
Takeshi.Kitaura@morganstanleymufg.com
Morgan Stanley Asia (Singapore) Pte.+
Derrick Y Kam
Asia Economist
+65 6834-8272
Derrick.Kam@morganstanley.com
Morgan Stanley & Co. International plc+ Amy Gower (Amy Sergeant), CFA Commodities Strategist +44 20 7677-6937 Amy.Gower1@morganstanley.com
Morgan Stanley Asia Limited+ Jack Lu Equity Analyst +852 2848-5044 Jack.Lu@morganstanley.com
Morgan Stanley & Co. LLC Devin McDermott Equity Analyst and Commodities Strategist +1 212 761-1125 Devin.McDermott@morganstanley.com
Morgan Stanley Asia (Singapore) Pte.+ Vivek Rajamani Equity Analyst +65 6834-6740 Vivek.Rajamani@morganstanley.com
Morgan Stanley India Company Private Limited+ Hinal Choudhary Research Associate +91 22 6118-2044 Hinal.Choudhary@morganstanley.com
Morgan Stanley MUFG Securities Co., Ltd.+ Reiji Ogino Equity Analyst +81 3 6836-8930
Reiji.Ogino@morganstanleymufg.com
Morgan Stanley Asia Limited+
Sheng Zhong
Equity Analyst
+852 2239-7821
Sheng.Zhong@morganstanley.com
Morgan Stanley & Co. LLC Angel Castillo Equity Analyst +1 212 761-1931 Angel.Castillo@morganstanley.com
Morgan Stanley & Co. International plc, Seoul Branch+ Joon Seok Equity Analyst +82 2 399-4934
Joon.Seok@morganstanley.com
Morgan Stanley India Company Private Limited+
Binay Singh
Equity Analyst
+91 22 6118-1158
Binay.Singh@morganstanley.com
Morgan Stanley & Co. International plc+ Alain Gabriel, CFA Equity Analyst +44 20 7425-8959
Alain.Gabriel@MorganStanley.com
Morgan Stanley & Co. LLC Stephen C Byrd Equity Analyst +1 212 761-3865 Stephen.Byrd@morganstanley.com
Morgan Stanley Asia Limited+ Chetan Ahya Chief Asia Economist +852 2239-7812 Chetan.Ahya@morganstanley.com
Morgan Stanley Asia (Singapore) Pte.+ Ryan M Heng Research Associate +65 6834-6465 Ryan.Heng@morganstanley.com
Morgan Stanley Australia Limited+ Rob Koh Equity Analyst +61 3 9256-8932 Rob.Koh@morganstanley.com
Morgan Stanley Australia Limited+
Samantha R Edie
Equity Analyst
+61 2 9770-1671
Samantha.Edie@morganstanley.com
Morgan Stanley Asia Limited+ Qianlei Fan, CFA Equity Analyst +852 2239-1875 Qianlei.Fan@morganstanley.com
Morgan Stanley MUFG Securities Co., Ltd.+ Yu Shirakawa Equity Analyst +81 3 6836-5432
Yu.Shirakawa@morganstanleymufg.com
Morgan Stanley Asia (Singapore) Pte.+ Daniel K Blake Equity Strategist +65 6834-6597
Daniel.Blake@morganstanley.com
Morgan Stanley & Co. International plc+ Guilherme Levy Equity Analyst +44 20 7425-6616
Guilherme.Levy@morganstanley.com
Morgan Stanley & Co. International plc+
Charlotte Firkins
Commodities Strategist
+44 20 7425-3866
Charlotte.Firkins@morganstanley.com
M
Morgan Stanley Asia Limited+ Tim Hsiao Equity Analyst +852 2848-1982 Tim.Hsiao@morganstanley.com
Morgan Stanley Asia Limited+ Yiyi Wang Research Associate +852 3963-4169 Yiyi.Wang@morganstanley.com
Morgan Stanley Australia Limited+ Rahul Anand, CFA Equity Analyst +61 2 9770-1136 R.Anand@morganstanley.com
Morgan Stanley & Co. LLC Stefan Diaz, CFA Equity Analyst +1 212 761-1834 Stefan.Diaz@morganstanley.com
Morgan Stanley & Co. International plc, Seoul Branch+ Chan Park Research Associate +82 2 399-9920 Chan.Park1@morganstanley.com
Morgan Stanley & Co. LLC Jacqueline M Kenny Research Associate +1 212 761-2253 Jacqueline.Kenny@morganstanley.com
Morgan Stanley India Company Private Limited+ Rahul Gupta Equity Analyst +91 22 6118-2233 Rahul.Gupta1@morganstanley.com
Morgan Stanley Asia Limited+ Kaylee Xu Equity Analyst +852 2239-1506
Morgan Stanley Asia Limited+ Chelsea Wang Equity Analyst +852 2239-1118 Jinlin.Wang@morganstanley.com
Kaylee.Xu@morganstanley.com
Morgan Stanley Asia Limited+ Rachel L Zhang Equity Analyst +852 2239-1520 Rachel.Zhang@morganstanley.com
Morgan Stanley Asia (Singapore) Pte.+ Kristal Ji Equity Strategist +65 6834-6949 Kristal.Ji@morganstanley.com
Morgan Stanley Asia Limited+ Lisa Jiang Equity Analyst +852 2239-1282 Lisa.Jiang1@morganstanley.com
M
Contents
- 7 Energy Supercycle in Numbers
- 8 US$9trn Energy Value Creation: Who Benefits?
- 11 Calculating the Investment and Value Creation
- 13 Investment Case
- 19 Securing Energy: The Nuts, Bolts and Challenges
- 24 The Supply Chain Paradox: A Solution to Energy Independence
- 28 Energy Security Beneficiaries in Multipolar World
- 32 US$9 trillion of Value Creation: Learnings from Power's Re-rating
- 36 Asia's Competitive Reinvention of Energy Security - A Strategy Perspective
- 40 US Energy = Asia's Supply Chain Diversification
- 45 China: Fortifying Defences, Supporting Asia's Energy Security
- 49 Energy Security - A Key Pillar to Capex and Industrial Supercycle
- 51 Energy: Consumption Keeps Growing
- 53 Power Consumption: The Supercycle Accelerates policy maker
- 62 Power: Security in Diversity
- 68 Power: Key Beneficiaries
- 69 Coal Returns: A Key Pillar of Security and Growth
- 76 Coal: Key Beneficiaries across the value chain
- 77 Power Grids: Unlocking the Gridlock
- 85 Power Grids: Key Beneficiaries of Asia's US$1trn Investment
- 86 Renewables: Pacing the Growth
- 90 Energy Storage: Enabling Security
- 96 Renewables and Batteries: Key Potential Beneficiaries of the US$2trn Investment
- 97 Nuclear: The Long-Term Solution
- 100 Nuclear: Key Beneficiaries
- 101 Natural Gas: The Next Dependable Fuel Supporting Coal and Renewables
- 105 Natural Gas: Key Beneficiaries
- 106 Fuel: A New Refinery Needed Every Year
- 112 Fuels: Key Beneficiaries
- 113 Strategic Reserves: A Multi-Year Capex Cycle
- 116 Upstream: Back in Vogue
- 124 Upstream Energy: Beneficiaries of Higher Oil and Natural Gas Production
- 125 Energy Services and Logistics
- 130 Oil Services, Equipment & Logistics: Key Beneficiaries
- 131 Chemicals: Security Needs Underappreciated
- 137 Fertilizers - Food Security in Focus
- 141 Chemicals and Fertilizers: Key Beneficiaries
- 142 Appendix: Equities to Play Powering AI & The Changing Face of Power Markets
M
Energy Meets Compute: Supercycle Recharges
Asia's energy capex will nearly double through the end of the decade.
By 2030, over US$1.2 trillion in new investments will be needed to reduce Asia's import dependence by 100bps based on expected consumption growth. This is in addition to US$4.3trn of investments currently in progress and implies annual capital deployment growth of 11% through 2030 vs. 2% in the past decade. Many themes will provide durable alpha, in our view: powering AI, coal's comeback, a biofuel inflection, a golden age of fuel refining and shipbuilding, heavy equipment capacity expansion, organic chemicals and fertilizer investments, and energy storage deployment. We estimate US$9trn of value creation potential as energy consumption grows faster than expected on rising AI adoption, making multiples re-rate with tighter energy markets and given the need for higher returns to attract investments.
Industry View
India Oil & Gas | Asia Pacific In-Line
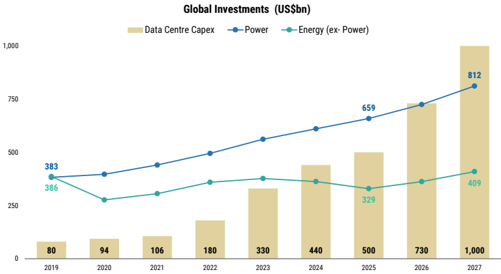
Energy security a must-have for all. Energy is the lifeblood of modern economies and security is critical to the future of energy, as there is no energy transition or AI without security. Asia consumes as much energy as rest of the world combined but only produces a third of it at home, making dependable energy investments essential as cross-border energy flows become more fragile and less reliable. Asia's energy investments have been stagnant, but consumption has risen 50% in the past decade, even as investments in traditional energy supply chains fell to their lowest levels ever and are now below data center investments, which need energy to power them. The lopsided investment profile should rebalance in the coming years as energy access and affordability become increasingly critical to the security of power, compute, food, technology, and metal supply chains in Asia.
Asia's energy demand for compute and AI is accelerating at a pace comparable with the United States, with projections indicating that by 2030 data centers will consume roughly one-sixth of all new power units in the region. This surge will not be limited to electricity; it will also drive up requirements for essential fuels and raw materials, such as coal, copper, aluminium, diesel, and other commodities across Asia. As policy makers work to overhaul and strengthen supply chains to safeguard and support AI development, reliable energy investments are receiving a critical boost, positioning the region to meet the challenges of an increasingly digital and interconnected future.
Energy spans sectors, and securing energy for Asia has global implications for equities from copper to commodity traders, fuel refiners, fertilizers, and even shipyards ( Exhibit 23 ). Recent events show that while energy markets may be global, oil insecurity is always local.This makes energy security the top priority in a world where energy demand will only rise. Below we present our key forecasts for 2030 that are not currently expected by the market:
- Asia's average annual energy investments to double by 2030 ( Exhibit 11 ) and become the second-largest area of spending after AI. We expect power, including coal, to take up more than two-thirds of the investment share, followed by fuel, energy storage and natural gas. The 'Powering AI' theme will drive a new investment cycle in energy systems, particularly storage, coal plants and grid flexibility, as exponential AI infrastructure growth collides with physical-world limitations.
- The return of coal to secure AI's need for energy , and an inflection in natural gas adoption with new infrastructure investments and fuel refinery investments making a comeback. Asia holds massive coal reserves, estimated at nearly three-fifths of the world's total, which should help slow LNG import needs ( Exhibit 19 ).
- Diversification of energy sourcing to the US, LatAm and internally within Asia for natural gas and coal; shipbuilding and investments in new tankers rise to cycle highs after a decade of underinvestment.
- Oil and gas exploration picking up steam, and coal gasification capacity builds double: Shale mining in China, deepwater finds in India/Southeast Asia, and new coal gasification projectsto leverage Asia's vast coal resource base reduce Asia's import dependence on natural gas and fertilizers.
- Energy storage expands rapidly, even in markets outside of China; Rise of biofuels to double in Asia's energy mix: Energy storage becomes a necessity in grid-level renewable
M
deployment with innovative technologies like sodium ion in energy storage gaining traction.
- Accelerated nuclear power, fertilizer and power grid deployment as combating power shortages becomes even more critical. Data centers cross-subsidise households, with tiered power pricing keeping prices affordable.
- Corporate balance sheets can support about 75% of the investments , as many are net cash and can increasingly focus on domestic allocation of growth capital. Governments may chip in more aggressively for the remaining 25% of capital needs with policies that kick-start and accelerate investments, and keep energy prices affordable.
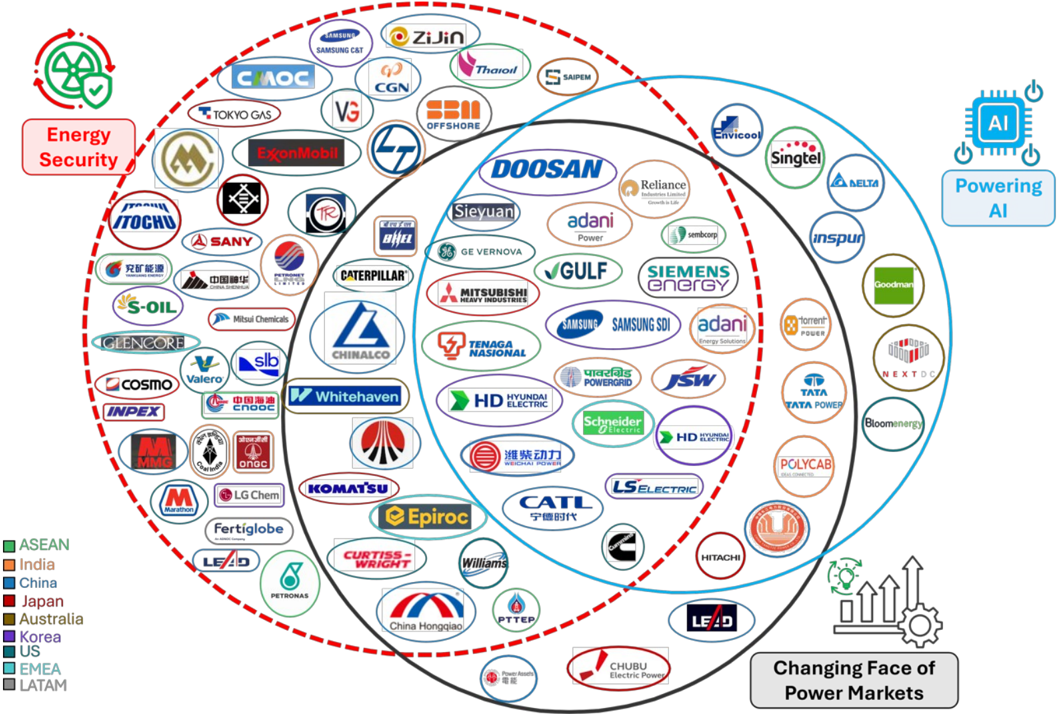
Buy dependable energy security beneficiaries as AI pushes Asia into a US$5.5trn capex cycle: We recommend owning energy security assets, as the thematic is inextricably tied to AI, and highlight 70 global equities across the coal equipment supply chain, fuel refiners, petrochemical producers, and natural gas exporters that we expect to benefit the most globally.Areas where we think earnings and dividends could surprise the most in Asia ( Exhibit 24 ) are: 1) fossil- and nuclear-based power generators; 2) the energy storage supply chain, including power grids; and 3) fertilizers. Our shortlist of 7 global equities that should benefit the most: Mitsui & Co, Venture Global, CATL, Keppel Corp, Kansai Electric, Cummins, and Doosan Enerbility.
Exmoll. chergy securly allu rowelly al. A oupelcycle neullalyes A ollapollut by <uou
M
... from US$5+trn
Energy Supercycle in Numbers
Exhibit 1: Energy Security and Powering AI: A Supercycle Recharges - A Snapshot by 2030
Energy Logistics
US$1.7trn
US$1.0trn
US$1.6trn Energy Logistics US$0.7trn
4
China
US$3,089bn
US$552bn US$116bn US$128bn
Benefiting these subsectors
Equipment
Suppliers
(Coal Mining, Power Generation
Equipment, Grid
Equipment, Refining
Equipment)
Source: Morgan Stanley Research estimates
Oil Services &
logistics (Rig operators,
offshore energy, tankers)
Power
(Thermal
power generators,
Grid
Operators)

Downstream
Infrastructure
energy (refiners,
chemicals, fertilizers)
Operators (LNG terminals,
Gas pipeline
Operators)
ullallylly race ul rowel Mainels
M
T TOKYO GAS
US$9trn Energy Value Creation: Who Benefits?
Reliance
Powering
Exhibit 2: Our preferred 70 equities that should benefit as Energy Security intersects with our global thematics of Powering AI and the Changing Face of Power Markets BHEL Power sembcorp GE VERNOVA inspur)
• ASEAN
India
China
Japan
Australia
Korea
US
EMEA
LATAM
Source: Morgan Stanley Research
The ouvelcycles value uleatlull. A vogyull value ulcatull rulellulal
M
Upstream 0&G Production,
1,105
Exhibit 3: The Supercycle's Value Creation: A US$9trn Value Creation Potential
Power Grids, 1,745
Сашал лемАЙ САпІЛ ПАЛАЛРАЙ САРІМА-АА
Refining, 150
Source: Morgan Stanley Research Estimates
CAIIDIL 4.
SUBSECTOR
CHINA
I EMEA
INDIA
JAPAN
M
ASEAN
adarod
Exhibit 4: Global Exposure to Asia's Energy Security as Compute's Need for Energy Inflects
Coal Mining
Equipment & Services
Metals
Oil Services &
Logistics
Upstream
Oil and Gas
Natural Gas
Infrastructure
Refineries
Chemicals & Fertilisers
Waltere
Clean Power
Equipment
Coal & Gas Power
Equipment
Power Grid Equipment
Suppliers
Grid Operators
Nuclear Value Chain
Power Generatorsl
Source: Company data, Morgan Stanley Research
SOUTH KOREA
TAIWAN
AUSTRALIA
W Whitehaven
YANCOAL
BHP
POWER GRIDS
+US $969bn
China US$635bn
India
USS75bn
Others US$181bn
Strategic Storage
+US $71bn
M Calculating the Investment and Value Creation
US$ 61bn
US$ 26bn
Exhibit 5: The US$5tn+ investment supercycle: Dependable energy investments will nearly double vs. the last decade while renewables should plateau after five years of significant growth Others China
US$ 283bnl
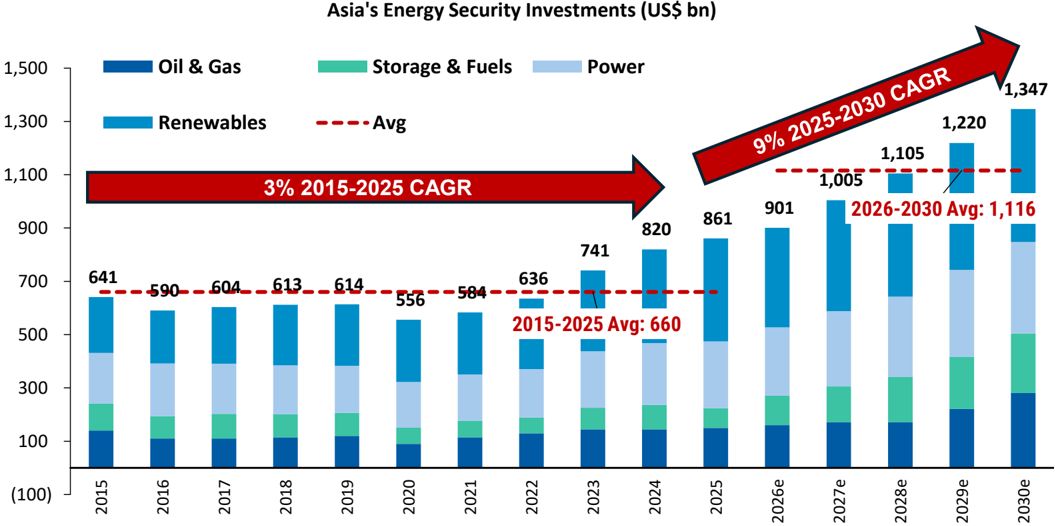
Source: Company data, Morgan Stanley Research (e) estimates
Exhibit 6: What's driving the US$5+ trillion supercycle?
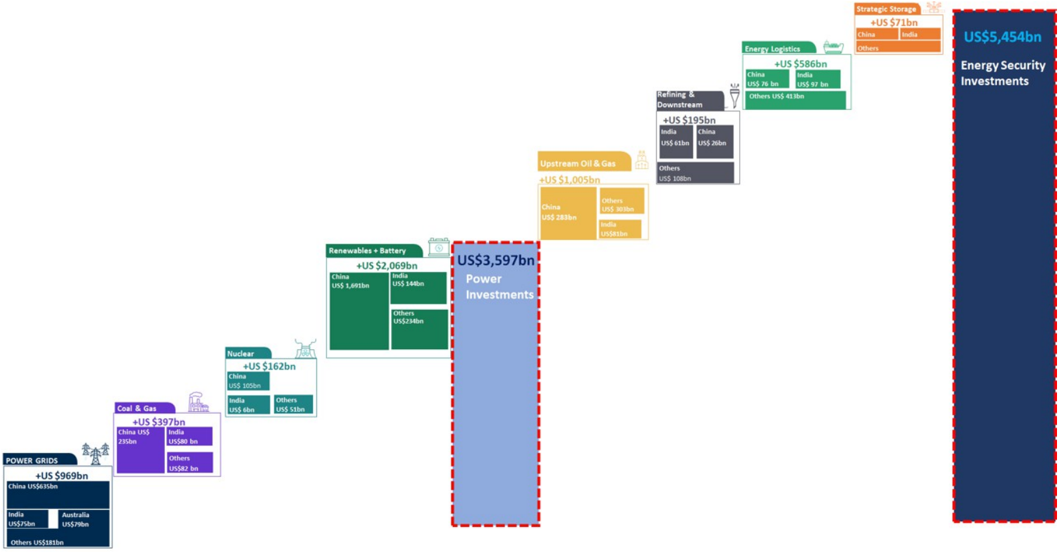
Source: Morgan Stanley Research estimates; We include capital work in progress investments in our estimates above for all countries vullals univinly thie
Enersy Logistics
+US $586bn
China
India
US$5,454bn
Energy Security
Investments
M
Exhibit 7: How the US$5trn+ investment unlocks a US$9trn value creation potential
| Associated Investments (US$ bn) | Associated Investments (US$ bn) | Associated Investments (US$ bn) | Value Creation (US$ bn) | Value Creation (US$ bn) | Value Creation (US$ bn) | Value Creation (US$ bn) |
|---|---|---|---|---|---|---|
| Category | Sub-Category | Total | Return on Capital employed | EBITDA | EV/EBITDA Multiple | Enterprise Value |
| Upstream | Exploration and Production | 1,005 | 17% | 221 | 5.0 | 1,105 |
| Refining | 94 | 15% | 19 | 8.0 | 150 | |
| Fertilisers | 37 | 12% | 6 | 8.0 | 51 | |
| Chemicals | 64 | 13% | 12 | 9.0 | 104 | |
| Coal Gasification | 98 | 17% | 22 | 7.0 | 151 | |
| Mid Stream | LNG Liquification | 12 | 16% | 3 | 12.0 | 31 |
| LNG Regasification | 87 | 16% | 18 | 12.0 | 219 | |
| Energy Logistics | 310 | 20% | 78 | 10.0 | 775 | |
| Pipelines | 17 | 12% | 3 | 15.0 | 44 | |
| Battery Swapping Infrastructure | 61 | 20% | 15 | 10.0 | 153 | |
| STORAGE | Storage Infrastucture | 71 | 12% | 12 | 15.0 | 181 |
| Oil/Fuels | 61 | |||||
| INFRASTRUCTURE | Natural Gas | 8.1 | ||||
| Fertilizers | 1.8 | |||||
| Power | Coal | 318 | 12% | 54 | 12.0 | 649 |
| Gas | 79 | 12% | 13 | 12.0 | 160 | |
| Batteries (Deployment + Production) | 364 | 12% | 62 | 12.0 | 743 | |
| Renewables Generation | 1,705 | 7% | 205 | 11.0 | 2,250 | |
| Nuclear | 162 | 10% | 24 | 12.0 | 291 | |
| Power Grids | 969 | 10% | 145 | 12.0 | 1,745 | |
| Total | 5,454 | 911 | 8,803 |
Source: Morgan Stanley Research
M
Investment Case
A US$5trn+ Supercycle
Energy markets may be global but energy insecurity is always local, with all major economies now focused on the same issue (see Exhibit 10 ). Given that Asia imports roughly 36% of its energy, we see the need for US$5.5 trillion of energy investments over the next five years, which would cut import dependence by nearly a fifth ( Exhibit 12 ). This would also need US$1.2 trillion of new investments to help increase Asia's energy self dependence 100bps on average in Asia by 2030. While we believe Asia will never be fully energy independent, it can reduce its dependence on single-supply sources and diversify its energy needs, both in terms of importing nations and fuel type. We believe spending growth will focus on fossil fuels and dependable energy sources - attracting 2x more annual spend than in the recent past. Renewables may see a plateau in spending after more than doubling over the past decade, as power grids will need to improve with ~US$1 trillion of new investments before the adoption curve for renewables inflects further.
Powering AI is increasingly grabbing policy attention as bottlenecks of energy supply to data centers become more critical and accelerate the need for coal, diesel and natural gas across economies. In an increasingly power-constrained world, AI workloads are structurally changing the shape of electricity demand across Asia. Hence, AI is forcing a greater need for dependable energy, and we believe domestic power and fuel production, and diversification of energy sourcing is becoming more critical for policy makers as AI adoption picks up. Natural gas and coal will help meet Asia's need for dependable power, and as the US shale revolution expands to Asia, it should reshape Asia's energy consumption landscape, solving grid bottlenecks and shortages in energy systems by 2030.
We estimate that Asia's energy consumption will rise by 38 exajoules (EJ) by 2030 ( Exhibit 12 ) - as much as the whole of the Middle East currently consumes, and that about two-thirds of this will be met with domestic sources - renewables, coal, and domestic natural gas; the rest will need to be imported. Import dependence varies greatly by economy, but even excluding China we estimate Asia will consume roughly 20EJ more energy by 2030, with domestic production satisfying about half of this. Energy security is no longer just a talking point for policy makers: Japan has highlighted the need to secure domestic energy supplies and is making strategic investments in shipbuilding and fusion energy; Southeast Asian nations have highlighted energy security as critical; China is focusing on improving "energy resource security guarantee levels"; and India is increasingly looking to diversify its sources of energy imports, and use technologies such as coal gasification and biofuels to reduce import dependence.
Exhibit 8: Energy Security: Investments to translate into a significant uplift in manufacturing capacity across power generation, storage infrastructure and downstream chemicals
| Additional Capacity over 2026-2030e | Additional Capacity over 2026-2030e | Additional Capacity over 2026-2030e | Additional Capacity over 2026-2030e | Additional Capacity over 2026-2030e | Additional Capacity over 2026-2030e | Additional Capacity over 2026-2030e | Additional Capacity over 2026-2030e | Additional Capacity over 2026-2030e | Additional Capacity over 2026-2030e | Additional Capacity over 2026-2030e | Additional Capacity over 2026-2030e | Additional Capacity over 2026-2030e | Additional Capacity over 2026-2030e | Additional Capacity over 2026-2030e |
|---|---|---|---|---|---|---|---|---|---|---|---|---|---|---|
| Category | Sub-Category | China | India | Japan | South Korea | Taiwan | Australia | Singapore | Malaysia | Thailand | Indonesia | Philippines | Vietnam | Total |
| UPSTREAM | Exploration and Production (mntpa) | 25 | 15 | - | - | - | 15 | - | 10 | 5 | 13 | - | 2 | 85 |
| Refining (mntpa) | 10 | 40 | - | - | - | - | - | - | 10 | 22 | 17 | 17 | 117 | |
| Fertilisers (mntpa) | 4 | 7 | - | - | - | 2 | - | 2 | - | 4 | 2 | 2 | 23 | |
| Chemicals (mntpa) | 5 | 15 | - | 2 | - | - | - | - | - | 5 | - | 5 | 32 | |
| Coal Gasification (mnt) | 20 | 100 | 10 | 130 | ||||||||||
| MID STREAM | LNG Liquification (mntpa) | - | - | - | - | - | 5 | - | 3 | 5 | - | - | 12 | |
| MID STREAM | LNG Regasification (mntpa) | 15 | 15 | 14 | 34 | 5 | 5 | 10 | 10 | 10 | 15 | 15 | 148 | |
| MID STREAM | Energy Logistics | - | - | - | - | - | - | - | - | - | - | - | - | 502 |
| Pipelines (kms) | 2,500 | 4,000 | 300 | 638 | 300 | 335 | - | 1,000 | 2,000 | 2,000 | 1,000 | 2,000 | 16,073 | |
| Battery Swapping Infrastructure | - | |||||||||||||
| Storage Infrastucture | 22 | 49 | 40 | 8 | 2 | 1 | 6 | 8 | 17 | 21 | 5 | 22 | 200 | |
| STORAGE | Oil/Fuels (mn bbl) | 164 | 337 | 291 | 40 | 16 | 6 | 45 | 56 | 113 | 147 | 34 | 145 | 1,395 |
| INFRASTRUCTURE | Natural Gas (mtoe) | - | 1.0 | - | 2.3 | - | - | - | - | 1.4 | - | - | 1.7 | 6.3 |
| Fertilizers (mnt) | - | 1.8 | - | - | - | 0.5 | - | - | - | 0.7 | - | - | 3.1 | |
| Coal (GW) | 250 | 78 | - | - | 2 | - | - | 3 | 4 | 13 | 4 | 3 | 356 | |
| Gas (GW) | 50 | - | 5 | 12 | 4 | 2 | 4 | 2 | 2 | 1 | 2 | 3 | 86 | |
| POWER | Batteries (GWh) | 2,378 | 125 | 20 | 13 | 11 | 71 | 2 | 10 | 15 | 15 | 7 | 23 | 2,690 |
| Renewables (GW) | 1,675 | 183 | 25 | 39 | 14 | 45 | 1 | 5 | 10 | 17 | 7 | 6 | 2,026 | |
| Nuclear (GW) | 46 | 7 | - | 3 | 1 | 0.1 | 0.2 | - | - | - | - | - | 57 |
Source: Morgan Stanley Research estimates
M
Exhibit 9: Energy Security: What we think Asia's economies will spend
| Associated Investments (US$ bn) | Associated Investments (US$ bn) | Associated Investments (US$ bn) | Associated Investments (US$ bn) | Associated Investments (US$ bn) | Associated Investments (US$ bn) | Associated Investments (US$ bn) | Associated Investments (US$ bn) | Associated Investments (US$ bn) | Associated Investments (US$ bn) | Associated Investments (US$ bn) | Associated Investments (US$ bn) | Associated Investments (US$ bn) | Associated Investments (US$ bn) | Associated Investments (US$ bn) |
|---|---|---|---|---|---|---|---|---|---|---|---|---|---|---|
| Category | Sub-Category | China | India | Japan | South Korea | Taiwan | Australia | Singapore | Malaysia | Thailand | Indonesia | Philippines | Vietnam | Total |
| Upstream | Exploration and Production | 283 | 81 | 25 | 55 | 71 | 40 | 86 | 6 | 20 | 1,005 | |||
| Refining | 8 | 32 | - | - | - | - | - | - | 8 | 18 | 14 | 14 | 94 | |
| Fertilisers | 5 | 11 | - | - | - | 5 | - | 3 | - | 6 | 5 | 3 | 37 | |
| Chemicals | 13 | 18 | - | 7 | - | - | - | - | - | 13 | - | 13 | 64 | |
| Coal Gasification | 14 | 78 | - | 7 | 98 | |||||||||
| Mid Stream | LNG Liquification | - | - | - | - | - | 5 | - | 3 | - | 5 | - | - | 12 |
| LNG Regasification | 8 | 8 | 7 | 28 | 3 | 2 | 5 | - | 5 | 5 | 8 | 8 | 87 | |
| Energy Logistics | 4 | 2 | 4 | 2 | 4 | 310 | ||||||||
| Pipelines | 3 | 4 | 0 | 1 | 0 | 1 | - | 1 | 2 | 2 | 1 | 2 | 17 | |
| Battery Swapping Infrastructure | 52 | 3 | 1 | 0 | 2 | 1 | 0 | 2 | 61 | |||||
| STORAGE INFRASTRUCTURE | Storage Infrastucture | 36 | 8 | 5 | 4 | 0.3 | 5 | 1 | 1 | 2 | 2 | 2 | 4 | 71 |
| Oil/Fuels | 36 | 5 | 5 | 0.6 | 0.3 | 5 | 1 | 1 | 2 | 2 | 1 | 2 | 61 | |
| Natural Gas | 2.0 | 3.8 | 0.0 | 0.02 | 0.3 | 1.0 | 1.0 | 8.1 | ||||||
| Fertilizers | 0.5 | 0.01 | 0.2 | 0.03 | 0.01 | 0.08 | 0.5 | 0.5 | 1.8 | |||||
| Coal | 208 | 80 | - | - | 2 | - | - | 3 | 3 | 16 | 3 | 3 | 318 | |
| Gas | 27 | - | 8 | 11 | 7 | 4 | 6 | 3 | 3 | 2 | 3 | 5 | 79 | |
| Batteries (Deployment + Production) | 297 | 17 | 3 | 9 | 2 | 21 | 0 | 2 | 2 | 5 | 1 | 5 | 364 | |
| Power | Renewables Generation | 1,395 | 127 | 27 | 28 | 17 | 65 | 1 | 4 | 8 | 20 | 6 | 7 | 1,705 |
| Nuclear | 105 | 6 | 30 | 7 | 10 | 1.1 | 2.1 | - | - | - | - | - | 162 | |
| Power Grids | 635 | 75 | 11 | 32 | 17 | 78.6 | 3.2 | 22 | 26 | 32 | 13 | 26 | 969 | |
| Total | 3,089 | 552 | 116 | 128 | 59 | 242 | 19 | 115 | 103 | 223 | 63 | 115 | 5,454 |
Source: Morgan Stanley Research estimates
Increasing energy security is a critical goal
Asia will leverage its coal, palm oil, solar radiation availability, and agriculture feedstock to become more self reliant on energy needs. It will also more aggressively seek energy self dependence in an increasingly multipolar and AI-driven world. Boosting energy security could include the following:
-
- Asia and Australia are home to 60%+ of global coal reserves with a diverse geographical spread. We see coal consumption for power rising to 4,000mntpa, the fastest growth by 2030 seen in this decade.
-
- Palm oil, sugar and agri waste will be increasingly leveraged by India and Southeast Asia to diversify their fuel mix, with Asia accounting for ~80% of global palm oil production, 40-45% of global sugar, and home to about half the world's agricultural production.
-
- Upstream oil and natural gas production has been restricted due to unfavourable pricing and government policies. A material shift which is in the works here could raise output in Asia by 1.7mnbpd, i.e., 5-7% of import dependence.
-
- Asia is the hub for shipbuilding and accounts for 85% of global capacity. This accelerates Asia's ability to source energy from countries outside of the Middle East a lot quicker.
Energy insecurity has manifested in the form of plastics shortages, curtailment of air travel, lower steel and nickel production, and tiered power pricing for data centers. The tightness in energy markets will keep margins structurally high for the coming decade, incentivizing new investments, while policy makers underwrite some critical components of energy security. Energy investments in Asia have averaged US$660bn ( Exhibit 5 ) annually over the past decade. We expect them to double on average annually until 2030, with evidence of increased spending since 2024 after the Russia-Ukraine conflict.
M
Exhibit 10: Asia: What policy makers are saying about energy security
| Country | Key Quotes | Type | Notes |
|---|---|---|---|
| India | India should be "self-reliant' in energy sector | Fuel Coal Gasification Coal Fertilisers Renewables | Higher ethanol blending in vehicles (including E85 fuel and E100) First ever tranche of four commercial coal mines for underground coal gasification. Coal ministry launches 15th auction, offers 17 blocks to boost output Discussion on fresh investment policy for ~10mntpa of Urea State level policy push on Renewables and Storage |
| China | 'Wemust systematically respond to external shocks and challenges, improve energy resource security guarantee levels and counter various uncertainties with the certainty of high-quality development." | Nuclear Power Energy Efficiency Coal Renewables | China to triple Nuclear Energy capacity between 2020-50 Three-year action plan to accelerate the high-quality development of energy-saving equipment in six major categories China revives Coal-to-Gas Projects Building new energy systems including geothermal energy |
| Singapore | "In Singapore, weare geographically disadvantaged. Weare a very small country. Wediversify our energy portfolio and wepursueall feasible options to strengthen our energy reliability, security and our ownresilience ." | Power Nuclear Energy Co-odination with ASEAN countries | 1.8GW of Newgasfired power capacity to be built by 2032 Capability building in Small Modular Reactors (SMRs) MoUwith South Korea ASEAN Ministers committed to focus on advancing energy resilience through diversification of energy sources, accelerating renewable energy deployment, and exploring emerging technologies Co-operation with Japan in LNGupstream and storage infrastructure. Increase biodiesel blend from 5%to7%. Authorities probe to expand biodiesel blends (B10 and B20) |
| Thailand | "Strengthen energy security, including diversification of oil and gas imports and energy saving" | Gas Fuel Renewables | Approval of solar rooftop installation plan with ability for households to sell electricity back to the grid |
| Malaysia | "Energy security is no longer optional, but it has become a strategic national priority " | Coal | Tenaga is looking to sign 10 contracts of affreightment (COAs) to import the coal for the next 15 years |
| Japan | " Diversify both energy suppliers and sources to mitigate market volatility" | Nuclear Coal | Japan restarted existing reactors; plans to maximize nuclear energy Govt decided not to apply curbs on inefficient coal power plants in 2026, usage of coal plants to increase |
| South Korea | "We encourage economies to diversify their power sources and technologies while... enabling efficient market operation to enhance power system flexibility, resilience and stability." | Coal Nuclear | Lifted limits on coal- fired power generation capacity Korea will raise nuclear power plant utilisation to as high as80% |
| Australia | "Ensuring long-term energy security for Australia is a priority of our Government" | Fuel and Fertiliser Coal Natural Gas Critical Mineral Value | Export Finance and Insurance Corporation Amendment (Strategic Reserve) Bill 2026 to secure fuel and other strategic materials including fertiliser NewSouth Wales coal mines given two-year extension as well as the first new area for gas exploration after a decade NSWopenedits first new areas for gas exploration in a decade after gas for power generation fell to two -decade low Diversification in Critical Mineral Strategic Reserve |
| " Increased investment in comprehensive energy infrastructure across the entire energy supply chain, from upstream development facilities to downstream equipment, in order to support affordable, reliable and secure | chain Fuel Natural Gas | B50 biodiesel implementation testing for automotive, mining and railway sectors Government study on national CNGuseasLPGsubstitute | |
| Indonesia | energy supply, including baseload electricity." | Renewables Natural Gas | The government has begun drafting the 2026-2035 National Energy Plan (RUEN) focusing on energy security Indonesia and Japan accelerated the US$20.9 bn Abadi LNGProject in the Masela Block |
Source: Reuters, Bloomberg, Morgan Stanley Research
China is facing an energy chokepoint : China, the world's largest manufacturing hub and second-largest economy, is increasingly confronting a structural challenge of energy security within a more fragmented, multipolar global landscape. With rising geopolitical uncertainties, supply chain realignment, growing domestic demand, and ensuring reliable and affordable energy have become central strategic priorities. Against this backdrop, China's 15th Five-Year Plan featured an unprecedented US$3-3.8trn investment across energy production, power systems, and downstream infrastructure.
A local focus - grids and fossil-based power drive spending the most
Recent access to energy in Asia is now coming from local markets, despite energy being a global supply chain, as multiple countries ceased fuel and chemical exports, thereby exposing vulnerabilities in
other economies' supply chains. We expect energy capex outside of renewables to nearly double to US$640bn with new projects to secure energy rising to US$1.2 trillion over the next five years, as Asia's energy needs rise 15% by 2030. The key area of growth will likely be power, which will attract about two-thirds of new investment spend, followed by energy storage, oil, natural gas exploration and midstream ( Exhibit 32 ). We see an inflection in spending on natural gas pipelines, coal gasification, biofuels, new fuel refineries, and storage ( Exhibit 32 ). For power, grids will attract the largest part of the spending, then fossil-based power generation, while renewables may see stable capacity additions. Tertiary benefits will flow into commodity trading houses in Japan and shipping corporates, as energy diversification drivers longer supply chains, and also benefits steel, uranium, aluminium and copper consumption supported by over three trillion dollars of power grid and power investments.
M
Exhibit 11: Asia's annual energy investment is set to nearly double for the rest of the decade
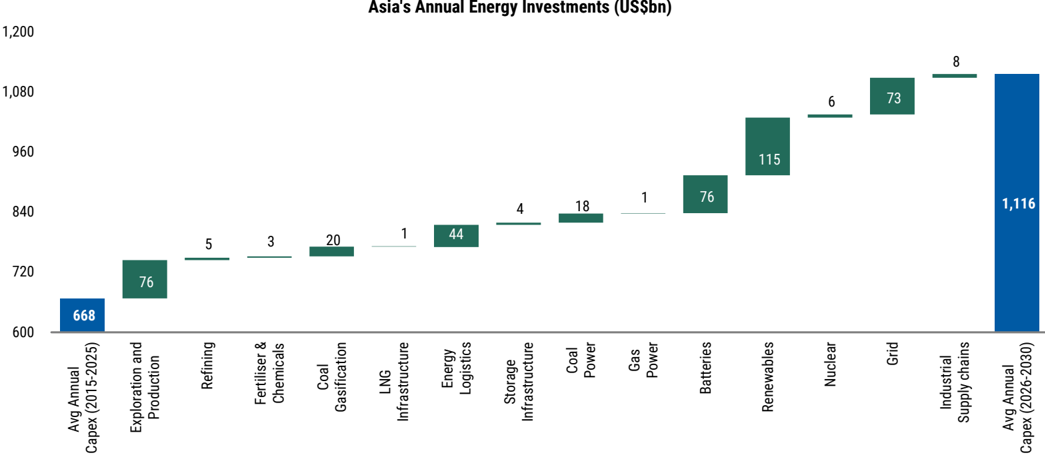
Source: Morgan Stanley Research estimates
From 'powering AI' to 'securing power' for AI: There is no AI without energy. AI investments have now risen above energy investments in Asia, and we believe power supply tightness in multiple markets will accelerate new dependable energy investments as AI adoption picks up, with 75GW of data center capacity by 2030. While China is well positioned to power its AI needs with renewables, we estimate the rest of Asia will need to invest US$235bn to set up 100GW of coaland gas-based power generation, while supplementing it with batteries and renewable investments of US$1.3tn. We believe India, Thailand and Singapore will see upside surprises to data center capacity growth in the coming years.
Balancing Consumption Growth and Self Reliance
Energy consumption has grown 50% in Asia over the past decade but energy investments have been stagnant at around US$0.7trn ( Exhibit 5 ), leading to rising stresses in energy systems, which now have reached a critical stage as global energy supply chains readjust and AI adoption accelerates energy intensity for economies a lot faster than most policy makers were ready for. Energy consumption in Asia will rise 300bps faster than in the past decade, we estimate, with power consumption growing at twice the pace. Energy investments will accelerate across Asia at its fastest pace for the rest of decade, with every single economy now pledging to improve energy security issues quickly.
Exhibit 12: Asia: US$5.5trn investment = Import reliance on new energy consumption reduces to less than 30%
Reducing Asia's Incremental Energy Import Reliance by 7% (EJ)
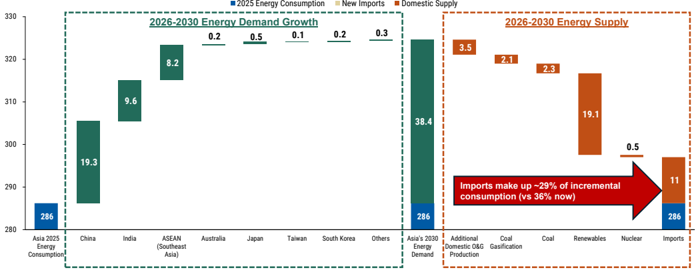
Source: Morgan Stanley Research estimates
M
Funding the US$5trn investment supercycle
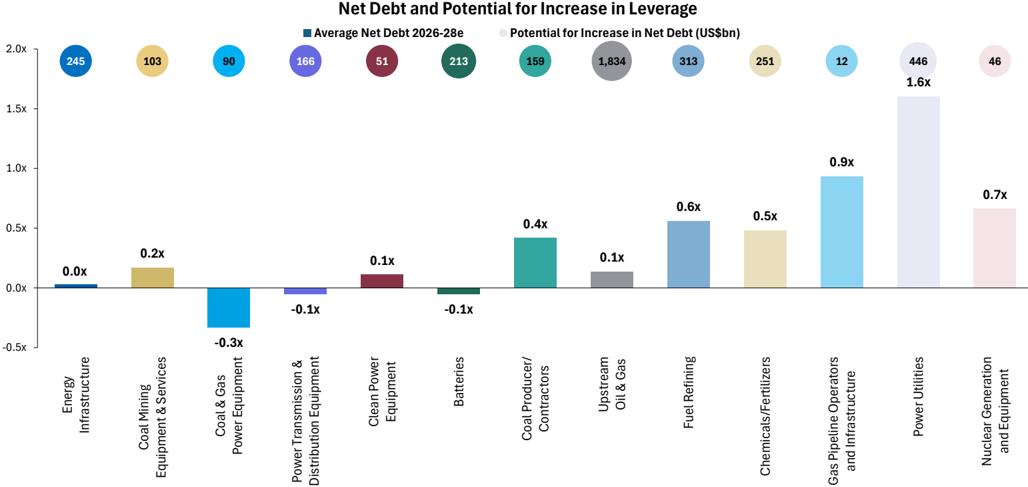
Energy corporates, especially fossil fuel-based power generation companies, upstream oil and gas producers, integrated oils and downstream fuel refiners companies, have under invested over the past decade and generally have very strong balance sheets. Even equipment producers in upstream turbine/transformer and wires supply chain have been cautiously putting capex to work in Asia due to changing fuel mix that favoured green technologies in the primary energy mix over fossil fuels and power grids. With a more balanced outlook ahead and policies presenting less of a challenge for fossilbased operators, we believe corporates with strong balance sheets, especially integrated oils which could also be among the largest power supply chain players, will benefit the most.
As both governments and hyperscalers are underwriting the cash flows for power and energy storage producers, we estimate 75% of investments will be funded by balance sheets of energy companies with a combination of OCF and debt. The remaining funding, we believe, should be a combination of government support and global sovereign support.
Exhibit 13: Funding energy security: Corporate balance sheets are strong with limited debt as the companies have been behind the curve on growing investments vs. consumption growth. Collectively we see US$4trn potential for funding by debt on 2028 multiples
Source: Refinitiv, Morgan Stanley Research estimates
camble 14. The chelyy secury mivesthell oupel cycle. The bull, base allu Deal vases
M
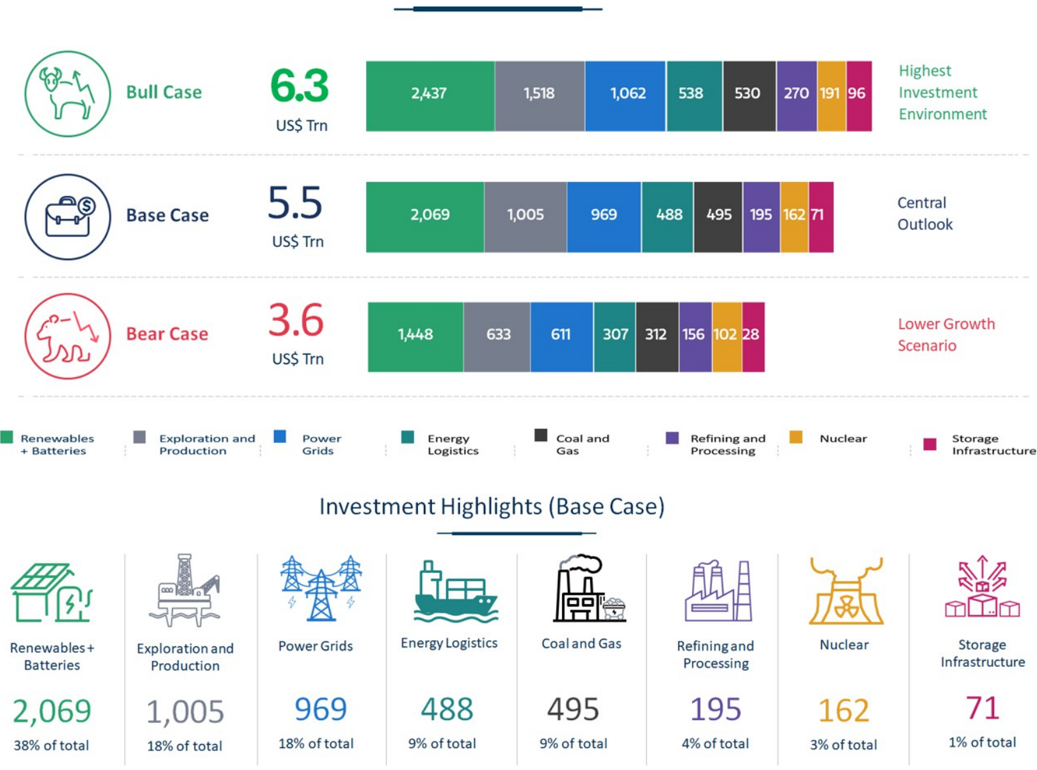
Understanding our Bull-Bear framework in the context of a supercycle
Our US$5 trillion-plus investment calculation from a bottom-up country level basis includes each country's needs needs for power, oil, storage and chemical capacities, while triangulating it with government policy, powering AI needs and execution time frames. Our
Issi
US$ Trn
Exhibit 14: The Energy Security Investment Supercycle: The Bull, Base and Bear Cases
Renewables
- Batteries
Renewables +
Batteries
2,069
38% of totall
Source: Morgan Stanley Research estimates
Bear Case
1,448
633
611
Highest
Investment
Environment bear case assumes challenges around availability of manpower, equipment supply chain bottlenecks and delays in execution, especially in India and ASEAN, around projects involving coal plants, new fuel refineries, and upstream oil and gas production. For our bull case, we assume accelerated policy support helping the execution of powergrids, energy storage, storage of fuel and LNG, as well as renewables in China.
307
312
156
102 28
Lower Growth
Scenario
1,062
538
530
270
191
96
Speed of Implementation
1-2 years
3-4 years
5+ years
Aolas Shelyy secury mplem ellatlon vo. Urgency Maulix
M
Australia
Securing Energy: The Nuts, Bolts and Challenges
Korea
Japan
China
India
China
ASEAN
China
Feedstock Diversification
'Safety and certainty in oil lie in variety and variety alone.' First Lord of the Admiralty Winston Churchill gave the defining quote on oil diversification in 1913 while addressing the British Parliament after the US navy made the switch from coal to oil. China
Australia
Japan
ASEAN
Securing Asia's Energy
Taiwan
South
Australia
Korea
We expect the ongoing energy shock to trigger more than US$1trn of annual spending ( Exhibit 5 ) on fuel refining, storage, gas pipelines, power grids, and coal and gas power generation through 2030, as well as boosting capex in renewables and nuclear supply chains. We believe the strong balance sheets of energy corporates can fund these new investments ( Exhibit 13 ), especially in the context of tight energy markets.
Tight energy markets also provide upside risks for: 1) fuel margins, as new capacity adds still lag consumption by about half, driving higher
Australia
China fuel refining investments; 2) government support and funding leads to 1bn+ barrels of new fuel storage build in Asia; 3) coal generation rises by more than 350GW, the fastest in a decade, and energy storage rises 6x to ~3,000GwH as power consumption grows 3x faster outside of China; China uses coal-based power generation for intermittent supply to balance renewable loads; 4) gas pipeline infrastructure helps accelerate natural gas adoption with diversification of feedstock supplies to the US; US ethane and propane for plastic manufacturing also makes Asian chemical and fertilizer players more competitive; and 5) organic chemicals such as sulphur that are essential in metal processing, pharma and tech supply chains go from being byproducts to being more valued commodities.
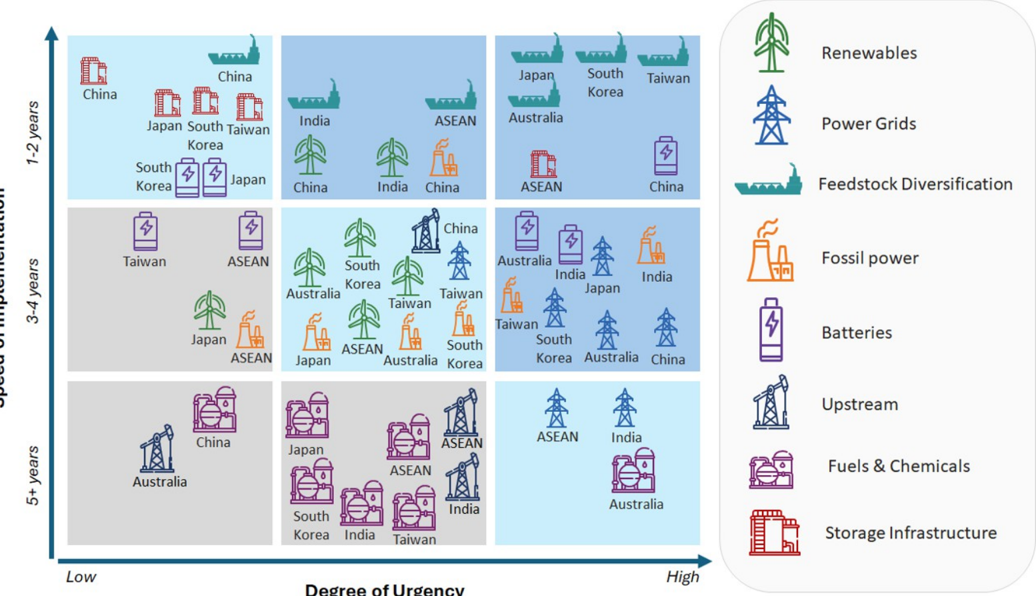
Exhibit 15: Asia's Energy Security Implementation vs. Urgency Matrix
Source: Morgan Stanley Research estimates; not drawn to scale
Taiwan
Taiwan
South
Korea
South
Korea
Taiwan
Renewables
Batteries
M
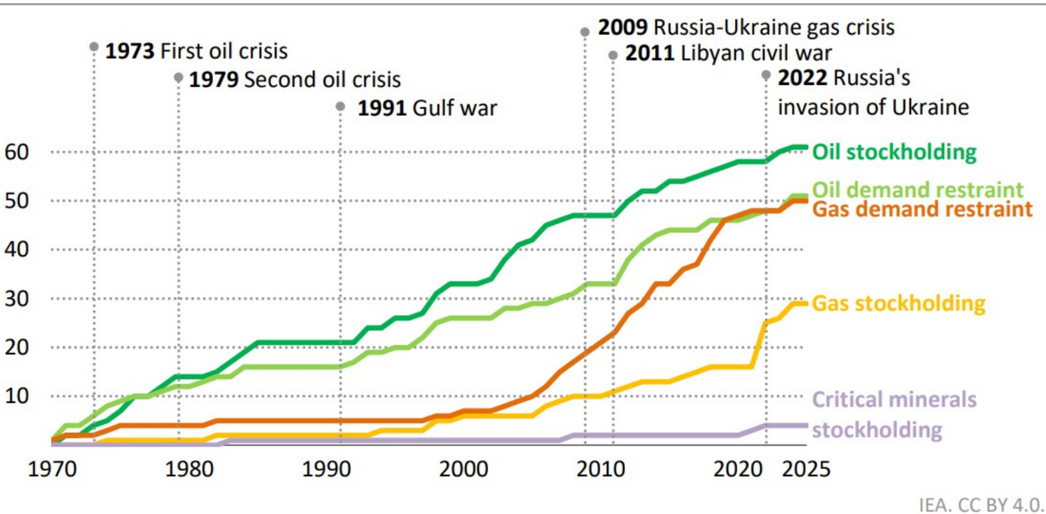
Policy makers began to pay more attention to energy security following the 2022 oil price shock ( Exhibit 18 ). In its wake, we saw a pickup in fossil and nuclear fuel supply chain investments, which were then boosted by AI's power needs. Now, the 2026 supply shock puts the focus more structurally on energy security and not just the energy transition, as Asia goes through its worst access-to-energy challenge in at least 50 years.
Energy supply chains will realign as countries avoid the current chokepoints: Energy supply chain realignment is shifting from "justin-time" cost efficiency to "just-in-case" resilience, driven by geopolitical tensions, trade tariffs (e.g., US tariffs, FEOC restrictions), and the need to decouple from dominant suppliers like the Middle East. This restructuring prioritizes friend-shoring, regionalization, and closer to home. We believe Asia will import a lot more natural gas from the US and Russia incrementally, considering it is essential for power and transport systems, while also seeing higher oil imports from LatAm, Canada and Africa. Fuel systems in Asia will also likely realign as exports were curbed for the first time by China and Thailand. We have already seen signs of this change with the Australia-Singapore energy co-operation and expect other economies such as Japan, Taiwan and Korea to re-look at fuel sourcing options. Coal, which is ample in Indonesia, India and China, will also be key for 'just in case' resilience for power systems. Power grid connectivity in Southeast Asia between countries, such as India-Bangladesh, will get more traction after two decades of limited progress.
While supply chains alone will not help in addressing the energy and national security concerns, economies like Japan and Australia are looking to invest directly in regions like ASEAN to expand the security of supply chains. Japan's Prime Minister highlighted ( Exhibit 10 )
Exhibit 16: Global AI data center capex is set to surpass investment in both power and oil & gas
Source: IEA, Morgan Stanley Research estimates the country's mutual dependence on ASEAN as it channels US$10bn into ASEAN for sourcing crude oil, while Japanese energy corporates are raising their Southeast Asia footprint. In addition, UAE will invest US$5bn in India across energy and storage. Australia has also signed energy supply agreements with Singapore for fuel and LNG.
Bottlenecks to energy security - Limited investments over the past decade and the availability of labour are the key bottlenecks to achieving energy security and powering AI investments. The availability of capacity to build steam turbines, high voltage transformers, fuel refinery CDUs, FPSOs for oil extraction, FLNG infrastructure and skilled labour will drive investment over multiple years (but not the next few given long lead timelines for land sourcing, environmental approvals and construction. Corporate balance sheets are very strong but energy corporates have had high hurdle rates to grow and have normally been more reactive to consumption growth in their investment approach. We believe national oil, power and private players will invest over US$4tn+, or about 80% of the necessary infrastructure to fortify energy needs domestically, while government subsidies, and the collaboration of Global South with Global North will help address funding needs as well. Increasingly the role played by technology companies with large balance sheets to underwrite these investments will become critical.
Innovation will provide solutions where the diversification of supply chains is difficult: Examples include coal gasification in India, green hydrogen supply chains to Singapore and Korea from India, sodium ion batteries for energy storage to make China less dependent on lithium imports, and SMRs (small-module reactors) in India and Southeast Asia.
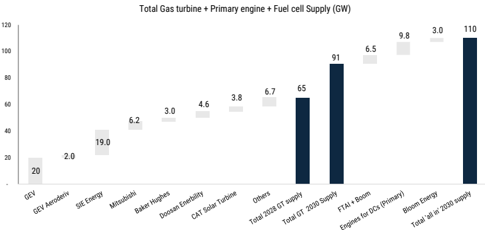
Exhibit 17: Gas turbine, engine and fuel cell capacity supply developments out to 2030. Gas turbine supply (GW) is set to double between 2025 and 2030, reducing some of the recent bottlenecks in the electrification supply chain
Source: Morgan stanley Research estimates
cambre 1o. cutulative number or countles will selecteu ellel yelley leopolise dilu ellelyy securly poncies, T9fU<ULo
M
Affordability vs. New Investments
The affordability question - Tiered energy prices to become the
norm: Asia is home to some of the most price-sensitive consumers, so affordability is key for any energy source to be adopted. Energy security is expensive and does come with infrastructure which is not always useful but needs investment to create and maintain. Hence, like in power, we believe tiered energy pricing will become even more prevalent as industrial consumers, data centers, airlines, and higher voltage users pay for energy security. In the process they subsidize the lower income consumer groups. We have seen some evidence of this in Malaysia with data centers, Thailand with high volume retail consumers, higher taxes for fuel in India, and lower power taxes for distributed power consumers in the Philippines.
2009 Russia-Ukraine gas crisis
• 2011 Libyan civil war
2022 Russia's
The Challenge: Energy security = Oversupply? - Oil stockholding
Oil demand restraint
Increased domestic capacity for everything from power to chemicals has historically led to oversupply in globally linked commodities, such as plastics and fuel. While we expect oversupply in some parts of the value chain, shipyards, power, fuel and even coal should see the least challenges in terms of domestic pricing. Although we could see a new downcycle take shape in 2029-30 with the startup of new supplies in specific value chains, it is unlikely to be as challenging as the last few years considering the higher cost of capital for economies like ASEAN and India vs. China, which should see capacity growth. Domestic coal in Asia - whether in Indonesia, India or China - should provide competition for US LNG imports, while power, being a highly domestic commodity, should not see many of the challenges of oversupply, especially against a backdrop of rising AI adoption. On equipment and battery supply chains, we see limited risk of oversupply until 2030, considering the rising orderbook.
60
50
40
30
20
10
Note: The analysis focuses on 85 countries, covering 93% of global primary energy demand, 87% of global
Exhibit 18: Cumulative number of countries with selected emergency response and energy security policies, 1970-2025
Source: IEA Energy Outlook 2025
M
The Nuts & Bolts of Securing Asia's Energy Complex
Power: We estimate 320GW of new power generation will be built in Asia by 2030, covering 40% of its new power consumption needs. While China's power generation exceeds consumption, most other economies are struggling to meet their future power needs after half a decade of underinvestment in dependable base load power systems. Renewable power and related supply chains have accounted for 67% of investment in Asia since 2020, but fossil fuelbased power consumption grew 4% and accounted for 70% of total units consumed outside of China. Even in China, fossil-based power generation grew at one of the fastest paces, despite the focus on renewable capacity. We see this adoption in fossil-based power generation accelerating with 440GW+ of new consumption coming from coal and gas, while the pace of renewable adoption slows (vs. the past five years) in Asia, partly also due to grid constraints and reallocation of capital to alternative fuels and new technologies. With with the dependable power fleet aging with an average life of 20+ years in Japan, Korea, Malaysia, Singapore, Australia and Taiwan, we see a replacement cycle in the works.
The nexus between energy and AI is also catalysing policy makers' response to energy security . There are at least two broad dimensions to this relationship. In the race for AI and robotics, energy remains a key bottleneck and power grid investments are the most important part as grids serve as highways for powering AI until dependable supply catches up. Energy storage will also act as a quickto-market solution in the race for AI adoption - and until supply becomes ample, which we believe will take until at least 2030.
Coal and natural gas to take share in power, transport and industrials. We see coal and natural gas making a comeback in Asia's energy security story while natural gas imports become more diversified - a path Asia was already on but which will be accelerated in the coming quarters and years. Both fuels are dependable and diversified in terms of availability globally across US, LatAm, the Middle East and within Asia in countries like Australia, Indonesia and Malaysia. We estimate 500mntpa of new coal consumption needs and 100mntpa of gas consumption in Asia by 2030, driven by transport, AI and household needs for cooking and power. This should keep lower calorific value coal prices supported at higher levels with much lower discounts (at 15-20%) to natural gas vs. the past. While coal will replace 20mntpa of potential LNG imports for power, in absolute terms we do see US LNG imports making up two-thirds of incremental imports in Asia in the coming years as Asia diversifies its gas sourcing, especially in India/ASEAN and Korea/Japan. With oversup- plied global LNG markets, we also see significant pricing power for Asian consumers beyond 2027.
Coal and renewables to work together: Learnings from China. Over the past five years, China has added more renewables and nuclear generation capacity than the rest of the world combined, and solar PV and wind now account for 18% of generation. Despite this, coal demand for electricity rose by more than 25% from 2019 to 2024 and the country also has over 200GW of coal generation capacity under construction. The low capital cost of coal plants in China means that operating them flexibly to support renewables has much lower opportunity costs than in other markets. Even at a 30% capacity factor, its average levelized cost of coal generation at US$80/Mwh is lower than the levelized cost of gas at US$110/MWh.
Fuels, plastics and storage: Asia's fuel consumption increased by 4mbpd from pre-Covid to 2025 and will keep rising until 2030. We estimate Asia will need at least one new fuel refinery to be built every year, i.e., US$12-15bn in annual investments to service this rising need for fuels ( Exhibit 141 ). Storage infrastructure to increase strategic reserves of oil, coal, fertilizers and even natural gas will be built to increase storage from 30-45 days in most economies to nearly 90 days, and will need US$40bn in annual infrastructure capex with implications for steel needs ( Exhibit 153 ), on our estimates. The export ban on fuel and fertiliser exporters in the past two oil shocks and the impact of this on India, Southeast Asia, Australia and Japan should drive new investments in the sector - something we last saw in 2017.
While most countries have focused on diversifying into natural gas and electric fleets for transport, it has become apparent that those efforts are only helping negate the increase in miles traveled by consumers, but not covering new consumers of oil (i.e., new car owners, air travel, etc.). Even supply chains for energy storage and batteries are being diversified away from China, with China itself increasingly focusing on sodium ion technology due to its dependence on lithium and nickel supply chains. We see new refineries being built in India, Thailand, Vietnam and possibly Australia. The shortage of fuel has led to lower petrochemical supply in multiple countries during the present oil shock. While there is excess chemical capacity in Asia and the world, naphtha access is going to be critical and will be a key consideration for new fuel refining capacity.
Chemicals for tech and metal processing supply chains: Metals, which are key in the age of electricity like nickel, uranium and copper, need significant amounts of sulphur to process ore, and sulphur is also used in chip-making for etching. We expect demand for sulphur,
M
a by-product of fuel refining, to rise at a 5% CAGR in Asia through 2030, despite Asia already accounting for half the world's consumption. We see new organic chemical investments in India, Thailand, Taiwan and Indonesia to secure supply chains.
Fertilizers: Asia will build at least 20mntpa of new fertilizer capacity by 2030 as consumption rises by 3% annually through 2030. Ensuring the availability of fertilizers at stable prices is imperative for the good of humanity, since globally, in the last 50 years, fertilizers have made a 60% contribution to crop yield growth. Asia is the largest fertilizer-consuming region globally, importing a third of its requirements at US$100bn in 2025. The current shortage of fertilizer supplies is due to limited gas reserves in Asia and high import dependence on the US, Russia and Middle East. For non-nitrogen nutrients, Asia's (ex-China) dependence on countries like Morocco, Canada and Russia for potash and phosphate will likely continue. We see upside to our forecast of 12mntpa capacity additions, especially as new feasibility studies for fertilizer supply additions in India, Philippines, Vietnam and Australia have started as 'indigenous production' and security takes center stage.
Shipping and shipyards: Global shipyard capacity has halved in more than a decade with 85% of capacity now concentrated in China, Korea and Japan . Other countries in Asia are taking note as the need to transport energy and defend supply chains rises. Another positive effect is that the industry helps raise employment locally. In the medium term, as energy supply chains rewire and diversify in Asia towards the US, LatAm and Africa for natural gas, LPG, oil and fertilizers, the miles travelled to ship energy will rise given the distance from the US to Asia, materially higher than from the Middle East to Asia. Undersupply of vessels could sustain for longer than expected, driving elevated asset returns, and an orderbook upcycle.
We have seen new tanker contracts surging in 4M26, but the orderbook/fleet ratio remains lower versus the ratio of vessels older than 20 years/total capacity, highlighting a significant capex cycle ahead for shipyards. As distances rise with Asia diversifying its energy sources, we will need more vessels (especially given the percentage of vessels older than 20 years, which may also need to be demolished). We see a mild probability that the tanker orderbook/fleet ratio could double by 2030 from the end-2025 level, as a combination of old fleet demolitions and new fleets serving longer distances comes into play. ( Exhibit 177 )
M
The Supply Chain Paradox: A Solution to Energy Independence
Asia consumes as much energy as the rest of the world and imports about a third of its needs ( Exhibit 10 ). While we expect the US$1tn+ of new investments and the total of US$5tn+ of investments will reduce dependence on imports, with energy imports accounting for a third of new energy consumption, not all is the same across Asia.( Exhibit 19 ). However, there are inherent geographical paradoxes in supply chains which countries have to overcome. Australia and Indonesia have significant hydrocarbon reserves but unfavourable economics have resulted in slower production and insufficient infrastructure to refine them. This is essential as they are also the largest metal ore producers and refiners. Similarly, India is the fastest-growing energy consumer globally but does not have enough oil and natural gas with limited upstream spending for the past decade due to lackluster energy pricing policies. India, Indonesia and China are also home to nearly 60% of global coal reserves ( Exhibit 19 ). Indonesia and Malaysia are the largest exporters of palm oil, which is used for gasoline/diesel fuel blending.
We see new supply chains emerging to solve for these paradoxes in each economy's energy needs, based on coal (using coal gasification), increased biofuels use and batteries, along with storage and new infrastructure development in energy.
Energy supply chains are increasingly exposed and need fortification within Asia and increasingly from the Americas. Fragmentation in the global system and rising trade uncertainty coexist with an ever -greater reliance on cross -border energy flows, as abundant supplies of oil, solar equipment, batteries and soon LNG
continue to move internationally. Yet energy dependency remains a structural weakness across much of Asia. Despite repeated energy shocks over the past two decades, investment has been fragmented, largely private -led, slow to execute, and matched by reactive - rather than forward -looking - policy responses. The current shock has laid bare the depth and diversity of these dependencies.
The imbalance is uneven. Countries such as India, Japan, South Korea and Thailand have built sufficient refining capacity but remain heavily reliant on imported upstream energy. Conversely, Australia, Indonesia and Malaysia are resource -rich upstream but poor economics caused underinvestment in production and downstream refining, with projects often delayed or scaled back. Further downstream, integration into petrochemicals and fertilizers remains patchy, leaving major economies like India and Indonesia structurally import -dependent despite capacity additions.
At the same time, baseload power investment declined across much of Asia in the past decade , following overcapacity in markets such as the Philippines, Singapore and Malaysia, excess capacity in Japan and Taiwan, and rapid renewable expansion in China and India. That backdrop has now reversed. AI, electrification and onshoring have tightened power markets sharply, prompting regulators over the past three years to recommit to baseload generation and grid capex. We see the next investment cycle driven by policy efforts to diversify generation mixes and reduce reliance on single fuels, as electricity becomes the dominant form of energy consumption across modern economies.
M
Exhibit 19: Asia: 2007 vs. 2024 - How energy dependency has evolved
| China | China | India | India | Japan | Japan | South Korea | South Korea | Taiwan | Taiwan | Australia | Singapore | Malaysia | Indonesia | Thailand | Philippines | Vietnam | |||||||
|---|---|---|---|---|---|---|---|---|---|---|---|---|---|---|---|---|---|---|---|---|---|---|---|
| Coal | 2006 | 2024 | 2006 | 2024 | 2006 | 2024 | 2006 | 2024 | 2006 | 2024 | 2006 | 2024 | 2006 2024 | 2006 | 2024 | 2006 | 2024 | 2006 2024 | 2006 | 2024 | 2006 | 2024 | |
| %ofEnergy Basket | 76% | 58% | 55% | 59% | 21% | 28% | 25% | 22% | 35% | 33% 46% | 28% | 0% 0% | 10% | 23% | 14% | 12% | 22% | 43% 16% | 39% | 22% | 54% | ||
| Import dependancy (% of consumption) | 9% | -3% | 10% | 21% | 99% | 100% | 98% | 100% | 100% | 100% Exporter | Exporter | 100% 100% | 100% | 100% | 57% | 78% | Exporter Exporter | 100% | 100% | Exporter | 59% | ||
| Upstream Oil | |||||||||||||||||||||||
| %ofEnergy Basket | 18% | 20% | 33% | 28% | 47% | 39% | 46% | 42% | 45% 37% | 34% | 41% | 86% 87% | 42% | 38% | 52% | 47% | 47% | 29% | 44% | 38% | 49% | 31% | |
| Import dependancy (% of consumption) | 49% | 74% | 72% | 87% | 100% | 100% | 100% | 100% | 100% 100% | 41% | 66% | 100% 100% | -6% | 43% | 66% | 72% | 17% | 62% | 100% | 100% | Exporter | 75% | |
| Strategic Reserves (mn barrels of oil) | ~100 | 1,100-1,400 | Minimal | ~150 | ~500 | ~470 | 200-250 | ~400 | ~27 40-50 | 3-5 | 4-10 | 20-30 30-40 | Minimal | 20-40 | 60 days | 60-70 days | Minimal | 10-20 | Minimal | 10-30 | Minimal | 10-20 | |
| Fuel | |||||||||||||||||||||||
| Fuel Import Dependancy (Oil demand vs Fuel Refining capacity) | Exporter | Exporter | Exporter | Exporter | 14% | 9% | Exporter | Exporter | Exporter Exporter | 82% | 22% | Exporter | 13% | 80% | Exporter | Exporter | 1% | 18% | 23% | 3% | 63% | 96% | 48% |
| Refining Capacity (mbpd) | 9.2 | 18.5 | 2.9 | 5.2 | 4.6 | 3.0 | 2.6 | 3.4 | 1.1 1.1 | 0.7 | 0.2 | 1.4 | 1.3 | 0.5 | 1.2 | 1.1 | 1.2 | 1.0 | 1.3 | 0.3 | 0.2 | 0.0 | 0.4 |
| Gas | |||||||||||||||||||||||
| %ofEnergy Basket | 3% | 10% | 8% | 7% | 14% | 20% | 12% | 17% | 9% 24% | 18% | 24% | 14% | 12% | 47% | 35% | 32% | 35% | 25% | 15% | 8% | 5% | 22% | 5% |
| Gas Import dependancy (% of consumption) | 0% | 43% | 21% | 54% | 100% | 100% | 100% | 100% | 100% 100% | Exporter | Exporter | 100% | 100% | Exporter | Exporter | 24% | 41% | Exporter | Exporter | 100% | 100% | 0% | 0% |
| Chemicals | |||||||||||||||||||||||
| Ethylene Capacity | 9.0 | 59.8 | 3.0 | 8.7 | 8.0 | 6.8 | 6.1 | 12.9 | 2.7 4.0 | 0.5 | 0.0 | 1.9 | 4.1 | 1.7 | 3.1 | 2.3 | 5.4 | 0.5 1.4 | Nil | 0.5 | Nil | 1.0 | |
| Ethylene Import dependancy (% of consumption) | 48% | 42% | 42% | 44% | 47% | 31% | 50% | 28% | 59% 43% | 34% | 100% | 47% | 33% | 42% | 20% | 48% | 35% | 72% | 54% | 100% | 31% | 100% | Balanced |
| PE Capacity | 6.4 | 39.1 | 2.0 | 6.9 | 3.7 | 3.2 | 4.0 | 8.1 | 1.4 1.5 | 0.4 | 0.0 | 1.3 | 2.8 | 1.1 | 1.8 | 2.0 | 4.1 | 0.8 | 1.2 | 0.2 | 0.6 | Nil | 1.0 |
| PE Import dependancy (% of consumption) | 44% | 14% | 3% | 24% | -28% | -48% | -117% | -241% | -80% -92% | 31% | 100% | -907% -1937% | -23% | -30% | -76% | -141% | 15% | 41% | 52% | 19% | 100% | 61% | |
| Fertilisers | |||||||||||||||||||||||
| Fertiliser consumption (as %offertiliser production) | Exporter | Exporter | 153% | 139% | 121% | 144% | 238% | Increased | NA NA | 225% | 410% | NM NM | 288% | 256% | 1306% | 423% | 109% | 122% | 292% | 459% | 266% | 121% | |
| Urea Import dependancy | Exporter | Exporter | 16% | 22% | 100% | 49% | 100% | 100% | NA 100% | 80% | 100% | 100% | 100% | 36% 41% | 100% | 100% | 0% | 1% 83% | 100% | 82% | 19% | ||
| Power Grid Equipment Manufacturing | Exporter | Exporter | Importer | Exporter | Importer | Exporter | Importer | Exporter | Importer Importer | Importer | Importer | Importer | Importer | Importer | Importer | Exporter | Importer | Importer | Importer | Importer | Importer | Importer | Importer |
| Solar Module Manufacturing (Module) | Exporter | Exporter | Importer | Exporter | Exporter | Importer | Importer | Importer | Importer Importer | Importer | Importer | Importer Importer | Importer Importer | Importer | Exporter Importer | Importer | Importer | Importer | Exporter | Exporter |
Source: FOA, UN Trade, BP Statistics, World Trade, Morgan Stanley Research
Exhibit 20: India's solar manufacturing buildout is accelerating rapidly with major players building integrated facilities
| Capacity | F27 | F27 | F27 | F27 | F28 | F28 | F28 | F28 | F28 | F28 | F28 | |
|---|---|---|---|---|---|---|---|---|---|---|---|---|
| Company | Polysilicon (Mtpa) | Ingot | Solar cell Module | Integrated | Polysilicon | (Mtpa) | Ingot Wafer | Solar cell | Module | Integrated | Level of integration | |
| Reliance | 40,000 | 20.0 | 20.0 | 20.0 | 40,000 | 20.0 | 20.0 | 20.0 | Polysilicon to module | |||
| Shri Sai Electricals | 5 | 5 | 5 | 10 | 10 | 10 | 10 | Polysilicon to module | ||||
| Premier Energies | 8 | 11 | 11 | 8 | 10 | 10 | 11 | 8 | Ingot to module | |||
| Mundra Solar | 30,000 | 10 | 10 | 10 | 30,000 | 10 | 10 | 10 | Polysilicon to module | |||
| Waaree Energies | 10 | 5 26 | 10 | 10 | 10 | 15 | 28 | 10 | wafer/ingot to module | |||
| Renew Power | 7 | 7 | 7 | 7 | 7 | 7 | wafer to module | |||||
| Tata Power Solar | 4 | 4 | 4 | 4 | Cell & Module | |||||||
| Renew-sys | 3 | 6 | 3 | 6 | Cell & Module | |||||||
| Vikram Solar | 12 | 21 | 12 | 12 | 21 | 6 (F29) | Module | |||||
| Saatvik Solar | 4 | 5 | 9 | |||||||||
| Goldi Solar | 4 | 14 | 4 | 14 | Cell & Module | |||||||
| Jupiter Solar | 6 | 2 | 6 | 2 | Cell & Module | |||||||
| Emmvee | 3 | 7 | 3 | 7 | Cell & Module | |||||||
| Websol | 2 | 1 | 2 | 1 | Cell & Module | |||||||
| Rayzon Solar | 12 | 12 | Module | |||||||||
| First Solar | 3 | 3 | Module - vertically integrated | |||||||||
| Others | 20 | 40 | ||||||||||
| Total | 70,000.0 | 15 | 87 171 | 58 | 70,000 | 28 | 42 | 108 | 203 | 55 |
Source: Company, Morgan Stanley Research estimates
cambil 41. vo nola laue do ellel yy securly allu leeustock alvel shicatul lake bellel slaye
M
How the US can support Asia's energy diversification
US Shale Revolution
2030 vs 2025
Asia's Natural Gas Revolution
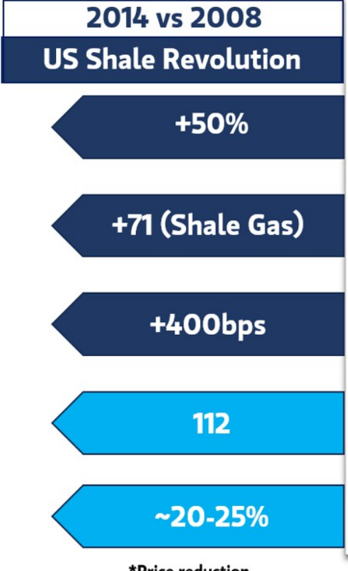
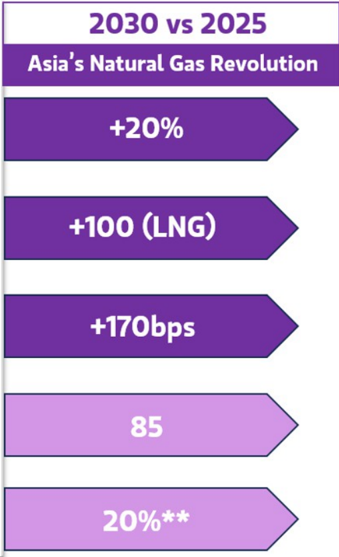
Exhibit 21: US-Asia trade as energy security and feedstock diversification take center stage
+50%
Source: Morgan Stanley Research
+20% Natural Gas affordability*
Gas consumption
Growth (MTPA)
Natural Gas share in Total Energy Mix
Annual Energy Cost Savings (US$bn)
Equity Returns
Exmbles. ullculailly m supoly Chlalls lellans unuel dupleulaleu
M
The Circularity in Energy Supply Chains
Exhibit 22: Circularity in supply chains remains underappreciated
Fuel Refinery lal
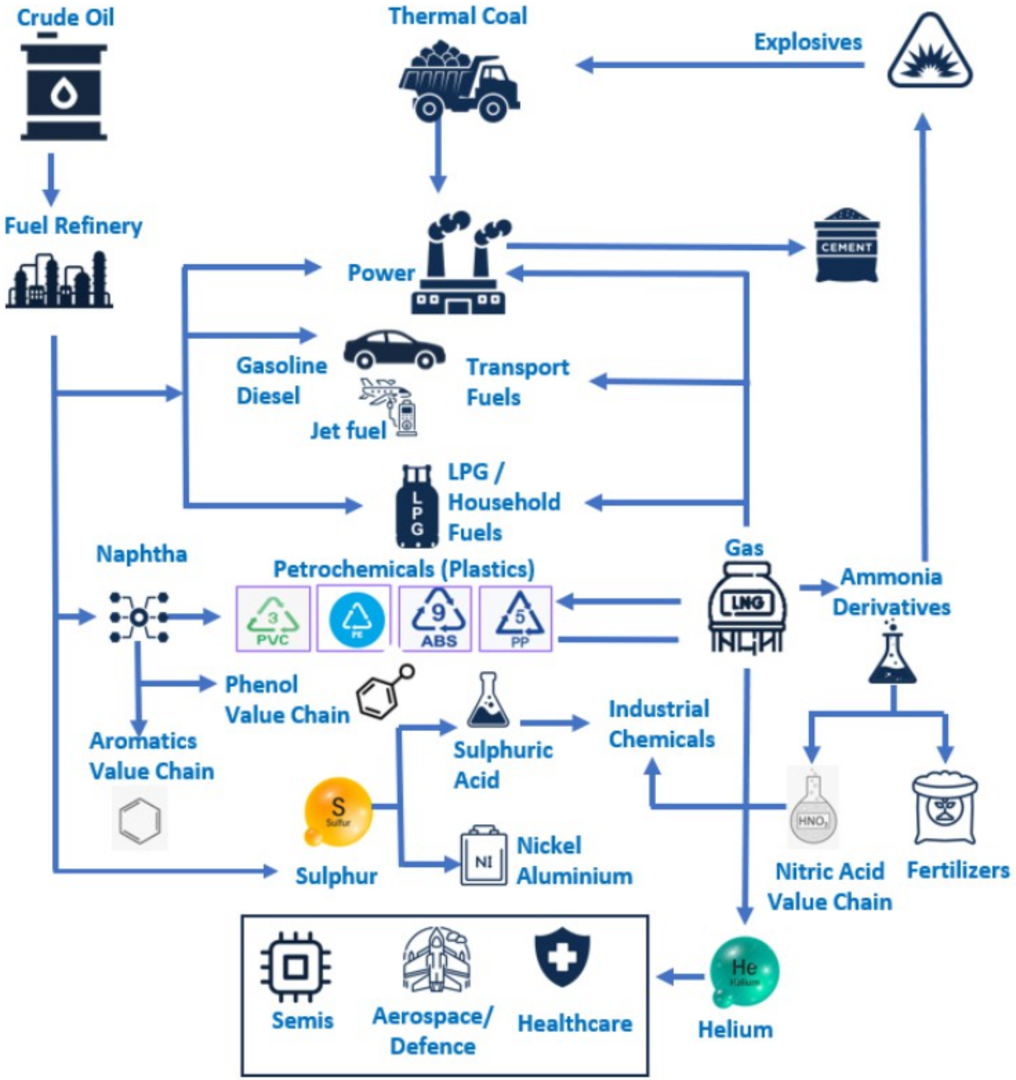
Source: Morgan Stanley Research
Explosives
M
Energy Security Beneficiaries in Multipolar World
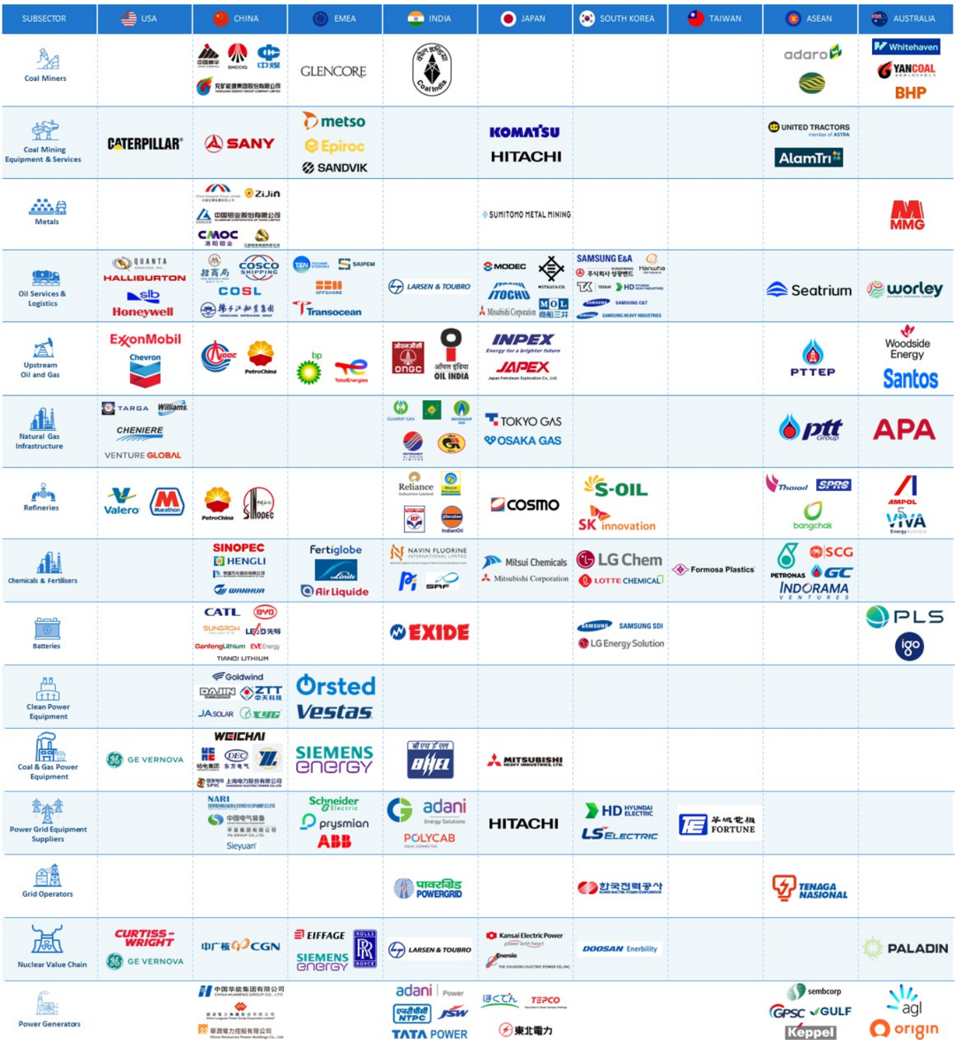
Energy spans sectors, and securing energy for Asia has global implications, impacting equities from copper to commodity traders, to fuel refiners to fertilizers and even shipyards. We suggest owning key energy security assets - this concept is inextricably tied to AI. These include assets that give nations the ability to further energy self-sufficiency, such as nuclear, energy storage, greater local oil and natural gas production, and refining.
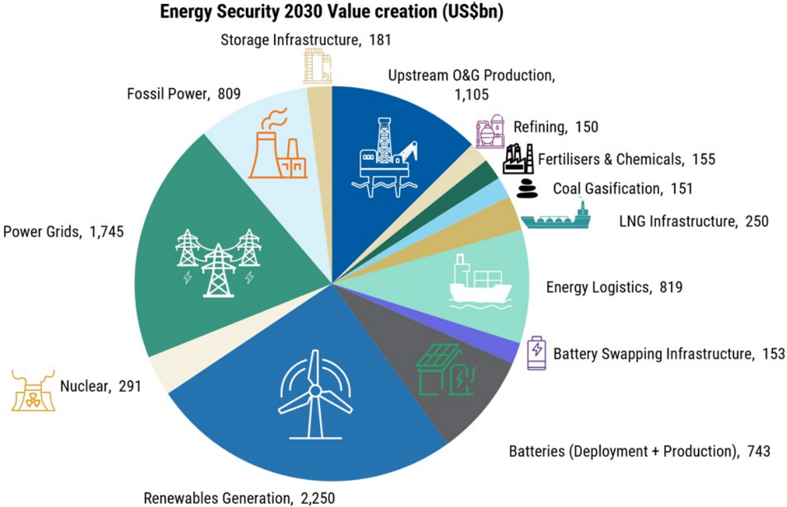
We see a nearly 1.6x torque to the value creation as US$5tn+ in investment ( Exhibit 5 ) across the Asia region ensures security of tech, AI, food and energy supply chains, unlocking US$9tn in value, we estimate. The 70+ equities we select from around the world offer US$1.5tn+ in potential enterprise value creation with 5-30% upside to Street estimates for 2028. Moreover, we believe a re-rating is in the works for energy equities in Asia as investment needs become critical, lifting returns until 2030. Historically, traditional energy corporates have been behind the curve in investing long-cycle capex, which has helped them earn 14-18% through-cycle returns as they capture multi-year margin expansion, something we believe is already being priced into equities via multiples for coal power generators, coal equipment companies, upstream oil & gas producers and fuel refiners.
The acceleration of this investment will be catalyzed by: 1) higher fuel cracks, power prices, shipping rates, fertilizer prices and even chemical spreads, all of which we expect will remain 1.2-1.5x above midcycle levels while consumption growth stresses existing infrastructure. On average, building these projects is a 5-year cycle, and hence immediate acceleration of investment is becoming the need of the hour. With industry and transport power consumption rising nearly 80% in the past 15 years, we see pricing power for these investments, especially as AI becomes a large part of consumption growth for power. 2) Regulated returns will see a higher spread over cost of capital as the need for power grids, gas pipelines and storage terminals, along with power plants, becomes more acute. We also see governments subsidizing these investments by providing cheaper capital and also subsidies for end-consumers.
cambit do. chelyy secury. Mappily the value Chall anu wile bellello
M
Tankers
Exhibit 23: Energy security: Mapping the value chain and who benefits
China Hongqiao
Aluminium Corp
MMG, Whitehaven,
Shaanxi, Glencore
Hanwha Aerospace
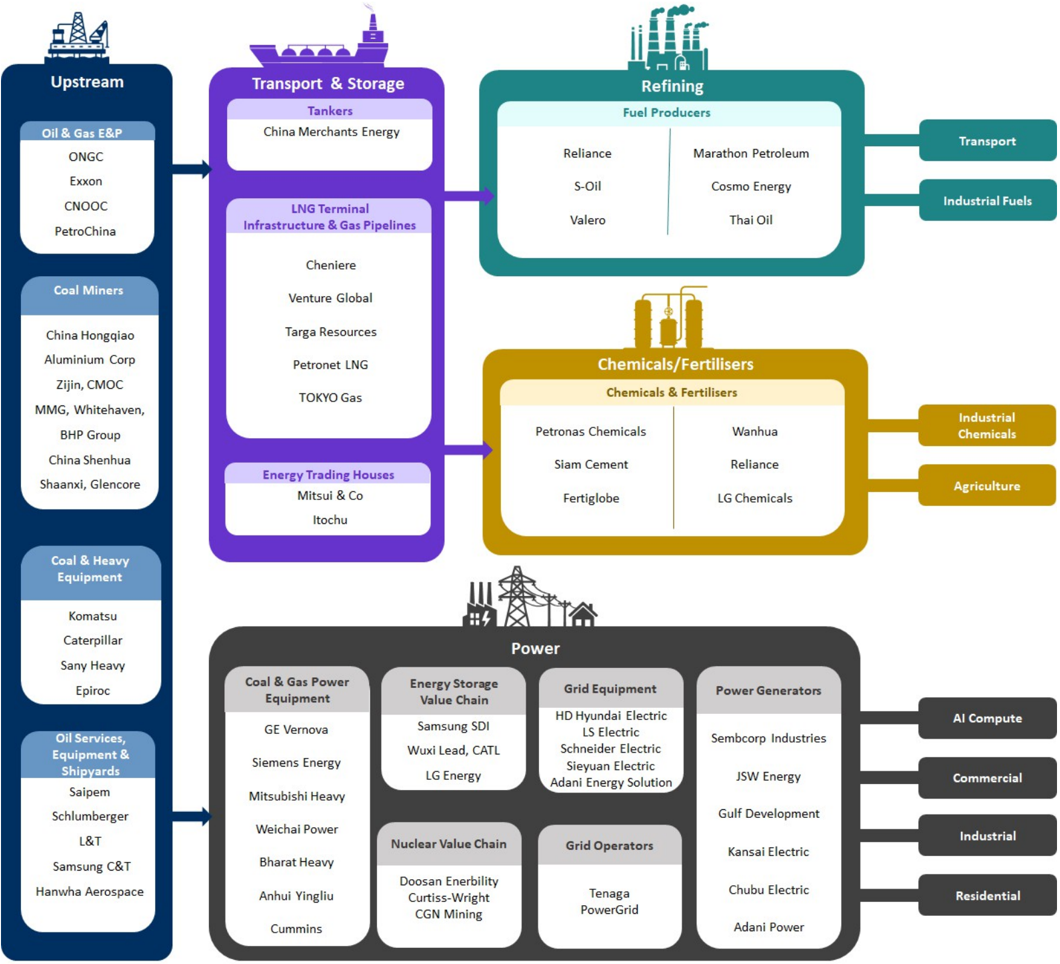
Source: Morgan Stanley Research
Refining
Fuel Producers
Transport
M
Exhibit 24: Energy Security: The Beneficiaries
| Sub-Theme | Why Energy Security Benefits It | What Problem It Solves | Who Benefits Most (Public Equities) | Timing of Benefits |
|---|---|---|---|---|
| Power Infrastructure | Enhances diversification of power generation sources and improves flexibility of system | Transmission congestion, data-center interconnections, renewable curtailment, system stability. | Weichai Power, Mitsubishi Heavy GE Vernova, Siemens Energy; BHEL, Cummins, regulated utilities with transmission capex. | Near-term orders (OEMs) →long-term regulated returns (utilities). |
| Battery Storage | Energy security requires dispatchable power without fuel imports; storage turns intermittent supply into reliable capacity. | Peak demand, grid balancing, renewable intermittency, LNG volatility. | Exide, LG Energy Solution, CATL. | Near-term deployment surge →medium-term manufacturing scale. |
| Strategic Reserves (Oil, Gas, LNG) | Physical availability trumps price during crises; reserves buffer geopolitical shocks. | Supply disruptions, embargoes, price spikes. | Vopak; Indian Oil, Bharat Petroleum, Petrochina | Capacity build-out first →steady utilization over decades. |
| Coal Equipment | Domestic coal provides secure, dispatchable baseload when gas imports are volatile; acts as a bridge while grids and storage mature. | Baseload reliability, fuel import dependence. | BHEL, Doosan Enerbility; Chinese OEMs, Komatsu, Caterpillar | 2025-2030 build cycle; fades post-2030. |
| LNG Infrastructure | Diversification of supply routes and storage reduces dependence on single regions even if spot prices fall. | Import flexibility, regional gas shortages. | Cheniere Energy; Petronet LNG, Mitsui & Co, Marubeni | Near-term U.S. exports →medium-term Asian import/storage. |
| Power Generators (Utilities/IPPs) | Rising electricity demand (AI, electrification) makes reliable generation capacity strategic. | Load growth, 24/7 power for data centers and industry. | Gulf Development, Sembcorp Industries, NTPC, Hokkaido Electric | Immediate demand growth →long-duration rate-base compounding. |
| Renewable Equipment | Energy security pushes scale and domestic supply chains, even if margins fluctuate. | Fuel import reduction, long-term energy independence. | Vestas, Siemens Energy; Chinese OEMs for volume, Dajin Heavy | Medium-term volume growth; margins vary with cycle. |
| Shipping | Energy sourcing divesification leads to longer distances and ened for more crude tankers and LPG ships | Supprts Diversification of energy sourcing | Samsung C&T, COSCO Energy Shipping, Mitsui O.S.K Lines, China Merchants Shipping, Hanwha Aerospace | Starting 2026 |
| Metals | Demand for steel, copper, nickel picks up for new energy infrastructure and power | Power shortages and fuel availability | JSW Steel, BHP Group, Chalco, Jiangxi Copper | Demand pickup already starting to happen |
| Fuel Refiners | Higher fuel consumption help higher diesel, jet fuel, plastics and gasoline margins | Fuel shortages for transportation | Reliance, Thai Oil, S-Oil, PTT Global Chemicals,Valero, Marathon | Fuel Supply tightness started in 2025, gets worse in 2026-2028 |
| Chemicals | Shoratges in Sulphuric acid, urea, DAPandHelium | Crop yields, chips etching, metal ore processing | Siam Cement, PTT Global Chemicals, Mitsui Chemicals, Sinopec, Petronas Chemicals, Deepak Nitrite, Navin Fluorine | Medium term challenge |
Source: Morgan Stanley Research
While we see significant energy security tailwinds across Asia's energy value chain, our bottom-up research highlights several subsectors that look challenged:
Clean power equipment supply chain: China's solar supply chain remains significantly oversupplied with current manufacturing capacity nearly double current global demand. Although we do see a pickup in renewable deployment, the depth of the oversupply, as well as increasing competition from the onshoring of the solar value chain such as in India, will likely challenge profitability in the near to medium term.
Battery components: Similar to China's solar value chain, selected battery components remain in oversupply. Based on our utilization forecasts and assessment of current valuations at a reasonable profitability level, our order of preference is LiPF6 (electrolyte) > separator > LFP cathode > anode > NCM cathode.
Power generators: While we are positive on power generation names, we see challenges in geographies where we see power spread headwinds, limited volume growth and high curtailment of renewables.
M
Exhibit 25: Asia Energy Security: Our 70 Global picks and 18 least preferred
| BBGTickers | CompanyName | Ticker | Market cap, current,USD(MM) 3MADTV, USD(MM) | Rating | Share price, last close Price Target (Local CCY) %Upside fromlast close | Country | MSAnalyst | MSAnalyst |
|---|---|---|---|---|---|---|---|---|
| MostPreferred Integrated Oil Majors | ||||||||
| 883HK 601857CG | CNOOC PetroChina | 0883.HK 601857.SS | 156,765.5 547.1 275,267.5 524.4 | Overweight Overweight | 27.56HKD 28.90HKD 4.9% 11.56 14.70 27.2% | China China | Jack Lu Jack Lu | Jack Lu Jack Lu |
| ONGCIS XOMUN | Oil &NaturalGas Corp. Exxon Mobil Corporation | ONGC.NS XOM.N | 38,715.6 68.5 673,761.2 783.2 | Overweight Overweight | 296.50 363.00 22.4% 157.92 171.00 8.3% United | India States of America | Mayank Maheshwari Devin McDermott | Mayank Maheshwari Devin McDermott |
| Fuel Refiners | ||||||||
| RIL IS | Reliance Industries | RELI.NS | 185,785.3 292.9 | Overweight | 1,322.70 1,803.00 36.3% 110,100.00 130,000.00 18.1% Korea; | India | Mayank Maheshwari | Mayank Maheshwari |
| 010950 KP TOPTB | S-Oil Thai Oil PublicCompany | 010950.KS TOP.BK | 8,323.7 80.6 3,226.5 31.3 | Overweight Overweight | 47.00 58.00 23.4% | Republic (S. Korea) Thailand | Young Suk Shin Mayank Maheshwari | Young Suk Shin Mayank Maheshwari |
| 5021 JP VLOUN | CosmoEnergyHoldings Valero Energy Corporation | 5021.T VLO.N | 3,921.6 22.7 77,980.5 235.8 | Overweight Equal-Weight | 3,774.00 5,250.00 39.1% 262.62 232.00 -11.7% United | Japan States of America | Reiji Ogino Joe Laetsch | Reiji Ogino Joe Laetsch |
| MPCUN | Marathon Petroleum Corp Chemicals& Fertilisers | MPC.N | 76,785.2 187.3 | Overweight | 263.02 233.00 -11.4% United | States of America | Joe Laetsch | Joe Laetsch |
| SCCTB | Siam Cement | SCC.BK | 8,297.5 42.8 11,353.8 26.8 | Overweight | 225.00 270.00 20.0% 5.59 6.24 11.6% | Thailand | Mayank Maheshwari | Mayank Maheshwari |
| PCHEMMK 051910 KP | Petronas Chemicals Group Berha LGChem | PCGB.KL 051910.KS | 16,615.0 93.2 | Overweight Equal-Weight | 374,000.00 430,000.00 15.0% Korea; | Malaysia Republic (S. Korea) | Mayank Maheshwari Young Suk Shin | Mayank Maheshwari Young Suk Shin |
| FERTIGLBDH | FertiglobePLC WanhuaChemical | FERTIGLB.AD 600309.SS | 7,639.7 7.8 36,598.9 473.0 | Overweight Overweight | 3.37AED 3.80AED 12.8% United 81.81 101.00 23.5% | Arab Emirates | Ricardo Rezende KayleeXu | Ricardo Rezende KayleeXu |
| 600309CG | Chemicals& Fertilisers | China | ||||||
| GEVUN ENRGY | GEVernova Siemens EnergyAG | GEV.N ENR1n.DE | 271,890.9 478.1 167,570.6 513.4 | Overweight Overweight | 1,049.23 1,250.00 19.1% United 167.70 200.00 19.3% | States of America Germany | David Arcaro Max Yates | David Arcaro Max Yates |
| 7011 JT | Mitsubishi Heavy Industries | 7011.T | 87,638.8 747.7 | Overweight | 4,126.00 5,500.00 33.3% 401.10 | Japan | Takeshi Kitaura | Takeshi Kitaura |
| BHELIS 000338CS | Bharat Heavy Electricals Ltd WeiChai Power | BHEL.NS 000338.SZ | 14,496.4 59.4 33,000.6 541.3 | Overweight | 444.00 10.7% 33.15 43.00 29.7% | India China | Girish Achhipalia Sheng Zhong | Girish Achhipalia Sheng Zhong |
| 603308CH | Anhui Yingliu Electromechanical | 603308.SS | 7,299.7 233.1 | Overweight Overweight | 73.74 101.20 37.2% | China | TomLi | TomLi |
| CMIUS | CumminsInc Power Generators | CMI.N | 90,998.3 141.5 | Overweight | 696.53 752.00 8.0% United | States of America | Angel Castillo | Angel Castillo |
| GULFTB SCISP | Gulf Development PCL SembCorpIndustries Ltd | GULF.BK | 27,776.9 93.0 | Overweight | 59.75 76.00 27.2% | Thailand Singapore | Mayank Maheshwari Mayank Maheshwari | Mayank Maheshwari Mayank Maheshwari |
| ADANI IS | Adani Power Ltd | SCIL.SI ADAN.NS | 8,559.4 32.5 43,853.7 87.9 | Overweight Overweight | 6.13 7.50 22.3% 221.33 173.00 -21.8% | India | Girish Achhipalia | Girish Achhipalia |
| 9503 JT | Kansai Electric Power | 9503.T | 16,380.3 64.9 | Equal-Weight | 2,333.50 2,800.00 20.0% | Japan | Reiji Ogino | Reiji Ogino |
| 9502 JP JSW IN | Chubu Electric Power JSW Energy Limited | 9502.T JSWE.NS | 13,262.5 49.3 9,718.3 22.6 | Equal-Weight Overweight | 2,715.50 1,960.00 -27.8% 515.05 624.00 21.2% | Japan India | Reiji Ogino Girish Achhipalia | Reiji Ogino Girish Achhipalia |
| 6501 JP | Power GridEquipment Hitachi | 6501.T | 141,181.2 462.3 | 4,812.00 5,200.00 8.1% | Japan | Kazuo Yoshikawa | Kazuo Yoshikawa | |
| 267260 KS 010120 KS | HDHyundai Electric CoLtd | 267260.KS | 26,505.8 121.5 24,527.1 153.2 | Equal-Weight Overweight Overweight | 1,179,000.00 1,500,000.00 27.2% Korea; 259,000.00 240,000.00 -7.3% Korea; | Republic (S. Korea) Republic (S. Korea) | Ryan Kim Ryan Kim | Ryan Kim Ryan Kim |
| 002028CS SUFP | LS Electric Sieyuan Electric Co.Ltd. Schneider Electric | 010120.KS 002028.SZ | 22,425.5 346.0 172,060.5 308.7 | Overweight Overweight | 190.00 286.50 50.8% 263.75 300.00 13.7% | China France | EvaHou Max Yates | EvaHou Max Yates |
| ADANIENSIS | Adani Energy Solutions Limited Power Grid Operators | SCHN.PA ADAI.NS | 16,576.9 37.9 | Overweight | 1,303.60 1,133.00 -13.1% | India | Girish Achhipalia | Girish Achhipalia |
| PWGRIS | Power Grid Corporation of India Tenaga Nasional | PGRD.NS | 28,825.2 47.6 | Equal-Weight | 305.85 295.00 -3.5% 14.54 | India | Girish Achhipalia Mayank Maheshwari | Girish Achhipalia Mayank Maheshwari |
| TNBMK | MetalsandMining | TENA.KL | 21,298.2 25.4 | Overweight | 15.60 7.3% | Malaysia | ||
| 1378HK | China Hongqiao Group Aluminum Corp. of China Ltd. | 1378.HK | 38,911.4 203.0 | Overweight | 31.46HKD 52.90HKD 68.2% 10.93 17.50 60.1% | China China | Hannah Yang Rachel Zhang | Hannah Yang Rachel Zhang |
| 601600CG 2899HK | Zijin Mining Group | 601600.SS 2899.HK | 20,787.9 553.9 25,545.6 304.1 | Overweight Overweight | 35.16HKD 55.00HKD 56.4% | China China | Rachel Zhang | Rachel Zhang |
| 3993HK 1208HK | CMOCGroupLtd MMGLtd | 3993.HK | 8,901.5 131.5 13,907.6 59.0 | Overweight | 18.68HKD 26.30HKD 40.8% 9.57HKD 11.20HKD 17.0% | Australia | Rachel Zhang | Rachel Zhang |
| 1088HK | China ShenhuaEnergy | 1208.HK 1088.HK | 19,306.6 95.3 | Overweight Overweight | 44.76HKD 53.60HKD 19.7% | China | Hannah Yang Hannah Yang | Hannah Yang Hannah Yang |
| 601225CG WHCAU | Shaanxi Coal Industry Whitehaven Coal Ltd | 601225.SS WHC.AX | 34,773.7 182.6 4,816.6 37.2 | Overweight Overweight | 24.39 30.00 23.0% 8.15 9.55 17.2% | China Australia | Hannah Yang Rahul Anand | Hannah Yang Rahul Anand |
| GLENLN BHPAU | GlencorePLC BHPGroupLtd | GLEN.L | 88,672.5 294.4 | Overweight | 562.50GBp 610.00GBp 8.4% | Switzerland | Alain Gabriel | Alain Gabriel |
| Heavy Equipment& Services | BHP.AX | 213,745.6 390.8 | Overweight | 58.70AUD 67.50AUD 15.0% | Australia | Rahul Anand | Rahul Anand | |
| CATUS | Caterpillar Inc | CAT.N | 396,178.2 498.9 | Equal-Weight | 860.15 915.00 6.4% United 6,346.00 5,400.00 -14.9% | States of America Japan | Angel Castillo Lisa Jiang | Angel Castillo Lisa Jiang |
| 6301 JT 600031CG CMIUS | Komatsu Sany Heavy Industry Co., Ltd. CumminsInc | 6301.T 600031.SS | 37,171.5 170.0 24,064.8 243.1 | Overweight Overweight | 19.31 28.00 45.0% 696.53 United | China | Sheng Zhong | Sheng Zhong |
| EPIASS | EpirocAB | CMI.N | 90,998.3 141.5 22,845.8 49.3 | Overweight | 752.00 8.0% 260.10 300.00 15.3% | States of America | Angel Castillo | Angel Castillo |
| LNGUN | Gasinfrastructure Cheniere Energy Inc | EPIRa.ST | Overweight | 308.00 24.8% | Sweden | Max Yates | Max Yates | |
| VGUS TRGPUN | Venture Global Inc | LNG.N | 51,711.1 178.1 36,718.8 65.0 | Overweight Overweight | 246.77 United 14.78 22.00 48.8% United | States of America States of America | Devin McDermott Devin McDermott | Devin McDermott Devin McDermott |
| 9531 JT | Targa Resources Corp. TOKYOGAS | VG.N | 59,284.6 105.2 | Overweight | 276.20 331.00 19.8% United | States of America | Robert Kad Reiji Ogino | Robert Kad Reiji Ogino |
| PLNGIS | PetronetLNG Batteries | TRGP.N 9531.T PLNG.NS | 14,127.6 59.7 | Equal-Weight Equal-Weight | 6,699.00 5,290.00 -21.0% 265.15 276.00 4.1% | Japan India | Mayank Maheshwari | Mayank Maheshwari |
| 3750HK 006400 KP | Contemporary Amperex Technolo SamsungSDI | 3750.HK | 4,128.1 15.1 | Overweight | 680.00HKD 815.00HKD 19.9% | China | Jack Lu Young Suk Shin | Jack Lu Young Suk Shin |
| 373220 KP | LGEnergy Solution | 006400.KS 373220.KS | 18,400.1 339.6 31,765.1 305.2 62,853.8 125.9 | Overweight Equal-Weight | 614,000.00 850,000.00 38.4% Korea; 417,000.00 500,000.00 19.9% Korea; | Republic (S. Korea) | Young Suk Shin | Young Suk Shin |
| 300450CS | Wuxi Lead Intelligent Nuclear Value Chain | 300450.SZ | 11,734.7 418.0 | Overweight | 52.20 87.00 66.7% | Republic (S. Korea) China | Sheng Zhong | Sheng Zhong |
| 1164HK | CGNMiningCoLtd Curtiss-Wright Corp. | 1164.HK | 3,145.0 27.0 | 3.24 4.60 42.0% | HongKong | Chris Jiang | Chris Jiang | |
| CWUN 034020 KS | Doosan Enerbility | CW.N 034020.KS | 26,041.7 66.6 45,595.5 366.0 | Overweight Overweight Overweight | 704.95 760.00 7.8% United 106,000.00 110,000.00 3.8% Korea; | States of America Republic (S. Korea) | Kristine Liwag HeewonChoi | Kristine Liwag HeewonChoi |
| SPMIM | Oil Services &Logistics Saipem | SPMI.MI | 10,343.3 162.6 | Overweight | 4.45 4.90 10.2% | Guilherme Levy | Guilherme Levy | |
| SLBUN LT IS | SchlumbergerNV Larsen &Toubro Ltd | SLB.N LART.NS | 84,874.4 208.3 55,987.3 156.9 | Overweight | 56.77 57.00 0.4% United | Italy States of America | Joe Laetsch Girish Achhipalia | Joe Laetsch Girish Achhipalia |
| 8001 JT | Itochu | 8001.T | 98,812.4 201.7 | Overweight Overweight Overweight | 3,921.00 4,968.00 26.7% 1,980.50 2,400.00 21.2% | India Japan | Yu Shirakawa | Yu Shirakawa |
| 8031 JT 012450 KS 028260 KP | Mitsui &Co. HanwhaAerospace SamsungC&T | 8031.T 012450.KS | 105,961.8 304.1 44,528.5 257.7 | Overweight Overweight | 5,875.00 5,500.00 -6.4% 1,286,000.00 1,800,000.00 40.0% Korea; 380,500.00 | Japan Republic (S. Korea) | Yu Shirakawa Joon Seok | Yu Shirakawa Joon Seok |
| 028260.KS | 41,435.7 118.3 | 340,000.00 -10.6% Korea; | Republic (S. Korea) | HeewonChoi | HeewonChoi | |||
| 601872CG | China Merchants Energy Shippin | 601872.SS | 20,756.3 520.0 | 17.48 25.10 43.6% | China | |||
| Least Preferred | Overweight | Qianlei Fan | Qianlei Fan | |||||
| 002459CS | CleanPower Equipment JA Solar TechnologyCoLtd | 002459.SZ | 4,959.7 130.6 10,665.7 144.6 16,983.8 459.6 5,802.5 19.6 | Equal-Weight Equal-Weight | 10.37 13.98 34.8% | China China | EvaHou EvaHou | EvaHou EvaHou |
| 600438CG 601012CG 868HK | Tongwei Co. Ltd. LONGi Green Energy Technology Xinyi Glass Holding Limited Batteries | 600438.SS 601012.SS 0868.HK 300014.SZ | 20,934.0 737.3 | Underweight Underweight | 16.25 21.85 34.5% 15.60 14.01 -10.2% 10.39HKD 8.40HKD -19.2% | China HongKong | EvaHou Hannah Yang | EvaHou Hannah Yang |
| 300014CS 002074CS | EVE EnergyCoLtd Gotion High Tech CoLtd | 002074.SZ | 9,518.8 275.5 | 65.78 36.13 | 46.00 -30.1% | China China | Jack Lu | Jack Lu |
| 002709CS 603659CG | Guangzhou Tinci Materials Techn Shanghai Putailai NewEnergyTec | 002709.SZ | 16,320.5 793.4 | Equal-Weight Equal-Weight Equal-Weight | 20.00 -44.6% 57.54 49.00 -14.8% | China | Jack Lu Jack Lu | Jack Lu Jack Lu |
| 688005CH | Ningbo Ronbay NewEnergyTech | 603659.SS 688005.SS | 9,871.4 312.6 3,602.0 130.2 | Underweight 32.21 Underweight 34.91 | 20.00 -37.9% | China | Jack Lu Jack Lu | Jack Lu Jack Lu |
| PLSAU | 13,664.3 93.5 | Equal-Weight 6.01 | 13.00 -62.8% | China | Rahul Anand | Rahul Anand | ||
| IGOAU | PLS Group Ltd IGOLtd | PLS.AX | Underweight 8.51 | 5.60 -6.8% | Australia Australia | Rahul Anand | Rahul Anand | |
| Power Generators | IGO.AX | 4,476.9 21.6 | 6.85 -19.5% | |||||
| AGLAU | AGLEnergy Ltd | AGL.AX | 4,401.5 18.5 | Underweight 9.09 | 9.28 2.1% | Australia | Rob Koh Rob Koh | Rob Koh Rob Koh |
| ORGAU 600011CG | Origin Energy Ltd. HuanengPower International Inc | ORG.AX 600011.SS | 14,283.4 36.0 12,647.4 143.7 | Underweight 11.49 Underweight 7.53 | 11.00 -4.3% | Australia China | EvaHou | EvaHou |
| 916HK | China Longyuan Power Group | 0916.HK | 2,868.6 30.9 | Equal-Weight 6.75HKD | 5.17 -31.3% | China | EvaHou | EvaHou |
| 9513 JP | Electric Power Development | 9513.T | 7.50HKD 11.1% | Japan | Reiji Ogino | Reiji Ogino | ||
| Global Power SynergyPCL | GPSC.BK | 4,798.4 33.8 3,314.5 13.2 | Underweight 4,266.00 Underweight 38.50 | 2,290.00 -46.3% 36.00 -6.5% | Thailand HongKong | Mayank EvaHou | Mayank EvaHou | |
| GPSCTB 836HK | China Resources Power | |||||||
| -1.5% | ||||||||
| 19.80 | ||||||||
| 0836.HK | ||||||||
| 35.6 Equal-Weight 20.10 | ||||||||
| 13,500.8 | ||||||||
| Maheshwari |
Source: Refinitiv, Morgan Stanley Research estimates
M
US$9 trillion of Value Creation: Learnings from Power's Re-rating
You can't legislate energy. You can't just, you know, pass a law and suddenly have a lot of energy…. We probably will just have energy, power generation as the de facto currency - Elon Musk
We believe energy equities could re-rate like power equities did from 2023 ( Exhibit 30 ). The similarities from an investment cycle perspective are hinged on security of supply; however, power also had a tailwind of consumption from a power AI narrative, which we believe has now broadened out to the larger energy complex. Industrial, shipyard and equipment players are likely to benefit the most, followed by energy producers and companies helping to solve bottlenecks, such as fuel refiners, and coal-based power and miners.
Exhibit 26: Global DC power demand is growing along with total GPU power...
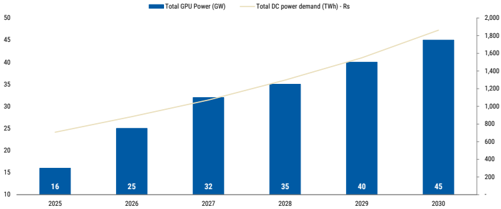
Source: Morgan Stanley Research estimates
How power re-rated across the value chain
Tight power markets globally catalyzed by powering AI and onshoring of supply chains drove a narrative of demand-led power system reliability , which saw the power sector and related value chain that helped reduce power constraints re-rate significantly. Power consumption growth accelerated globally in 2024, and in Asia it increased by ~50bps for the first time in a decade. This led to a 20-75% rise in multiples and 20-50% earnings upgrades across the power supply chain - across power equipment, power grid, power generation and IPPs - between 2024-26, a re-rating that continues and has surprised most, especially as AI adoption saw energy/ power become a key bottleneck to adoption. We think the rest of energy sector will see a similar multiple re-rating as investors see the tightness in downstream fuel, fertilizer and chemical supply chains.
Exhibit 27: ...which catalyzed the re-rating of power and related equities globally
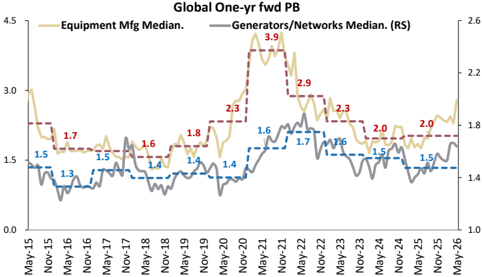
Source: Morgan Stanley Research
M
Exhibit 28: Equipment manufacturers re-rated as power sector capex expectations rose
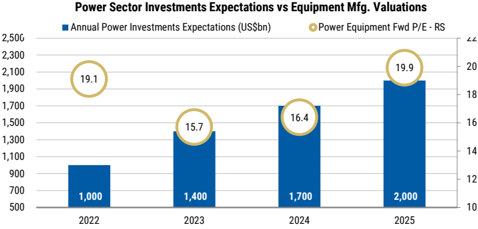
Source: IEA, Refinitiv, Morgan Stanley Research
Traditional energy valuations in the past decade
Traditional energy equities have seen valuation multiples unchanged over the past decade as investments declined and the risk to fossil fuel consumption rose with competition from alterative fuels/renewables rising, as well as policy headwinds. We expect this to reverse in the coming five years and see a 20-30% re-rating, with the runway to traditional energy consumption becoming a lot longer, helping to improve multiples. policy makers will also likely be supportive in growing fossil fuels as part of the primary energy mix.
Exhibit 30: As energy security comes in play again, integrated and fossil power operators have seen a re-rating
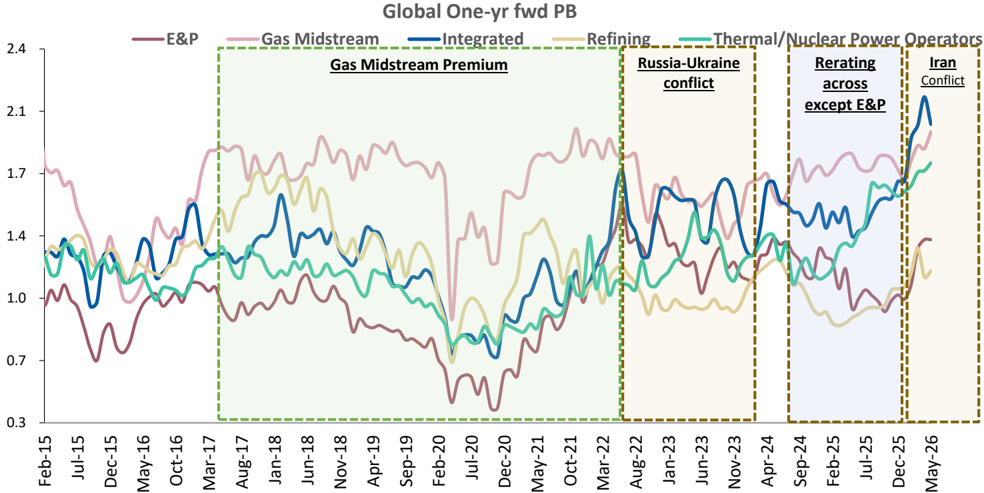
Source: Refinitiv, Morgan Stanley Research estimates
Exhibit 29: Baseload power operators have re-rated as expectations of power demand inflected
Power Demand Growth vs Operator Valuations
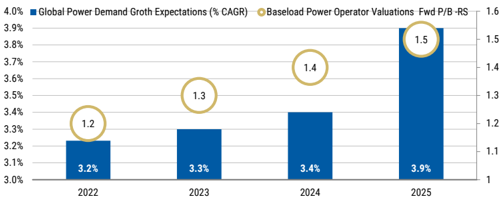
Source: IEA, Refinitiv, Morgan Stanley Research
M
Reliability drives a re-rating event
Powering AI was fundamentally a reliability story , and this is how we see energy shaping out in the coming years: Hyperscalers needed 24/7 uptime, which tightened power markets significantly at a time when grid and baseload investments were already lagging. Hyperscalers also proved that they were willing to pay a premium for power and for speed to market. This accelerated grid capex and rerated the power equipment value chain (e.g., transformers, switch gear, turbines, EPC) as bottlenecks emerged.
Energy security has the same reliability narrative. The IEA explicitly flags that 'energy security takes center stage' and highlights new vulnerabilities (fuel supply risks plus electricity sector exposure to cyber, operational, and weather hazards). We believe markets will start valuing resilience as a strategic asset ( Exhibit 34 ), and that capex will become less discretionary and more mandatory, driving a new investment cycle ( Exhibit 31 ). Furthermore, where powering AI is concentrated in several economies in Asia, energy security becomes a thematic involving all economies in Asia, especially as Asia experiences its worst energy shock in 50 years.
A key difference between energy security and powering AI previously, is that energy security is a risk-led investment cycle compared to powering AI, which is a demand-led investment cycle. Risk -led themes often produce broader and stickier re-ratings, because they reduce the probability of high impact tail-risk outcomes (e.g., blackouts, rationing, price spikes, policy intervention; Exhibit 30 ). In addition, an energy-security-driven investment cycle is more inelastic.
Exhibit 31: Powering AI and on-shoring of supply chains drove a demand inflection that exacerbated power market tightness at a time when baseload power had seen a decade of underinvestment
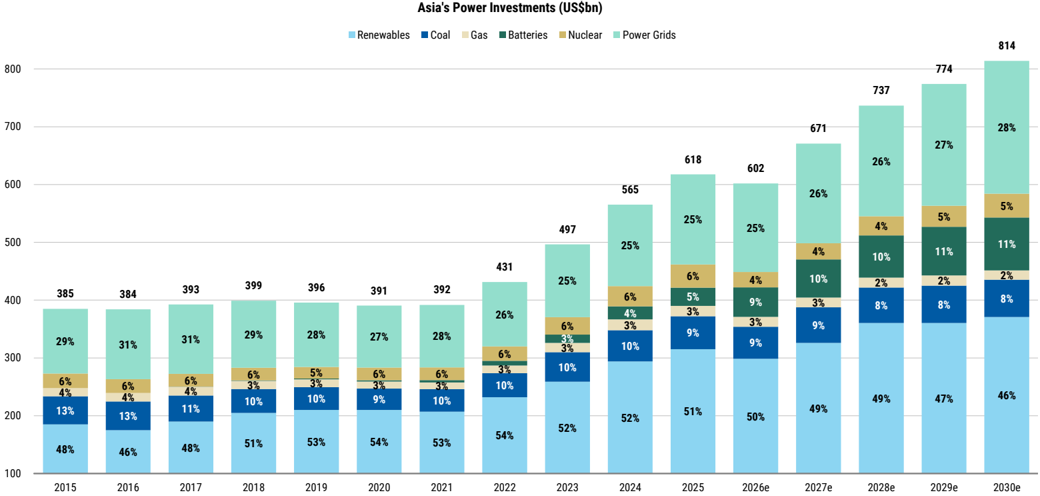
Source: IEA, Morgan Stanley Research (e) estimates
M
Exhibit 32: Energy security in Asia: US$1.2trn in new energy investments
Exhibit 33: Energy: Where will Asia invest by 2030?
Source: Company data, Morgan Stanley Research estimates
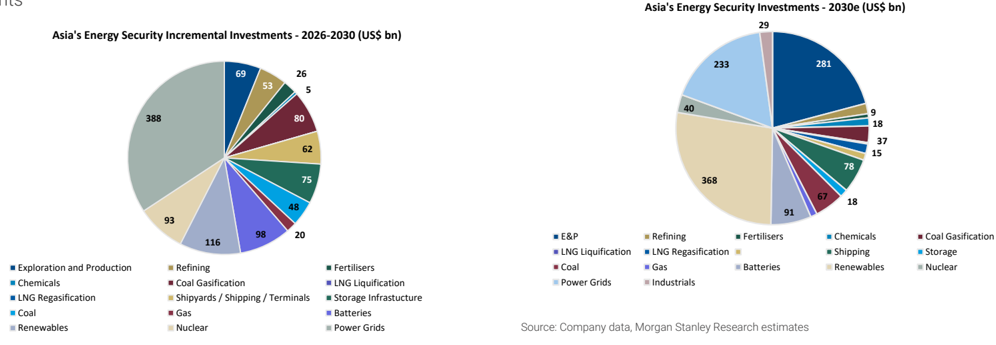
Source: Company data, Morgan Stanley Research estimates
Exhibit 34: Renewable power generators have started to re-rate globally as investors price in a more diversified energy mix
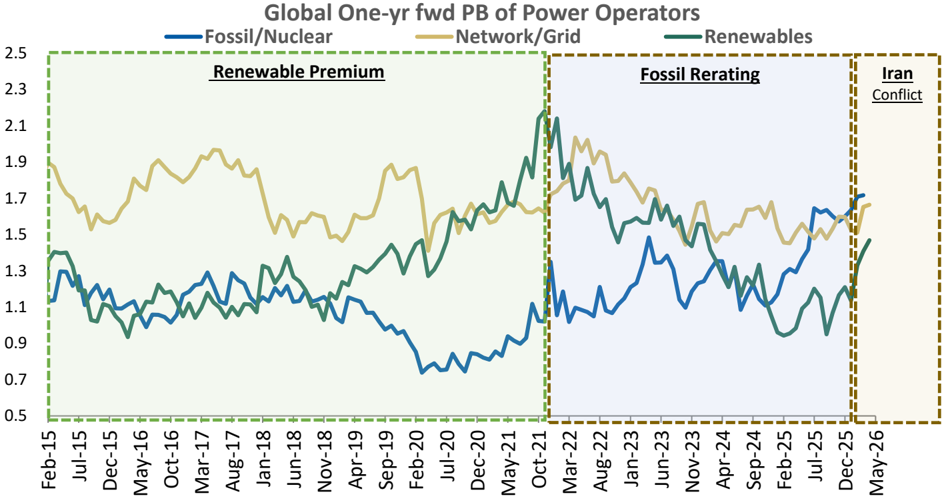
Source: Refinitiv, Morgan Stanley Research
M
Asia's Competitive Reinvention of Energy Security - A Strategy Perspective
Daniel Blake, Kristal Ji, Ehsernta Fu
There is a powerful intersection of three of our core themes, Multipolar World , Future of Energy and AI & Tech Diffusion . We use our thematic frameworks to identify underappreciated upside across the energy supply chain.
We also make the case for a broadening of investor positions beyond the crowding in Compute bottlenecks, into less-favoured Commodities and select Capital Goods. This dovetails perfectly with the opportunities identified in this Bluepaper on Energy Security.
Exhibit 35: Asia-EM P/B vs. Trailing ROE & change since 2022 - Strong uplift in profitability for Capital Goods, Commodities and Banks, offering potential to broaden out from crowded exposures to Compute
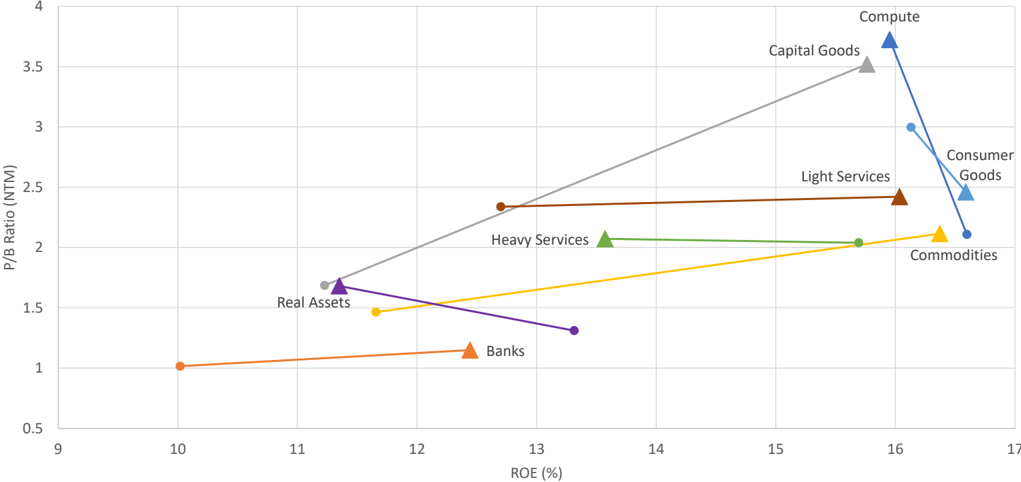
Source: FactSet, Morgan Stanley Research; Shows median stock in each economic exposure category, as of end 2022 and 7 May 2026
Prefer Dependable Energy & Related Value Chain
The energy security theme has created significant valuation dispersion across the value chain. Metals & Mining stands out as the clear winner with the best combination of low valuation, exceptional growth, and strong returns. Traditional energy (Oil Majors, Coal) and Shipping & Shipyards offer deep value and strong income growth, while we also see opportunities in Batteries and Wind Power Equipment ( Exhibit 37 ).
Meanwhile, the energy transition and Powering AI darlings in the Nuclear Value Chain, Power Gen Equipment and Power Grid Equipment have become expensive after their run and we advise careful stock selection amongst these cohorts.
The Energy Supply Chain - Where Growth Is Not Yet Priced In
We used our thematic strategy frameworks to assess relative opportunities and valuations across the Asia energy value chain. Using the assignments and constituents in Exhibit 25 , we constructed equalweighted groups. The analysis below presents consensus forecasts for the equal-weighted average company in each group.
M
Exhibit 36: Growth and Valuations for Energy Security Groups
| Growth CAGR (CY2/0) | Growth CAGR (CY2/0) | 12m Forward Valuations | 12m Forward Valuations | 12m Forward Valuations | 12m Forward Valuations | ||
|---|---|---|---|---|---|---|---|
| Sales | EPS | P/E | P/B | 2yr PEG | EV/EBITDA | ||
| Shipping and Shipyards | Level 10yr %'ile | 10.5% | 36.6% | 11.3x 44% | 2.1x 98% | 0.3x | 13.3x 97% |
| Oil Services | Level 10yr %'ile | 6.6% | 18.0% | 16.9x 46% | 2.2x 99% | 0.9x | 9.5x 55% |
| Batteries | Level 10yr %'ile | 22.4% | 35.5% | 25.1x 58% | 2.8x 48% | 0.7x | 13.7x 87% |
| Wind | Level 10yr %'ile | 20.8% | 47.2% | 20.2x 95% | 3.8x 99% | 0.4x | 13.1x 94% |
| Metals and Mining | Level 10yr %'ile | 10.9% | 32.5% | 9.6x 22% | 1.8x 94% | 0.3x | 6.0x 18% |
| Power Grid Operators | Level 10yr %'ile | 2.4% | 3.9% | 16.4x 91% | 1.5x 99% | 4.2x | 7.3x 77% |
| Power Grid Equipment | Level 10yr %'ile | 14.2% | 26.5% | 32.8x 100% | 6.9x 97% | 1.2x | 23.0x 100% |
| Power Generators | Level 10yr %'ile | 7.7% | 8.8% | 12.9x 86% | 1.8x 98% | 1.5x | 11.3x 94% |
| Power Generation Equipment | Level 10yr %'ile | 11.3% | 30.3% | 32.2x 91% | 5.6x 98% | 1.1x | 17.7x 91% |
| Chemicals & Fertilisers | Level 10yr %'ile | 8.0% | 19.3% | 19.2x 82% | 1.8x 41% | 1.0x | 8.6x 64% |
| Integrated Oil Majors | Level 10yr %'ile | 5.6% | 12.3% | 8.9x 34% | 1.2x 91% | 0.7x | 4.4x 60% |
| Fuel Refiners | Level 10yr %'ile | 4.2% | 8.8% | 8.5x 27% | 1.1x 44% | 1.0x | 5.7x 20% |
| Nuclear Value Chain | Level 10yr %'ile | 10.6% | 42.7% | 35.7x 93% | 4.5x 95% | 0.8x | 22.9x 97% |
| Coal Miners | Level 10yr %'ile | 7.4% | 14.3% | 10.4x 71% | 1.5x 95% | 0.7x | 5.2x 72% |
| Heavy Equipment & Services | Level 10yr %'ile | 8.2% | 22.2% | 16.8x 62% | 2.4x 72% | 0.8x | 10.5x 74% |
| Midstream Gas Pipelines and LNG Infrastructure Owners | Level 10yr %'ile | 8.5% | 10.5% | 14.6x 53% | 1.6x 6% | 1.4x | 7.6x 39% |
| LNG Export Infrastructure | Level 10yr %'ile | 6.9% | 12.8% | 16.3x 52% | 3.0x 32% | 1.3x | 10.7x 42% |
| Energy & Commodity Traders | Level 10yr %'ile | 4.6% | 10.8% | 15.7x 98% | 2.1x 99% | 1.4x | 16.1x 97% |
| Least Preferred | Level | 8.4% | 10.7% | 17.6x | 2.0x | 1.6x | 11.0x |
| 10yr %'ile | 82% | 83% | 95% |
Source: FactSet, Morgan Stanley Research.
Note on colour coding: Sales/EPS Growth shading compares across groups from 0% (white) to highest (dark blue); Latest Valuations and 10yr percentile shading compares across baskets from cheapest (dark blue) to most expensive (dark red); Group level valuation and performance metrics are calculated based on median of constituents; Data as of May 14, 2026. Past performance is not guarantee of future returns.
Least Preferred: Selected clean power equipment manufacturers and power generators
M
Valuations and Growth Outlook
Exhibit 37 shows the historical valuations of 12mf P/E ratios from January 2015. We see cheap relative and historical valuations for Metals & Mining, Fuel Refiners and Integrated Oil Majors. In contrast, the Nuclear Value Chain, Energy & Commodity Traders, Power Gen Equipment and Power Grid Equipment all look relatively expensive.
Exhibit 37: 12mf PE valuation range - Cheap relative & historical valuations for Metals & Mining, Fuel Refiners and Integrated Oil Majors
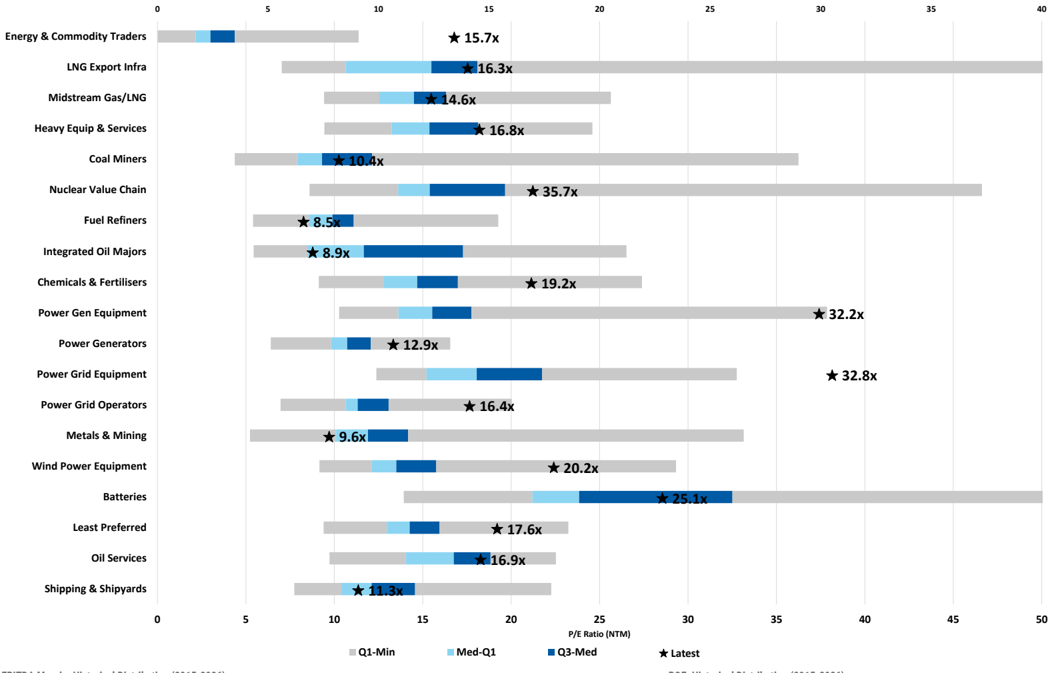
EBITDA Margin: Historical Distribution (2015-2026)
Source: FactSet, Morgan Stanley Research
ROE: Historical Distribution (2015-2026)
M
Overlaying the near-term growth outlook, we see the best opportunities ( Exhibit 38 ) in Metals & Mining, Batteries, Wind Power Equipment and Shipping & Shipyards . Power Grid Equipment & Operators and Power Generators have relatively expensive valuations for their growth outlook, while the Nuclear Value Chain offers strong net income growth at rich multiples.
Exhibit 38: N12M P/E Ratio vs Net Income Growth - Attractive valuations for Metals & Mining, Shipping/Shipyards, Coal Miners, Fuel Refiners & Oil Majors
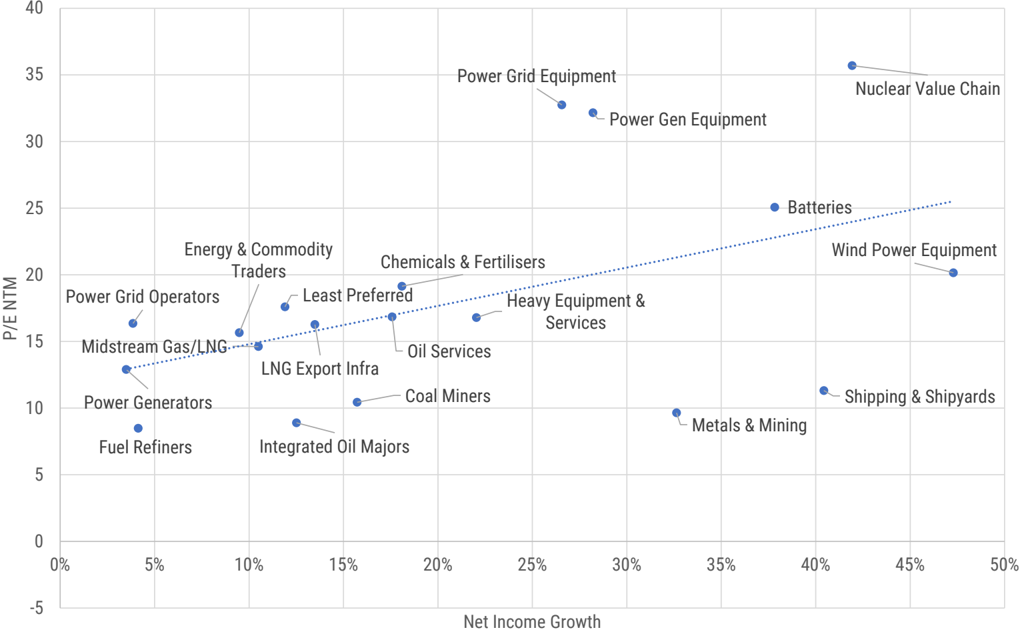
Source: FactSet, Morgan Stanley Research
250
230
210
190
170
150
130
110
90
70
2024
LNG Export Capacity (mtpa)
M
CCL Midscale 8 & 9
US Energy = Asia's Supply Chain Diversification
Golden Pass
Asia imported only ~10% of its energy imports from US in 2025. We see the US's share in Asia's energy imports rising as cheaper natural gas, ethane, propane, coal and petcoke supports adoption and diversification in power and chemical supply chains, while increased diesel imports help lower dependence on the Strait of Hormuz.
Natural Gas
On the cusp of a new growth cycle. After a multi-year pause, the US gas market is now on the cusp of another cycle of demand growth, driven by liquefied natural gas (LNG) exports and rising electricity consumption. At the same time, constraints on supply from a maturing industry and pipeline bottlenecks make this next growth cycle look different than history.
Exhibit 39: LNG feedgas demand growth is accelerating (MSe +3.7 bcf/d in 2026) as the next wave of capacity adds start to come online…
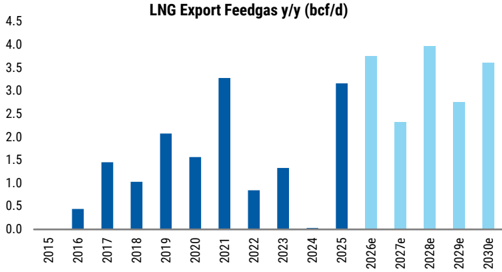
Source: EIA, Company Data, S&P Global Platts, Bentek, Morgan Stanley Research estimates
BluePaper
US LNG export capacity is set to more than double. 2025 was been a record year for final investment decisions (FIDs) in new US LNG export projects, with 60 mtpa advancing - boosting an already strong backlog of projects under construction by another ~70%. In total, US export capacity should expand from ~114 mtpa in 2025 to ~225 mtpa by 2030, helping fuel rising consumption in Asia. Further FIDs (final investment decisions) are still possible, and would be additive to this growth and support Asia's energy needs.
Exhibit 40: …US LNG export capacity is set to increase by ~112 mtpa relative to Apr '26 levels (and +118 mtpa relative to end-25 baseline). More FIDs would add to this figure.
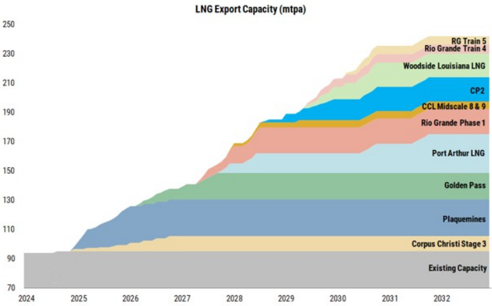
Source: EIA, Company Data, S&P Global Platts, Bentek, Morgan Stanley Research estimates
M
After ~15 years of stagnation, electricity consumption is starting to grow. This is tied to the combination of data centers (including GenAI), onshoring of manufacturing, and a broader trend of electrification. Our Utilities team forecasts a ~2.6% CAGR over the next
decade. Net of expected renewables additions, we forecast power sector gas demand will rise by 7-8 bcf/d over the balance of the decade.
Exhibit 41: We forecast gas demand from the power sector will continue to grow, with erosion from renewables more than offset by coal retirements and rising electricity consumption.
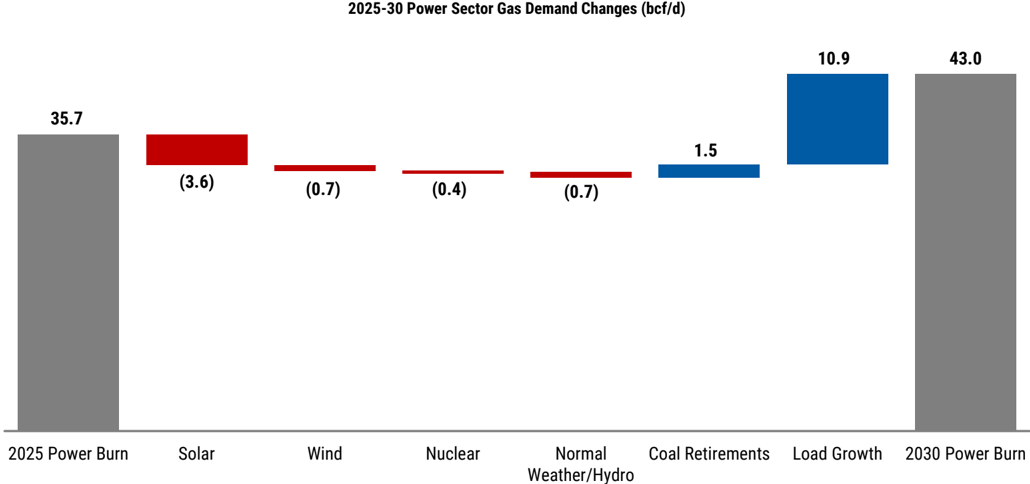
Source: EIA, S&P Global Commodity Insights, Morgan Stanley Research estimates
Exhibit 42: Assuming no policy changes or new LNG final investment decisions, we expect US gas demand to rise to ~140 bcf/d by 2030, up from ~113 bcf/d in 2025.
| Bcf/d | Actual | Actual | Actual | Actual | Actual | Actual | Actual | Actual | Actual | Forecast | Forecast | Forecast | Forecast | Forecast | Forecast | Forecast |
|---|---|---|---|---|---|---|---|---|---|---|---|---|---|---|---|---|
| 2016 | 2017 | 2018 | 2019 | 2020 | 2021 | 2022 | 2023 | 2024 | 2025 | 2026 | 2027 | 2028 | 2029 | 2030 | 2025-2030 | |
| Total US | 78.8 | 80.1 | 89.8 | 95.1 | 95.2 | 99.4 | 104.4 | 107 | 108.2 | 113.3 | 116.2 | 120.4 | 126.6 | 132.5 | 139.8 | 26.5 |
| Residential/Commercial | 20.3 | 20.7 | 23.3 | 23.4 | 21.3 | 22 | 23.2 | 21.5 | 21 | 23.2 | 21.9 | 22.5 | 22.5 | 22.5 | 22.5 | (0.7) |
| Industrial | 21.1 | 21.8 | 23.1 | 23.1 | 22.4 | 22.9 | 23.2 | 23.3 | 23.3 | 23.5 | 23.3 | 23.6 | 23.9 | 24.2 | 24.5 | 1.0 |
| Power | 27.2 | 25.3 | 28.9 | 30.8 | 31.7 | 30.7 | 33 | 35.3 | 36.7 | 35.7 | 36 | 36.4 | 37.8 | 40.1 | 43 | 7.3 |
| Net LNG Exports | 0.3 | 1.7 | 2.8 | 4.8 | 6.4 | 9.7 | 10.5 | 11.9 | 11.9 | 15.1 | 18.8 | 21.1 | 25.1 | 27.9 | 31.5 | 16.4 |
| Mexico Exports | 3.8 | 4.2 | 4.6 | 5.1 | 5.4 | 5.9 | 5.7 | 6.1 | 6.4 | 6.6 | 6.8 | 7 | 7.2 | 7.4 | 7.6 | 1.0 |
| Pipeline/Lease/Plant fuel | 6.2 | 6.5 | 7.2 | 7.9 | 7.9 | 8.3 | 8.8 | 8.9 | 9 | 9.3 | 9.3 | 9.8 | 10.1 | 10.4 | 10.7 | 1.5 |
Source: EIA, Morgan Stanley Research estimates
M
We forecast global LNG demand will rise at a 6% CAGR 2025-30, driven by Asia. After increasing over the last few years, Europe's share of global LNG imports should fall from >30% in 2025 to <25% by 2030. For Asian consumers, US LNG offers attractive supply diversification and pricing relative to other sources - offering greater stability during periods of supply disruption. We expect the bulk of volumes from export projects currently under construction to flow to end-markets in Asia. In addition, on the back of recent events in the Middle East, we see the potential for additional long-term gas sales deals from Asian buyers - reducing cash flow variability and potentially supporting more growth from US exporters like Venture Global and Cheniere .
Exhibit 43: The US is on track to expand its share of global LNG capacity from ~20% to ~35% by 2030, positioning it as the key marginal supplier.
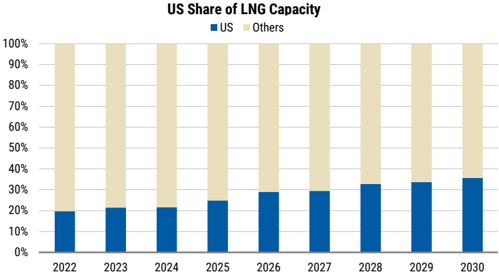
Source: Vortexa, Morgan Stanley Research
US Fuel Refiners
Growing Asia refined product demand tightens global balances and supports margins. Growing refined product demand across Asia is constructive for US refiners, particularly those with Gulf Coast exposure and access to export markets. As Asia consumption outpaces regional refining capacity additions (see Fuel: A New Refinery Needed Every Year ) - driven by sustained transportation growth and petrochemical feedstock demand - incremental barrels will need to be sourced from the global market. As shown by the recent Middle East conflict, the US Gulf Coast is well equipped to be the world's swing refining center, filling gaps left by declining product volumes from key Asian and Middle Eastern exporters. US refined product exports hit all-time highs in month-to-date in May at ~4,250 kbpd.
Exhibit 44: Since the start of the Middle East conflict, shipments to Asia have made up a higher share of total US LNG exports - rising from ~15% prior to ~35% in May so far.
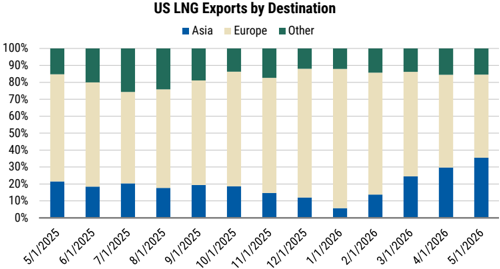
Source: Vortexa, Morgan Stanley Research
US refiners are well positioned from a crude, natural gas, and infrastructure standpoint. US Gulf Coast refiners are among the most competitive suppliers globally, benefiting from advantaged crude sourcing (US, Canada, LatAm), cheap relative natural gas costs, high conversion complexity, and extensive export infrastructure. While US refined product exports are largely concentrated in the Atlantic basin (only ~10% of exports land in Asia), higher Asian consumption should support tighter balances and margins globally. Key stock picks include: VLO and MPC .
M
Exhibit 45: The US exports ~3,240 kbpd of refined product, of which ~10% lands in Asia. The Iran conflict has pushed exports to >4 mbpd…
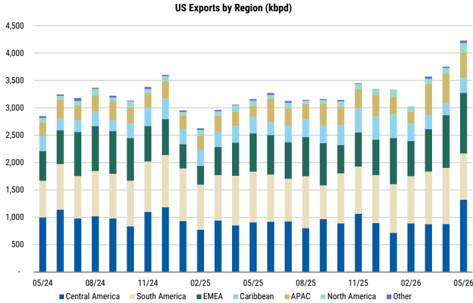
Source: Vortexa, Morgan Stanley Research
Exhibit 47: The US exports ~320 kbpd of refined product to Asia, of which ~30% lands in South Korea…
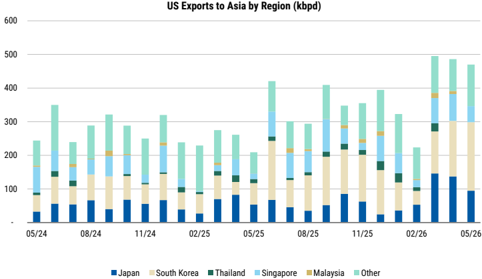
Source: Vortexa, Morgan Stanley Research
Exhibit 49: US refiners source ~90% of feedstock from North America and LatAm.
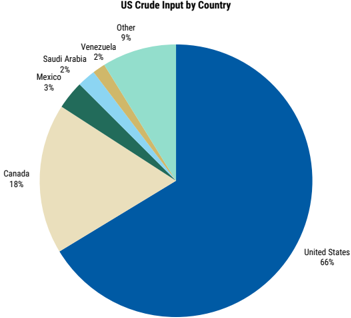
Note: 2024 data. Source: Wood Mackenzie, Morgan Stanley Research
BluePaper
Exhibit 46: ...With diesel/gasoil consisting of ~40% of total product exports.
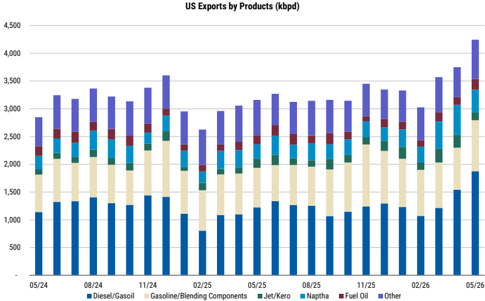
Source: Vortexa, Morgan Stanley Research
Exhibit 48: …With naptha and fuel oil making up ~50% of total product exports to Asia.
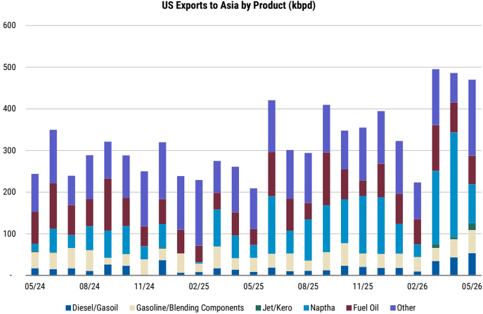
Source: Vortexa, Morgan Stanley Research
Exhibit 50: US refiners have benefited from low natural gas prices relative to the rest of the world. In 2026 YTD, Global gas prices (TTF) averaged ~$11/mmbtu higher than US Henry Hub prices equating to a ~$3-4/bbl cost advantage.
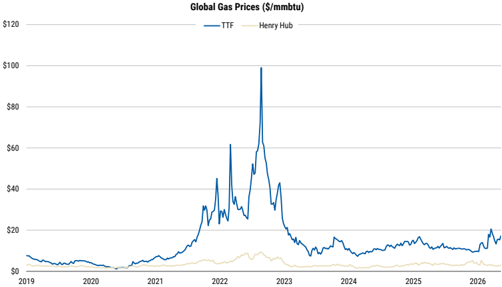
Source: Bloomberg, Morgan Stanley Research
cambI91. Uo uala cellel vowel uelllallu camble or onlortal ' power lur vo uala bellero
Potential Shortfall in Power for US Data Centers, 2025-28
90
80
70
60
80
M
US power bottlenecks and Asia's data center need for power
Solution #1: Nat Gas Turbines
50
40
oc
15
(gL)
Our latest Intelligence Factory model shows a power bottleneck between 2025 and 2028 totaling 55 gigawatts (GW) ( Exhibit 51 ). Even after we factor in all innovative "time to power" solutions (including Bitcoin site conversions), we project that US data center
Net Shortfall Through 2028
Exhibit 51: US data center power demand
developers will face a net power shortfall of 14-24GW through 2028, equal to 18-30% of needed power ( Exhibit 52 ). This we believe will be a capacity that Asia will power over and above its own power needs for AI. We derive that power-shortfall estimate by comparing the power required to support Morgan Stanley's AI chip forecasts through 2028 with both announced US data center capacity under construction and our estimate of available US grid capacity.
None
30%
18%
We believe the most likely outcome
| (55) | |
|---|---|
| US Power Needed. 2025-28 US DCs Under Construction | Potential Shortfall |
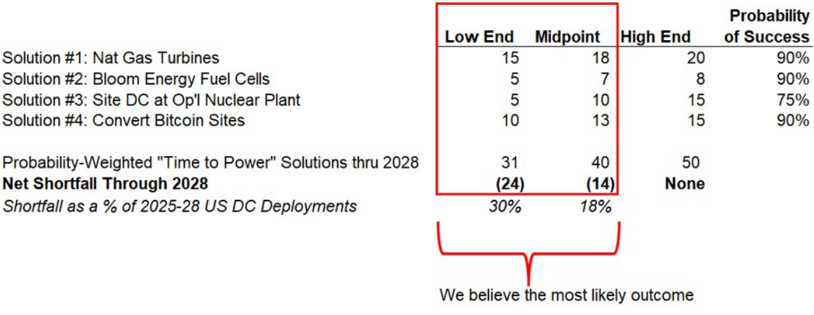
Source: Morgan Stanley Research Estimates
Exhibit 52: Shortfall in power for US data centers
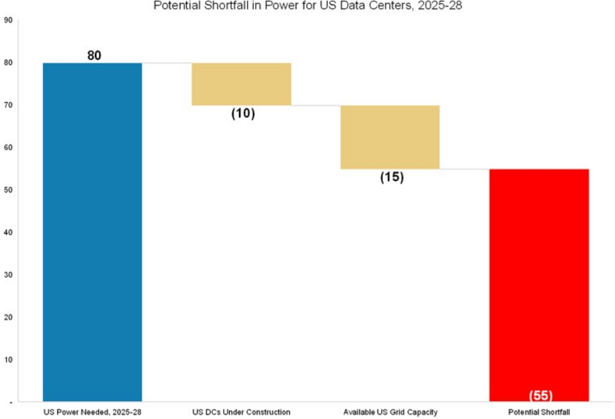
Source: Morgan Stanley Research Estimates
oz
10
40
CAmIbll Oo.
M
China: Fortifying Defences, Supporting Asia's Energy Security Automobiles
40%
1) Transportation electrification across mobility; moving beyond cars into trucks, construction machinery, vessels and ships China is likely to push for a further 40% domestic electric car penetration and at the same time accelerate truck electrification from 17.5% in 2025 to 80-90% in the next five years ( Exhibit 53 ), with battery swap infrastructure building to facilitate electrification, reducing both gasoline and diesel reliance.
As battery costs continue to decline and energy density improves supported by sustained innovation in chemistry, form factor, and manufacturing - electrification is naturally expanding beyond passenger vehicles into broader transportation segments. EV adoption over the past 5-7 years has been concentrated in passenger cars, driven by improving affordability and range. However, we are now seeing a clear inflection where battery technology has reached a level of commercial viability to support electrification in light/heavy trucks and delivery fleets, with real-world economics starting to work.
Exhibit 53: Transportation electrification across mobility segments, reducing oil reliance
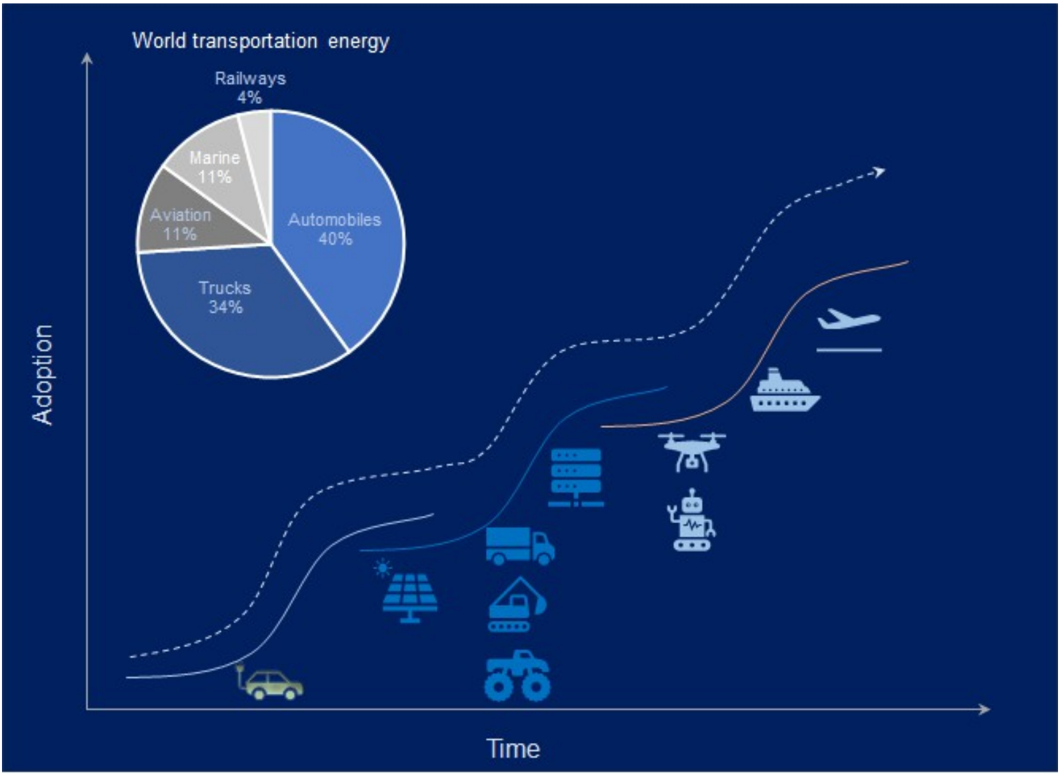
Source: Morgan Stanley Research
Adoption
M
2) Battery technology upgrades, shifting from lithium-ion to sodium-ion batteries for mineral security Sodium-ion batteries are now commercially viable and look set to unlock a ~1000GWh annual battery market in the next five years ( Exhibit 54 ).
Sodium -ion appears to be at a similar stage today as LFP was in 2020, with limited scale but clear cost and supply chain advantages beginning to gain traction. While sodium -ion only recently entered vehicle applications and still has a negligible share, the setup resembles LFP's pre -inflection phase. LFP subsequently moved into rapid adoption from 2021 onwards, driven by technical thresholds breakthrough of 175Wh/kg energy density, cost competitiveness and improving performance, with market share rising sharply from 4% in 2019 to >70% in 2025 in China, underpinning the mass -market EV ramp-up. We see sodium -ion approaching a similar inflection window, with accelerating capacity build -out, better cold-weather performance and safer, as well as reaching cost parity with LFP currently and a further 35% cost evolution after scaling in future, suggesting the potential to follow a comparable S -curve and become a meaningful incremental driver of transportation electrification and energy storage over the medium to long term.
3) Energy storage deployment to enhance power flexibility This is a result of rising renewable generation. We expect a 2.3TWH cumulative energy storage deployment by 2030 ( Exhibit 55 ). The ESS cost advantage can be seen not only in its levelized cost of energy (LCOE), but more importantly in the ability of electricity inventory to defer or downsize the high opportunity costs of traditional capital-intensive power infrastructure. This time-to-power flexibility and infrastructure deferral value meaningfully enhance the economic case for storage. Battery costs will likely continue to evolve with the coming of the sodium-ion era - cheaper and safer, with the ability to deliver steady energy at low temperatures.
In an increasingly power-constrained world, AI workloads are structurally changing the shape of electricity demand. As inference scales and workload become more user-facing - search, enterprise software, autonomous driving as well as many other real-time applications - power demand will likely become more volatile, spikier and less predictable. These inference-driven loads create sharp peaks rather than steady base-load requirements, increasing the value of peak-shaving and fast-response capacity ( Exhibit 55 ). Energy storage systems are uniquely suited to absorb this volatility - modular and rapidly deployable, able to respond rapidly to sudden load ramp, smoothing peaks without requiring overbuilding of generation or transmission infrastructure, and deferring irreversible investments. As inference inflects, this flexibility should move from a 'nice to have' to a system-level necessity, in our view.
Exhibit 54: Sodium-ion approaching the threshold where LFP stood in 2020 - energy density, supply chain readiness and potential incentive support
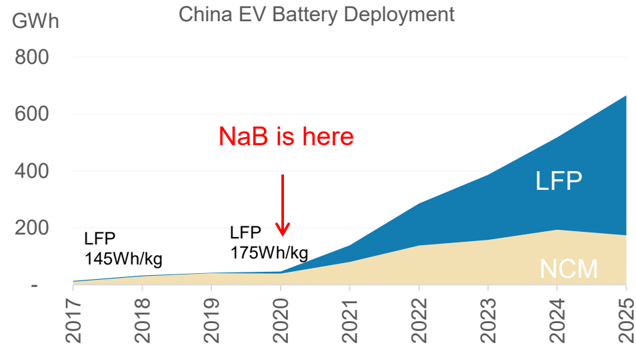
Source: SNE, CPCA, Morgan Stanley Research; NaB=sodium-ion batteries
1,128,083
643,544
2,031,813
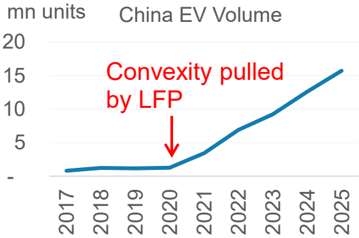
Exmbll do. Jlubal Loo aimlual miclemenlal ueploytmenlt lorebasl for data centers...
GWh
350
300
M
250
200
150
100
50
-
Exmbll 0o. mcluumy utmy suale Loo ! powel thlalnelo
• Utility-scale Energy Storage
Exhibit 55: Global ESS annual incremental deployment forecast for data centers…
400
200
Source: Rystad, Morgan Stanley Research (e) estimates
Data Center Energy Storage
Exhibit 56: …including utility-scale ESS in power markets
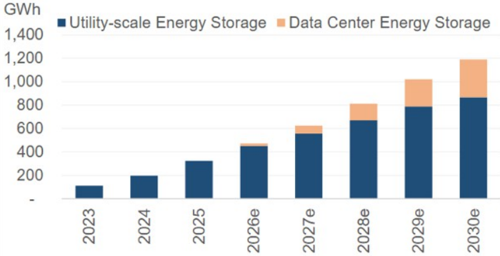
Source: Rystad, Morgan Stanley Research (e) estimates
The China Shale story for natural gas: The bulk of China's shale gas resource is concentrated in the Ordos Basin (30.5 tcm) - a single basin that is larger than the US's largest gas basin, Appalachian, in terms of shale resources. Appalachian produces gas at a level more than the entirety of China's domestic output in 2025. Yet Ordos today produces only ~4 bcm from deep coal-measure formations less than 1% of Appalachian's output - underscoring the sheer magnitude of the untapped resource-to-production gap. China's deep coalmeasure shale formations in the Ordos, Qinshui, and Junggar basins, have potential for a credible production ramp-up curve for coal-measure shale gas nationally. This, along with the Sichuan Basin resource base, means total unconventional gas could account for 32% of China's gas production by 2030 and over 41% by 2035 - a structural shift comparable in magnitude to the US shale revolution if fructified. The key assumption underpinning this forecast is not geology which is already proven - but the pace of engineering replication: whether China can scale Daji-style development across multiple coal-shale basins.
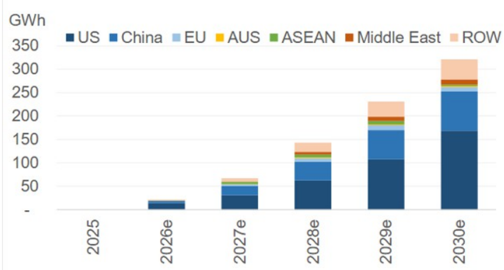
Source: Rystad, Morgan Stanley Research (e) estimates
4) Continued deployment of renewables and nuclear This is an essential part of electrification, energy security and carbon emission control.
5) Grid modernization To support electrification and powering AI ( Exhibit 57 ).
6) Gas upstream boom, including potential shale gas and coal rock methane revolutions, as well as downstream storage and pipeline building.
7) Chemical security and refining and petrochemical upgrades.
All these are aimed at enhancing self-sufficiency, resilience, and long-term industrial competitiveness.
We outline a framework under which China can simultaneously strengthen energy security while advancing its carbon reduction commitments during the 15th Five-Year Plan. At its core, the approach likely combines diversification of energy supply, accelerated electrification, and systematic decarbonization of the power mix.
Exmbil do. ullllas Cual ollale yao lesbulces ll plaue vo. Us silale yao lesbulces Il plaue, do Ul cULo
$5
M
Exhibit 57: China energy security roadmap
China Ordos
Basin
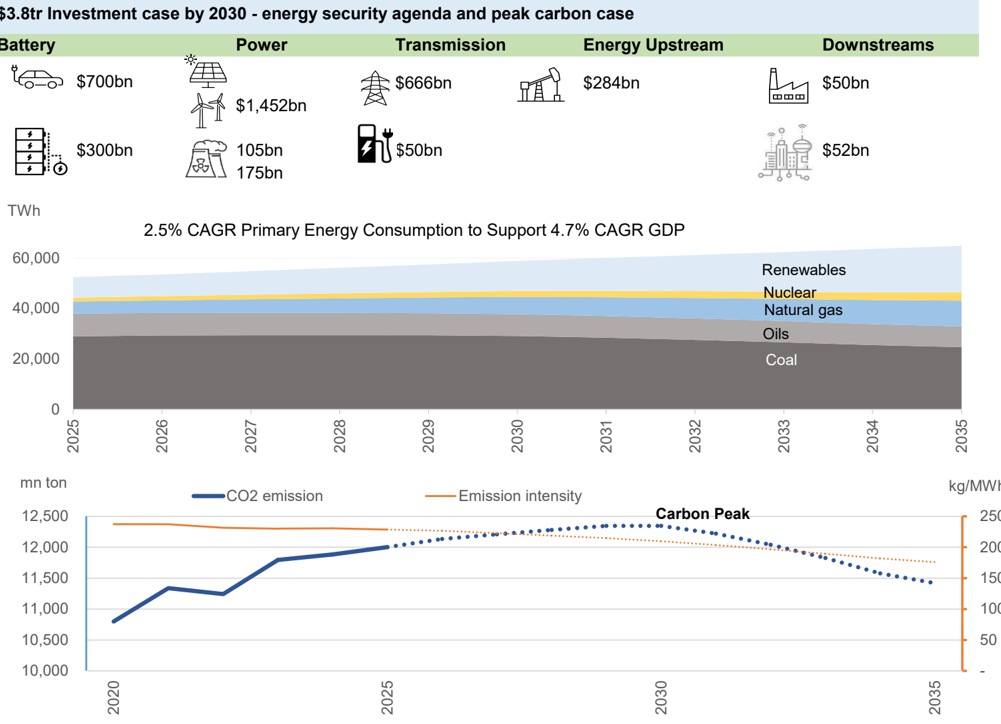
Source: World Bank Data, Morgan Stanley estimates (beyond 2025)
Exhibit 58: China's coal-shale gas resources in place vs. US shale gas resources in place, as of 2025
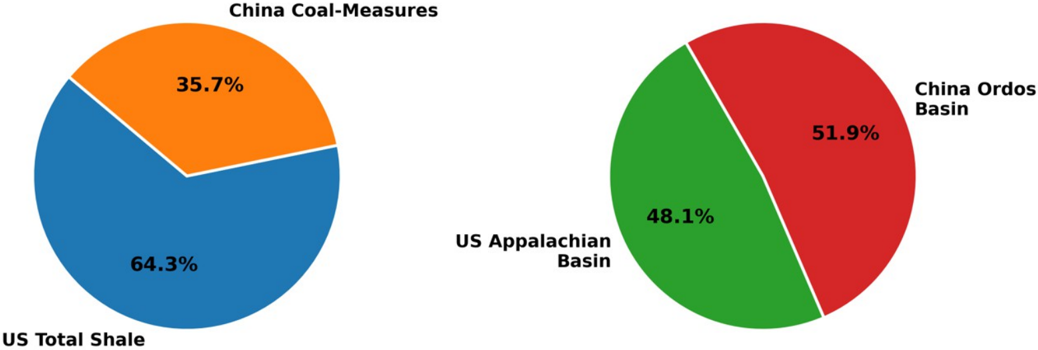
Source: EIA, PetroChina, Morgan Stanley Research estimates
M
Energy Security - A Key Pillar to Capex and Industrial Supercycle
Chetan Ahya, Derrick Kam, Jonathan Cheung
Investment in energy and energy-transition-related categories is one of the four key pillars of the Asian industrial and capex supercycle that we have been highlighting. China has been leading the region in capex related to energy transition, but the rest of the region had already accelerated its spending before the recent geopolitical tensions. The recent energy shock means that energy security has simply moved higher on the policy agenda.
We project capex in Asia to grow at 3x the pace of recent years…
We forecast Asia's capex will reach US$16trn in 2030, up from US$11trn currently. This implies a CAGR of 7% over the next five years, ~3x the pace of growth over 2023-25. Put another way, the US$4.5trn projected rise in capex will be achieved over the next five years. In contrast, it took 12 years for Asia to post the same delta in capex previously.
The strongest industrial cycle since the mid-2000s: Asia is entering a capex and industrial super-cycle - the strongest since the mid-2000s, supported by a sustained rise in capex. Geopolitical tensions are a near-term headwind, but they are catalysing mediumterm energy and defense spending. If/when tensions ease, we expect to see a quick resurgence in the industrial cycle.
Exhibit 59: Asia's gross fixed investment to rise to US$16trn by 2030
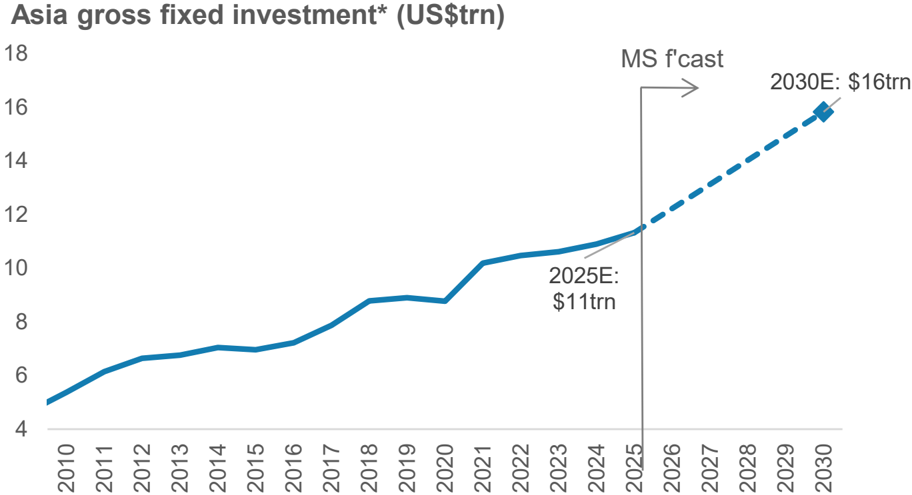
Source: CEIC, Haver, IEA, Lowy Institute, Morgan Stanley Research estimates. *We exclude China's real estate capex given the structural decline in property demand.
M
…led by rising capex share in structural drivers: Crucially, the rise in capex will be driven by new structural demand drivers of AI and AI infrastructure spending, energy and energy transition, and defense spending. We expect a 16% CAGR in capex in these new drivers over the next five years.
To be clear, these are not just standalone factors: they are intertwined and will have an effect on the industrial cycle that will be greater than the sum-of-their-parts, given that they will have knock-on effects on each other. For instance, the rise in capex will also spill over positively to other segments. It will drive the demand for machinery equipment and commodities that feed into these drivers, which will then lead to knock-on effects as these related sectors (for instance, the producers of capital goods) raise their own capex.
Asia is the production powerhouse - so when Asia's capex rises and global capex does too, Asia stands to enjoy a double benefit. In addition, as the initial rise in capex takes off, this will help to catalyze job growth and wage gains, in turn lifting consumption - which will then also drive capex in the consumption-linked sectors higher too.
Exhibit 60: The rise in capex will be driven by new structural demand drivers - AI and AI infrastructure spending, energy and energy transition, and defense spending
Asia nominal investment in high growth sectors (US$trn) Other broader industrial and intellectual property capex
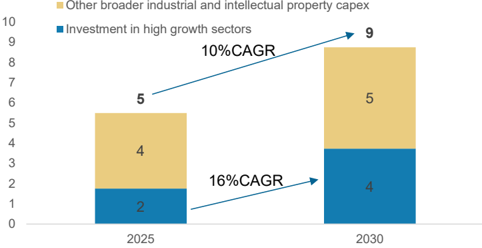
Source: CEIC, Haver, IEA, Lowy Institute, Morgan Stanley Research estimates. Note: We exclude China's real estate capex given the structural decline in property demand.
M
Energy: Consumption Keeps Growing
Energy security is no longer optional, but has become a strategic national priority Datuk Seri Fadillah Yusof, Malaysian Deputy Prime Minister
We must systematically respond to external shocks and challenges, improve energy resource security guarantee levels and counter various uncertainties with the certainty of high-quality development A statement from China's Politburo, a top decision-making body
By 2030, we estimate that Asia will need ~40EJ more energy ( Exhibit 61 ) - as much as the Middle East used in 2025. Much of this will be provided by electricity, as we expect power consumption to grow at a 5% CAGR to 19 trillion units. Consumption growth will be driven by industry, data centers, transport, and fertilizers, among other increasingly important growth drivers like semiconductor fabs. It is also important to note that every energy shock in the last three decades ( Exhibit 62 ) has not structurally shifted the consumption of primary energy, which has continued to grow in pretty much every sector. Weather patterns have also played an important role in consumption growth in Asia in the last three years, with a very hot summer in 2024 driving record power needs, and 2026 looks to be a repeat of 2024.
Every joule of energy consumption growth needs 10c/J of new investment, in our view, and over the past decade we have used a large part of the overcapacity in the energy system. Hence, these new investments may not lead to any structural overcapacity even beyond 2030. There are likely to be some cycles of oversupply as capacity growth is a step function change while consumption grows more linearly.
Exhibit 61: We expect Asia's Primary Energy Consumption to grow at 2.7% CAGR through 2030 with fossil fuels to remain~75% of the mix by 2030 as grid investments and renewable deployment take time
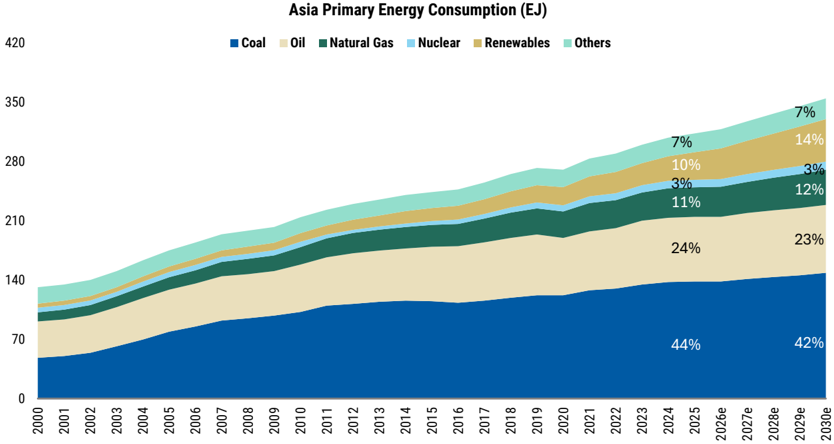
Source: Statistical Review of World Energy, Morgan Stanley Research (e) Estimates
M
Exhibit 62: Fossil energy consumption in Asia has consistently grown despite multiple oil shocks since the 2000s
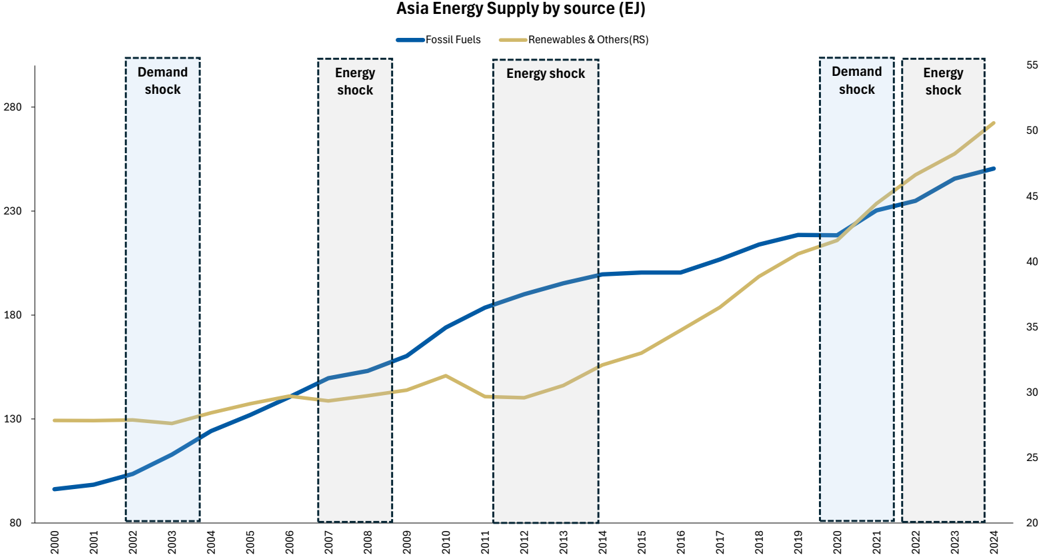
Source: IEA, Morgan Stanley Research
Exhibit 63: Power demand is the most resilient in the global energy complex against disruptions in energy markets
| Asia ex China Final Electricity Consumption (YoY) | Industry | Transport | Residential | Commercial and public services | Agriculture and forestry | Fishing | Other non- specified | Total |
|---|---|---|---|---|---|---|---|---|
| 2008 (Global Financial Crisis) | -2.1% | 2.7% | 2.2% | 3.4% | 4.1% | -2.0% | -2.8% | 0.6% |
| 2011 (Energy Market Tightness) | 2.2% | 2.5% | 1.0% | 0.6% | 9.8% | 6.2% | 9.3% | 2.0% |
| 2015 (Energy Market Tightness) | 0.8% | 4.1% | 2.8% | 3.1% | 2.5% | 5.4% | 18.3% | 2.4% |
| 2020 (Covid) | -2.5% | -8.4% | 5.4% | -9.3% | 4.3% | 0.6% | -31.0% | -2.3% |
| 2023 (Russia Ukraine Energy Impact) | 2.4% | 7.6% | 3.7% | 3.8% | 15.8% | 12.8% | 17.0% | 4.3% |
Source: IEA, Morgan Stanley Research
cxmbl 04. vve expeul capauily auuttonls ul ~4,oouov uvel Luzorou witll mivesthenllo Ul over Uopoull
M
Associated Capex
Power Consumption: The Supercycle Accelerates
2,021GW
China
US$2,370bn
"Increased investment in comprehensive energy infrastructure across the entire energy supply chain, from upstream development facilities to downstream equipment, in order to support affordable, reliable and secure energy supply, including baseload electricity" - Indo-Pacific Energy Security Ministerial and Business Forum co-hosted by US National Energy Dominance Council Secretary Doug Burgum, Secretary of Energy Chris Wright, and Japanese Minister of Economy, Trade and Industry Akazawa Ryosei. 30GW Japan US$75bn
53GW
South Korea
Securing energy supply for AI has emerged as a durable, system -level investment theme across the power and fuel value chains, distinct from decarbonization targets or short -term price signals. Recent LNG disruptions and extreme price volatility have shifted policy maker and corporate behavior toward reliability, dispatchability, and domestic or regional resilience over pure economic optimization. We think this will drive a new sustained capex cycle across grid infrastructure, battery storage, strategic reserves, utilities, and selective generation technologies. Overall electricity will account for ~30% of Asia's energy needs, up from ~25% currently, as the region electrifies (please contact us for our model).
US$78bn
We believe coal and natural gas will remain mainstays in Asia, meeting slightly over half of demand. They are even more dominant outside China, at about 66%. We have already seen evidence of more coal and natural gas capacity growth in Asia in 2026, and we estimate that by 2030 there will be 350+GW of new coal and ~90GW of new gas-based generation to complement roughly 2,000GW of new renewable generation. Overall Asia's power mix will see renewables' share rise to 42%, complemented by the addition of 3TWh of energy storage by 2030 (6x today's capacity).
Exhibit 64: We expect capacity additions of ~2,500GW over 2026-30 with investments of over US$3trn
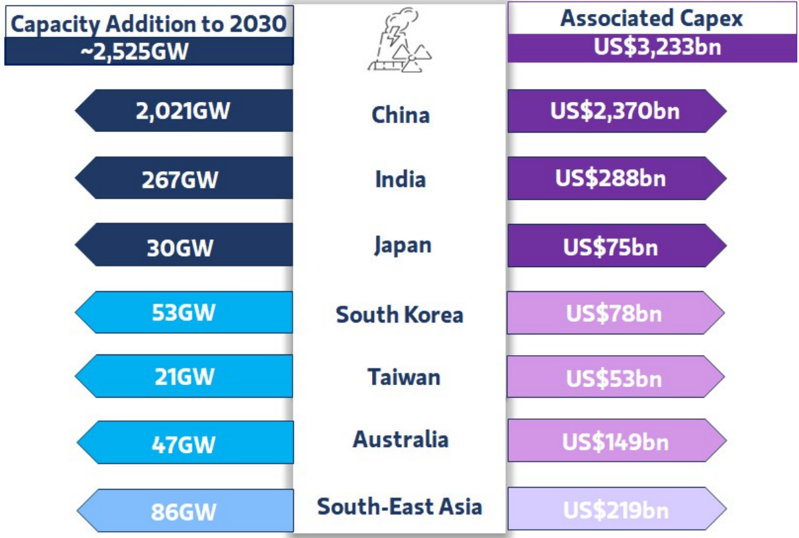
Source: Morgan Stanley Research estimates
M
Exhibit 65: Power is now ~25% of Asia's energy supply, and we see that rising to ~30% by 2030
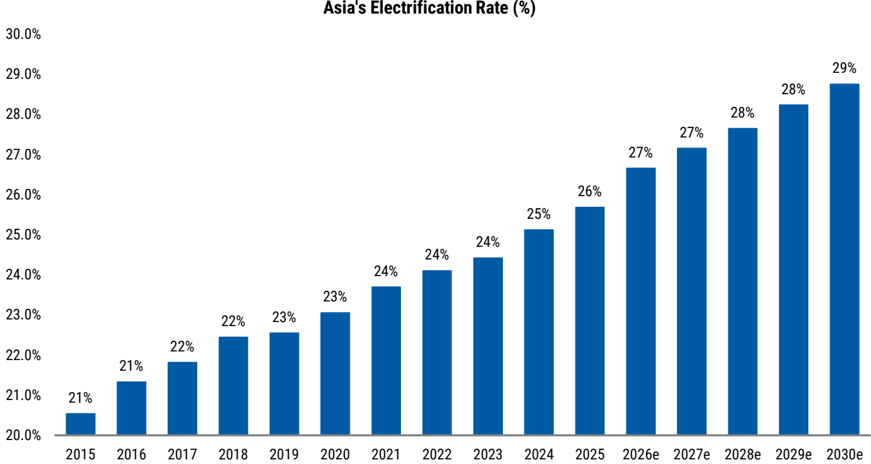
Source: Statistical Review of World Energy, Morgan Stanley Research
In Future of Energy: Power - Changing Face with AI we highlighted power consumption was at another tipping point after tripling since 1980. This is being driven by AI power consumption, new supply chains forming and electrification. We forecast 5% annual growth in power consumption in Asia by 2030 ( Exhibit 66 ), or 4 trillion units of new consumption. We also see a greater than expected portion of demand being met by gas and coal, as renewable curtailments continue to rise globally.
We see India's and Japan's power consumption rising 1.5-2x faster than in the previous decade , achieving growth last seen in the early
2000s, while China and Southeast Asia continue to grow at the same expected rate ( Exhibit 68 ). Alongside a significant step up in AI power demand, ambitions to increase power self sufficiency in advanced economies have driven new supply chain formation and increased industrial power demand. Excluding weather effects on power demand, since 2012 we have seen industrial and commercial sector demand for power rise faster than ever in the US, Europe, Japan, and Taiwan. That said, China's anti-involution policy is a risk that could negatively affect industrial power demand, as it reduces overcapacity and increases renewable curtailments.
Exhibit 66: We expect power demand to inflect globally driven by data centers, new supply chains and the electrification of industry
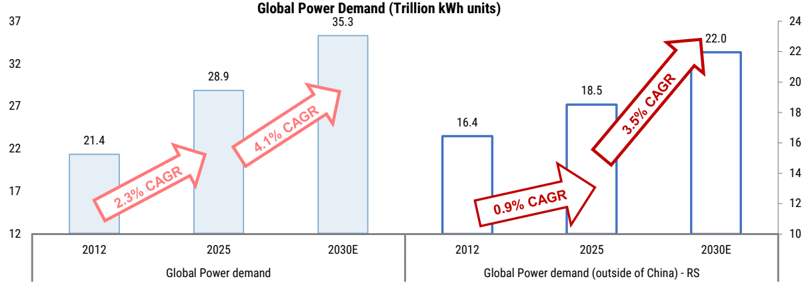
Source: Statistical Review of World Energy, Morgan Stanley Research (E) estimates
Thousands
M
What does our Asia Power Model suggest?
Exhibit 67: We expect data centers, new supply chains and electrification to drive global power demand for the rest of the decade
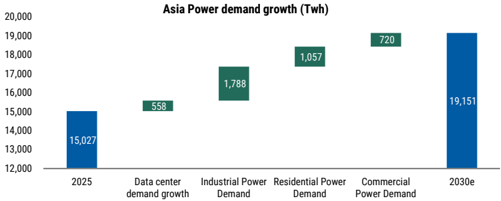
Source: Company data, Morgan Stanley Research (e) estimates
Exhibit 69: How have our power demand expectations changed?
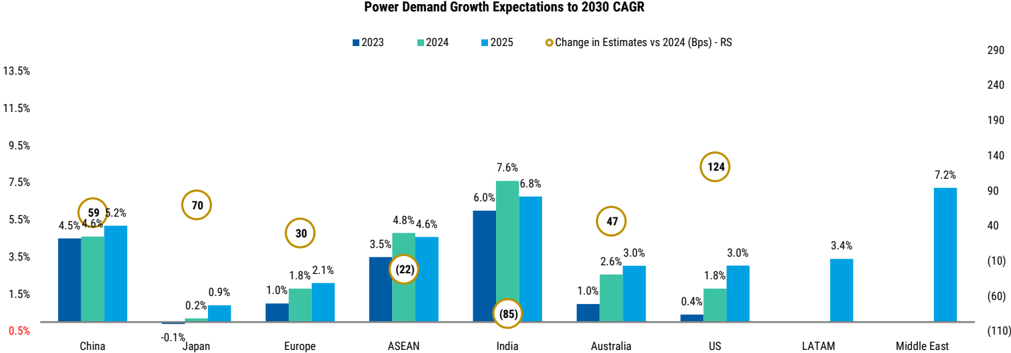
Source: Morgan Stanley Research estimates
Exhibit 68: All economies are expected to see increased power demand for the rest of the decade, and most are faced with an aging generation fleet
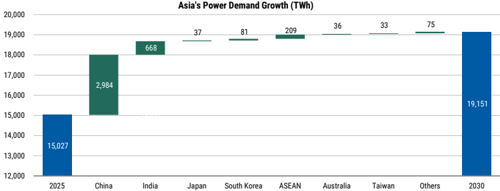
Source: Morgan Stanley Research estimates
M
Exhibit 70: Our Asia Power Generation Model suggests ~19trn kWh of annual power demand by 2030
| PowerDemand | 2023 | 2024 | 2025 | 2026e | 2027e | 2028e | 2029e | 2030e |
|---|---|---|---|---|---|---|---|---|
| Data Center power demand(TWh) | 191.1 | 221.2 | 312.3 | 410.4 | 481.6 | 607.2 | 718.8 | 870.8 |
| NonData Center power demand(TWh) | 13,475.1 | 14,209.4 | 14,714.7 | 15,391.3 | 16,126.8 | 16,801.9 | 17,539.6 | 18,280.2 |
| Industrial | 7,938.5 | 8,295.3 | 8,561.9 | 8,932.4 | 9,333.8 | 9,754.6 | 10,046.7 | 10,350.1 |
| Commercial | 2,625.6 | 2,799.6 | 2,903.9 | 3,039.5 | 3,183.7 | 3,301.9 | 3,470.2 | 3,624.1 |
| Residential | 2,911.1 | 3,114.5 | 3,249.0 | 3,419.4 | 3,609.3 | 3,745.5 | 4,022.8 | 4,305.9 |
| Total Power Demand(TWh) | 13,666.2 | 14,430.6 | 15,027.1 | 15,801.7 | 16,608.5 | 17,409.1 | 18,258.5 | 19,151.0 |
Sytem Loss
366.0
385.4
404.4
425.1
447.4
472.0
472.0
472.0
| Power Generation | 2023 | 2024 | 2025e | 2026e | 2027e | 2028e | 2029e | 2030e |
|---|---|---|---|---|---|---|---|---|
| Total Power generation (TWh) | 14,315.6 | 15,134.8 | 15,711.2 | 16,488.1 | 17,340.3 | 18,150.9 | 18,990.0 | 19,854.2 |
| Coal (TWh) | 8,441.8 | 8,662.3 | 8,484.1 | 8,415.3 | 8,487.5 | 8,477.5 | 8,596.0 | 8,554.1 |
| Installed Capacity (GW) | 1,982.0 | 1,750.4 | 1,808.3 | 1,871.8 | 1,935.7 | 1,993.2 | 2,064.8 | 2,116.2 |
| Load Factor | 49% | 56% | 54% | 51% | 50% | 49% | 48% | 46% |
| Nuclear (TWh) | 758.3 | 789.1 | 820.7 | 865.0 | 929.2 | 1,013.0 | 1,099.3 | 1,198.9 |
| Installed Capacity (GW) | 124.6 | 129.0 | 134.2 | 140.4 | 150.4 | 160.4 | 173.3 | 185.2 |
| Load Factor | 69% | 70% | 70% | 70% | 71% | 72% | 72% | 74% |
| Renewables &Others (TWh) | 3,831.1 | 4,356.1 | 5,179.3 | 5,704.6 | 6,342.6 | 7,022.9 | 7,645.4 | 8,455.4 |
| Installed Capacity (GW) | 2,010.1 | 2,430.1 | 2,889.0 | 3,381.8 | 3,784.8 | 4,204.2 | 4,597.6 | 4,944.2 |
| Load Factor | 22% | 20% | 20% | 19% | 19% | 19% | 19% | 20% |
| Natural Gas (TWh) | 1,284.4 | 1,327.3 | 1,227.2 | 1,501.8 | 1,581.0 | 1,642.7 | 1,649.1 | 1,645.8 |
| Installed Capacity (GW) | 399.1 | 425.6 | 434.5 | 446.4 | 459.2 | 474.3 | 489.3 | 504.4 |
| Load Factor | 37% | 36% | 32% | 38% | 39% | 40% | 38% | 37% |
| CCGTHeatrate (BTU/kwh) | 8,427 | 8,536 | 8,597 | 8,284 | 8,401 | 8,401 | 8,552 | 8,915 |
| Total Gas consumed for Power (mntpa) | 209.0 | 218.7 | 203.7 | 240.2 | 256.4 | 266.4 | 272.3 | 283.3 |
Source: Statistical Review of World Energy, Morgan Stanley Research (e) estimates
Exhibit 71: How countries stack up on demand and prices
| Power | Demand CAGR | Incremental Powerdemand (2025-30) (TWh) | Incremental Powerdemand (2025-30) (TWh) | Baseload Power Cost (US$/MWh) | Delivered Power Price |
|---|---|---|---|---|---|
| Country | (2025-30) | Datacenters | Non- Datacenters | (US$/MWh) | |
| 3.04% | 512 | 137 | 85 | ~100 | US |
| 2.10% | 94 | 236 | 65-98 | 160-170 | Europe |
| 3.40% | 21 | 233 | 65 | 160 | LATAM |
| 7.23% | 22 | 300 | 40 | 60 | Middle East |
| 5.19% | 325 | 2,659 | 60 | 87 | China |
| 6.75% | 68 | 600 | 55 | 90 | India |
| 0.90% | 27 | 10 | 90 | 214 | Japan |
| 3.03% | 11 | 25 | 76 | 220 | Australia |
| 4.58% | 107 | 102 | 76 | 106 | ASEAN(ex Singapore) |
| 3.20% | 8 | 4 | 92 | ~200 | Singapore |
Source: Company Data, Bloomberg, IEX, EMA Singapore, EPPO Thailand, JPEX, Morgan Stanley Research estimates
cambl 14 mula. Vald a Alls univily growillul DeD lellewable vowel Upelatuls like ulealillax
M
China: We expect China's power demand to grow 5% annually through 2030, driven by the electrification of heavy industry, data centers, and further EV penetration. On the supply side, China is building at a breathtaking pace: renewable capacity is set to reach 4,000GW by the end of the decade, close to half the global capacity combined. Yet China is simultaneously doubling down on coal, with significant investments expected, driven by energy security concerns after heatwave-induced grid stress. The critical bottleneck is the grid: China will spend significantly on T&D and energy storage to keep pace with renewable deployment.
India: We see power demand expanding, driven by economic growth, the electrification of end-use sectors, emerging loads such as EVs, and green hydrogen. In addition, large data center players have been aiming at clean power sourcing, and therefore commensurate investments in storage will become inevitable to manage intermittency and variability issues. We assume the share of RE in power supply will gradually increase from 25% in F27 to 35% by F31, with the balance met through thermal. Data center and AI growth in India appears underappreciated, given the rate of change since F24 ( Exhibit 72 ).
Growth
Southeast Asia: Southeast Asia's electricity demand has surged, driven by a 12% rise in electrification rates, urbanization, and the region's role as a global manufacturing hub as well as build out of AI infrastructure in more recent years. On the supply side, coal remains deeply entrenched given its affordability, accessibility and reliability. Grids and storage are heavily dependent on public finance, and uncertainties over renewable remuneration mechanisms continue to deter private capital.
~10x
Japan: Japan faces a unique challenge: electricity demand had been declining for a decade post-Fukushima, but the 7th Strategic Energy Plan (February 2025) now forecasts demand rising driven by data centers, semiconductor fabs, and electrification - reversing the longheld assumption of a secular demand decline. On the supply side solar/wind growth has slowed due to high costs, lengthy permitting, and limited land. Nuclear is making a comeback: the government has dropped the post-Fukushima language of "reducing dependence on nuclear" and now aims for "maximize use", which requires restarting all 33GW of installed capacity (only 12GW has returned so far). Grid investment is rising but faces material cost inflation; Japan's energy self-sufficiency remains low (the lowest in the G7), with fossil
Exhibit 72: India: Data & AI is driving growth for B2B renewable power operators like Cleanmax
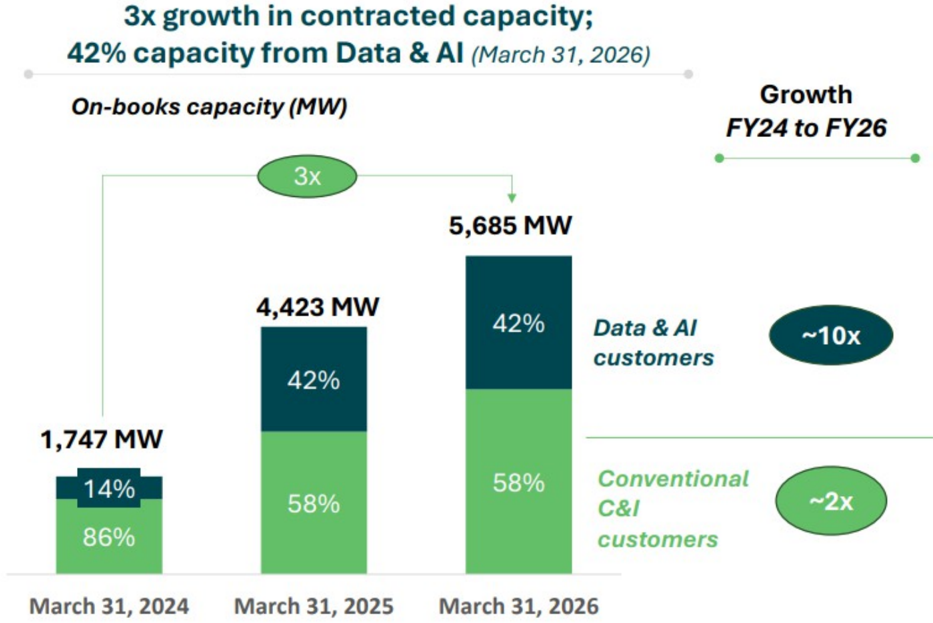
Source: CleanMax Enviro Energy Solutions F4Q26 Investor Presentation
60
50
40
30
20
10
ASbn
% GDP
M
- 1.2
imports still >80% of primary energy - making it acutely vulnerable to supply disruptions and underscoring the urgency of both nuclear restarts and grid modernization. - 0.9 - 0.8 10
- 0.7
5
Korea: Electricity demand in Korea is climbing steeply, especially with the rise of AI and digital industries. The power needs of data centers, servers, and advanced manufacturing are surging, making reliable high-capacity delivery of electricity more critical than ever. The government recognizes that simply producing enough power is not sufficient - the challenge is moving huge amounts of electricity to where it is needed, much like how goods need highways to reach consumers.
Exhibit 73: We forecast Australia's electricity capex will rise from A$31bn in FY25 to A$53bn by FY30, or a 5-year CAGR of 10.9%
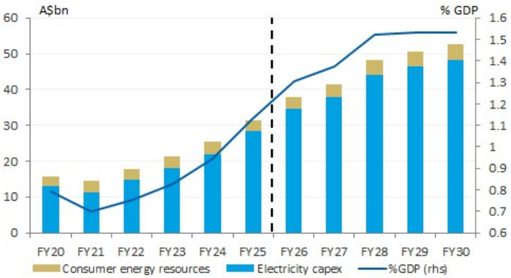
Source: ABS, Morgan Stanley Research
If the pipete Has sloweu lecelluly electricity capex (ASbn; annual rate)
Australia: We expect 47GW of new generation and 71GWh of energy storage in additional capacity from 2026 to 2030 to meet policy targets (82% renewable power by 2030) and based on our proprietary utilities database. Using the CSIROs 2025-2026 Gencost report, we estimate total power build costs of US$178bn over the same period for new generation (mostly onshore wind, solar, hydro), batteries and transmission/power grids. We think the power market transition is largely resilient to oil market shocks, especially as the Australian Government is developing a prospective East Coast domestic gas reservation policy with the intention of securing domestic supply and decoupling domestic prices from LNG netback. We see ORG and AGL as the most active companies in our coverage in power markets, with returns on new firming investment, but also merchant price risk as new supply comes on stream and/or commodity prices fall.
Exhibit 74: Electricity capex remains very strong, although growth in the pipeline has slowed recently
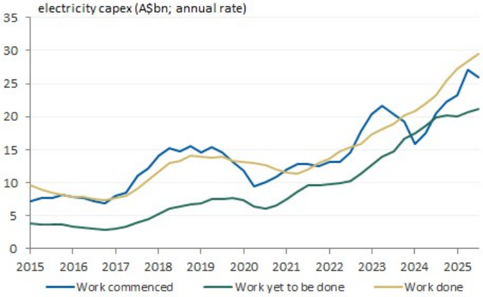
Source: ABS, Morgan Stanley Research
M
Quantifying AI Power Demand
Exhibit 75: How data center power demand compares globally
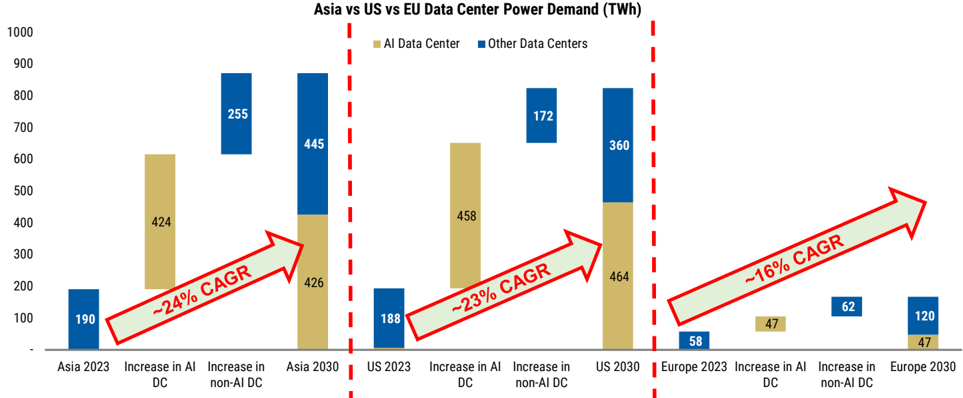
Source: Morgan Stanley Research estimates
Artificial intelligence and the associated proliferation of data centers represent the most significant new source of electricity demand growth in developed economies in decades. Data centers currently account for ~2% of global power consumption ( Exhibit 75 ) and we forecast they will add 1.2 trillion units (20% of total incremental power demand) to global power consumption, accounting for 5% of power demand by 2030. While there will be varied adoption rates globally, about 45% of these units will be consumed in Asia ( Exhibit 77 ), 45% in US, with Europe largely accounting for the rest. We see a 25% CAGR in power consumption from data centers in 2024-27 and a 20% CAGR in 2027-30. We expect data centers to account for 75% of US power demand growth through 2030, while in Europe they will account for 40% and in Asia 13% (please contact us for our model).
Hardware and energy security: Asia accounts for 60% of global chip manufacturing and over half of AI component manufacturing globally. The manufacturing of hardware for AI is energy intensive but along the life cycle accounts for less energy than the operation phase. The most energy-intensive part is the manufacturing of chips used in GPUs but also in server storage. For example, manufacturing the latest state-of-the-art 3 nanometre (nm) chip requires around 2.3 megawatt hours (MWh) per wafer (Garcia Bardon, et al., 2021). For a typical high-performance server configuration, this amounts to more than 10MWh for manufacturing compared with more than 80MWh for operation over a five-year lifetime. Of the energy needed for manufacturing, 60% is estimated to be for wafer and semiconductor production, where deposition, lithography and etching consume the majority. The remaining 40% is used for auxiliary processes such as water preparation or cooling in the facility.
M
Exhibit 76: How data center power demand is shaping up globally
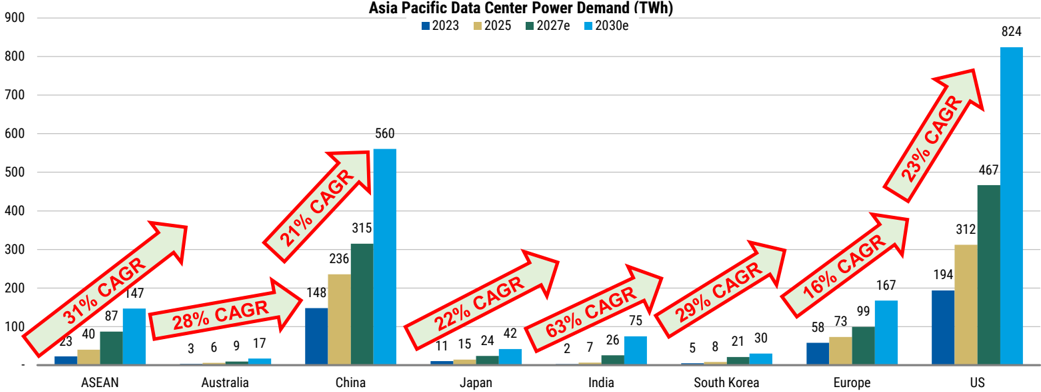
Source: Morgan Stanley Research estimates
Exhibit 77: We expect Asia's total data center power demand to exceed 100GW by 2030
| Total DC Power Consumption | 2023 | 2024 | 2025 | 2027e | 2030e |
|---|---|---|---|---|---|
| Computing Power Consumption from Servers (MW) | 14,744 | 15,581 | 24,116 | 38,072 | 74,615 |
| Power Consumption from Other (Storage) (MW) | 1,474 | 1,558 | 2,412 | 4,247 | 7,461 |
| Total Power Consumption from Servers and Others | 16,218 | 17,139 | 26,528 | 42,319 | 82,076 |
| PUE | 1.51 | 1.50 | 1.41 | 1.41 | 1.31 |
| Total Power Consumption from Servers and Others (MW) | 24,412 | 25,729 | 37,466 | 59,649 | 107,589 |
| Hours | 8,760 | 8,760 | |||
| TWh -Full Year | 213.9 | 225.4 | 328.2 | 522.5 | 942.5 |
| %Completion of incremental capacity | 89% | 98% | 95% | 92% | 92% |
| TWh - Actual for the Year | 191 | 221 | 312 | 479 | 871 |
Source: Morgan Stanley Research (e) estimates
The AI Math: Understanding the Impact of Power Costs
Our analysis of a 100MW fully integrated AI hyperscaler (ownership of the powered shell, GPUs and LLM) reveals an interesting dynamic; AI hyperscalers are essentially price insensitive to power ( Exhibit 78 ). We estimate only a ~50bp impact when power prices are raised by ~17% (from US$120/MWh to US$140/MWh), with hyperscalers' ROEs remaining well above 30% even if power prices rise 1.5x to ~US$160/MWh. We see opportunities for power utilities to further differentiate pricing for data centers, which will help to fund additional grid and generation capacity expansion as well as lift returns in the long run.
M
Exhibit 78: ROE Sensitivity of an AI hyperscaler
| Cost of Power (US$/MWh) | Cost of Power (US$/MWh) | Cost of Power (US$/MWh) | Cost of Power (US$/MWh) | Cost of Power (US$/MWh) | Cost of Power (US$/MWh) | Cost of Power (US$/MWh) | Cost of Power (US$/MWh) | |
|---|---|---|---|---|---|---|---|---|
| 34.9% | 100 | 120 | 130 | 140 | 150 | 160 | 170 | |
| Price per | 39.0 | 34.0% | 33.4% | 33.0% | 32.7% | 32.4% | 32.0% | 31.7% |
| 1MOutput | 39.5 | 35.0% | 34.3% | 34.0% | 33.6% | 33.3% | 33.0% | 32.6% |
| tokens | 40.0 | 35.9% | 35.2% | 34.9% | 34.6% | 34.2% | 33.9% | 33.6% |
| (US$) | 40.5 | 36.8% | 36.2% | 35.8% | 35.5% | 35.2% | 34.8% | 34.5% |
| 41.0 | 37.8% | 37.1% | 36.8% | 36.4% | 36.1% | 35.8% | 35.4% |
Source: Morgan Stanley Research estimates
Power costs have one of the lowest impacts on AI hyperscaler earnings. For a 20% change in power prices, we estimate earnings are only impacted ~3% ( Exhibit 78 ). This is significantly less than other factors such as revenue per token, model/GPU energy efficiency (which improves with each model generation) and GPU asset life, which have a 10-30% impact on earnings. Our analysis also suggests that the returns and profitability of AI hyperscalers are driven more by pricing, model efficiency and capital costs (data center capex, GPU capex) than by variable operating costs (power, water consumed).
Our analysis takes into account current NVIDIA GB200 GPU pricing, a six-year asset life, and 75th percentile data center construction costs. Our estimates also factor in the current pricing of AI inference charged by Claude. Below are our key findings:
Exhibit 79: Illustrative returns of a 100MW AI hyperscaler
| 100MW Economics (US$ mn) | |
|---|---|
| Revenue | 1,986 |
| Cost of Power | (116) |
| Cost of Water | (3) |
| Operating Costs | (10) |
| EBITDA | 1,857 |
| Margin | 94% |
| Powered shell Depreciation | (80) |
| GPU Depreciation | (764) |
| Operating Income | 1,013 |
| Margin | 51% |
| Interest Cost | (85) |
| PBT | 928 |
| Tax | (186) |
| Net Profit | 742 |
| Net Profit Margin | 37% |
| ROCE | 23.8% |
| ROE | 34.9% |
Source: Morgan Stanley Research estimates
Exhibit
80:
Illustrative per token economics for an AI
hyperscaler
| Per Token Economics (US$/ mnoutput Token) | Per Token Economics (US$/ mnoutput Token) |
|---|---|
| Revenue | 8.0 |
| Cost of Power | (0.5) |
| Cost of Water | (0.0) |
| Operating Costs | (0.0) |
| EBITDA | 7.5 |
| Margin | 94% |
| Powered shell Depreciation | (0.3) |
| GPU Depreciation | (3.1) |
| Operating Income | 4.1 |
| Margin | 51% |
| Interest Cost | (0.3) |
| PBT | 3.7 |
| Tax | (0.7) |
| Net Profit | 3.0 |
| Net Profit Margin | 37% |
Source: Morgan Stanley Research estimates
M
Power: Security in Diversity
We encourage economies to diversify their power sources and technologies while... enabling efficient market operation to enhance power system flexibility, resilience and stability Yeo Han-Koo, South Korean Trade Minister
Diversifying Asia's installed power generation capacity has proven critical for resilience to global energy shocks ( Exhibit 81 ). Surging AI/data center demand is forcing a shift to reliable, regionalized energy sources. By reducing reliance on any single fuel or import source, a broader energy mix - combining domestic coal, natural gas, renewables, hydro, and even nuclear - gives countries flexibility to switch fuels when oil or gas prices spike or supplies are disrupted. This flexibility shields consumers and industries from extreme power price surges and blackouts by limiting fuel-cost volatility, while benefiting utilities and governments through more stable operating costs and improved energy security (especially in fuel-importing economies that would otherwise face sharp inflation and balance-of-payments strains). Fuel importers gain the most from diversification, avoiding over-reliance on expensive imports, but resource-rich markets also bolster their resilience by broadening beyond a single dominant fuel, reducing exposure to domestic supply shortfalls or price swings. Power producers with a diversified generation fleet as well as power equipment providers should benefit the most.
How Economies stack up on power generation security
Countries with balanced generation portfolios can substitute fuels dynamically as we have seen in 2026: Japan lifted capacity factor restrictions on coal plants (saving ~0.7 bcm of gas), Korea postponed retirement of 1.5GW coal capacity and accelerated 5.7GW nuclear restarts, and India mandated full coal plant operation during summer peaks. China, with its massive coal fleet (retrofitted for flexible dispatch), domestic gas production, and pipeline imports, has avoided rationing entirely. Similarly with peak power demand in India and Malaysia, we have not seen any power rationing ( Exhibit 81 ).
Exhibit 81: Asia remains largely dependent on imported feedstock for power generation
| Power Generation Resiliency (% of Total Generation) | Imported | Imported | Imported | Imported | |||||
|---|---|---|---|---|---|---|---|---|---|
| Power Generation Resiliency (% of Total Generation) | Coal | Natural Gas | Nuclear | Total Imports | Coal | Natural Gas | Nuclear | Renewables &Others | Total Self Reliance |
| US | 1% | 2% | 17% | 20% | 14% | 38% | 1% | 27% | 80% |
| Europe | 7% | 14% | 19% | 40% | 2% | 2% | 2% | 55% | 60% |
| LATAM | 1% | 10% | NA | 11% | 1% | 15% | 2% | NA | 18% |
| Middle East | 0% | 0% | NA | 0% | 0% | 85% | 5% | NA | 90% |
| China | 6% | 1% | 4% | 11% | 49% | 2% | 0% | 38% | 89% |
| India | 3% | 1% | 3% | 7% | 66% | 1% | 0% | 26% | 93% |
| Japan | 30% | 34% | 10% | 74% | 0% | 0% | 0% | 26% | 26% |
| Australia | 0% | 0% | NA | 0% | 44% | 18% | 0% | NA | 61% |
| Singapore | NA | 94% | NA | 94% | NA | 0% | 0% | NA | 0% |
| Malaysia | 51% | 12% | NA | 63% | 6% | 28% | 0% | NA | 33% |
| Thailand | 8% | 21% | NA | 29% | 2% | 38% | 0% | NA | 41% |
| Philippines | 47% | 8% | NA | 54% | 16% | 9% | 0% | NA | 24% |
| South Korea | 30% | 29% | 30% | 88% | 3% | 2% | 0% | 7% | 12% |
| Taiwan | 29% | 51% | 1% | 82% | 0% | 0% | 0% | 18% | 18% |
| Vietnam | 26% | 7% | NA | 33% | 25% | 3% | 0% | NA | 28% |
Source: Statistical Review of World Energy, Morgan Stanley Research estimates
M
A Pragmatic Approach to Power Security Ahead.
Rather than viewing coal, gas, nuclear and renewables as competitors, policy makers increasingly are adopting balanced and pragmatic multi-track approach where diversified installed capacity acts as a natural hedge against geopolitical, commodity price, and supply chain volatility. In both China and India, coal retains strong policy support, with clean energy framed not as a replacement but as a supplement - reinforcing a multi-track energy strategy that postpones difficult decisions on coal phaseout as power demand continues to grow ( Exhibit 82 ). China's coal power generation is higher than ever at ~5.5trn kWh in 2025, even as the country installed more than 500GW of solar and wind power in the same year.
Exhibit 82: Asia's power generation mix
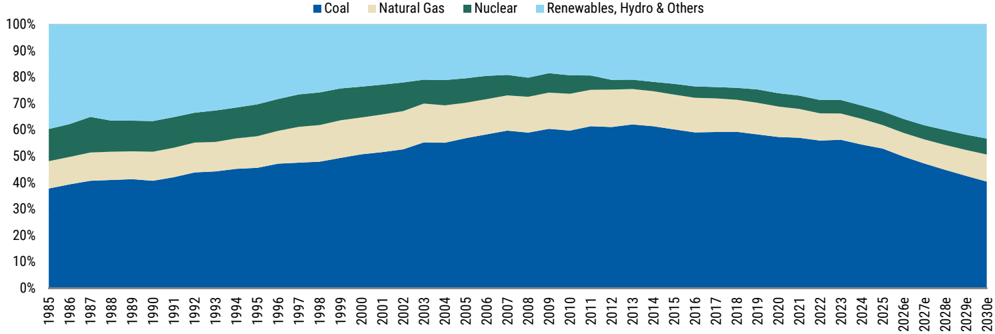
Source: Statistical Review of World Energy, Morgan Stanley Research estimates
This multi-track strategy reflects several realities:
- Renewables cannot yet replace baseload: Solar and wind's intermittency requires backup capacity.
- Grid stability concerns: Rapid renewable deployment strains aging grid infrastructure and hence energy storage batteries are becoming the norm for most renewable deployments.
- Economic pragmatism: Coal remains the cheapest baseload option in most Asian markets with wider availability within Asia.
- Energy security: Domestic coal reduces vulnerability to supply shocks.
M
Are renewables the only solution? They are part of the solution
Many Asian countries - particularly import-dependent and fossil-fuel-intensive ones - still need to invest in a more balanced generation mix. Expanding home-grown renewable energy capacity (along with supporting grid upgrades, storage, and even selective use of cleaner gas or nuclear power) is widely seen as vital to further fortify Asia's power systems against fuel shocks, however, it is not enough. Renewables' intermittency and reliability remain a key risk in providing wholistic energy security. A significant renewable generation mix would result in policy makers trading fossil fuel accessibility risk with geographical and environmental resource risks (sunlight, wind, reservoir water levels). We see coal and gas power generation remaining highly relevant ( Exhibit 83 ) for the rest of the decade as access to reliable power remains key for policy holders.
Asia's baseload power generation fleet is aging at a time when electricity demand is accelerating and grid investments lag renewable deployment - driven by industrialization, data centers, and electrification. While China and parts of ASEAN have relatively young fleets, Japan, South Korea, Australia, and Taiwan face coal and nuclear assets averaging 20-38 years old, with reliability declining as plants age. This confluence of rising demand and aging supply implies a significant multi-year investment cycle ahead - spanning life extensions, new-build replacements, and accelerated renewables and storage deployment - creating a structural tailwind for equipment OEMs, EPC contractors, and utilities across the region, which have already seen equipment ASPs rise ~20%+ since the start of the decade
Exhibit 83: Dependable baseload power reserve margins are declining across Asia
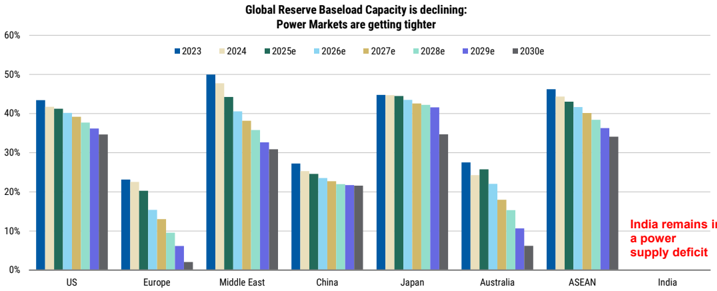
Source: Statistical Review of World Energy, Morgan Stanley Research estimates
Exhibit 84: Developed Asia's aging baseload needs replacement at a time when power demand is inflecting
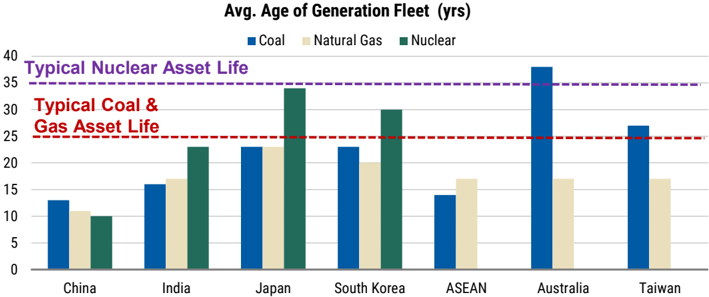
Source: IEEFA, repower, World Nuclear Report, Morgan Stanley Research estimates
ulties lookily at elur bishy over new bullus
GEV Gas Turbine implied Smn per GW
M
Exhibit 85: Power: Gas turbine ASPs have risen materially with orderbooks for turbines reaching a record 100GW in 2025; We did see the slowest demand from Asia in 2025 of the last 20 years with utilities looking at refurbishing over new builds
1Q24
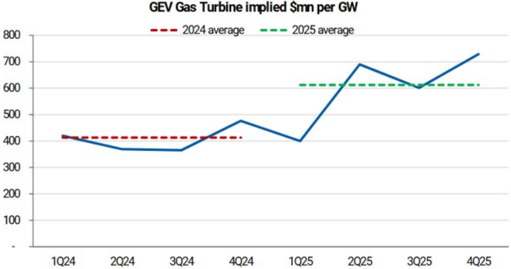
Source: Company Data, Morgan Stanley Research
Diversified Generation Mix = Reduced Economic Shocks
Asia's diversified installed capacity mix provides optionality during fuel-specific shocks ( Exhibit 82 ), a critical advantage repeatedly proven during recent crises. When global LNG prices spiked to over US$100/MMBtu in 2022 during the Russia-Ukraine conflict - a tenfold surge from pre-conflict levels of US$10-15/MMBtu - countries with fuel-switching capacity (coal-to-gas, hydro dispatch flexibility, nuclear baseload) absorbed the shock without severe industrial curtailments. The 2026 Iran conflict and Strait of Hormuz closure, which disrupted 84% of crude oil and 83% of LNG bound for Asia, is exposing the exact same fault lines.
Diversification creates optimization value: Countries with balanced portfolios can exploit commodity price dislocations (buy cheap coal when LNG spikes, dispatch hydro during gas shortages, or run nuclear baseloads while retiring peaker gas plants, etc.).
Exhibit 87: How power prices have changed
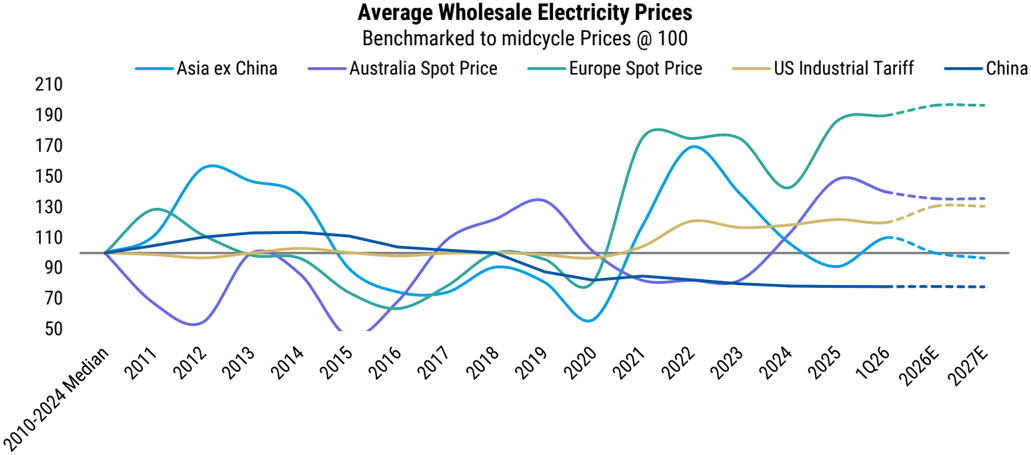
Source: EMA, IEX, JPEX, KEPCO, Bloomberg, Company Data, Morgan Stanley Research
800
700
600
500
400
300
200
100
Exhibit 86: Global power equipment suppliers have seen higher but disciplined capex intensities in recent years as orderbook tailwinds grew from tight power markets
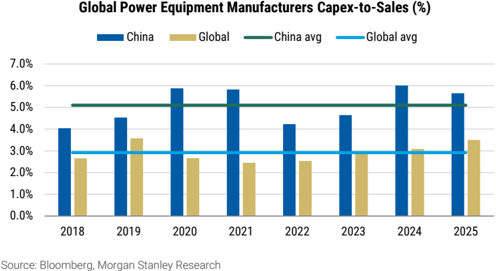
M
Exhibit 88: Asia's power prices have risen 15% since 2019 as demand remained strong despite several energy shocks in the past 6 years
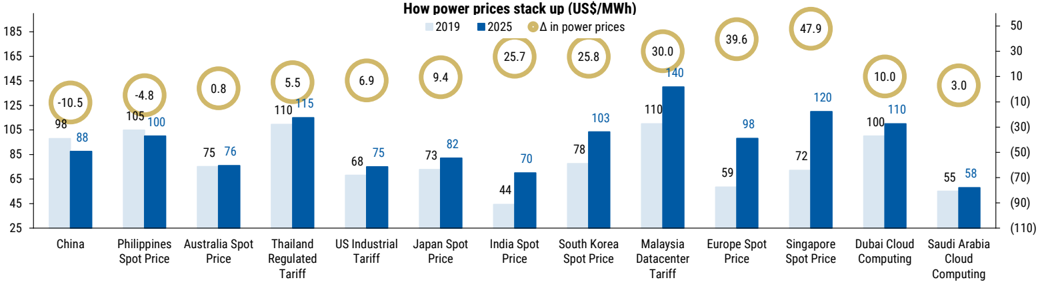
Source: EMA, IEX, JPEX, KEPCO, CEIC, Bloomberg, Company Data, Morgan Stanley Research
New capacity additions to drive re-rating for equipment providers
We see coal and gas power equipment markets encompassing boilers, steam and gas turbines, generators, pollution control systems, and balance-of-plant equipment remaining significant despite climate pressures. The market is dominated by a handful of large manufacturers, which are emerging as key beneficiaries of an ageing baseload, fleet which needs replacement and greater diversification in dependable baseload where energy security concerns drive renewed investment in coal-based baseload capacity. With coal and gas generation expected to rise and capacity additions accelerating after a decade of underinvestment, order books for equipment suppliers are likely to strengthen, supporting utilization, pricing power, and earnings visibility across the value chain. We like Siemens Energy, GE Vernova, Mitsubishi Heavy , Yingliu, and Cummins ( Exhibit 90 ).
US to China power Equipment: Our conversations to-date with Cummins, have revolved around whether Chinese power gen OEMs are showing up in the US to capitalize on a supply-constrained market. We believe the inverse dynamic (i.e., US manufacturers competing in China) remains underappreciated, likely for the reason that few companies do so. CMI has manufactured its highhorsepower engines for the Chinese market in Chongqing since at least 2018. With data center demand accelerating 84% Y/Y, or 152% over a two-year stack (China being the only real competitor in this AI race), we believe CMI is significantly better-positioned to benefit from this demand than any of its Western peers.
Exhibit 89: In the equipment space, gas turbine and grid equipment stocks have outperformed
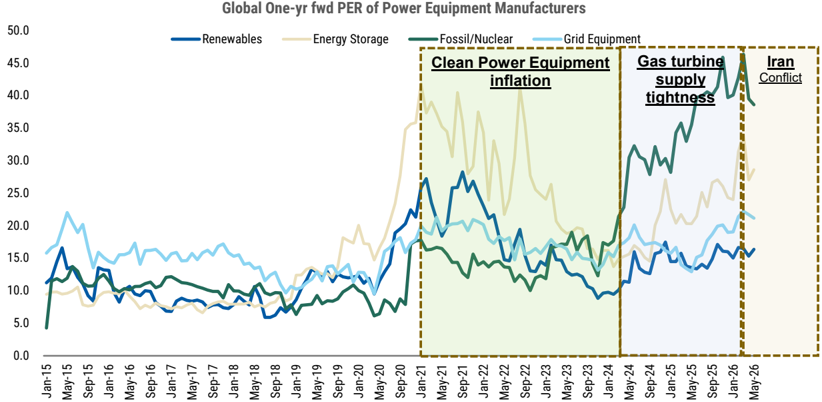
Source: Refinitiv, Morgan Stanley Research
M
Asia's power generation: How the economics stack up
Asia's electricity prices have risen 15-20% since 2021 and the market has been steadily moving to more merchant market pricing over pure PPA market. With price-sensitive consumers in Asia and the changes in market structure when combined with grid bottlenecks, we believe it is essential for power generation to remain economical. We
see natural gas and batteries+renewables along with baseload coal providing a good combination to solve for power grid stability while keeping prices affordable ( Exhibit 90 ). Our round-the-clock economics suggest nearly US$50-60/MWh as the generation cost for Asia power systems on 2025 pricing for fuels, and with increased coal and nuclear usage we believe the need for higher grid tariffs will be cushioned by lower fuel costs in India, China and Southeast Asia.
Exhibit 90: Asia power: The economics - coal and energy storage are competing with more expensive imported natural gas
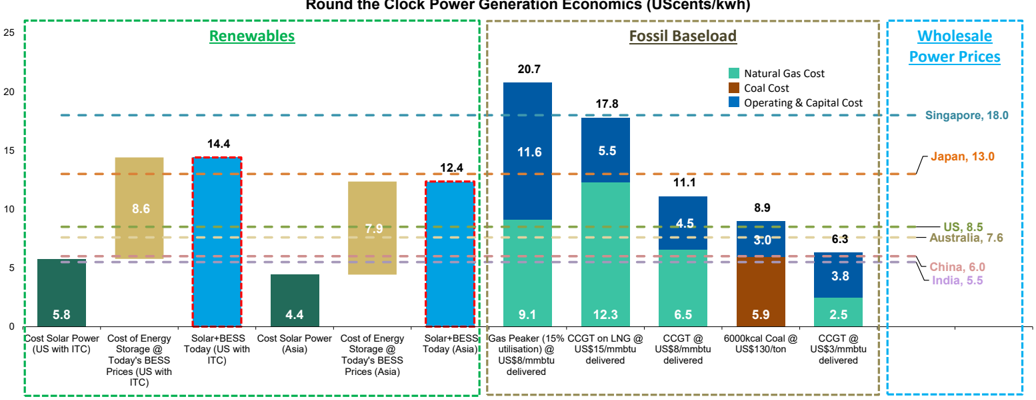
Source: Morgan Stanley Research estimates
M
Power: Key Beneficiaries
Exhibit 91: Power Generators & Conventional Power Equipment Providers
| BBGTickers | CompanyName | Ticker | Market cap, current,USD (MM) | 3MADTV,USD (MM) | Rating | Share price, last Price Target (Local %Upsidefrom | Share price, last Price Target (Local %Upsidefrom | Share price, last Price Target (Local %Upsidefrom | Country | Sub-Sector | MSAnalyst |
|---|---|---|---|---|---|---|---|---|---|---|---|
| BBGTickers | CompanyName | Ticker | Market cap, current,USD (MM) | 3MADTV,USD (MM) | Rating | close | CCY) | last close | Country | Sub-Sector | MSAnalyst |
| Power Generation Equipment | |||||||||||
| GEVUN | GE Vernova Inc | GEV.N | 288,062.5 | 469.7 | Overweight | 1,071.98 | 1,250.00 | 16.6% | United States of America | Power equipment | David Arcaro |
| ENRGY | Siemens EnergyAG | ENR1n.DE | 171,289.1 | 502.2 | Overweight | 167.70 | 200.00 | 19.3% | Germany | Power equipment | Max Yates |
| 7011 JT | Mitsubishi Heavy Industries | 7011.T | 92,041.7 | 743.6 | Overweight | 4,024.00 | 5,500.00 | 36.7% | Japan | Power equipment | Takeshi Kitaura |
| BHEL IS | Bharat Heavy Electricals Ltd | BHEL.NS | 14,312.2 | 57.9 | Overweight | 401.10 | 444.00 | 10.7% | India | Power equipment | Girish Achhipalia |
| 000338CS | WeiChai Power | 000338.SZ | 32,591.0 | 535.9 | Overweight | 32.61 | 43.00 | 31.9% | China | Power equipment | Sheng Zhong |
| 1133HK | Harbin Electric CoLtd* | 1133.HK | 7,187.1 | 32.8 | Not Covered | 3.21 | NA | NA | China | Power equipment | Not Covered |
| 1072HK | Dongfang Electric Corp Ltd* | 1072.HK | 1,956.5 | 86.0 | Not Covered | 4.80 | NA | NA | China | Power equipment | Not Covered |
| 2727HK | Shanghai Electric | 2727.HK | 1,572.7 | 22.3 | Underweight | 5.24HKD | 1.93HKD | -63.2% | China | Power equipment | Eva Hou |
| 603308CH | Anhui Yingliu Electromechanical CoLtd | 603308.SS | 7,508.2 | 233.1 | Overweight | 80.50 | 101.20 | 25.7% | China | Power equipment | TomLi |
| RR/ LN | Rolls-Royce Holdings PLC | RR.L | 135,755.7 | 624.8 | Overweight | 1,164.60GBp | 1,500.00GBp | 28.8% | United Kingdom | Equipment &Plant | Ross Law |
| Power Generators | |||||||||||
| GULF TB | Gulf Development PCL | GULF.BK | 27,331.8 | 99.3 | Overweight | 59.00 | 76.00 | 28.8% | Thailand | Power Generator | Mayank Maheshwari |
| SCI SP | SembCorp Industries Ltd | SCIL.SI | 8,767.2 | 32.8 | Overweight | 6.22 | 7.50 | 20.6% | Singapore | Power Generator | Mayank Maheshwari |
| ADANI IS | Adani Power Ltd | ADAN.NS | 42,415.8 | 81.6 | Overweight | 209.63 | 173.00 | -17.5% | India | Power Generator | Girish Achhipalia |
| 9509 JP | Hokkaido Electric Power | 9509.T | 1,383.6 | 25.9 | Overweight | 999.20 | 2,400.00 | 140.2% | Japan | Power Generator | Reiji Ogino |
| 9503 JT | Kansai Electric Power | 9503.T | 16,887.8 | 65.3 | Equal-Weight | 2,340.50 | 2,800.00 | 19.6% | Japan | Power Generator | Reiji Ogino |
| NTPCIS | NTPC | NTPC.NS | 39,952.6 | 50.9 | Overweight | 392.70 | 403.00 | 2.6% | India | Power Generator | Girish Achhipalia |
| TPWRIS | Tata Power Co | TTPW.NS | 14,027.2 | 35.2 | Equal-Weight | 418.40 | 399.00 | -4.6% | India | Power Generator | Girish Achhipalia |
| JSW IN | JSW Energy Limited | JSWE.NS | 10,378.7 | 12.9 | Overweight | 561.95 | 624.00 | 11.0% | India | Power Generator | Girish Achhipalia |
| KEP SP | Keppel Ltd | KPLM.SI | 15,475.2 | 49.1 | Overweight | 10.78 | 16.00 | 48.4% | Singapore | Power Generator | Mayank Maheshwari |
| 9506 JT | Tohoku Electric Power | 9506.T | 3,404.6 | 19.3 | Overweight | 1,064.00 | 1,540.00 | 44.7% | Japan | Power Generator | Reiji Ogino |
| 9501 JP | Tokyo Electric Power Company Holdings Inc* | 9501.T | 6,597.4 | 259.0 | Not Covered | 612.60 | NA | NA | Japan | Power Generator | Not Covered |
| 9502 JP | Chubu Electric Power CoInc | 9502.T | 13,355.2 | 48.5 | Equal-Weight | 2,738.50 | 1,960.00 | -28.4% | Japan | Power Generator | Reiji Ogino |
Source: Refinitiv, Morgan Stanley Research estimates. * non-covered company
M
Coal Returns: A Key Pillar of Security and Growth
"India's robust coal reserves, estimating nearly 400 billion tonnes - among the largest globally - where coal accounts for about 55% of the energy mix and nearly 74% of electricity generation. With annual coal demand currently around one billion tonnes and expected to rise significantly by 2047" Government of India press release.
Asia has three-fifths of global coal reserves, largely in India, China and Indonesia, which happen to be the three largest consumers of energy in the region. Along with Australian reserves, Asia can meet roughly 18 years of energy needs with coal. Coal accounts for 49% of Asia primary consumption ( Exhibit 61 ), and consumption of coal for power and heating has risen in most Asian economies, excluding Korea and Taiwan, which shut down coal-based power generation after 2021 (though this is changing). We see 600mntpa of additional coal consumption in Asia by 2030, i.e., 20bps faster growth than in the past five years, as power, coal gasification and even coal to chemicals/methanol capacity pick up pace. We have seen policy support for coal gasification in India and Indonesia, as well as the refiring of coalbased generation in most economies of Asia, which earlier had looked to shift away from coal.
We estimate coal gasification in India and Indonesia will require 80mntpa of additional consumption, while 200mntpa will be needed for the refiring of coal-based power generation across Asia as AI and industrial needs rise and electricity's share in Asia's energy consumption rises to 25% (vs. 20% currently). China will continue to build coal-based power generation and use it for intermittent loads as renewables grow. The recent policy to allow capacity-based payments on coal power generation does point to policy support for coal power in the mix.
Coal will attract ~US$300bn of new investments in coal-fired power plants and coal mining capex after years of underinvestment due to higher emissions ( Exhibit 92 ). We estimate 40GW of new coal plants will be built in Asia over and above the current 280GW that is already being built.
Coal beneficiaries span the full value chain , led by low-cost producers, exporters, and supporting infrastructure players, as energy security becomes the dominant policy priority. Domestic producers in coal-rich markets (China, India, Indonesia) benefit from higher utilization and pricing, while seaborne exporters (Indonesia, Australia)
gain from tighter supply and strong Asian demand. We like Coal India, Yancoal, Whitehaven. Beyond mining, heavy equipment manufacturers, contractors, logistics, and port infrastructure see higher volumes, while coal-linked power generators benefit from improved dispatch and margins. With underinvestment constraining supply and governments prioritizing reliable baseload over transition fuels, the current environment supports a broad-based upcycle across coal-linked equities. We highlight Caterpillar, Sany, Komatsu and United Tractors.
Caterpillar: One of the Top 7 key picks to benefit, it has mining exposure that is channeled through its Resource Industries segment (~23% of sales), which manufactures and sells equipment used in surface and underground mining operations, such as large mining trucks, large wheel loaders, and dozers. As it relates to energy demand, we estimate that CAT's coal exposure represents low-double-digits of Resource Industries revenue, or low-single-digits of total company revenue.
Cummins: While it does not manufacture heavy mining equipment outright, it is a key supplier of diesel and natural gas engines up to 4,400hp, which power mining equipment globally. The company's exposure to mining is across multiple segments: the majority of ~US$1.2bn Industrial revenues (within Power Systems) are mining related, as well as a meaningful percentage of its US$4bn Parts revenue (within Distribution) and some of its US$1bn Off-highway revenues (within Engines). Notably, Cummins is a large supplier to Komatsu, which itself holds ~25% share of the coal mining industry (by value) globally.
Westinghouse Air Brake Technologies: Primarily a locomotive manufacturer and supplier, mining exposure is embedded within its US$3.9bn Equipment and Component sub-segments. Its core product - electric drive systems, which are mechanically the same systems found in their diesel-electric locomotives - counts Komatsu as its single largest customer within mining.
lu yas switchilly
M
Exhibit 92: We expect Asian economies to spend US$318bn in coal investments driven by higher power demand and coalto-gas switching ~US$318bn
250GW; 20 mnt China US$222bn
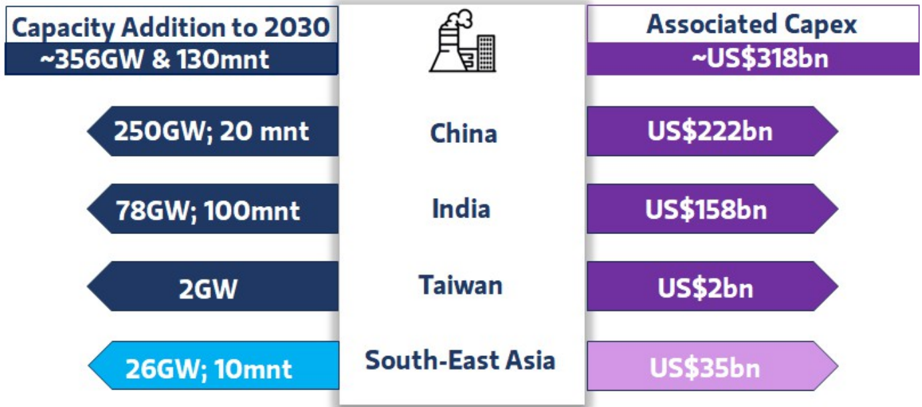
Source: Morgan Stanley Research estimates
More than for any other fuel, the dynamics in coal markets are determined by a handful of major emerging and developing economies, with China by far the most significant, followed by India, Indonesia and other countries in Southeast Asia. Around half of global coal demand is used for electricity generation in these economies. Gas-to-coal switching in power is accelerating from the current energy shock, both in terms of availability and price push utilities toward coal-fired generation. This represents a dramatic reversal of the pre-war trend where many Asian nations had been transitioning from coal to gas as a "cleaner" fossil fuel bridge.
Coal gasification is another area where we see US$98bn investments by India, Indonesia and China to restart (after a lull in the last five years). Every ton of coal produces 0.8mmscmd of synthetic gas which can be converted into methanol and fertilizers. We estimate
80mntpa of coal gasification projects in Asia to start, permanently replacing 20mntpa of LNG needs. India, we believe, could see up to 300mntpa of coal gasification projects beyond 2030 and support feedstock needs for fertilizer, chemicals and the heating needs of industry.
Policy support taking shape: India's Union Cabinet approved US$4bn financial support for coal/lignite gasification. The scheme aims to advance the national target of gasifying 100mnt of coal by 2030, strengthening energy security, and reducing dependence on imports of key products, such as LNG, urea, ammonia and methanol (see more details here). We have seen similar policy support in China and Indonesia. We see an acceleration of policy action to support more coal-based projects (in the case of China, which is now considering 13 large scale facilities) and also in coal export countries like Indonesia ( Exhibit 93 ).
M
Exhibit 93: Coal has re-emerged as the marginal fuel, with switching speed determined more by system design than price alone
| Country | Drivers | Key Actions | Switching Speed | Constraints |
|---|---|---|---|---|
| China | Domestic coal supply, large capacity, state direction | Increased coal generation; >4Bt output, >1,100 GWcapacity | Very fast (weeks-months) | Air quality concerns |
| India | Domestic coal, govt support, cost pressure | Accelerated coal usgae; Delay retirements; add 92GWcoal capacity | Fast (1-3 months) | Grid reliability, transport bottlenecks |
| Indonesia | Largest exporter, domestic availability | Coal-dominant system; insulated fromLNG shock | Fast (1-3 months) | Limited environmental opposition |
| Germany | Energy security, gas disruption | Restarted/extended coal plants | Slow (6-12 months) | Carbon pricing, EUregulations |
| Poland | Existing coal base | Coal dominance; Maintained >60%share | Slow | EU phase-out pressure |
| Netherlands Belgium | Energy security | Extended coal plant operations | Slow | Policy constraints |
| Japan | Idle capacity (~50GW), import diversification | Lifted load factor caps; full coal operation | Moderate-slow (3-9 months) | Public opposition, LNGcontracts |
| South Korea | High coal headroom, stockpiles | Removed coal caps; nuclear >80%utilisation | Slow (6-12 months) | Public opposition, restart limits |
| Taiwan | Existing coal capacity, import infra | Tariff freeze; maintain coal usage | Moderate (3-6 months) | Political sensitivity, limited capacity |
| Singapore | LNG/diesel stockpiles | Use reserves; secure LNGsupply | NA | Fully import dependent |
| Thailand | Limited coal fleet | Increase coal generation; raise tariffs | Very slow (9-12+ months) | Gas contracts, low coal infra |
| Philippines | Large coal fleet (~62% mix), high gas prices | Emergency declared; shiftLNG→coal | Fast (1-3 months) | Environmental opposition |
| Malaysia | Domestic gas availability | Domestic gas reliance; Stable system; tariff adjustment | Moderate-slow (4-9 months) | Coal import logistics |
| Australia | Market pricing | Rising wholesale power prices | NA | NA |
Source: AER, PETRA, PNA (Philippines), ERC Thailand, Morgan Stanley Research
Coal is key to Asia's power security
We see economies in Asia doubling down on abundant and cheap coal-fired generation capacity as well as increasing coal stockpiles as energy security concerns grow. We expect ~40GW of additional new coal-fired power generation capacity to be announced in the next few years, sufficient to diversify its current baseload power mix to weather future energy shocks and the impact from changing weather patterns.
Exhibit 94: Asia: Coal power likely to ramp up in Southeast Asia and China/India, even if natural gas imports were to reduce
| Coal | Coal | Coal | Gas | Gas | Gas | ||
|---|---|---|---|---|---|---|---|
| Economy | Available Coal capacity (GW) | Current Utilisation (PLF) | Additional Coal Capacity Available (to 90% PLF) | Available Gas Capacity (GW) | Current Utilisation (PLF) | Operating Gas Capacity (GW) | Coal capacity available (% of operating gas capacity) |
| Singapore | NA | NA | NA | 11 | 53% | 6 | 0% |
| Thailand | 5 | 53% | 2 | 34 | 45% | 15 | 13% |
| Taiwan | 13 | 0.68 | 3 | 23 | 65% | 15 | 18% |
| Malaysia | 13 | 79% | 1 | 15 | 46% | 7 | 20% |
| Korea | 33 | 0.75 | 5 | 53 | 43% | 23 | 22% |
| Japan | 53 | 54% | 19 | 80 | 41% | 33 | 58% |
| Australia | 21 | 0.65 | 5 | 14 | 41% | 6 | 95% |
| Philippines | 13 | 70% | 3 | 3 | 70% | 2 | Fully Covered |
| Vietnam | 27 | 0.7 | 5 | 10 | 40% | 4 | Fully Covered |
| Indonesia | 52 | 56% | 18 | 21 | 30% | 6 | Fully Covered |
| China | 1,355 | 0.49 | 555 | 150 | 26% | 39 | Fully Covered |
| India | 226 | 65% | 56 | 21 | 14% | 3 | Fully Covered |
Source: EMA, IEX, EPPO, ST Tenaga, KEPCO, Taipower, EVN, Statistical Review of World Energy, Morgan Stanley Research estimates
CAmell DO.
Mistolcally powel mainels Have quickly duapleu lo mynel Livo plices Waltynel Carteu yellel aulull.
M
Coal: Competitive, and works well with gas and batteries - 2024
*2023
Coal is playing a significant role in powering the industrial and data center boom, particularly in Asia. Data centers require reliable, affordable, 24/7 power regardless of geopolitical and external factors, and coal remains a reliable, easy to store and abundant energy source in Asia. 2015
Coal-fired power offers several advantages:
1,800
1,300
- Cost competitiveness: Coal remains the cheapest baseload power source in most Asian markets ( Exhibit 95 ):
- ° China: Coal power costs ~US$40-50/MWh vs. US$60-80/MWh for gas
2019
2020
Exhibit 95: Historically power markets have quickly adapted to higher LNG prices with higher coal-fired generation.
800
500
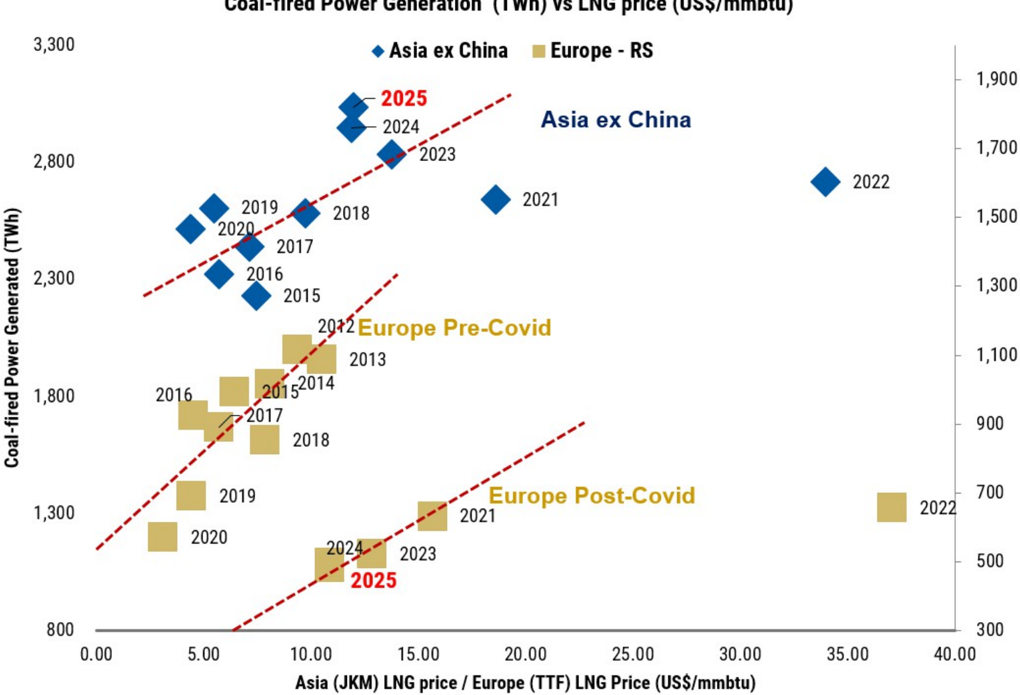
Source: Statistical review of world energy, Morgan Stanley Research estimates
2021
Europe - RS
Coal-fired Power Generated (TWh)
- ° India: Coal power ~US$35-45/MWh, critical for this price-sensitive market
- ° Indonesia: Abundant domestic coal makes it the cheapest option at US$30-40/MWh
- Reliability and capacity factor: Coal plants typically operate at 60-85% capacity factors, far exceeding solar (15-25%) and wind (25-40%) without storage. This high availability is critical for data centers requiring 99.99%+ uptime.
- Grid stability: Coal's synchronous generators provide inertia and reactive power support critical for grid stability - services that inverter-based renewables require additional equipment to replicate.
- Dispatchability: Unlike renewables, coal power can be dispatched on demand to meet load fluctuations, reducing the need for expensive storage or backup systems.
2022
M
Exhibit 96: Coal remains at a significant discount to alternative fuels, which should accelerate gas-to-coal switching
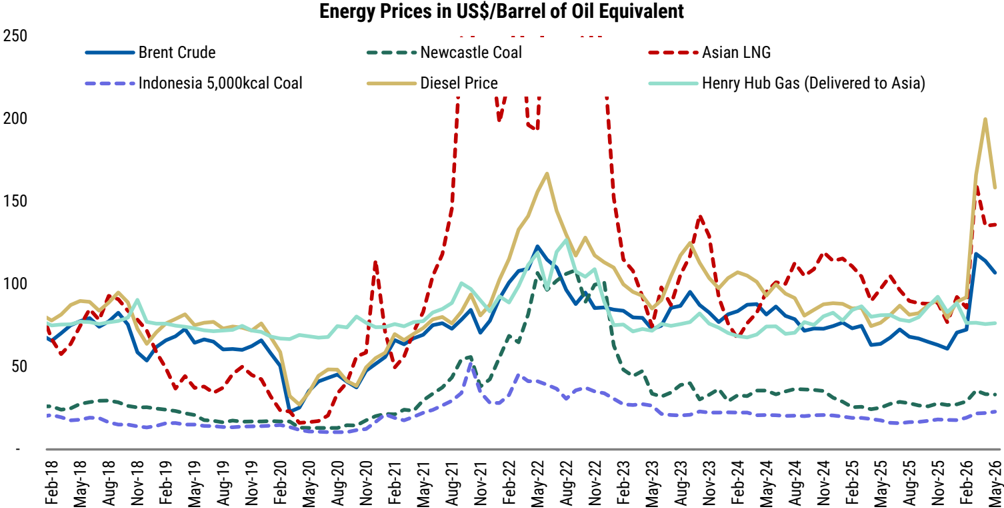
Source: Refinitiv, Morgan Stanley Research.
Underinvestment to reverse
Coal demand is also structurally sticky ( Exhibit 97 ). Power plants are designed for specific coal qualities, limiting fuel flexibility and anchoring demand within defined sourcing pools. At the same time, supply is concentrated (Indonesia low-CV, Australia high-CV) and constrained by years of underinvestment, keeping the market tight. Our bottom-up power generation model suggests Asia's thermal coal demand will continue to remain flattish for the rest of the decade as new generation capacity is added, while coal also acts as a buffer to energy storage and renewable volatility. We also see investments in coal mining rising across Asia by 1.2-1.3x to support the power and natural gas/chemical/fertiliser needs of Asia. Overall we estimate coal's share in primary energy consumption will be near 45% by 2030 (broadly unchanged vs. 2024-25) for Asia vs. expectations of a decline by other agencies.
Exhibit 97: Asia's thermal coal consumption for power
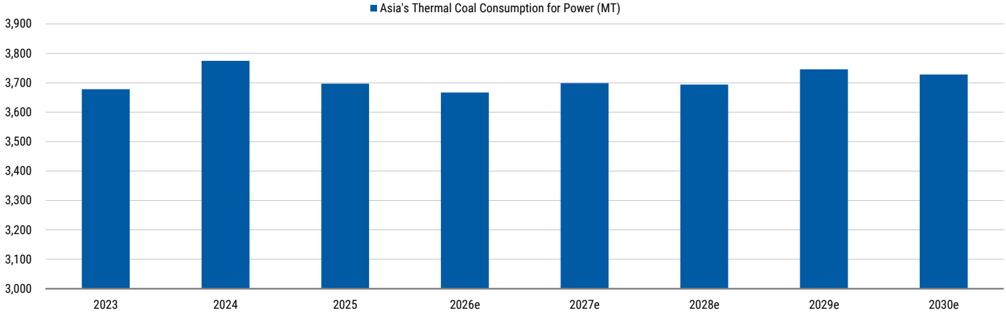
Source: Morgan Stanley Research (e) estimates
M
Exhibit 98: Indonesia and Australia are the major exporters of thermal coal in Asia
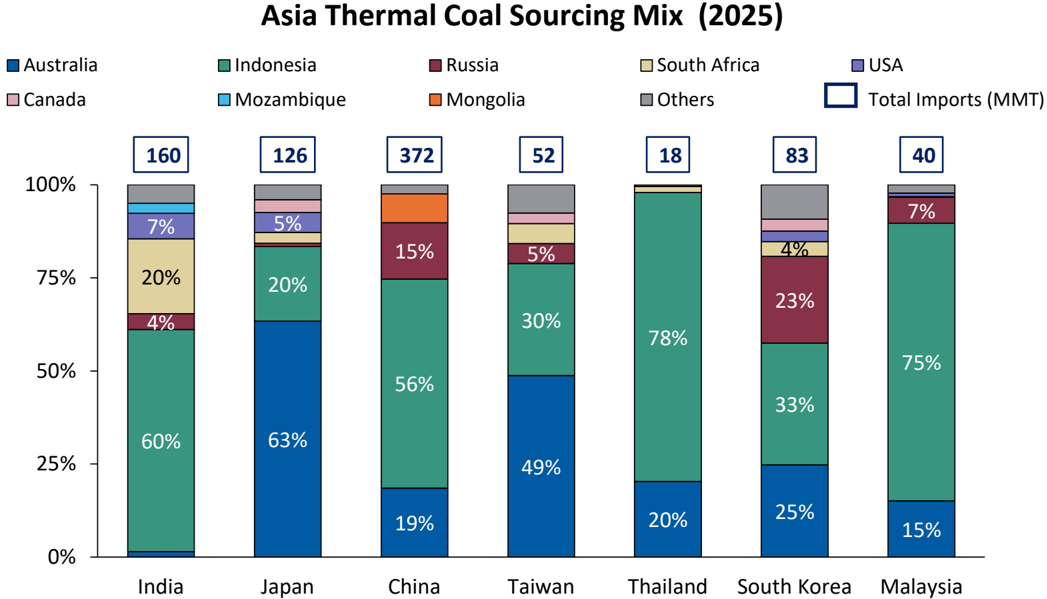
Source: Sxcoal, Ministry of Commerce (India), Platts, Tex Report, Morgan Stanley Research
Seaborne coal: Pacific Basin to outperform
From a seaborne pricing perspective, we see the strongest support for higher-calorific-value thermal coal grades, particularly Newcastle 6,000 kcal/kg. Our projected c.500Mtpa increase in Asian coal consumption by 2030 is unlikely to translate into one-for-one into seaborne demand. China and India remain focused on domestic supply growth and import substitution, so upward revisions to Chinese coal burn should provide a more stable floor for China's thermal coal imports, rather than signalling a return to strong structural growth in seaborne volumes.
The more direct opportunity for export-oriented producers is likely to be in North Asian import markets, particularly Japan, Korea and Taiwan, where any incremental coal burn from power-plant life extensions or restarts would need to be met largely through the seaborne market. Australian exporters are well placed to capture
this demand given their proximity and high-CV coal grades, while a projected decline in Australian thermal coal production should limit upside in export supply. Recent policy signals reinforce this theme: South Korea has moved to extend the operation of three coal-fired units previously scheduled for closure in 2026, while Taiwan has instructed Taipower to restart two Mailiao coal-fired units from May for an initial three-month period, with the possibility of extension depending on developments in the Middle East. These measures underline coal's renewed role in regional energy security and could weigh on efforts to accelerate coal-fired capacity retirements. Overall, we see Newcastle 6,000 kcal/kg prices supported around US$130/t toward the end of the decade.
More broadly, Pacific Basin exporters should be better positioned than Atlantic Basin suppliers. Indonesia is also well placed to capture demand growth from utilities in Southeast Asia and any upside to Chinese or Indian import demand if domestic production falls short.
M
Exhibit 99: Coal: 2025 coal trade flows Asia in million tonnes
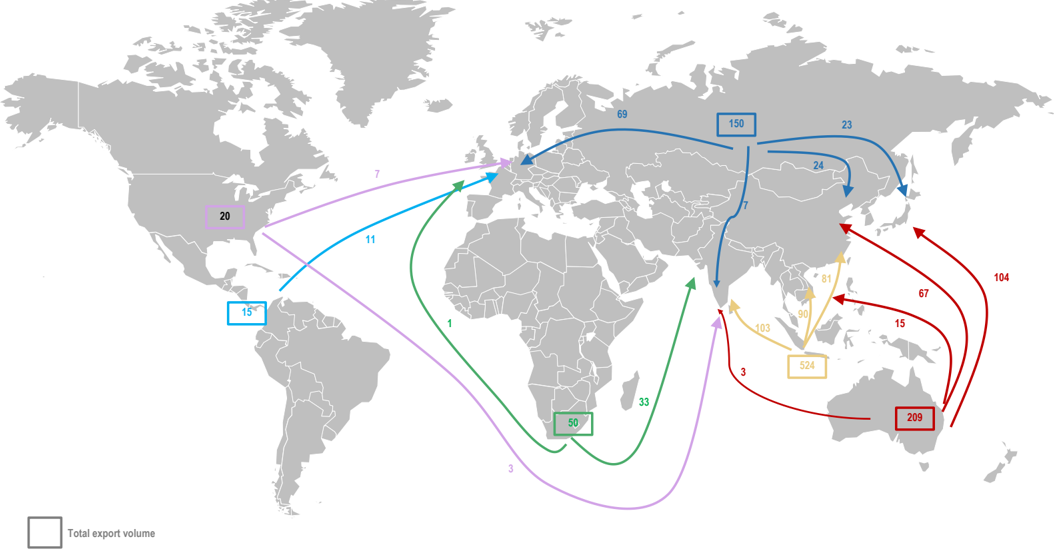
Source: Platts, Tex Report, Morgan Stanley Research
M
Coal: Key Beneficiaries across the value chain
Exhibit 100: Beneficiaries across the Coal Value Chain
| BBGTickers | CompanyName | Ticker | Market cap, current,USD (MM) | 3MADTV,USD (MM) | Rating | Share price, last Price Target (Local %Upsidefrom | Share price, last Price Target (Local %Upsidefrom | Share price, last Price Target (Local %Upsidefrom | Country | Sub-Sector | MSAnalyst |
|---|---|---|---|---|---|---|---|---|---|---|---|
| BBGTickers | CompanyName | Ticker | Market cap, current,USD (MM) | 3MADTV,USD (MM) | Rating | close | CCY) | last close | Country | Sub-Sector | MSAnalyst |
| Heavy Equipment &Services | |||||||||||
| CAT US | Caterpillar Inc | CAT.N | 420,124.4 | 494.8 | Equal-Weight | 860.15 | 915.00 | 6.4% | United States of America | Mining Machinery | Angel Castillo |
| 6301 JT | Komatsu | 6301.T | 39,336.4 | 172.2 | Overweight | 6,190.00 | 5,400.00 | -12.8% | Japan | Mining Machinery | Lisa Jiang |
| 600031CG | Sany Heavy Industry Co., Ltd. | 600031.SS | 26,639.9 | 240.1 | Overweight | 19.40 | 28.00 | 44.3% | China | Mining Machinery | Sheng Zhong |
| 6503 JP | Hitachi Construction Machinery CoLtd* | 6305.T | 7,450.2 | 37.2 | Not Covered | 34.53 | NA | NA | Japan | Mining Machinery | Not Covered |
| CMI US | Cummins Inc | CMI.N | 93,307.2 | 140.1 | Overweight | 716.45 | 752.00 | 5.0% | United States of America | Power Systems for Mining Machinery | Angel Castillo |
| WABUS | Westinghouse Air Brake Technologies Corp | WAB.N | 43,316.9 | 67.8 | Overweight | 255.29 | 318.00 | 24.6% | United States of America | Power Systems for Mining Machinery | Angel Castillo |
| WEIR LN | Weir Group PLC | WEIR.L | 8,626.4 | 48.9 | Equal-Weight | 2,436.00GBp | 2,800.00GBp | 14.9% | United Kingdom | Services &Equipment | Max Yates |
| METSO FH | Metso Corporation | METSO.HE | 14,543.0 | 30.5 | Equal-Weight | 14.98 | 16.50 | 10.1% | Finland | Services &Equipment | Max Yates |
| EPIA SS | Epiroc AB | EPIRa.ST | 24,193.7 | 49.5 | Overweight | 260.10 | 300.00 | 15.3% | Sweden | Services &Equipment | Max Yates |
| SANDSS | Sandvik | SAND.ST | 49,030.3 | 91.9 | Equal-Weight | 360.60 | 390.00 | 8.2% | Sweden | Services &Equipment | Max Yates |
| UNTR IJ | United Tractors Tbk PT | UNTR.JK | 5,824.0 | 6.9 | Overweight | 24,850.00 | 35,000.00 | 40.8% | Indonesia | Services &Machinery | Mayank Maheshwari |
| ADROIJ | Alamtri Resources Indonesia | ADRO.JK | 4,369.0 | 12.9 | Underweight | 2,230.00 IDR | 1,466.00 IDR | -34.3% | Indonesia | Services | Mayank Maheshwari |
| Coal Miners | |||||||||||
| COALIN | Coal India Limited | COAL.NS | 29,940.7 | 61.1 | Equal-Weight | 456.95 | 420.00 | -8.1% | India | Thermal Coal | Rahul Gupta |
| 1088HK | China Shenhua Energy | 1088.HK | 19,371.1 | 96.2 | Overweight | 44.52HKD | 53.60HKD | 20.4% | China | Integrated coal | Hannah Yang |
| 1898HK | China Coal Energy Co., Ltd. | 1898.HK | 6,641.1 | 48.6 | Overweight | 12.84HKD | 17.70HKD | 37.9% | China | Coal + chemicals | Hannah Yang |
| 1171HK | Yankuang Energy Group CoLtd | 1171.HK | 7,652.7 | 99.2 | Overweight | 14.26HKD | 21.90HKD | 53.6% | China | Thermal Coal | Hannah Yang |
| 601225CG | Shaanxi Coal Industry | 601225.SS | 33,944.2 | 182.7 | Overweight | 24.17 | 30.00 | 24.1% | China | Thermal Coal | Hannah Yang |
| PTBA IJ | PT Adaro Andalan Indonesia Tbk* | AADI.JK | 4,227.9 | 14.0 | Not Covered | 0.54 | NA | NA | Indonesia | Thermal Coal | Not Covered |
| BUMI IJ | Bumi Resources Tbk PT* | BUMI.Jk | 4,501.0 | 61.3 | Not Covered | 0.01 | NA | NA | Indonesia | Thermal Coal | Not Covered |
| WHCAU | Whitehaven Coal Ltd | WHC.AX | 4,590.2 | 37.3 | Overweight | 8.19 | 9.55 | 16.6% | Australia | Thermal Coal | Rahul Anand |
| 3668HK | Yancoal Australia Ltd | 3668.HK | 6,229.6 | 23.3 | Overweight | 38.12HKD | 52.80HKD | 38.5% | Australia | Thermal Coal | Hannah Yang |
| GLENLN | Glencore PLC | GLEN.L | 91,084.5 | 291.7 | Overweight | 562.50GBp | 610.00GBp | 8.4% | Switzerland | Diversified Mining | Alain Gabriel |
Source: Refinitiv, Morgan Stanley Research. *non-covered company
M
Power Grids: Unlocking the Gridlock
"As the AI industry grows rapidly, countries are working to revamp and modernize their aging power grids." -
Jensen Huang CEO of NVidia
Unprecedented Capital Deployment
Access to power via the grid is key in this 'Age of Electricity' and is a US$1trillion investment need ( Exhibit 101 ). A lack of grid capacity is emerging as a critical bottleneck in many regions, driving higher levels of congestion and slowing the deployment of new electricity generation, storage and demand. Grid connection queues have reached record levels worldwide. The combination of surging electricity demand from AI/data centers, industrial onshoring, and
Exhibit 101: A Trillion Dollar Investment in Asia's Grids by 2030
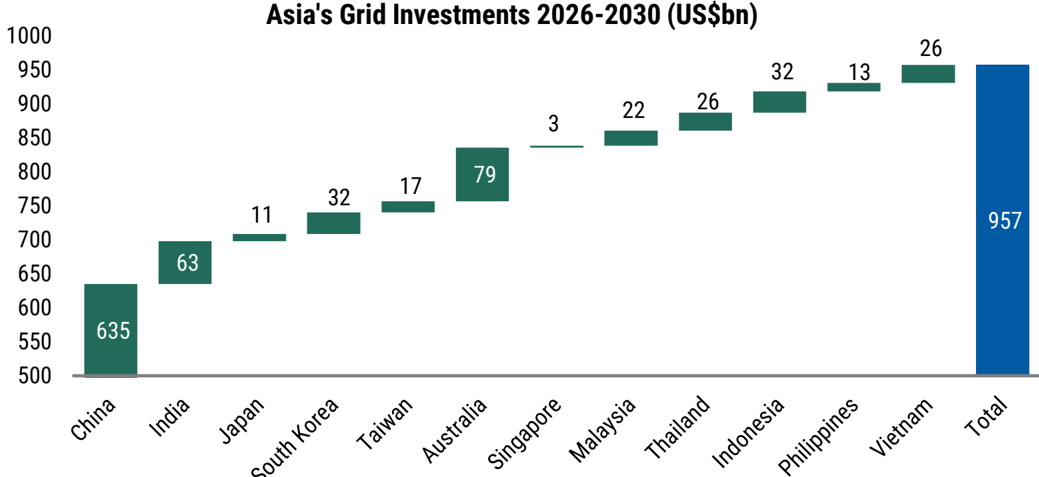
Source: Morgan Stanley Research estimates
renewable integration is driving the largest grid infrastructure investment cycle in history. Renewable curtailments remain high and require faster grid investments than ever.
Grid investments in Asia will be US$1trn in 2025-30 ( Exhibit 101 ) as they catch up with the deployment of renewables over the past decade, with Asia expected to consume 19 trillion units of power (kWh) in 2030. Global grid investment likely topped US$470bn for the first time last year, representing a 16% increase following 15% growth in the previous year. The World Bank estimates Asia needs >US$9trn for power system transformation. For stock investors, we believe grid infrastructure represents lower-risk, longer-duration investments than fuel-specific plays. See key beneficiaries in Exhibit 112 .
M
A pivotal issue for security in this Age of Electricity is the speed at which new grids, storage and other sources of power system flexibility are put in place. For the moment, some of these elements are lagging. Investments in electricity generation globally have charged ahead by almost 70% since 2015 to US$1trn per year, but annual grid spending has risen at less than half the pace to US$400bn ( Exhibit 102 ). This increases congestion, delays the connection of new sources of electricity generation and demand, and pushes up electricity prices. Curtailment of wind and solar output is on the rise, as are incidences of negative pricing in wholesale markets, but slow pace of approvals from regulators is holding back grid projects, as are tight markets for transformers and other components.
Grid companies have seen their valuations re-rate by 15% in the past two years, and regulators are allowing for a 20-30% CAGR in new grid investment ( Exhibit 103 ), which should support the next leg of value creation above the cost of capital over the next five years.
How are economies investing?
China: China announced a record Rmb5tn (US$722bn) grid investment over 2026-30 - a 40% increase from the prior five-year cycle - with State Grid Corporation committing US$88 billion in transmission and distribution spending in 2025 alone, driven by the need to integrate 500GW+ of annual renewable additions while maintaining coal as a "flexible, supporting resource" during supply shocks (see our views here).
India - grid expansion and flexibility with storage: As India targets 500GW of non-fossil capacity by 2030, there is a need to expand (to connect RE-rich regions with demand centers) and modernize the transmission network (an RE-heavy system is inherently more complex → new investments in digital grid management, real-time monitoring, and advanced controls to maintain stability). Grid flexibility is a core challenge - there are rapid clean energy adoption and EV penetration increases; variability strains the grid as well as aging coal thermal plants (especially during peak demand and non-sunny/nonwindy hours). Thus, energy storage (battery installations and pumped hydro projects) have emerged as core to the transition. Distribution company performance is improving with narrower losses, better billing, and a shift to profitability, but execution remains uneven. Strengthening discoms (financial and operational health) is critical; here measures such as smart metering and cost-reflective tariffs will likely hold the key. India's energy stack aims to create interoperable, real-time digital platforms for optimizing balancing supply-demand and grid integration.
The future grid is expected to be far more data-intensive - with smart meters, IoT devices and even consumers becoming 'prosumers' who both use and supply energy to the grid. This digital layer should enable new business models (e.g., peer-to-peer energy trading and virtual power plants) and improve overall operational efficiency.
Japan: Japan's power grid investment plan to 2030 is centred on fixing structural transmission bottlenecks to enable decarbonisation and rising power demand, with the government (via METI/OCCTO) targeting roughly ¥6-7 trillion (~US$40-45bn) of transmission investment alongside specific large-scale HVDC projects such as the 2GW Hokkaido-Tokyo corridor (¥1.5-1.8 trillion) and multiple interconnection upgrades that collectively aim to nearly double cross -regional capacity by 2030. The strategy prioritises linking renewable-rich regions (Hokkaido, Tohoku, Kyushu) to demand centres, improving resilience and system flexibility and accommodating incremental loads from AI, data centres and semiconductors, with grid expansion now a critical enabler of Japan's broader energy transition. Government investment and lending plans include direct financial support, including direct loans totaling ¥54 billion to OCCTO to boost critical transmission and interconnector development.
Korea: The Korean government has laid out a multi-phase master plan to build out the energy highway over the next two decades. It is a long-term project aimed to unfold in stages, eventually resulting in a 'U-shaped' HVDC backbone spanning the nation's coasts that supports 20GW of new renewables as well as demand from data centers and high-tech industries.
Malaysia: The government is investing heavily in grid and infrastructure modernization, with state utility Tenaga Nasional committing US$10bn in grid upgrades to support the growth of data centers and more generation from renewables.
M
Exhibit 102: Global investments in renewables have slowed as grid constraints and energy security concerns weigh in
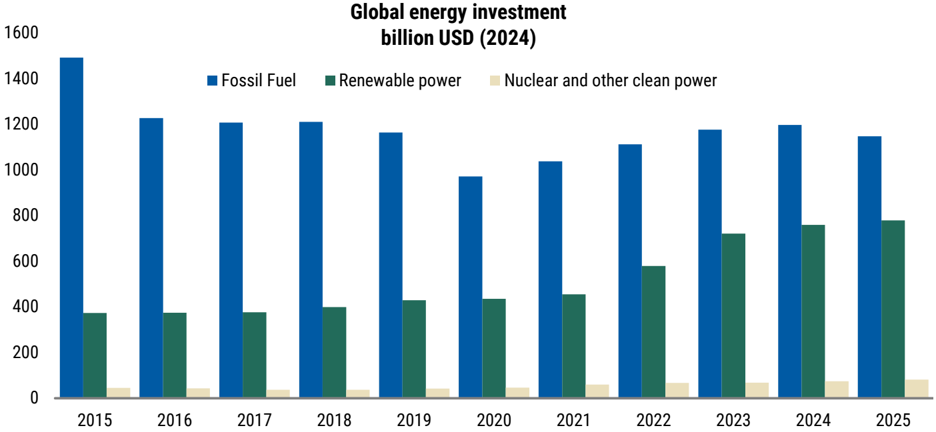
Source: IEA, Morgan Stanley Research
Regulated Returns: Incentivizing Investments
Regulated utilities like power grids across different jurisdictions operate under varying return frameworks that influence both the pace of investment and attractiveness to investors. Regulators are increasingly moving to more performance-based grid regulation, supporting accelerated investment recovery mechanisms, which incentivize grid operators to improve service quality and investments. In addition, higher power demand and flexible storage help accelerate capital recovery for grid operators.
Performance-based regulation: Shift from pure cost-of-service to performance incentives, particularly for reliability, renewable integration, and customer satisfaction ( Exhibit 103 ).
Accelerated recovery mechanisms: Many jurisdictions are implementing trackers and riders to accelerate cost recovery for grid modernization and renewable integration.
Exhibit 103: Grid Investments: How regulated returns regimes stack up in Asia vs. the rest of the world
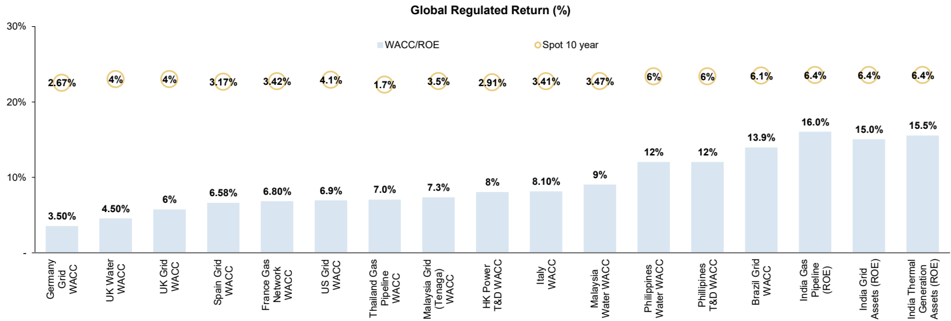
Source: Bloomberg, company data, Morgan Stanley Research
20%
0%
-20%
-40%
-60%
-80%
dieds
60%
50%
40%
30%
20%
10%
0%
M
Learnings from Europe: High renewables and insufficient baseload generation accelerate grid investments
Global power investment has tilted heavily towards variable renewables while comparatively little new firm 'baseload' or flexible capacity has been added, a mismatch that is showing up as rising curtailment. In 2015, spending on clean power was roughly 2:1 vs. unabated fossil; by 2024 it was about 10:1. Curtailment of renewable power is rising globally ( Exhibit 105 ), especially in places where wind/solar growth has outpaced transmission, storage and flexible demand. Hotspots include Western China and parts of Australia, and they are starting to show up in India as well. Midday oversupply and grid congestion is largely considered to be to blame.
Exhibit 104: European power markets are becoming tight with the baseload gap/demand the highest in central/northern areas
Couran. CNTCAC Marran Ctanlau Dassarah antimatad
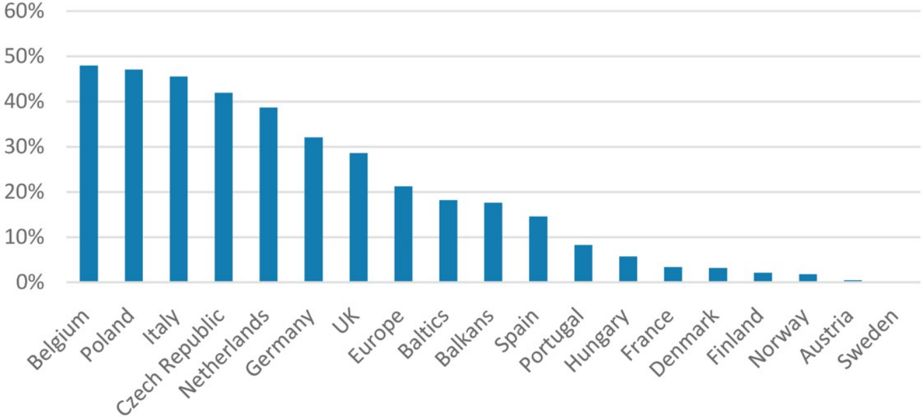
Source: ENTSOE, Morgan Stanley Research estimates
In China, renewable curtailments peaked at ~9% in 2024, and were ~6.6% for solar power in 2025. Regulators have introduced a policy that requires renewable projects commissioned after June 2025 to have market-linked pricing eventually. At end 2024, 55% of China's total wind and solar power volume participated in market trading and, as this set to rise to 100% in 2026, it is likely the market tariff declining trend will accelerate. In China, wind/solar utilization hours, which reflect actual power generation volume based on operational installed capacity, were about six hours for wind and four hours for solar on average in 2024 for the top 10 operators, so we think gas can play a major role (along with batteries) to provide grid stability and also fulfill the need for mid- to peak power requirements. India, which already has a liberalized power market, has required incremental renewable projects to run around-the-clock since 2024.
M
Exhibit 105: Asia's rising renewable generation is driving increased curtailments as grid upgrades lag
2025 Global Power Generation Mix
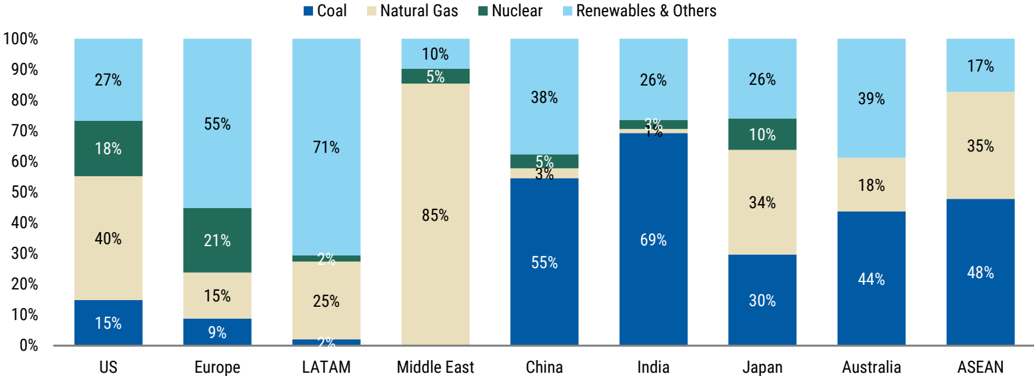
Source: Statistical Review of World Energy, Morgan Stanley Research
Exhibit 106: Fossil investment share in Asia has declined structurally...
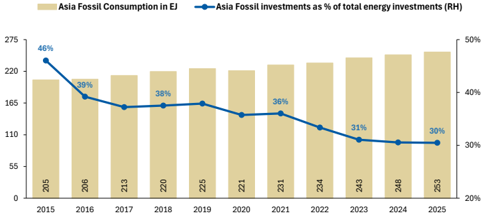
Source: IEA, Morgan Stanley Research
Exhibit 107: ...but remains meaningfully higher in Asia ex-China, highlighting slower transition and continued reliance on fossil fuels outside China
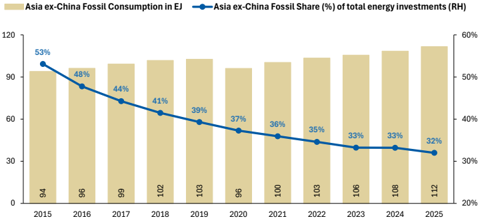
Source: IEA, Morgan Stanley Research
M
Exhibit 108: Spot power peak-trough spreads are significantly wider across Asia, making natural gas viable
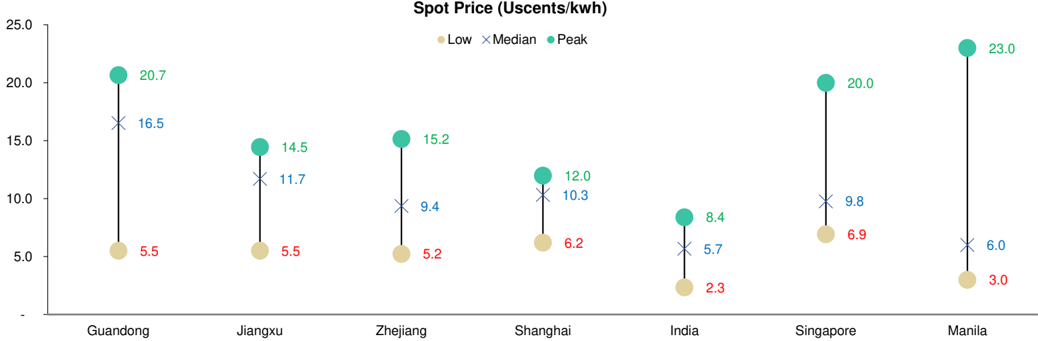
Source: Company data, Morgan Stanley Research
Exhibit 109: The South Australia Duck Curve (MW) is getting deeper as increasingly more renewables enter the system, making grid strength key
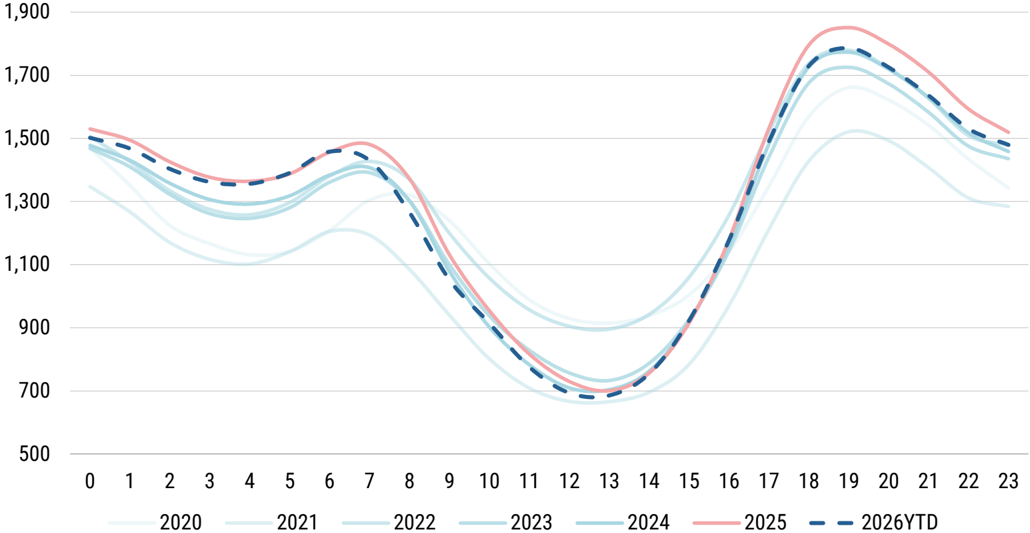
Source: Australian Energy Market Operator, Morgan Stanley Research. Shows average hourly demand. 2026 is for Jan-Apr.
BluePaper
capaully lo duueu
Grid equipment delivery lead times by component, Q2 2024
call price mmation, but trelate Ul mul ease appears to havelouel ated
M
Min: 80
GSU|
Grid Equipment Supply Chain Remains a Bottleneck Min: 1 Max: 48| Max: 48 Max: 60 Avg: 11|
Avg: 22
Min: 1/
Avg: 21
Min: 1
Min: 1/
190
180
170
160
150
140
130
120
Despite the significant step up in grid investments over the past few years to harden power grids globally, equipment remains a key bottleneck ( Exhibit 110 ). Lead times on transformers are 2.5-4.5 years. Orders today are being booked for 2027-28 delivery. Manufacturers are adding transformer capacity ranging from 30-100%, but this is in phases to 2028; Bloomberg New Energy Finance forecasts US transformer demand (units) will be 65% larger in 2027 compared to 2023, and we see network capex doubling in 2030 vs. 2023. We believe the grid equipment bottleneck will further tighten power markets, and support demand for gas-based power generation and quick-tomarket off-grid solutions for data centers. Phase Phase
Lead times on transformers remain high: Depending on transformer type, lead times increased from 40-80 weeks at the start of 2022 to 120 weeks at the end of 2023. However, company feedback signals that transformer lead-times may be even higher than this, e.g., Fortune Electric (not covered) estimates 2-3 years, with European suppliers facing lead times that are higher still.
For more details on our previous work on grids, see our report Global Grid Equipment; Reaching a new peak (link).
Exhibit 110: Grid equipment lead times have been rising significantly, and will likely remain a bottleneck in the near term while capacity is added
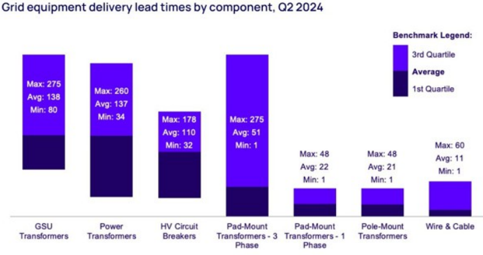
Source: Wood Mackenzie
Indexed Yearly Electrical Equipment PPI Growth
Grid equipment capacity additions take time, with manufacturers expected to expand by 300-400bp: Siemens Energy recently highlighted that it is investing in its transformer capacity, citing expectations of a 30% increase in transformer production after these investments. GE Vernova noted doubling transformer capacity at its Stafford UK facility specifically. Hitachi is making substantial investments in Finland for a greenfield transformer plant (US$180m), and, on top of additional investments globally, this appears set to double its global transformer production capacity in the medium term. Finally, at its capital markets day, Fortune Electric highlighted increasing capacity by 30% per year in 2026 and 2027, but also that it is fully booked out to 2027. Smaller Asian players are also expanding production facility overseas. For example, JST Power Equipment (not covered) is ramping up a new factory in Poland to address the European market, while expanding its footprint in Mexico. To put these capacity increases into perspective, Bloomberg New Energy Finance forecasts point to demand for transformers being 65% higher in North America in 2027 vs. 2023. For the broader market, Siemens Energy and GE Vernova have seen the total grid equipment market growing at a 10% CAGR over 2022-30, with the market expected to be 75% larger in 2030 vs. 2023 ( Exhibit 54 ).
Exhibit 111: Electrical equipment producer price inflation: Transformers and medium voltage switchgears have seen significant price inflation, but the rate of increase appears to have moderated
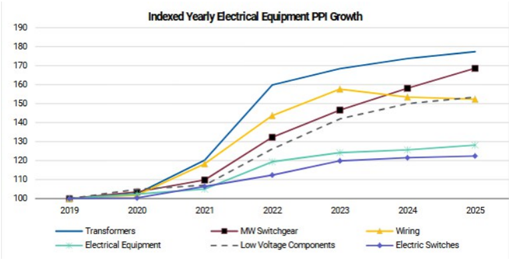
Source: Datastream, Morgan Stanley Research
M
Grid constraints are pushing the meter power equipment needs from US suppliers
US Power Equipment Manufacturers, such as Cummins (CMI) and Caterpillar (CAT), offer a broad breadth of solutions that are likely to benefit from and propel continued diversification in the power generation mix across Asia. Although typically thought of as diesel reciprocating engine manufacturers, both CMI and CAT offer many more solutions that are well tailored toward a broadening of power generation in Asia. Cummins's portfolio includes diesel generators that deliver up to 3.5MW, and natural gas equivalents that deliver up to 2MW. Beyond reciprocating engines, Cummins has an adjacent battery energy storage solution ranging from 100kWh to 2MWh, positioning the company to serve hybrid and renewable integration applications. Rounding out the portfolio, Cummins's Generator Technologies division manufactures alternators sold under the Stamford and AVK brands, serving sectors including marine, oil & gas, mining, data centers, and telecommunications.
Caterpillar's power generation portfolio spans a similarly broad spectrum. CAT diesel generator sets deliver up to 4MW and its natural gas gensets up to 4.5MW. CAT's most differentiated power gen asset relative to CMI is its Solar Turbines subsidiary, which it acquired in 1981. Solar Turbines provide CAT with a meaningful presence in the midsize (1-39MW) gas turbine market that sits above the reciprocating engine capacity ceiling. The turbines have an installed base of over 15,000 units traditionally used in oil and gas compression/distributed power applications, but have more recently been used in prime power/data center applications. Against this backdrop, the breadth of CMI's and CAT's power gen portfolios position both companies as uniquely capable suppliers to support Asia's rapidly diversifying power generation mix.
The Metals Tailwind: More Grid and Power Generation
Every megawatt of new capacity, every kilometre of transmission line, and every barrel of refining throughput added to the system has one thing in common: it is extraordinarily metals-intensive. The metals value chain - from upstream miners to midstream smelters and downstream fabricators - sits at the nexus of every dollar spent on energy security infrastructure. In aluminium, we like China Hongqiao Group and CHALCO, in copper we like Zijin Mining, CMOC and MMG, and in diversified metals we like Sumitomo Metal.
Copper is the single most critical conductor of the energy security buildout required for AI data centers and power grid expansion. BNEF expects global demand to rise from 28.3Mt in 2025 to 42.4Mt by 2040 - a 50% increase - driven by grid expansion, renewables interconnection, transformer manufacturing and data centre power delivery. Yet mined copper output is getting harder to deliver, with declining ore grades at existing mines and a limited number of new copper mines. Scrap may be able to fill some of the gap but will need more investment in processing capacity. As such, supply/demand for copper appears likely to tighten over the medium/long term, which should keep prices supported and drive an increase in the value of upstream resource interests.
Utilities globally are increasingly substituting high-grade aluminium conductors for copper in high-voltage transmission - delivering equivalent power capacity. The IEA estimates that aluminium demand for grid use alone could reach 21-27Mt/year by the 2040s, more than doubling from current levels. This is a secular demand shift: aluminium smelters with access to low-cost, reliable power (particularly hydro or coal-based) are clear beneficiaries, as grid buildout is non-discretionary and government-mandated.
For the steel industry, increased investment in infrastructure (data centers, power grids, power generation facilities, etc.) should support demand. We anticipate a certain level of benefits from a construction demand perspective for Asia ex Japan. On the other hand, domestic steel demand in Japan is likely to remain on a structural downtrend due to Japan's declining population.
M
Power Grids: Key Beneficiaries of Asia's US$1trn Investment
Exhibit 112: Power Transmission & Distribution Equipment Suppliers and Power Grid Operators
| BBGTickers | Market cap, | 3MADTV,USD (MM) | Rating | Share price, last Price Target (Local %Upsidefrom | Share price, last Price Target (Local %Upsidefrom | Share price, last Price Target (Local %Upsidefrom | Country | ||||
|---|---|---|---|---|---|---|---|---|---|---|---|
| CompanyName | Ticker | current,USD | close | CCY) | last close | Sub-Sector | MSAnalyst | ||||
| Power Grid Equipment | |||||||||||
| 6501 JP | Hitachi Ltd | 6501.T | 140,488.1 | 486.6 | Equal-Weight | 4,868.00 | 5,200.00 | 6.8% | Japan | Power T&D Equipment Supplier | Kazuo Yoshikawa |
| 1519 TT | Fortune Electric CoLtd* | 1519.TW | 9,209.4 | 100.7 | Not Covered | 914.00 | NA | NA | Taiwan | Power T&D Equipment Supplier | NANA |
| 267260 KS | HDHyundai Electric CoLtd | 267260.KS | 32,012.4 | 119.0 | Overweight | 1,309,000.00 | 1,500,000.00 | 14.6% | Korea; Republic (S. Korea) | Power T&D Equipment Supplier | Ryan Kim |
| 010120 KS | LS Electric CoLtd | 010120.KS | 29,410.2 | 142.4 | Overweight | 289,000.00 | 240,000.00 | -17.0% | Korea; Republic (S. Korea) | Power T&D Equipment Supplier | Ryan Kim |
| 600406CG | NARI Technology CoLtd | 600406.SS | 31,797.0 | 405.3 | Overweight | 26.90 | 32.25 | 19.9% | China | Power T&D Equipment Supplier | Eva Hou |
| 600312CG | Henan Pinggao Electric CoLtd | 600312.SS | 4,501.2 | 108.9 | Overweight | 22.54 | 27.85 | 23.6% | China | Power T&D Equipment Supplier | Eva Hou |
| 002028CS | Sieyuan Electric CoLtd | 002028.SZ | 22,829.4 | 342.4 | Overweight | 198.35 | 286.50 | 44.4% | China | Power T&D Equipment Supplier | Eva Hou |
| SUFP | Schneider Electric SE | SCHN.PA | 180,395.4 | 311.2 | Overweight | 265.30 | 300.00 | 13.1% | France | Power T&D Equipment Supplier | Max Yates |
| PRY IM | Prysmian SpA | PRY.MI | 51,964.5 | 159.4 | Equal-Weight | 148.80 | 140.00 | -5.9% | Italy | Power T&D Equipment Supplier | Max Yates |
| ABBNSE | Abb Ltd | ABBN.S | 189,604.3 | 239.0 | Equal-Weight | 81.16 | 74.00CHF | -8.8% | Switzerland | Power T&D Equipment Supplier | Max Yates |
| CGPOWERIN | CGPower and Industrial Solutions Ltd | CGPO.NS | 13,776.4 | 27.2 | Overweight | 833.70 | 729.00 | -12.6% | India | Power T&D Equipment Supplier | Girish Achhipalia |
| POLYCAB IS | Polycab India Ltd | POLC.NS | 14,250.9 | 45.4 | Overweight | 9,021.50 | 8,707.00 | -3.5% | India | Power T&D Equipment Supplier | Girish Achhipalia |
| ADANIENS IS | Adani Energy Solutions Ltd | ADAI.NS | 16,187.3 | 34.2 | Overweight | 1,284.30 | 1,133.00 | -11.8% | India | Power T&D Equipment Supplier | Girish Achhipalia |
| Power Grid Operators | |||||||||||
| PWGRIS | Power Grid Corporation of India | PGRD.NS | 29,889.6 | 46.9 | Equal-Weight | 306.30 | 295.00 | -3.7% | India | Power Grid Operator | Girish Achhipalia |
| TNBMK | Tenaga Nasional | TENA.KL | 21,978.2 | 25.2 | Overweight | 14.78 | 15.60 | 5.5% | Malaysia | Power Grid Operator | Mayank Maheshwari |
Source: Company data, Refinitiv Morgan Stanley Research. *non-covered company
Exhibit 113: Significant aluminium and copper demand will arise from Asia's grid infrastructure buildout
| BBGTickers | CompanyName | Ticker | Market cap, current,USD | 3MADTV,USD (MM) | Rating | Share price, last Price Target (Local %Upsidefrom | Share price, last Price Target (Local %Upsidefrom | Share price, last Price Target (Local %Upsidefrom | Country | Sub-Sector | MSAnalyst |
|---|---|---|---|---|---|---|---|---|---|---|---|
| BBGTickers | CompanyName | Ticker | (MM) | 3MADTV,USD (MM) | Rating | close | CCY) | last close | Country | Sub-Sector | MSAnalyst |
| Metals and Mining | |||||||||||
| 1378HK | China Hongqiao Group Ltd | 1378.HK | 42,211.7 | 202.6 | Overweight | 33.34 | 52.90HKD | 58.7% | China | Aluminium | Hannah Yang |
| 601600CG | Aluminum Corporation of China Ltd | 601600.SS | 22,709.2 | 566.0 | Overweight | 11.68 | 17.50 | 49.8% | China | Aluminium | Rachel Zhang |
| 2899HK | Zijin Mining Group CoLtd | 2899.HK | 27,132.4 | 305.4 | Overweight | 35.50 | 55.00HKD | 54.9% | China | Copper &Gold | Rachel Zhang |
| 3993HK | CMOCGroupLtd | 3993.HK | 10,119.3 | 132.2 | Overweight | 20.14 | 26.30HKD | 30.6% | China | Copper | Rachel Zhang |
| 358HK | Jiangxi Copper CoLtd | 0358.HK | 7,036.1 | 75.6 | Overweight | 39.70 | 66.00HKD | 66.2% | China | Copper | Rachel Zhang |
| 1208HK | MMGLtd | 1208.HK | 15,694.0 | 57.9 | Overweight | 10.12 | 11.20HKD | 10.7% | Australia | Copper | Hannah Yang |
| 5713 JT | Sumitomo Metal Mining CoLtd | 5713.T | 18,870.3 | 290.8 | Equal-Weight | 10,275.00 | 10,700.00 | 4.1% | Japan | Copper, Gold &Nickel | Yu Shirakawa |
Source: Company data, Refinitiv Morgan Stanley Research. *non-covered company
M
Renewables: Pacing the Growth
"Here's the problem: Investments in the right infrastructure are not keeping up. That ratio (of investments in renewable generation to grid infrastructure & batteries) should be one to one."
-
António Guterres, Secretary-General of the United Nations
Renewables have been one of the fastest-growing energy sources in Asia over the past five years. We see regulators moderating the pace of growth going forward as the need for base load power rises due to AI, and grid constraints become more acute due to the variability of power supply. We assume renewable capacity expands by 400GW annually on average (vs 450GW in 2025) with US$340bn in annual investments. Batteries for energy storage, coal and natural gas generation could see an upswing in investment to reduce curtailments and make power systems more robust. Hence, we believe pure renewable players may see more limited benefits from the energy investment cycle for the rest of the decade in most markets. Overall, we like companies that aid more adoption of renewable power by providing baseload and grid equipment infrastructure.
Apart from China, Asia should see a step up in building solar and wind equipment supply chains, such as in India and Southeast Asia, to improve access to solar panels and wafers. This should help behind- the-meter renewable deployment to insulate against grid-related challenges, especially in India and Southeast Asia. China might see slower growth in renewable deployment while investment in the upstream supply chain could remain limited considering oversupplied wind turbines and solar panel capacity. We estimate US$2trn in renewable capex across solar, wind, and hydro power generation as 2000GW of capacity is deployed within China (an oversupplied power market) representing 80% of this capacity. India, on the other hand, aims to build solar supply chains from polysilicon to panels while also deploying 230GW of renewables to complement coalbased power generation.
Returns for operators to remain challenged near term: Introduction of market-based price mechanisms as well as curtailments in China, Australia, India and Vietnam where renewable deployment is more advanced are challenging the near-term ROE outlook for operators. Renewables are competing with one another as well as fossil baseload during peak generation periods (i.e., midday when the sun is the brightest) and are inactive during peak demand periods when environmental resource is low. This results in limited revenue opportunities and poor economics for projects without firm take or pay PPAs. Although current energy storage economics do offer optionality for operators to improve returns, this would require additional investments with limited returns visibility. We remain cautious and selective on renewable operators and equipment providers.
cambr 114. bapackly duutons will grow m a more measureu way as yu upylaues fellal the ney bottleneck
M
Capacity Addition to 2030
Associated Capex
Exhibit 114: Capacity additions will grow in a more measured way as grid upgrades remain the key bottleneck
1,675GW
25GW
39GW
14GW
45GW
46GW
China US$1,395bn
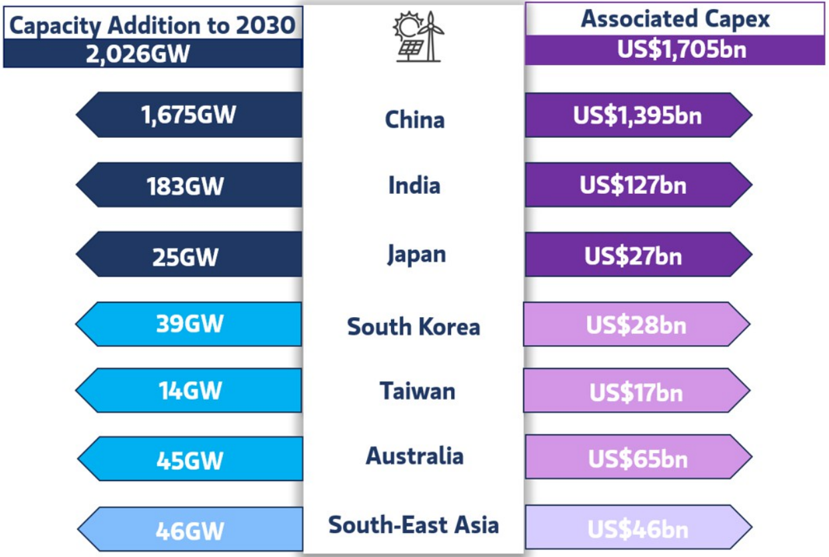
Source: Morgan Stanley Research estimates
Exhibit 115: The Street expects below mid-cycle ROEs for renewable players, while conventional energy and nuclear players could see the largest ROE uplift
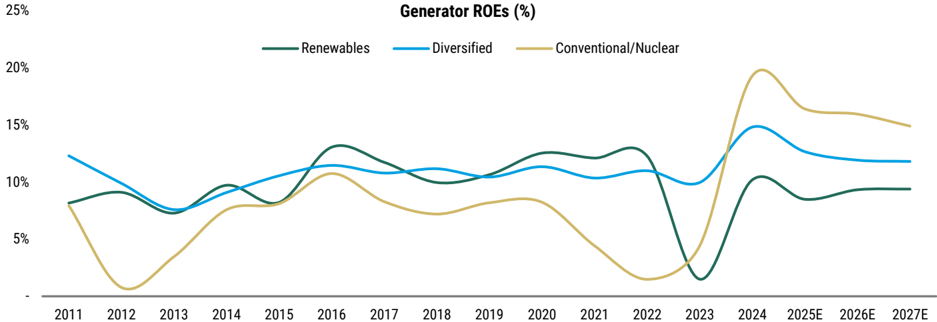
Source: Refinitiv consensus estimates
M
PPA Prices Remain Subdued in Asia
In the US, average PPA prices for renewables vary between US$60 and US$75 per MWh, having doubled in the past five years for solar and wind. In Europe, they average near US$70/MWh and have been flattish for the past five years. However, in Asia, due to weaker local currencies vs. USD, PPA prices have declined 15% for solar and wind since 2020 ( Exhibit 116 ). As a result, we have seen a lot more consolidation as the cost of capital has risen, making scale an important factor to keep renewable returns above the cost of capital in India and Southeast Asia. In China, however, a large part of the PPA price decline has been absorbed by solar equipment manufacturers as they cut prices for panels and wind turbines by an average of 20-30% in the past five years.
Exhibit 116: Solar PPAs auctions prices have not had the same pace of decline as equipment costs
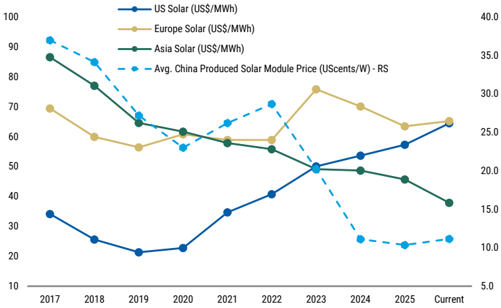
Source: PVinfo, Morgan Stanley Research
The Story of Rising Curtailments for Renewables
Curtailment of renewable power is rising globally, especially in places where wind/solar growth has outpaced transmission, storage and flexible demand. Hotspots include Western China, California and the US Midwest, Europe, parts of Australia, northern Chile, Brazil's Northeast, and India's Rajasthan. Midday oversupply and grid congestion is largely the cause. Renewable returns are affected as near-term policy responses are centered on accepting a 'normal' level of curtailment as least-cost, which prevents renewable operators from dispatching power. ( Exhibit 118 ) For the longer term, we expect grid hardening and ESS deployment to reduce curtailment risks.
Exhibit 117: Wind and solar government auction average prices in Europe remain significantly higher than in 2021
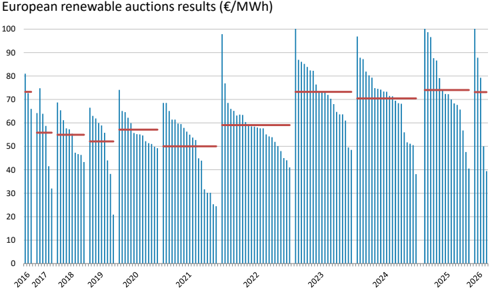
Source: Various sources, Morgan Stanley Research
Renewables capacity expansion → system integration in India: The power sector has entered a new and more demanding phase of clean energy transition. In the past decade, the emphasis was on RE addition; now it is on integrating diverse energy sources into a stable and efficient grid. The focus is shifting from lowest-cost energy (LCOE) auctions to system-level economics that value reliability and flexibility. India's power system should be larger, reliable, smarter, flexible, regionally integrated, digitally enabled, and financially sustainable. These objectives can be met through institutional depth, policy support, and improved capability to manage complexity at scale.
How curtailment affects renewable operators' earnings: Curtailment hits earnings mainly by cutting the volume of power a renewable operator can sell to the market. The extent of the impact on earnings depends on the contract/market design and whether the operator is compensated for 'constrained-off' energy. Most merchant/grid PPA contracts do not offer curtailment protection and while CfD contracts in Europe do offer compensation for negative prices, timing, settlement friction and volume risk does exist.
M
Exhibit 118: Earnings sensitivity for new solar projects
| Solar Project | Solar Project | Curtailment | Curtailment | Curtailment | Curtailment | Curtailment | Curtailment |
|---|---|---|---|---|---|---|---|
| Earnings Sensitivity | Earnings Sensitivity | 0% | 2% | 4% | 6% | 8% | 10% |
| 0.14 | 4.8% | 2.8% | 0.8% | -1.3% | -3.5% | -5.8% | |
| 0.15 | 3.2% | 1.2% | -0.8% | -3.0% | -5.2% | -7.6% | |
| 0.16 | 1.6% | -0.4% | -2.5% | -4.7% | -7.0% | -9.3% | |
| 0.17 | 0.0% | -2.0% | -4.2% | -6.4% | -8.7% | -11.1% | |
| 0.18 | -1.6% | -3.7% | -5.8% | -8.1% | -10.4% | -12.9% | |
| 0.19 | -3.2% | -5.3% | -7.5% | -9.8% | -12.2% | -14.7% | |
| 0.2 | -4.8% | -6.9% | -9.1% | -11.5% | -13.9% | -16.4% | |
| 0.21 | -6.4% | -8.5% | -10.8% | -13.2% | -15.6% | -18.2% |
Source: Morgan Stanley Research estimates. *: Assumes increases in module costs is not passed through and assumes a fixed tariff Power Purchase Agreement.
Asia's Clean Power Value Chain: New Supply Chains Emerge Outside of China
China's solar PV module industry remains in significant oversupply. At end-2025, Chinese manufacturing capacity approached 900GW annually, or enough to supply the entire world's solar demand through 2032. We estimate the oversupply will continue, but rationality among players after multiple years of cash losses could lead to rational but low pricing. We remain cautious on China's solar value chain.
Onshoring of supply chain exacerbates oversupply: The simultaneous onshoring of manufacturing capacity in the US, India and Europe - driven by energy security and industrial policy imperatives that are largely indifferent to the global supply-demand balance have added 190GW of module capacity to date. The net result is a global capacity arms race where every major demand center is simultaneously building domestic supply - on top of China's 900GW of existing capacity - creating a structural surplus that could persist through 2030.
Limited margin expansion seen for China's solar value chain: Polysilicon led the ASP rebound in 2025, underpinned by the NDRC's price-floor policy framework introduced in July. This then passed through to the supply chain for wafers and cells, with 20-45% price rebounds vs. early July. In contrast, modules have been slow to reprice, recovering only 0-3% over the same period as power plants have been reluctant to accept cost increases due to IRR concerns amid uncertain power tariffs after the policy nodes of market tariff reforms introduced in May 2025. In addition, there has been rising curtailment in certain regions of China and module producers' bargaining power remains weak amid oversupply and a fragmented market.
camble 112. ve expell too duuitions Ul arounu crooovilty <uou
M
Energy Storage: Enabling Security
The frequency of energy shocks and increasing renewable curtailments are driving a fundamental investment case for battery energy storage systems (BESS) across Asia, as geopolitical instability in natural gas supply chains is accelerating the economic and policy urgency of pairing renewables with storage. This has reset the opportunity cost of renewable curtailment and grid inflexibility: BESS economics now clear 10-15% IRRs when paired with renewable generation assets, as well as in merchant markets where gas peaker replacement and arbitrage spreads have widened. As ESS economics have reached a turning point, we project global ESS installation additions will post a 55% CAGR, from 500GWh in 2025 to 3000GWh in 2030, with China seeing the most significant deployments in Asia, followed by India.
71GWh
Australia
In addition, the need for electrification in transport in India, China and increasingly Thailand, Indonesia and Singapore is leading to new investments in local battery supply chain development with govern- ment incentives. We estimate 2000GWH of new battery capacity could be built in China with 2378GWh of deployment in storage at 6600 GWh in transport, while India could see 100GWh of battery capacity built with ramp-up of deployment from 20GWh to 150Gwh, potentially by 2030 ( Exhibit 119 ).
CATL and BYD are leveraging the energy storage opportunity in China and the rest of Asia, followed by Reliance and Exide Industries in India and Gulf Development and LG Energy Solution in Southeast Asia and Korea. CATL is expanding its technology into sodium ion cells while Reliance and Exide are building capacity in India. BYD has evolved from an EV manufacturer into the world's leading energy storage supplier with cumulative deployments of over 135GWh across 110+ countries, anchored by its proprietary blade LFP battery platform and fully vertically integrated technology stack. By leveraging its second-generation blade battery amid tight capacity, BYD will be stepping up as one of the EV/ESS battery leaders as well.
Exhibit 119: We expect ESS additions of around 2700GWh by 2030
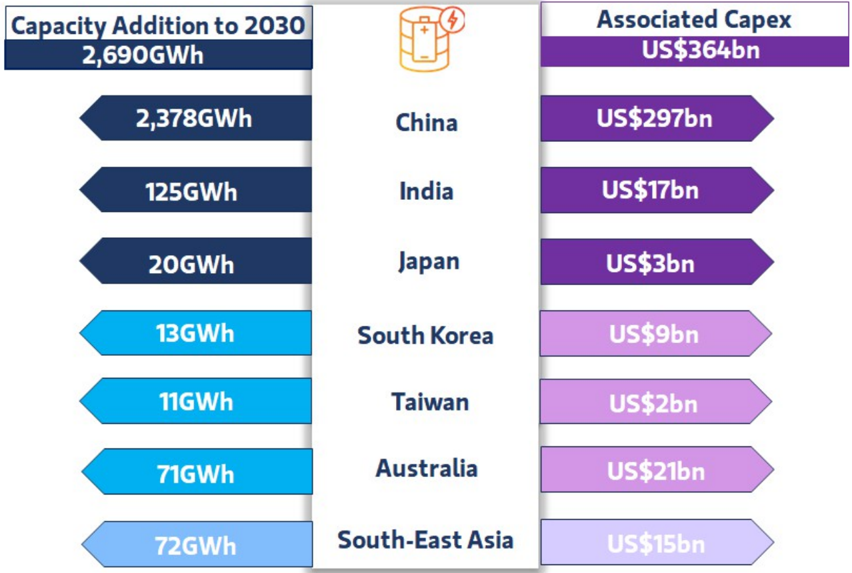
Source: Morgan Stanley Research estimates
M
Key catalysts for deployment:
- Policy acceleration: Philippines, Vietnam, Malaysia, and India have mandated storage-plus-renewable procurement since Q4 2025 (utility companies in India are increasingly offering hybrid solutions, i.e., solar/wind plus battery storage rather than just renewables). South Korea's 563 MW central auction cleared in 2025, signaling merchant market maturation. China's NDRC has encouraged provinces to introduce capacity prices for standalone ESS, following similar moves in five provinces in 2025.
- Cost inflection: All-in BESS capex fell 40% YoY to $125/kWh (ex-China/US) as of October 2025, with levelized cost of storage (LCOS) at $65/MWh making dispatchable solar economically viable.
- Curtailment crisis: China's solar curtailment was ~7% in 2025 (vs. ~4% in the prior year). India curtailed 1,410 GW cumulatively since 2019, signaling a significant need for flexibility assets.
Exhibit 120: Asia's Utility Scale ESS rollout for the rest of the decade will likely be dominated by China, in line with its installed renewable capacity
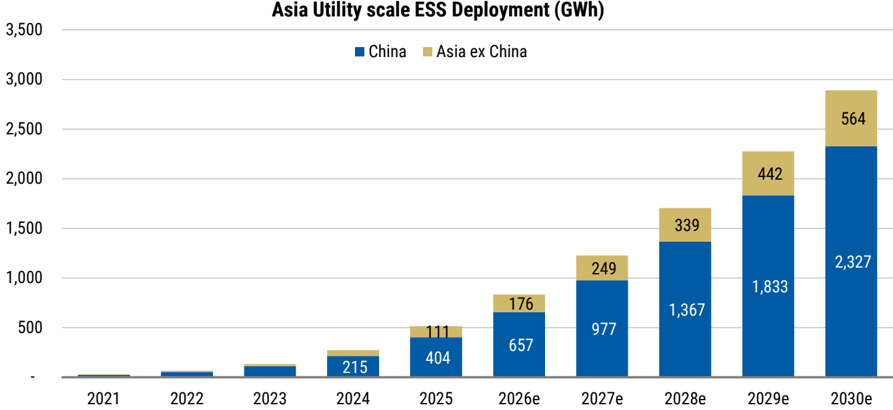
Source: Rystad, Morgan Stanley Research (e) estimates
Exhibit 121: We see Asia ex-China's ESS adoption rate as similar to China for the rest of the decade, catalyzed by energy security concerns and policy acknowledgement of renewable intermittency issues
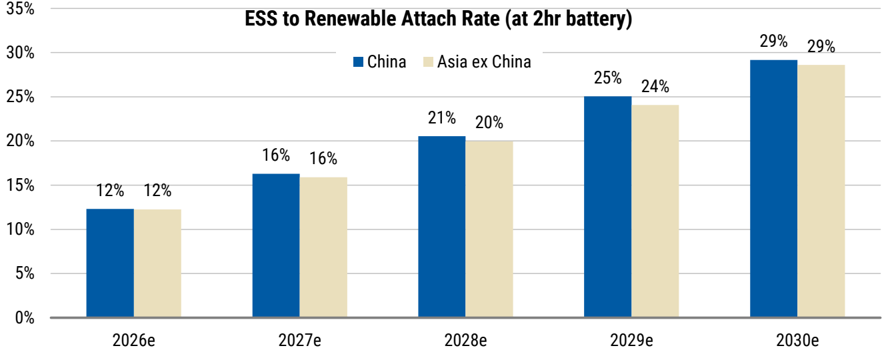
Source: Morgan Stanley Research (e) estimates
Exmbl 144. DUl/ Nase/ Deal Cases lui Cultulative Soo ueploytellu
Exmon 144.4005 0180ial a 200(4010, 40) Projecto Conue to Tall in China by 2035
0.50
GWh
6,000
0.40
5,000
4,000
0.30
0.20
3,000
0.10
2,000
1,000
-
Exon 14o.rulure Lour could allow Los capacily atlaull late X
Exmbil 140. Dase Case. almual miclemenal ueployment lorebaslo duration hours) of the project to be 4x larger to reach cost parity
M
600
500
400
China's ESS Deployment Supercycle: Roadmap for the Rest of Asia
300
0.40
200
100
0.30
We expect utility -scale ESS to be the main growth engine in China over the next five years, supported by policy. In February 2026, China's NDRC encouraged provinces to introduce capacity prices for standalone ESS following similar moves in five provinces in 2025. We see this as an important milestone that accelerates utility -scale ESS development because capacity price support can drive project IRR to attractive levels. With these policies, we expect China's total ESS installation additions to grow from 190GWh in 2025 to 579GWh in 2030. For more details, see Flexible Power - The Next Wave of Growth in AI.
Economics continue to improve: China's utility-scale ESS LCOE (energy storage system, levelized cost of energy) has been significantly lowered over the past three years due to cost deflation, along with lower LCOE of solar power generation. From a solar plus ESS LCOE parity perspective (compared with on-grid benchmark), the current cost structure could allow twice the ESS demand at China's
Exhibit 122: LCOE of solar & ESS (20%, 2H) projects continue to fall
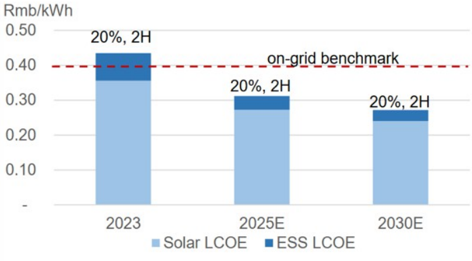
Source: Company data, Morgan Stanley Research (E) estimates
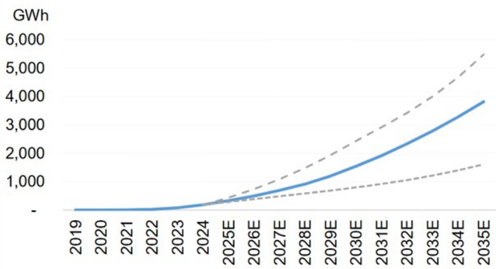
Exhibit 124: Bull/base/bear cases for cumulative ESS deployment in China by 2035
20%, 2H
21% CAGR, 2025-30
14% CAGR, 2025-35
30%, 4H
40%, 5H
utility-scale compared with the level of ~190GWh in 2025, and triple by 2030. In our calculations, we raise the ESS attach rate (the percentage of new solar installations) from 20% currently to 30% in 2025 and 40% in 2030. We also assume duration hours improve from 2 hours to 4 hours in 2027 and 5 hours in 2030, to reach cost parity with the on-grid benchmark ( Exhibit 123 ).
2023
2030E
2025E
Real ESS demand finally unlocked by new renewable pricing scheme: Previously, real ESS demand hadn't been significantly unlocked, despite the lower LCOE, because there was no arbitrage for utility-scale ESS given a zero price spread between base load and peak load on the power generation side in China. Utility-scale ESS has been largely deployed through mandates (renewables with ESS are allowed to be on-grid first) and a large amount of deployment has been under-utilized (using more and losing more) due to zero arbitrage room and energy loss (85-90% energy efficiency). However, we think the renewable energy trading mechanism introduced in China early this year will be a game-changer, as it should help fully utilize ESS to profit arbitrage in the trading market (perhaps also associated with capacity prices, environmental benefits and ancillary service fees).
Exhibit 123: Future LCOE could allow ESS capacity (attach rate x duration hours) of the project to be 4x larger to reach cost parity with the on-grid benchmark by 2030
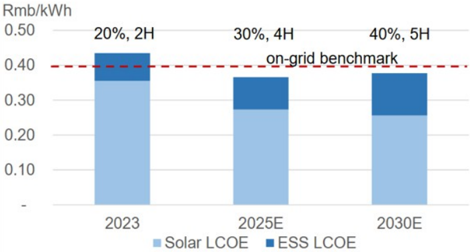
Source: Company data, Morgan Stanley Research (E) estimates
Exhibit 125: Base case: annual incremental deployment forecasts
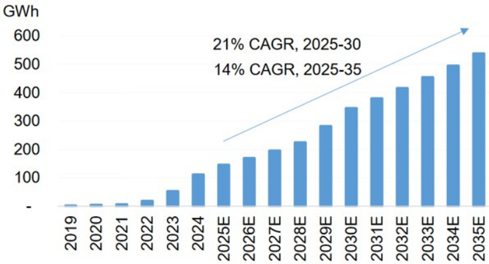
Source: MIIT, Morgan Stanley Research (E) estimates
M Competitive Energy Storage Economics
Battery storage has emerged as a critical enabler of renewable integration and grid stability, with economics improving rapidly. Battery storage costs have fallen sharply, making grid-scale deployments increasingly economic:
- 2024-25 cost decline: BESS system prices have continued to tumble, with utility-scale lithium-ion battery storage costs reaching US$150-200/kWh for 4-hour systems.
- NREL projections: The National Renewable Energy Laboratory's 2025 update sees continued cost declines through 2030.
- LCOS improvement: Levelized cost of storage (LCOS) for large, long-duration utility-scale BESS has dropped significantly across global markets outside China and the US.
Favorable ESS Supply Landscape Drives Adoption
Global ESS cells manufacturing capacity is likely to remain in sufficient for the rest of the decade, which should limit inflationary risks on heighten demand. China will likely remain a critical global ESS supplier despite geopolitical barriers. Localized ESS cell production outside China is developing, but current and near -term scale is still not enough to meet medium -to long -term ESS demand. This should benefit high -end Chinese companies that already have strong track records in overseas premium markets ( Exhibit 127 ).
China - manufacturing capacity expansion for global demand: We estimate China's total nameplate ESS capacity reached ~1,000GWh in 2025, with sales volumes exceeding 600GWh, supported by domestic policies. We expect domestic ESS capacity to continue expanding as utility -scale projects benefit from favorable regulation. We assume half of total battery capacity additions between now and 2030 will be ESS -dedicated, which would bring nameplate ESS cell capacity to ~2,000GWh in 2030.
Although total capacity and shipment numbers are large, high -quality capacity and export -grade volume remain a limited share of the overall base. Much of China's ESS cell output still targets the domestic low -price segment, where technical requirements are lower than in overseas markets.
Exhibit 126: We see current Solar + Battery economics more favorable than gas power peakers
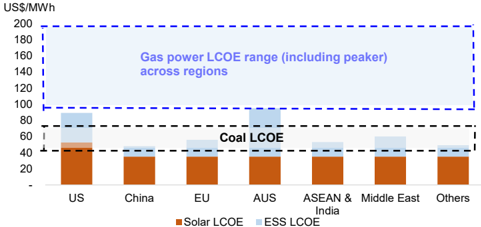
Source: Morgan Stanley Research estimates
Exhibit 127: ESS cell supply-demand by region, 2030
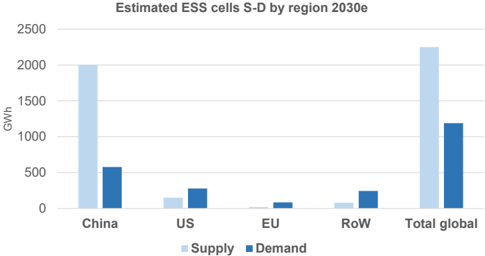
Source: Company data, Morgan Stanley Research (e) estimates. Supply is measured as all announced nameplate capacities; demand is measured as ESS installation volume.
Ex-China ESS capacity is growing: Based on our checks, aggregate ESS cell capacity from non -Chinese suppliers could reach 90100GWh by end -2026, with further room for expansion or conversion to meet non-China demand. That said, time -to -market remains critical for many customers, especially large tech companies, so some buyers may still rely on imported ESS cells despite geopolitical barriers such as tariffs and ITC eligibility.
100%
ЧМО
80%
60%
000'L
40%
008
20%
0%
007
00Z
M
The Sodium Era Is Coming
%06
80%
60%
CATL has already moved sodium -ion batteries into commercial production, with proven reliability in light commercial vehicles operating across extreme temperature ranges, and has confirmed readiness for broader deployment across multiple sectors ( Exhibit 129 ). Beyond commercial vehicles, CATL has also disclosed that sodium -ion batteries are being prepared for passenger-car applications, with certified safety standards and performance metrics comparable to LFP, underscoring that this is no longer a lab -stage solution but an industrialized chemistry poised to scale as volumes ramp ( Exhibit 128 ).
Sodium ion battery for energy storage market: Hyperstrong's 60GWh of orders for sodium-ion batteries showcases energy storage demand for a cold-weather solution that can help control
Exhibit 128: Sodium-ion battery penetration in China's PV mass market
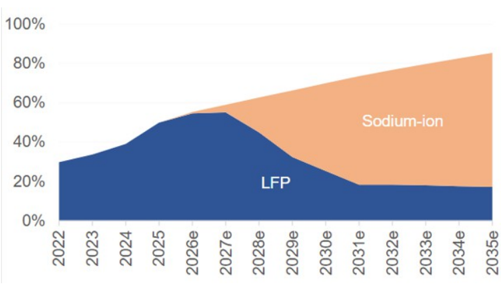
Source: China Passenger Car Association (CPCA), Morgan Stanley Research (e) estimates
energy decay, as well as the technology's higher safety level. After scale-up, the levelized cost of energy (LCOE) of sodium-ion battery energy storage should be more compelling than that of LFP batteries, on our estimates.
LFP
Disruption and penetration. In terms of market penetration, sodium-ion batteries could initially gain traction in light trucks as well as the A0 and A00 passenger vehicle segments. Beyond automotive applications, we see significant potential for sodium-ion technology to replace LFP in the energy storage systems (ESS) market as well. This shift would be supported by key performance advantages, including superior low-temperature charging capability, slower degradation rates and consistent full-power output even at low states of charge, which could greatly enhance reliability for trucks. We think these attributes make sodium-ion a viable and economical alternative to LFP in multiple use cases.
Exhibit 129: Sodium-ion battery penetration in light commercial vehicles in China
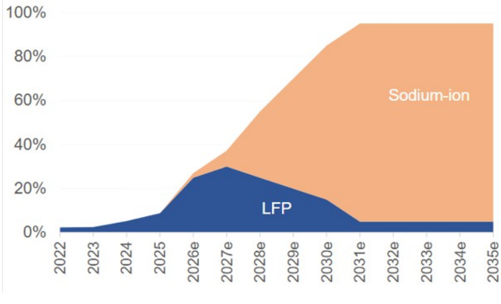
Source: CPCA, Morgan Stanley Research (e) estimates
Exhibit 130: Sodium ion battery shipment forecasts in China, and CATL 's estimated market share
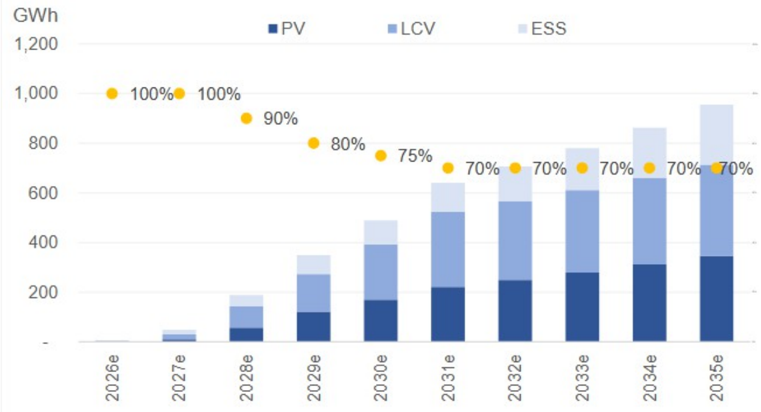
Source: Morgan Stanley Research (e) estimates
camble for ovulull battely economy
M
Material sourcing diversity. Strategically, the adoption of sodium-ion technology represents a move away from lithium dependency, enhancing energy security and reducing exposure to lithium supply constraints. This transition aligns with broader industry efforts to diversify raw material sourcing while maintaining competitive cost structures and performance standards.
Separator Usage: 17 sq.m./KWh Cost: Rmb 0.03/Wh
Exhibit 131: Sodium battery economy
Specific energy: 175 Wh/kg
Labor Cost: Rmb 0.025/Wh
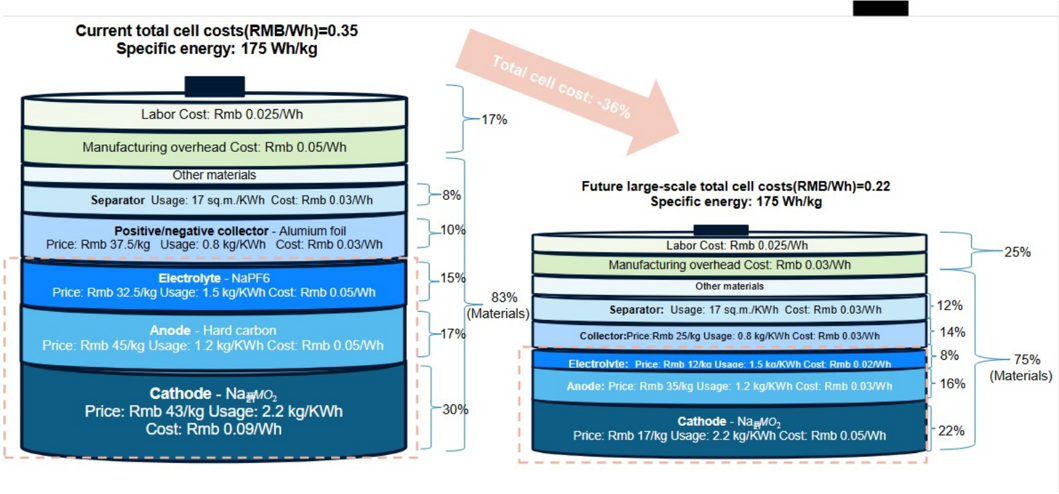
Source: SMM, company data, Morgan Stanley Research estimates
_10%
-25%
M
Renewables and Batteries: Key Potential Beneficiaries of the US$2trn Investment
Exhibit 132: Renewables & Battery Equipment Suppliers
| Market cap, | 3MADTV,USD | Rating | Share price, last Price Target (Local %Upsidefrom | Share price, last Price Target (Local %Upsidefrom | Share price, last Price Target (Local %Upsidefrom | Country | |||||
|---|---|---|---|---|---|---|---|---|---|---|---|
| BBGTickers | CompanyName | Ticker | current,USD (MM) | (MM) | close | CCY) | last close | Sub-Sector | MSAnalyst | ||
| Wind Power Equipment | |||||||||||
| 2208HK | Goldwind Science &Technology CoLtd | 2208.HK | 1,654.1 | 67.1 | Equal-Weight | 17.49 | 16.74HKD | -4.3% | China | Wind Power Value Chain | Eva Hou |
| 002487CS | Dajin Heavy Industry CoLtd | 002487.SZ | 7,810.0 | 235.0 | Overweight | 83.01 | 113.37 | 36.6% | China | Wind Power Value Chain | Eva Hou |
| 600522CG | Jiangsu Zhongtian Technology CoLtd | 600522.SS | 22,140.9 | 916.3 | Overweight | 43.60 | 55.46 | 27.2% | China | Wind Power Value Chain | Eva Hou |
| VWSDC | Vestas Wind Systems A/S | VWS.CO | 29,856.4 | 70.8 | Equal-Weight | 190.85 | 190.00DKK | -0.4% | Denmark | Wind Power Value Chain | Max Yates |
| Batteries | |||||||||||
| 3750HK | Contemporary Amperex Technology CoLtd | 3750.HK | 18,167.1 | 330.4 | Overweight | 673.00 | 815.00HKD | 21.1% | China | Battery Manufacturer | Jack Lu |
| 1211HK | BYD CoLtd | 1211.HK | 46,980.0 | 404.9 | Overweight | 98.15 | 121.00HKD | 23.3% | China | Battery Manufacturer | Tim Hsiao |
| 006400 KP | Samsung SDI CoLtd | 006400.KS | 34,388.7 | 302.3 | Overweight | 634,000.00 | 850,000.00 | 34.1% | Korea; Republic (S. Korea) | Battery Manufacturer | Young Suk Shin |
| 373220 KP | LG Energy Solution Ltd | 373220.KS | 70,328.0 | 123.7 | Equal-Weight | 430,000.00 | 500,000.00 | 16.3% | Korea; Republic (S. Korea) | Battery Manufacturer | Young Suk Shin |
| EXID IS | Exide Industries Ltd | EXID.NS | 3,088.4 | 9.7 | Overweight | 346.30 | 391.00 | 12.9% | India | Battery Manufacturer | Binay Singh |
| 300274CS | Sungrow Power Supply CoLtd* | 300274.SZ | 42,688.3 | 1595.1 | Not Covered | 142.65 | NA | NA | China | ESS Integrator | NANA |
| 300450CS | Wuxi Lead Intelligent Equipment CoLtd | 300450.SZ | 12,465.7 | 412.9 | Overweight | 54.77 | 87.00 | 58.8% | China | Battery Equipment Provider | Sheng Zhong |
| 002460CS | Ganfeng Lithium Group Co., Ltd | 002460.SZ | 19,864.8 | 775.4 | Overweight | 82.99 | 110.40 | 33.0% | China | Lithium | Rachel Zhang |
| 002466CS | Tianqi Lithium Corp | 002466.SZ | 16,249.4 | 600.6 | Overweight | 74.38 | 83.00 | 11.6% | China | Lithium | Rachel Zhang |
Source: Company data, Refinitiv, Morgan Stanley Research. * non-covered company
Exmbll 10o. ve exuell vop loubthucleal value Chlallelateu cavex Ill Aold uvel the lext live yedis
M
Nuclear: The Long-Term Solution
Nuclear power represents the only proven technology capable of providing large-scale, carbon-free baseload electricity 24/7. However, it faces significant challenges around cost, construction timelines, and public acceptance. The combination of climate goals, energy security concerns, and AI power demand is driving renewed interest in nuclear:
3GW
Restart
South Korea
Japan
US$162bn
- Climate Imperative: Only carbon-free baseload technology at scale
- Energy Security: Reduces dependence on fossil fuel imports
- Tech Sector Demand: Microsoft, Google, Amazon all announced nuclear PPAs for data centers
- Advanced Reactor Designs: Small modular reactors (SMRs) promise lower costs and faster deployment, with modern technology greatly improving operational safety
US$30bn
Exhibit 133: We expect US$160bn in nuclear value chain-related capex in Asia over the next five years
1GW Taiwan US$10bn
0.1GW
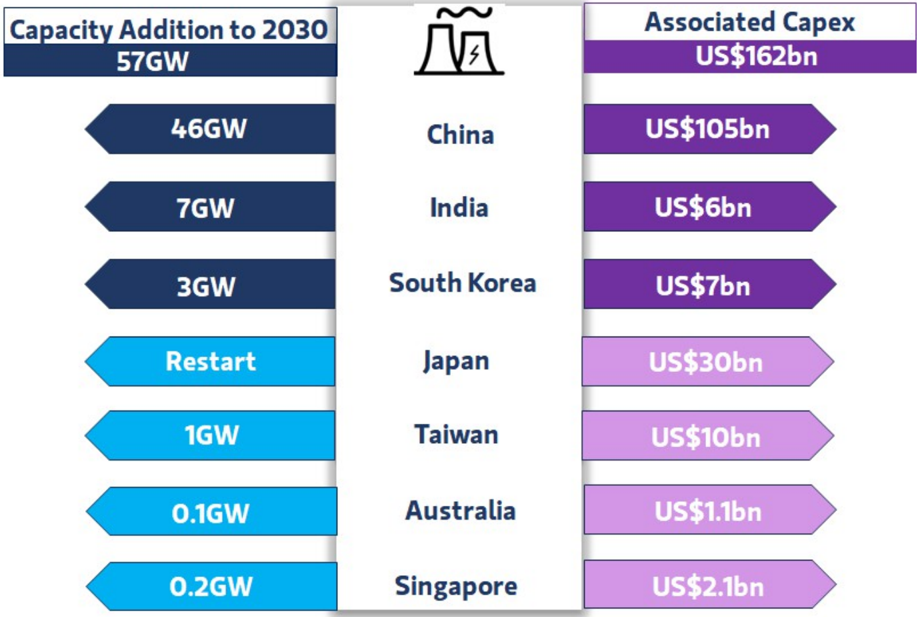
Source: Morgan Stanley Research estimates
Australia
US$1.1bn
M
Case Study: Rise in Nuclear Adoption Lessons from the 1970s
Oil price shocks in the 1970s drove energy security concerns, prompting rapid expansion of nuclear power during this period. Nuclear energy development recorded unprecedented growth, followed by decades of slower additions. During the peak construction period of the 1970s, an average of 25-30 new nuclear units began construction each year. By 1980, 253 nuclear power plants were in operation worldwide, with an additional 230 units under construction. Global nuclear capacity grew from less than 1GW in 1960 to
>100GW by the late 1980s, and further to >200GW by 1990 ( Exhibit 134 ). In the US specifically, approximately 95GW of nuclear capacity came online between 1970 and 1990, with 46 reactors commissioned in the 1980s alone.
Today, similar drivers to those in the 1970s are re -emerging, supporting the push for increased nuclear power generation.
While the factors that drove the significant slowdown in nuclear power plant additions since the 1980s remain relevant, political and financial commitment to project completion is strengthening.
Exhibit 134: Nuclear power has declined in the global energy mix since the 1980s
Nuclear Power Generation (TWh)
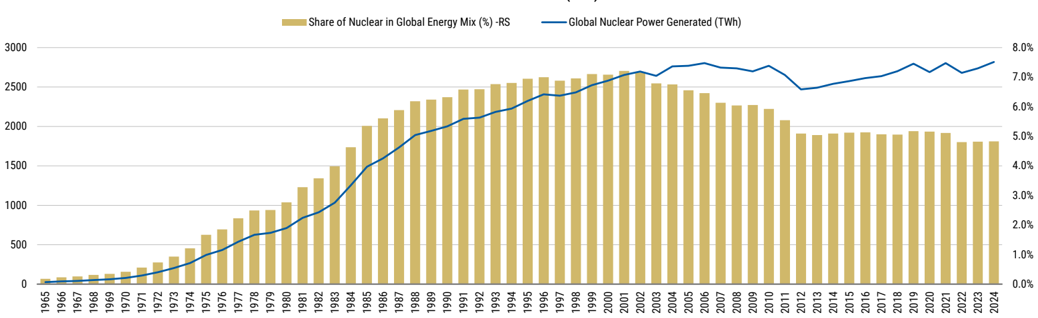
Source: Statistical Review of World Energy, Morgan Stanley Research
| Concerns about Nuclear since the 1980s | Concerns about Nuclear today |
|---|---|
| High construction costs and financing challenges for large-scale nuclear projects | High construction costs and financing challenges for large-scale nuclear projects |
| Increased regulatory requirements that extended construction timelines | Increased regulatory requirements that extend construction timelines |
| Safety concerns following incidents like Three Mile Island (1979), Chernobyl (1986), Fukushima (2011) | Improved safety features and technological improvements |
| Growing competition from cheaper natural gas and coal | Complements existing fleet of natural gas + renewables |
| Public opposition to nuclear power in many countries | Less public opposition to nuclear, although cross-border concerns exist |
| Slowdown in power demand growth in the US and Europe post-2008 | Global power demand |
M
India's Nuclear Power adoption strategy
Nuclear accounts for 3% of power generation with operational capacity of 8.8GW, which we estimate will rise by 7GW by 2030. As per the Department of Atomic Energy in India, India has been pursuing a three-stage nuclear power programme to optimally utilize its limited uranium resources and exploit its vast thorium reserves by a nearly closed fuel cycle. Stage I: Use of natural uranium in Pressurized Heavy Water Reactors (PHWR); Stage II: The fissile material recovered from spent fuel of the first stage is used as fuel in Fast Breeder Reactors (FBR). The FBRs are also designed for breeding fissile uranium-233 from fertile thorium-232 used in the blanket; Stage III: Thorium utilization is envisaged as using uranium-233 and thorium-232 for long-term energy security in a sustainable manner. In early April 2026, India entered the second stage of its three-stage nuclear power program with the successful attainment of criticality (controlled chain reaction) of the 500MWe Prototype Fast Breeder Reactor (PBFR) at Kalpakam, Tamil Nadu. This milestone implies that the reactor is now operational and can produce more fuel than it consumes, a key step towards leveraging India's large thorium reserves. India is now the second country after Russia to operate a commercial fast breeder reactor. The reactor will commence commercial production by late 2026 or early 2027.
The government had approved allocation of US$2.3bn to design, develop and deploy Small Module Reactors (SMR). At least five SMRs are due to be operational by 2033. The SHANTI Bill, 2025 (Sustainable Harnessing and Advancement of Nuclear Energy for Transforming India) consolidates regulation, enforcement, civil liability and dispute resolution within a single statute, reducing legal complexity and compliance uncertainty.
Nuclear: Not a Near-term Solution
Nuclear remains a long-term infrastructure play, not a near-term tactical investment. Even with accelerated development, it cannot meaningfully address the 2026 energy security crisis or the late2020s surge in AI-related power demand, given long lead times, limited skilled labor, and safety constraints.
Large Reactors:
- Design and Licensing: 3-5 years minimum
- Construction: 5-10 years for modern builds
- Total Timeline: 8-15 years from decision to first power
SMRs:
- Design Certification: 3-5 years (many designs still in this phase)
- Licensing: 2-3 years for first-of-a-kind
- Construction: 3-5 years (theoretical; unproven at scale)
- Total Timeline: 8-13 years realistically for first commercial units
Financial and Regulatory Hurdles: Beyond construction timelines, nuclear faces substantial barriers:
- Cost Overruns: Historical pattern of 2-3x cost overruns on nuclear projects continues. Vogtle Units 3&4 in Georgia (U.S.) final cost was US$35bn vs. the US$14bn original estimate.
- Financing Challenges: Long construction timelines and high capital intensity make nuclear difficult to finance without government support. Cost of capital typically 2-3% higher than fossil or renewable projects.
- Regulatory Uncertainty: Licensing processes remain lengthy and unpredictable, adding risk premium. Post-Fukushima safety requirements increased costs 20-30%.
- Public Acceptance: Remains a significant barrier in Japan, Germany, and many other markets. Even in pro-nuclear countries like France and China, new facilities faces local opposition.
- Supply Chain Constraints: Nuclear supply chain atrophied during decades of limited construction. Large forgings, reactor pressure vessels, and specialized components have limited manufacturing capacity and long lead times.
M
Nuclear: Key Beneficiaries
Exhibit 135: Nuclear Power: Supply Chain Beneficiaries
| BBGTickers | CompanyName | Market cap, current,USD | 3MADTV,USD | Rating | Share price, last Price Target (Local %Upsidefrom | Share price, last Price Target (Local %Upsidefrom | Share price, last Price Target (Local %Upsidefrom | Country | Sub-Sector | MSAnalyst | |
|---|---|---|---|---|---|---|---|---|---|---|---|
| Ticker | (MM) | (MM) | close | CCY) | last close | ||||||
| Nuclear Value | Chain | ||||||||||
| 1164HK | CGNMining CoLtd | 1164.HK | 3,844.8 | 27.0 | Overweight | 3.24 | 4.60 | 42.0% | Hong Kong | Uranium Mining | Chris Jiang |
| PDNAU | Paladin Energy Ltd | PDN.AX | 4,131.2 | 23.5 | Overweight | 10.15AUD | 13.65AUD | 34.5% | Australia | Uranium Mining | Rahul Anand |
| CWUN | Curtiss-Wright Corp. | CW.N | 27,164.3 | 66.2 | Overweight | 704.95 | 760.00 | 7.8% | United States of America | Equipment &Plant | Kristine Liwag |
| 034020 KS | Doosan Enerbility | 034020.KS | 54,583.2 | 381.8 | Overweight | 101,300.00 | 110,000.00 | 8.6% | Korea; Republic (S. Korea) | Equipment &Plant | HeewonChoi |
| FGR FP | Eiffage SA | FOUG.PA | 15,343.0 | 42.2 | Overweight | 129.20 | 186.00 | 44.0% | France | Equipment &Plant | Nicolas Mora |
Source: Company data, Refinitiv, Bloomberg, Morgan Stanley Research
M
Natural Gas: The Next Dependable Fuel Supporting Coal and Renewables
Natural gas is recognized as a key stabilizer in a "new energy system" where coal shifts to a supporting role, and high renewables require immediate, flexible backup. (NDRC recommendation ahead of the 15th Five Year Plan)
Global LNG markets have transitioned from a potential multi-year supply glut to now facing a multi-year loss of supply. Investors are currently debating the implications of this reset as near-term elevated gas prices, ongoing demand destruction and visibility beyond 2027, particularly in price-sensitive markets in Asia (details here) weigh on natural gas stocks.
While in absolute terms we do see 100mntpa of LNG imports rising in Asia by 2030, as gas fired power plants and gas for transportation needs rise with better infrastructure, we do see ~20mntpa of LNG consumption moving to coal in Asia as new coal and coal gasification projects start in India, China and ASEAN. Bio-gas also helps reduce the need for imports of LNG apart from higher domestic gas production, which we estimate will rise at a 4% CAGR in 2025-2030 in Asia as E&P capex picks up in the next few years. In addition, conducive government policies around reduced royalties and more liberal profit sharing should help sustain gas production with reduced decline rates in Indonesia and India, while shale production growth ( Exhibit 165 ) should be supportive of China's domestic production ( Exhibit 168 ).
That said, we do think natural gas will continue to play a key role in transforming Asia's energy consumption landscape. As energy security becomes increasingly critical for Asian governments, gas infrastructure investments, namely cross-country pipelines, last mile access, LNG import facilities and potential storage (which have significantly accelerated in the past decade) will continue to get built. Storage investments in particular will accelerate (with only a few economies, such as Taiwan and China, currently having multi-day/ week consumption buffers). Beyond 2027, the combination of nearterm demand softness and buildout of US export infrastructure (~50-75mntpa) will re-usher a glut, soften prices and revitalize consumption.
To this end, we estimate Asia's LNG value chain could see investments totalling US$100bn ( Exhibit 136 ) across liquification, regasification and storage facilities as Asia's upstream production lags demand growth, power and AI-led appetite keeps surprising on the upside, while gas penetration scales at LNG prices of US$10-12/ mmbtu beyond 2027. We think these investments can deliver new import infrastructure of >150mntpa (about half of Asia's current gas demand). South Korea and Japan, followed by India and Southeast Asia, will drive the next leg of import infrastructure buildout over 2030.
Muoo luubil Ul TIew lIvesultello
M
Exhibit 136: We estimate >150mntpa of new LNG infrastructure buildout in Asia, about half of Asia's current gas consumption, driving ~US$100bn of new investments LNG
160mntpa
US$99 bn
15mntpa China US$8bn
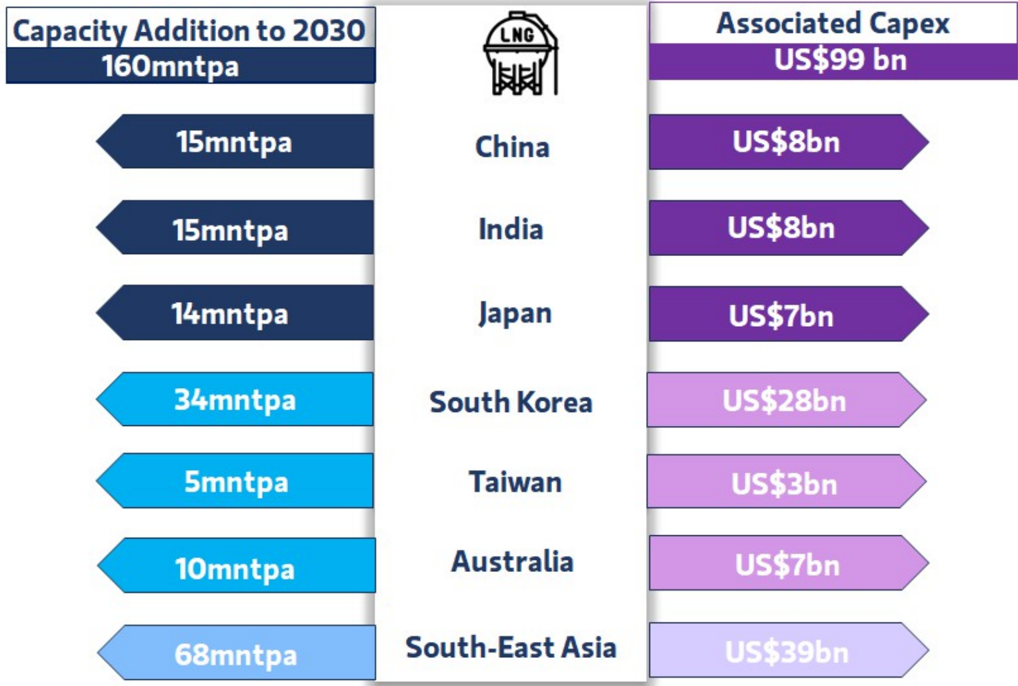
Source: Morgan Stanley Research estimates
From Glut to Tightness to Well Supplied (Eventually)
Asia is expected to be the largest beneficiary of the US shale revolution, with LNG imports from the US picking up significantly due to low prices. This is being underpinned by an expected >150mntpa of new supply (US + the Middle East) over 2026-30, more than US$270bn of US export investments and US$120bn of infrastructure investments in Asia, driving an incremental 120mntpa of LNG consumption in Asia by 2030. We now assume 2026 will see a shortfall, followed by a more balanced market in 2027-28, with 2029 and beyond ( Exhibit 137 ) likely benefiting from the full rollout of proposed capacity expansions.
sluwel velliallu growull.
20
15
10
5
(5)
(10)
(15)
(20)
M
18
18
Exhibit 137: We now assume a full 2-month outage at Qatar and include the impact of 2 trains fully offline through 2028, partially offset by slower demand growth.
8
8
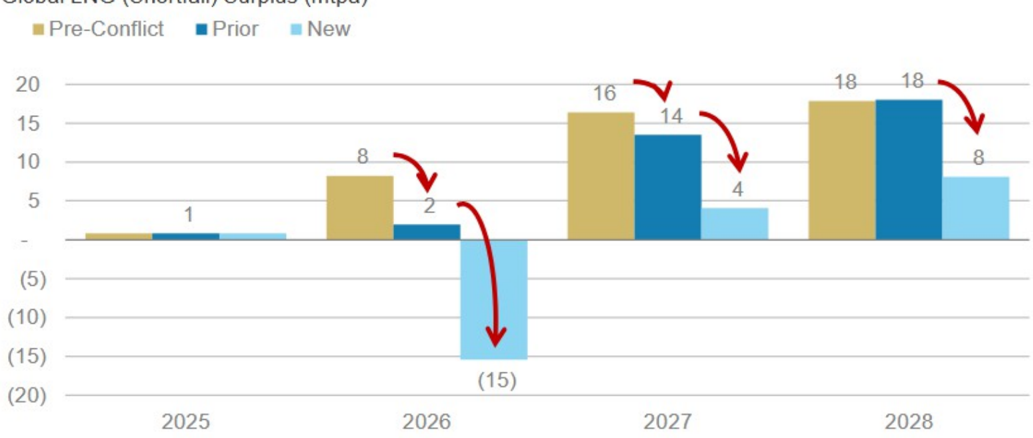
Source: Morgan Stanley Research estimates
Exhibit 138: Asian Power: Asian economies have meaningful Middle East LNG exposure
| Gas-fired Generation (% of Total) | LNGin gas supply mix (%) | Net LNGExposure on Generation Units | SoHLNG(% of total gas supply) | Net SoHExposure on Generation Units | Remarks | ||
|---|---|---|---|---|---|---|---|
| Company | Country | ||||||
| Sembcorp | Singapore | 80% | 30% | 24.0% | 0% | 0% | Largely Piped Gas from Indonesia + LNGfrom Australia |
| Keppel | Singapore | 90% | 20% | 18.0% | 0% | 0% | Largely Piped Gas from Malaysia + SomeLNG(unlikely middle east) |
| GPSC | Thailand | 70% | 25% | 17.5% | 8% | 1% | 100%PTTgas sourcing (75% domestic+pipe,25%LNG) |
| Gulf Development | Thailand | 90% | 65% | 58.5% | 11% | 6% | ~0.6MT of LNGimported from Middle East |
| Tenaga Nasional | Malaysia | 35% | 10% | 3.5% | 0% | 0% | Largely domestic Gas, LNGfrom Australia |
| Manila Electric | Philippines | 30% | 60% | 18.0% | 50% | 9% | LNGPHhasreceived gas from UAE, Singapore business ~15%exposure |
| Korea Electric Power | Korea | 22% | 100% | 22.0% | 20% | 4% | 20%of LNGfrom Middle East |
| Hokkaido Electric | Japan | 19% | 100% | 19.0% | 11% | 2% | |
| Tohoku Electric | Japan | 44% | 100% | 44.0% | 11% | 5% | |
| Chugoku Electric | Japan | 24% | 100% | 24.0% | 11% | 3% | |
| Hokuriki Electric | Japan | 11% | 100% | 11.0% | 11% | 1% | 11%of LNGimported to Japan is from the Middle East |
| Kyushu Electric | Japan | 15% | 100% | 15.0% | 11% | 2% | |
| Shikoku Electric | Japan | 13% | 100% | 13.0% | 11% | 1% | |
| Kansai Electric | Japan | 29% | 100% | 29.0% | 11% | 3% |
Source: Company data, Morgan Stanley Research
Infrastructure Momentum To Be Sustained
While in the past decade natural gas molecules were landlocked in key energy-rich regions like the US and Africa, or constrained by infrastructure connectivity as in Russia, increasingly these bottlenecks are being resolved as Asia and the US are building new gas infrastructure with over 70,000kms of pipelines, 200mntpa of LNG export facilities, and 250 LNG carriers being added, or are in various stages
of execution, into 2030 ( Exhibit 139 ). The focus on energy security, diversification of sourcing and the need to build in security buffers to limit disruptions will likely trigger a new wave of natural gas pipeline investments as most Asia countries add >15,000kms of new gasbased pipelines, increase LNG storage/regasification assets by 50-75% vs. current plans (especially in economies like India, Singapore and the Philippines) and establish meaningful storage capacities (which are negligible at present barring China and Taiwan).
M
Exhibit 139: Asia: The gas infrastructure boom is connecting natural gas suppliers globally to last mile consumers
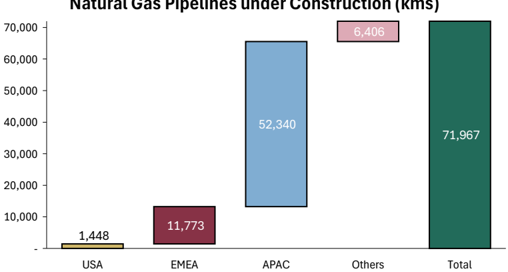
Source: GEM, Morgan Stanley Research
Playing the (Eventual) Glut
Power needs are growing at their fastest pace in a decade (especially outside of China). Natural gas is key to addressing this rising consumption, as it is not only viable when clubbed along with renewables for round-the-clock power supply, it is also quicker to construct compared to nuclear, and also less carbon-intensive than coal. Furthermore, we see a new leg of upstream investments in Asia as countries accelerate the development of domestic and near-shore energy reserves. Hence, we like gas producers and power generation companies in the US, midstream companies and upstream players in the Middle East, and local gas producers in India, China, Australia and LatAm, to play this theme. We also like companies that help import LNG, companies providing last mile consumer and industrial access as well as gas power equipment manufacturers ( Exhibit 139 ).
From this theme, we believe Mitsubishi Corp (8058.T), with high exposure to both copper & LNG, stands to benefit the most. In F3/26, production from copper mines in which the company has interests topped 300kt (on an equity ownership basis). Mitsubishi Corp has steadily increased its production volume here over time and has clearly indicated a focus on the copper business. It currently has LNG equity-production capacity of around 15mn tons per year. Going forward, through new projects and expansions of existing projects, it aims to increase this to 18mn tons per year by the early 2030s.
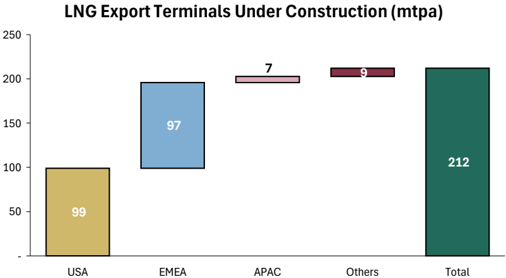
But We Do Anticipate Softer Near-term Gas Demand as Coal Gains
We do expect some softness in near-term gas demand as Asia contends with prices >US$15/mmbtu. Asian and European demand in March and April has already shifted lower. Countries like India are rationing gas supplies to use in priority sectors such as housing and fertilizers, while industrial clusters explore alternatives or lower operations outright. What has helped is that LNG demand falls rapidly seasonally over March and April in the northern hemisphere as heating demand wanes. Global LNG demand usually troughs in 2Q before rising again into 3Q, as peak summer cooling demand hits across SE Asia, and to a lesser extent, NE Asia.
As temperatures heat up over this summer, into what is shaping up to possibly be another record-breaking El Nino year, Asia's gas-powered fleet may be called on to meet record power demand. Current levels of LNG imports in Asia are likely not sustainable if higher gas for power demand is to be met. Meanwhile, Europe will be entering peak injection season (May-August). If Europe is able to maintain flat levels of LNG imports YoY then storage refill of ~75% is possible, however, if Asia starts to pull more aggressively on the spot LNG market, then Europe could be facing record low levels of inventory entering next winter.
Consequently, we estimate a slower accretion in Asia's LNG demand into 2030, with the region consuming an incremental 100mntpa of LNG between 2026 and 2030 (vs. earlier expectations of >120mntpa). Two thirds of this will likely be replaced by new coal gasification investments (mainly India and China), with the balance shifting to existing and new coal-fired power plants. Countries like India are actively diversifying sourcing across the US, Oman, Mozambique and new sources such as Nigeria and Congo among others, a trend which will likely continue to accelerate in 2027.
M
Natural Gas: Key Beneficiaries
Exhibit 140: Gas Infrastructure Supply Chain Beneficiaries
| Market cap, | 3MADTV,USD | Share price, last Price Target (Local %Upsidefrom | Share price, last Price Target (Local %Upsidefrom | Share price, last Price Target (Local %Upsidefrom | Country | ||||||
|---|---|---|---|---|---|---|---|---|---|---|---|
| BBGTickers | CompanyName | Ticker | current,USD (MM) | (MM) | Rating | close | CCY) | last close | Sub-Sector | MSAnalyst | |
| LNGExport Infrastructure | |||||||||||
| LNGUN | Cheniere Energy Inc | LNG.N | 51,195.6 | 175.3 | Overweight | 246.77 | 308.00 | 24.8% | United States of America | LNGexport terminal | Devin McDermott |
| VGUS | Venture Global Inc | VG.N | 32,943.7 | 62.3 | Overweight | 14.78 | 22.00 | 48.8% | United States of America | LNGexport terminal | Devin McDermott |
| 8058 JT | Mitsubishi Corp. | 8058.T | 129,854.3 | 404.7 | Equal-Weight | 5,436.00 | 5,150.00 | -5.3% | Japan | LNGproduction + Copper | Yu Shirakawa |
| Midstream Gas Pipelines and LNGInfrastructure Owners | Midstream Gas Pipelines and LNGInfrastructure Owners | ||||||||||
| TRGPUN | Targa Resources Corp. | TRGP.N | 54,768.5 | 105.1 | Overweight | 276.20 | 331.00 | 19.8% | United States of America | Gas Pipeline | Robert Kad |
| WMBUN | Williams Companies Inc | WMB.N | 91,394.7 | 139.9 | Overweight | 79.40 | 98.00 | 23.4% | United States of America | Gas Pipeline | Robert Kad |
| TTE US | TotalEnergies SE | TTE.N | 209,978.5 | 26.4 | Overweight | 91.76 | 103.30 | 12.6% | France | Intergrated Energy | Martijn Rats |
| SHEL LN | Shell PLC | SHEL.L | 238,183.5 | 269.8 | Equal-Weight | 3,148.50 | 3,495.00GBp | 11.0% | United Kingdom | Intergrated Energy | Martijn Rats |
| GUJGA IS | Gujarat Gas Ltd | GGAS.NS | 2,659.7 | 7.2 | Overweight | 376.55 | 523.00 | 38.9% | India | Gas Pipeline | Mayank Maheshwari |
| GAIL IS | GAIL (India) | GAIL.NS | 11,061.9 | 22.3 | Equal-Weight | 156.12 | 150.00 | -3.9% | India | Gas Pipeline | Mayank Maheshwari |
| IGL IS | Indraprastha Gas Ltd. | IGAS.NS | 2,303.4 | 6.6 | Equal-Weight | 157.35 | 205.00 | 30.3% | India | Gas Pipeline | Mayank Maheshwari |
| PTT TB | PTT Public Company | PTT.BK | 32,769.9 | 119.3 | Equal-Weight | 37.00 | 39.80 | 7.6% | Thailand | Gas Pipeline | Mayank Maheshwari |
| MAHGLIN | Mahanagar Gas Ltd | MGAS.NS | 1,103.1 | 4.4 | Overweight | 1,059.40 | 1,491.00 | 40.7% | India | Gas Pipeline | Mayank Maheshwari |
| 9531 JT | TOKYO GAS | 9531.T | 14,215.9 | 60.6 | Equal-Weight | 6,639.00 | 5,290.00 | -20.3% | Japan | Gas Pipeline | Reiji Ogino |
| 9532 JP | Osaka Gas | 9532.T | 14,428.2 | 48.1 | Equal-Weight | 5,760.00 | 4,110.00 | -28.6% | Japan | Gas Pipeline | Reiji Ogino |
| PLNGIS | PetronetLNG | PLNG.NS | 4,267.4 | 15.1 | Equal-Weight | 265.15 | 276.00 | 4.1% | India | Gas Pipeline | Mayank Maheshwari |
Source: Company data, Refinitiv, Bloomberg, Morgan Stanley Research
M
Fuel: A New Refinery Needed Every Year
"We have diversified the sources from where we source energy and will diversify them further. We will take our decisions and we will not hesitate to diversify" - India's Minister of Petroleum and Natural Gas.
US$8bn sioning (typically 8-9 years) and quarterly margin volatility (albeit alongside attractive and improving annual margin dynamics), we estimate the region may need to add >100mnt of new refining capacity, requiring ~US$90bn of investment by 2030 ( Exhibit 141 ), given consistent outperformance of fuel demand expectations in Asia ( Exhibit 142 ). India, Indonesia, and Vietnam will likely anchor these investments, as their consumption growth ranks among the highest globally ( Exhibit 8 ). In contrast, we expect limited capacity additions from China. >110mnt of new capacity translates to ~2-2.5mbpd of incremental refining footprint (or ~2% of global fuel consumption, ~6% of Asia's consumption) and is necessary to enhance Asia's fuel security.
A tectonic shift is underway in how the industry approaches new refining capital investment, as strong margins over the past three years have failed to attract meaningful capacity additions due to concerns around economic growth, electrification, and competition from alternative fuels. We believe this divergence from prior cycles sets up the refining industry for a potential golden age. The combination of tighter environmental standards, rising global miles traveled (autos and aviation), and improving EM growth further strengthens refining margins.
In our view, refining infrastructure represents a key bottleneck to energy security and is likely to catalyze new investment in Asia through 2030. Despite long lead times from construction to commis-
Exhibit 141: Asia to see >100mnt (2-2.5mbpd) of new refining capacity growth, catalyzing ~US$95bn of new investments
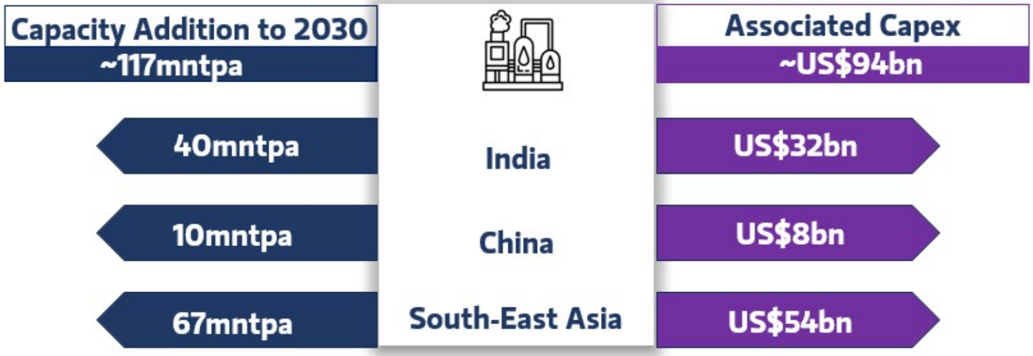
Source: Morgan Stanley Research estimates
Cxmlble 144.15A eotlliales Vo. ylobal Ull uelllanlu ylowull
3.5
M
3.0
2.5
2.0
1.5
1.0
0.5
0.0
Refining Cycle: Stronger Beyond the Conflict
2.0
Every energy shock, particularly one of the magnitude now emerging in Asia, structurally lifts fuel market margins. Refiners' GRMs have averaged ~20% above mid-cycle over the past three years, with refiners outperforming oil and the MSCI World Energy Index in 2024-26 ( Exhibit 143 ). Supply outages have intensified, with multiple Asian refiners cutting operating rates due to challenges in securing appropriate crude grades. While quarterly volatility remains inherent to fuel markets, we believe annual margins will run ~1.5x higher than in prior cycles ( Exhibit 145 ). It takes about eight years to build a refinery from drawing board to operation, and we expect fuel consumption over this period to rise 2x faster than supply.
Fuel Demand: Consistently Exceeding Expectations
Each year, the International Energy Agency (IEA) publishes the World Energy Outlook (WEO), which anchors broader discussions on global energy forecasts across scenarios. Notably, global oil demand has remained resilient over the past 15 years and has consistently exceeded IEA estimates ( Exhibit 142 ) despite concerns around economic growth, periods of significant price volatility, rising vehicle electrification, and the shift toward alternative fuels, such as natural gas. We expect fuel demand growth to continue to surprise through the decade, led by gasoline, diesel, and jet fuel (with some near-term demand risks), while refinery additions remain insufficient to meet this demand.
Exhibit 142: IEA estimates vs. global oil demand growth
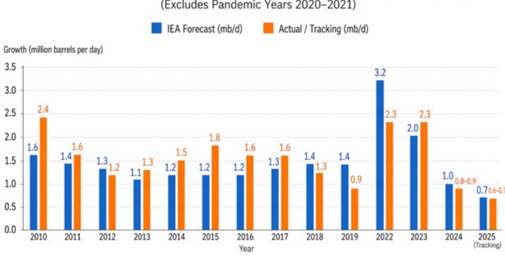
Source: IEA, Morgan Stanley Research estimates
Twenty new refineries needed to meet demand in the time it takes to build one new refinery
The global refining sector represents >US$2.5trn in invested capital and ~US$70bn in planned new investments through 2030, by our estimates. It takes an average of eight years to bring a new refinery from drawing board to operation ( Exhibit 146 ). To put this timeframe in context, we estimate that about eight new refineries (400kbpd each) are required to meet incremental global fuel demand over this period, but only five are currently under construction, while multiple refineries are set to shut by 2030. Outside India, Brazil, and the Middle East, we have seen limited meaningful capacity additions, despite energy security concerns, reflecting the execution challenges of these large-scale investments and the extended timelines to reach breakeven ( Exhibit 147 ).
Exhibit 143: The Refinery Cycle In Perspective: Much tighter as capacity growth remains 30-40% below consumption
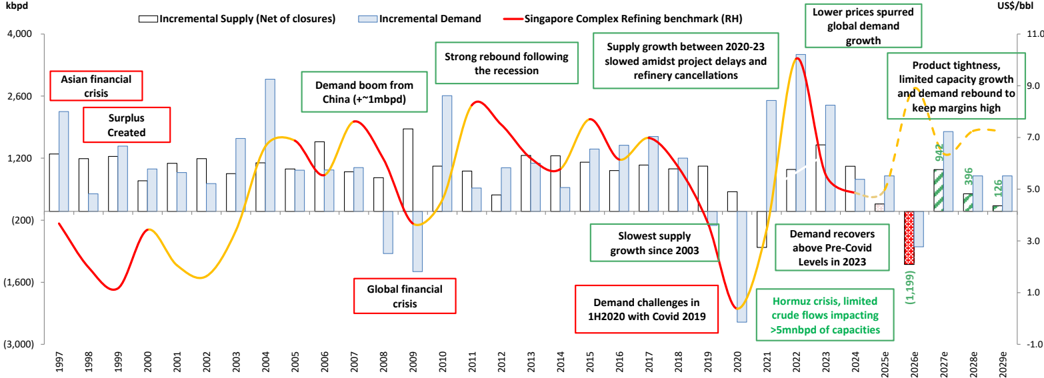
Source: Morgan Stanley Research (e) estimates
2.4
1.6
2010
M
Exhibit 144: Limited capacity additions vs steady demand growth to drive sustained tightness in refining markets
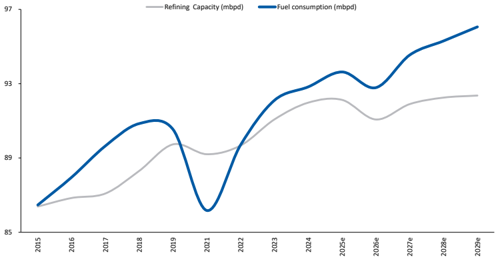
Source: Morgan Stanley Research (e) estimates
Exhibit 145: GRMs to remain structurally above historical averages, supported by tight refining markets
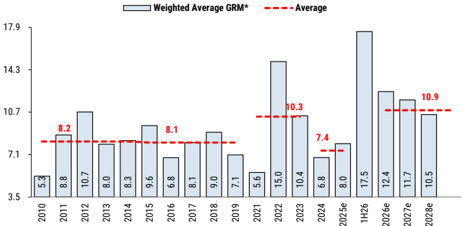
*Weighted Average: Capacity weighted average of six US major refiners and Asia Singapore complex margins
Source: Company data, Refinitiv, Morgan Stanley Research (e) estimates
Exhibit 146: Why we see a Golden Age - refining numbers in a nutshell
| Time to buildanew refinery | DemandGrowthin that period | Mega refiners to SatisfyDemand Growth | Amount to be invested today | Investments Committed Today |
|---|---|---|---|---|
| 8 yrs | 8mbpd | 20 | $250 bn | ~$30 bn |
| From Idea to Production | As Diesel/Jet Fuel DemandGrows | To SatisfyDemand Growth | Due to concerns on competition from Renewables/EV |
Source: Morgan Stanley Research estimates
Exhibit 147: Current payback period: >10 years
| Complex Refinery Investment | $12 bn |
|---|---|
| Capacity Added | 400kbpd |
| Refining Margin | $12/bbl |
| Annual Free Cash Flow | $1.0 bn |
| Pay-back | ~11 yrs |
Source: Morgan Stanley Research estimates
M
Not All Parts of Asia Are Equal on Refining Self Reliance
Oil demand has risen at nearly 2x the pace of refining capacity growth, tightening balances even as the region remains broadly selfsufficient at an aggregate level ( Exhibit 149 ). Regional refinery capacity has increased only modestly - from roughly the mid30mbpd range in the mid-2010s to about 37.7mbpd in 2024 reflecting relatively slow, incremental additions concentrated in China and India rather than a broad-based expansion across Asia. Over the same period, oil consumption growth has been significantly stronger - driven by transport, petrochemicals, and EM demand with Asia (particularly China and India) accounting for the bulk of global demand growth and continuing to expand even as OECD demand stagnates or declines ( Exhibit 148 ). The result is a tighter regional refining balance: while Asia as a whole meets much of its needs, capacity remains unevenly distributed, with surplus refining hubs such as China, India, South Korea, and Singapore exporting products, while structurally short markets - including Indonesia, Australia, the Philippines, and parts of Southeast Asia - remain reliant on imports of refined fuels.
Exhibit 148: Asian fuel demand growth has outpaced refining capacity growth by 2x over the past decade
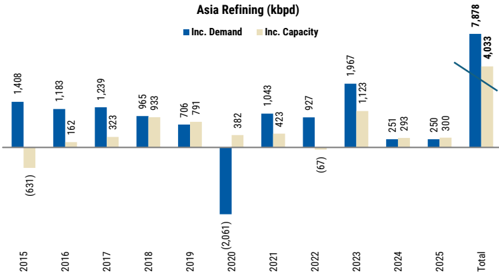
Source: Statistical Review of World Energy, Morgan Stanley Research
Biofuels: Asia accounts for roughly 35% of global biofuel consumption, driven heavily by aggressive national blending mandates aimed at lowering fossil fuel imports, improving energy security, and reducing greenhouse gas emissions. Biofuels currently account for ~4% of Asia's primary energy consumption but we are seeing the fast growth energy consumers like India, Indonesia and Vietnam all leveraging the locally available palm oil, agriculture waste, and sugar supply chain to produce biodiesel and bio-natural gas, and also raising blending requirements in gasoline and diesel. India mandated a nationwide rollout of the E20 ethanol blend (20% ethanol in petrol) as the new national standard.
Indonesia, which is amongst the world's largest biodiesel consumers, successfully runs on a B40 mandate (40% palm oil-based biodiesel). The government is progressively rolling out a B50 mandate to further slash fossil diesel reliance. It continues to utilize a B10 mandate with a strategic push towards B15 and B20 blends to absorb local biodiesel production and capitalize on favorable palm oil economics. While conversion economics for biodiesel production need above $90/bbl oil, we believe government mandates in the transport sector and bringing in high ethanol-based fuel compliant cars are key to biodiesel doubling in the energy mix for Asia. We have also seen steady policy action in this area. China and India are both supporting smaller scale digesters for biogas production as well.
Exhibit 149: While Asia is broadly self-sufficient on fuels, we see a significant disparity between North and South Asia
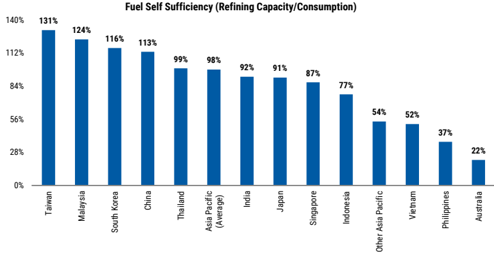
Source: Statistical Review of World Energy, Morgan Stanley Research
M
Supply Growth Insufficient - Closure Risks Underappreciated
As in the preceding decade, capacity additions continue to lag demand growth and will likely remain so through 2030, with slow investment cycles, project delays, and multi-year execution slippages. This is evident in recently commissioned assets in India, Malaysia, and Nigeria, which have faced significant delays as well as operational challenges during ramp-up and stabilization.
Looking ahead, we expect incremental capacity growth in India, China, and to some extent Southeast Asia through 2028. These additions will largely reflect expansions, hardware upgrades, efforts to improve product slate and crude flexibility, and downstream integration into petrochemicals. With the exception of Petronas' Pengerang integrated complex and Hindustan Petroleum's Barmer refinery, we see limited evidence of new, world-scale greenfield investments ( Exhibit 150 ). Against this backdrop, China's product exports have declined steadily, initially due to lower export quotas. China's anti-involution policies, along with similar measures in other countries, have led to ~1.5-2mbpd of refining capacity closures over the past three years.
Exhibit 150: New capacity expected to come online beset by multiple delays and slippages
| Region | Location | Owner / Operator | Capacity | Remarks |
|---|---|---|---|---|
| 2026-28: New, Expansion projects and Proposed capacities | 2026-28: New, Expansion projects and Proposed capacities | 2026-28: New, Expansion projects and Proposed capacities | 1,719 | |
| India | Panipat | Indian Oil Corp. | 200 | Mechanical completion largely achieved; phased commissioning ongoing. Full ramp - up in late - 2026 |
| Bahrain | Sitra Expansion | Bahrain Petroleum Co. | 133 | Declared Force Majuere |
| Indonesia | Balikpapan | Pertamina | 100 | RFCC unit restarted in November 2025, ramp up in 2026 |
| India | Koyali | Indian Oil Corp. | 86 | Expected in mid-2026 |
| India | Barauni | Indian Oil Corp. | 60 | Expected in mid to late 2026 |
| Russia | Afipsky | ForteInvest | 60 | Limited visibility; timelines uncertain |
| India | Numaligarh | Oil India | 120 | Major units mechanically complete, ramp up in 4Q26 |
| Thailand | Sriracha | Thai Oil | 100 | 3Q28 completion; Delayed to 2029 ramp up; EPC Contractor Changed |
| Iraq | Basrah | Iraq National Oil Co | 70 | Delayed to 2026; Work completion in 2025 |
| Iraq | Salah al-Din Refinery | Iraqi Ministry of Oil | 70 | Trial operations underway, expected in 2026 |
| India | Rajasthan | HPCL | 180 | Ramp up in 4Q26 |
| Indonesia | Tuban Refinery | Pertamina + Rosneft | 300 | Delayed; Rosneft disengagement unresolved; government still seeking partners |
| India | Tamil Nadu | Chennai Petroleum | 180 | early-2029 |
| India | Bina | Bharat Petroleum | 60 | early-2028 |
Source: Company data, Morgan Stanley Research
M
Exhibit 151: While retail fuel prices in Asia are typically regulated and lag Brent volatility, the Middle East conflict has forced broad-based price hikes
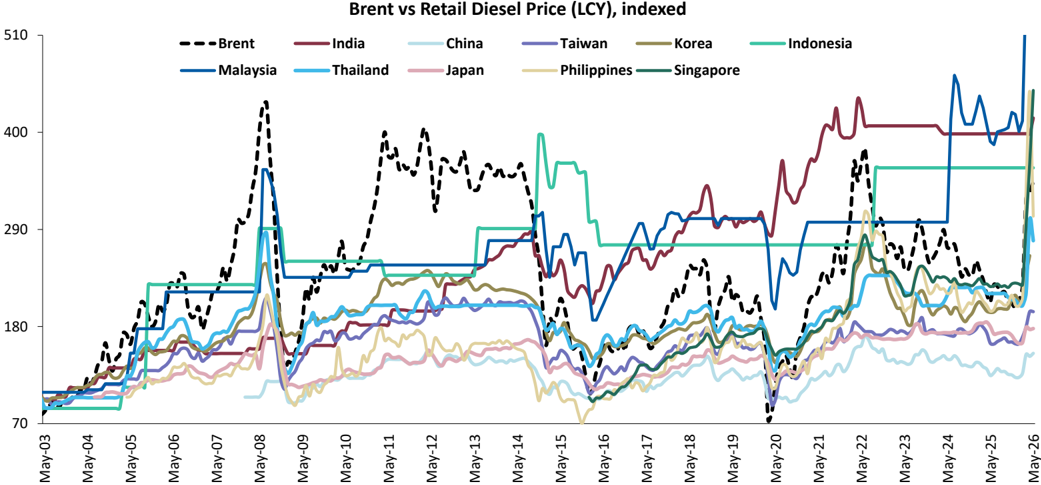
Source: CEIC, EPPO, PPAC, Morgan Stanley Research
M
Fuels: Key Beneficiaries
Exhibit 152: Refining and Refined Products Supply Chain Beneficiaries
| BBGTickers | CompanyName | Ticker | Market cap, current,USD | 3MADTV,USD (MM) | Rating | Share price, last Price Target (Local %Upsidefrom | Share price, last Price Target (Local %Upsidefrom | Share price, last Price Target (Local %Upsidefrom | Country | Sub-Sector | MSAnalyst |
|---|---|---|---|---|---|---|---|---|---|---|---|
| BBGTickers | CompanyName | Ticker | (MM) | 3MADTV,USD (MM) | Rating | close | CCY) | last close | Country | Sub-Sector | MSAnalyst |
| Fuel Refiners | |||||||||||
| RIL IS | Reliance Industries | RELI.NS | 193,666.8 | 284.2 | Overweight | 1,322.70 | 1,803.00 | 36.3% | India | Refiners | Mayank Maheshwari |
| 010950 KP | S-Oil | 010950.KS | 8,730.2 | 82.5 | Overweight | 110,800.00 | 130,000.00 | 17.3% | Korea; Republic (S. Korea) | Refiners | Young Suk Shin |
| TOP TB | Thai Oil Public Company | TOP.BK | 3,099.7 | 31.4 | Overweight | 47.50 | 58.00 | 22.1% | Thailand | Refiners | Mayank Maheshwari |
| SPRCTB | Star Petroleum Refining | SPRC.BK | 921.0 | 6.7 | Overweight | 7.40THB | 9.10THB | 23.0% | Thailand | Refiners | Mayank Maheshwari |
| BCPTB | Bangchak Corporation Public Company | BCP.BK | 1,586.8 | 8.7 | Overweight | 34.75 | 49.30 | 41.9% | Thailand | Refiners | Mayank Maheshwari |
| ALDAU | Ampol Ltd | ALD.AX | 5,804.4 | 31.3 | Overweight | 35.20 | 35.00 | -0.6% | Australia | Refiners | Rob Koh |
| VEAAU | Viva Energy Group Ltd | VEA.AX | 2,606.8 | 15.2 | Equal-Weight | 2.34 | 2.56 | 9.4% | Australia | Refiners | Rob Koh |
| BPCL IS | Bharat Petroleum Corp. | BPCL.NS | 13,102.9 | 43.1 | Overweight | 286.45 | 468.00 | 63.4% | India | Refiners | Mayank Maheshwari |
| HPCL IS | Hindustan Petroleum | HPCL.NS | 8,258.1 | 35.5 | Overweight | 371.00 | 610.00 | 64.4% | India | Refiners | Mayank Maheshwari |
| IOCL IS | Indian Oil Corp | IOC.NS | 20,394.4 | 31.1 | Overweight | 135.00 | 219.00 | 62.2% | India | Refiners | Mayank Maheshwari |
| 857HK | PetroChina | 0857.HK | 29,807.9 | 228.1 | Overweight | 11.20HKD | 13.25HKD | 18.3% | China | Refiners | Jack Lu |
| 386HK | China Petroleum &Chemical Corp. | 0386.HK | 14,123.8 | 114.6 | Overweight | 4.49HKD | 6.98HKD | 55.5% | China | Refiners | Jack Lu |
| 5021 JP | CosmoEnergy Holdings | 5021.T | 4,168.0 | 22.4 | Overweight | 3,739.00 | 5,250.00 | 40.4% | Japan | Refiners | Reiji Ogino |
| VLOUN | Valero Energy Corporation | VLO.N | 73,378.0 | 229.0 | Equal-Weight | 262.62 | 232.00 | -11.7% | United States of America | Refiners | Joe Laetsch |
| MPCUN | Marathon Petroleum Corp | MPC.N | 73,565.1 | 183.3 | Overweight | 263.02 | 233.00 | -11.4% | United States of America | Refiners | Joe Laetsch |
| 096770 KP | SK Innovation CoLtd | 096770.KS | 14,684.1 | 72.1 | Equal-Weight | 115,500.00 | 130,000.00 | 12.6% | Korea; Republic (S. Korea) | Refiners | Young Suk Shin |
Source: Company data, Refinitiv, Morgan Stanley Research
M
Strategic Reserves: A Multi-Year Capex Cycle
Energy, product, and feedstock storage - while arguably the most critical element of energy security infrastructure in the coming years - is also among the least capex-intensive relative to other forms of capacity build-out. IEA countries target 90 days of import cover for fuel and crude. Applying this as a guiding principle for Asia, we estimate ~1.4bn bbls of incremental oil and petroleum fuel storage needs, alongside increased LNG and fertilizer coverage, implying >US$70bn of required investment across Asia ( Exhibit 153 ).
China's stockpiling through 2025 demonstrates how strategic reserve build-outs can cushion supply shocks with China reducing
2mnt
Taiwan
Exhibit 153: Storage infrastructure and investments over 2030
1mnt Australia US$5bn
78mnt
South-East Asia
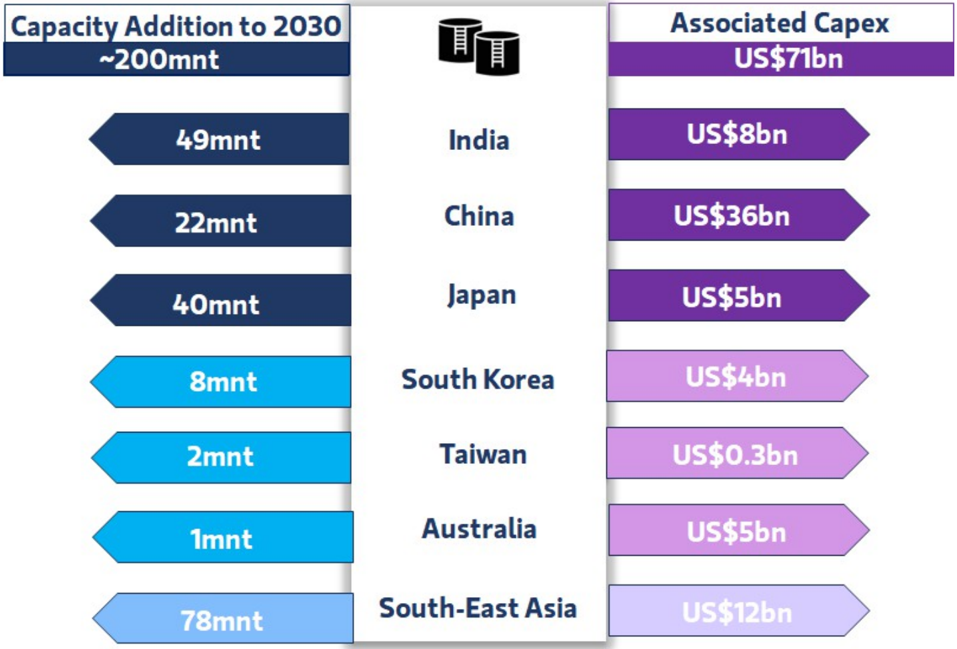
Source: Morgan Stanley Research estimates
US$12bn crude imports by >5mbpd within two months of the Strait of Hormuz closure without energy access disruptions. We estimate Asia (exChina) could add incremental petroleum reserves equivalent to ~80% of China's current reserves over the next five years. Australia has announced plans to increase storage capacity, while India is evaluating expansions in crude and LNG storage. India's partnership with the UAE to develop energy storage facilities in both countries - with ~US$1bn of investment - represents a noteworthy development. Southeast Asia and Japan are coordinating inventory build-out, reflecting mutually beneficial interdependence across these economies.
US$0.3bn
M
Assessing the Storage Investments Needed
- Crude and Petroleum (storage capacity expansion of ~1.4bn bbl, incremental investment of ~US$61bn): Asian countries will likely expand physical crude and product storage. While some countries (notably China, Japan, and South Korea) already have significant crude storage infrastructure, others such as India, Thailand, and the Philippines will likely increase reserves to ~60-90 days on average (from the current 30-45 days). The UAE is also adding strategic reserves in India. Similarly, we expect higher investment in refined product storage (gasoline, diesel, and jet fuel), with countries targeting ~60-90 days of cover (vs. ~60 days currently). Australia and Japan, in particular, will focus on strengthening refined product security.
- Natural Gas/Liquefied Natural Gas (storage capacity expansion of 5-6mntoe, ~US$8bn incremental investment): Natural gas is critical but more logistically challenging than crude, with greater difficulty in storing large volumes over extended periods. That said, we expect markets such as India, Taiwan, Singapore, and Thailand to enhance storage capabilities. We estimate these markets will increase storage to about two weeks of consumption, from currently limited infrastructure (with Singapore and Taiwan as partial exceptions).
- Fertilizers (storage capacity expansion of 3-4mnt, incremental investment of ~US$2bn): Major fertilizer consumers - including China, India, Indonesia, and Thailand currently maintain relatively stronger inventory positions for fertilizers compared to energy sources, as evidenced by government guidance in India and Thailand indicating supply visibility through July-August. However, China has already curtailed exports, underscoring the need to strengthen domestic storage. We expect China, Indonesia, Vietnam, and Australia to expand fertilizer storage, while India and Thailand will focus on improving self-sufficiency and diversifying imports ( Exhibit 193 ).
What Are Different Markets Doing?
- China: The country's strategic oil stockpiling represents one of the world's most ambitious energy security programs, targeting 180-day import coverage.
- India: Allocated Rs55.97bn (US$647mn) for strategic petroleum reserve purchases in FY2025-26. India also announced three new SPR sites in Rajasthan (Bikaner, underground), Odisha, and Mangalore (Phase II expansion), targeting an increase in strategic reserves from ~39mnbbl to >100mnbbl by 2030. The UAE plans to store ~30mnbbl in India, participate in the Vishakhapatnam reserve (Andhra Pradesh), and support development of facilities in Chandikol (Odisha). India is also exploring development of a strategic reserve in Fujairah (UAE) for crude oil and expanding LNG storage capacity domestically.
- Japan: Initiated monthly LNG emergency reserve purchases from January 2026, marking a shift from procuring only during peak demand periods. JERA has committed to buying at least one cargo per month (~840,000 tonnes annually) to buffer against supply disruptions.
- Taiwan: The government is evaluating overseas strategic reserves (e.g., Japan or South Korea) while expanding domestic LNG stockpiles from 11 days to 14 days and reducing reliance on Middle Eastern supply by increasing US LNG imports to 25% by 2029.
- South Korea: Constructing a sixth LNG storage facility in Dangjin (western port) and currently maintains 9 days of emergency LNG reserves.
- Australia: Plans include a A$10bn (US$7.2bn) package to strengthen fuel security and resilience, including A$7.5bn to expand fuel and fertilizer storage. The government targets ownership of ~1bn liters of fuel reserves and aims to increase coverage to at least 50 days of supply for diesel and jet fuel.
M
Exhibit 154: Comparing crude and LNG storage capital costs
| Storage Type | Capital Cost ($/barrel or equiv.) | Construction Timeline | Scalability | Asia Suitability | Annual OpEx | Primary Cost Drivers | Primary Lifecycle Risks |
|---|---|---|---|---|---|---|---|
| Crude Oil - VLCC Floating | $40-60/bbl 6-12 months (charter) | High (vessel availability) | Good (flexibility) | 8-12% | Crew (20-25 sailors), fuel/positioning, insurance (hull & P&I), port fees | Hull corrosion, marine incidents, regulatory changes (emissions) | |
| Crude Oil - Land Tank $25-40/bbl | 3-5 years | High | Excellent | 1.5-2% | Maintenance, security, minor utilities | Land lease/ownership, minor refurbishment | |
| Crude Oil - Underground Caverns | $10-20/bbl | 5-7 years | Limited | Low (geological limitations) | 0.8-1.2% | Monitoring, water management, minimal labor | Geological monitoring, long- term stability verification |
| LNG - Carrier Floating | $200- 280/tonne | 6-12 months | Moderate | Moderate | 10-15% | Crew, boil-off losses (0.15- 0.25%/day), positioning | Boil-off, cryogenic system failures, positioning constraints |
| LNG - FSRU | $150- 220/tonne | 12-24 months (conversion) | Moderate | Good (flexibility) | 8-12% | Crew, boil-off (0.1- 0.15%/day), regasification equipment maintenance | Aging regasification equipment, boil- off, mooring system |
| LNG - Land Tank | $180- 250/tonne | 3-4 years | High | Excellent | 2-3% | Boil-off (0.05-0.1%/day), refrigeration, maintenance | Refrigeration system replacement (15-20 year cycles) |
| Gas - Underground Caverns | $90- 225/tonne | 5-7 years | Limited | Low (geological limitations) | 1-3% | Compression, well maintenance, leakage monitoring | Geological monitoring, long- term stability verification |
Source: Morgan Stanley Research estimates
The 1973 & 1979 Oil Shocks: Foundation of Asian Strategic Reserves
The 1973 OPEC embargo and 1979 Iranian Revolution oil shock triggered Asia's first major buildout of strategic petroleum reserves. Japan, importing nearly 100% of its oil, was acutely vulnerable.
Japan's Response Timeline:
- 1967: Petroleum Stockpiling Act enacted (pre-crisis framework); 1975-1982: Accelerated construction reaching 90-day
import coverage target by 1982; 2004: Established JOGMEC [jogmec.go.jp]to centralize reserve management, consolidating government and private stockpiles
South Korea's Parallel Development:
- 1970: Established the Korea National Oil Corporation (KNOC) to manage reserves; 1988: Completed Ulsan SPR Complex the nation's largest integrated facility
M
Upstream: Back in Vogue
Looking back at the history of energy spending since 1945, we see two major upcycles: in the 1970s following oil price shocks, and in the early 2000s amid reserve scarcity before shale oil became economically and technologically viable.
Asia consumes one-third of global oil, 40% of natural gas, and about two-thirds of LNG. It also accounts for 75% of incremental oil demand and >60% of incremental gas demand through 2030.
Limited exploration investment over the past decade - driven by weak policy support, unremunerative gas prices, fuel subsidies, and elevated uncertainty - has constrained the development of Asia's upstream reserves. Reserve life across key producing countries stands at 5-6 years on a 2P consumption basis ( Exhibit 159 ). Production trends, particularly for oil, have been flat to declining across India, Malaysia, Indonesia, Thailand, and Vietnam ( Exhibit 170 ).
We see a shift since 2022, with policies becoming more market oriented in terms of upstream price realization in China, India, and
Associated Capex
US$1,005bn
Indonesia. Recent government actions include lowering royalties and improving policy stability, including the removal of windfall taxes in India - the fastest-growing oil consumer globally.
Upstream exploration and development investments are now increasing across key producing countries, marking a shift from the maintenance-led, reserve-replenishment spending seen over the past decade. A greater share of investment is occurring domestically and within Asia, rather than targeting global reserves - in contrast to prior cycles. New discoveries in Indonesia, Malaysia, and India, alongside shale gas development in China ( Exhibit 158 ) could accelerate development capex as policy frameworks improve. Governments are aligning gas prices more closely with global benchmarks, alongside broadly market-based oil pricing. We also expect policy makers to accelerate investment across storage value chains.
We are constructive on Asia's oil and gas producers, supported by rising returns, reduced government intervention, and higher production - particularly from domestic fields.
Exhibit 155: We expect Asia to add ~85mntpa of upstream capacity by 2030, requiring over US$1trn in investments (including maintenance)
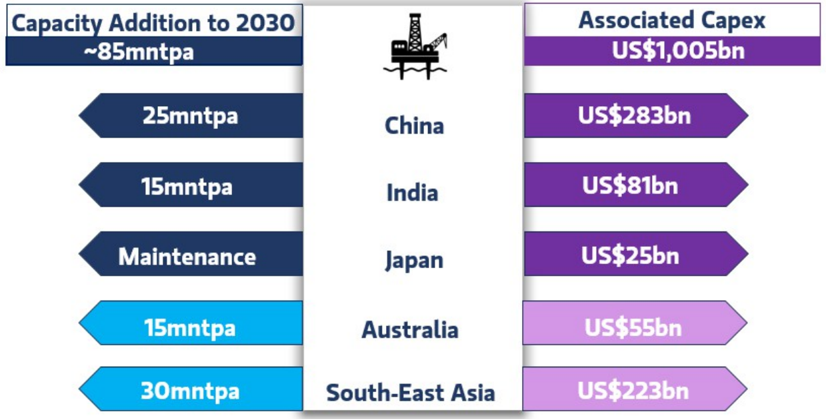
Source: Morgan Stanley Research estimates
M
Exhibit 156: Oil and gas contribute over two-thirds of Asia's primary energy consumption and both energy sources rely on imports
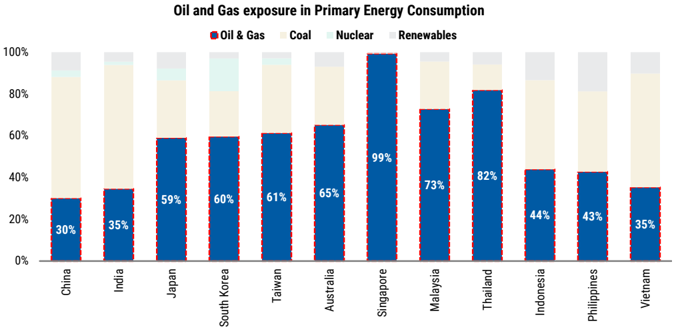
Source: Energy Statistics 2025, Morgan Stanley Research
Exhibit 157: Oil shocks becoming more frequent, putting stress on already tight global refining systems
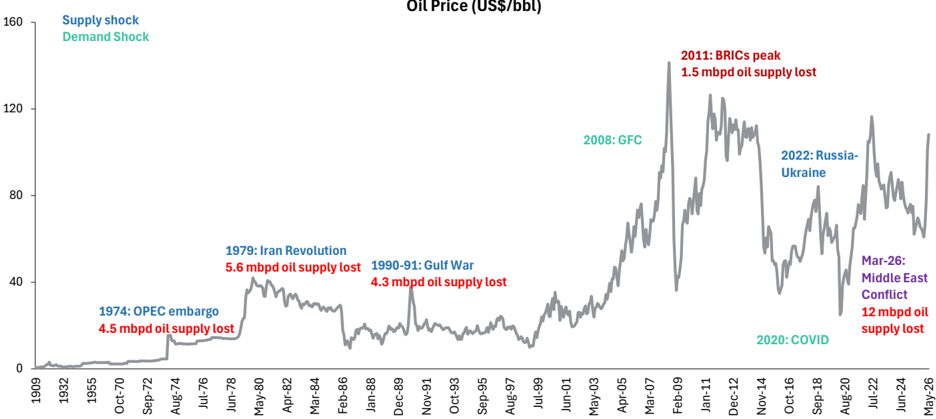
Source: US EIA Annual data through 1970, Refinitiv 1970-Present (Crude BFO 1M Europe), EIA, Morgan Stanley Research estimates
The Path Forward: A New Investment Cycle
We envisage >US$1trn of investment (including maintenance capex) driving ~85mntoe of incremental upstream production through 2030 ( Exhibit 155 ) in upstream oil and gas exploration.
Over the next five years, upstream oil and gas production across India, Indonesia, and Malaysia is set to grow after years of tepid domestic production growth, shaped by a clear shift over the past three years toward renewed exploration, gas prioritization, and more investor-friendly policy frameworks. Recent discoveries in Indonesia
(e.g., North Sumatra deepwater) and Malaysia (e.g., Bekok Deep and multiple offshore finds) challenge the 'mature basin' narrative and underpin a new wave of licensing rounds and potential project sanctions through the late 2020s, with Southeast Asia potentially adding ~18% gas output if pending FIDs materialize.
- Indonesia and Malaysia are reinforcing this momentum through fiscal incentives, revised production-sharing terms, and aggressive bid rounds led by Pertamina and Petronas alongside majors (TotalEnergies, Chevron, Eni), signaling strong industry interest but also execution risk given historical project delays.
M
- Petronas has been actively pursuing collaborations to unlock the region's upstream potential, including its US$15bn JV with Eni targeting eight new projects and large-scale gas resource monetization across Malaysia and Indonesia (>15Tcf in Indonesia) ( Exhibit 158 ).
- India , by contrast, is earlier in the cycle but more policydriven, with sweeping reforms (HELP, PNG Rules 2025, MRSC) opening ~1mn sq km of acreage, advancing deepwater frontiers such as the Andaman Basin, and explicitly targeting lower import dependence and a higher gas share in the energy mix. India has also lowered royalties on onshore and offshore crude production, supporting realizations and improving returns on domestic exploration (see details here).
Across all three countries, national oil companies and governments are aligned on energy security and domestic supply, while international operators highlight deepwater gas, improved subsurface data, and regulatory clarity as key enablers. This implies a medium-term trajectory of rising gas-weighted production, selective offshore growth, and continued reliance on policy support to translate discoveries into sustained output gains. Taken together, NOCs and regional operators are leveraging liberalized policies, new partnership models, and gas-weighted portfolios to accelerate development.
More Discoveries Emerging; Policy Focus Shifting
Over the past year, we have seen numerous successful discoveries across China, India, and Indonesia. Higher-for-longer oil and gas prices could further incentivize investment and policy support for new resource development, including shale gas and coalbed methane particularly in China, which holds abundant reserves but has yet to fully develop them.
Over the past decade, Asia's relative oil burden has declined, marketlinked pricing has reduced government subsidy burdens (notably in India), and corporate balance sheets have strengthened. In our view, this improves visibility for upstream investment and provides additional headroom as companies scale up spending over the coming decade.
We believe the next decade could see a more meaningful uplift in upstream capex intensity, alongside stronger policy support and pricing mechanisms that incentivize investment across the region and accelerate the development of 2P and 3P reserves, with conversion to 1P reserves through 2030 and beyond. Notably, Asian upstream companies such as PTTEP, Oil India, Santos, Woodside, and to a lesser extent CNOOC compare favorably on three-year production growth versus global majors, highlighting both capability and upside potential if investment accelerates ( Exhibit 163 ).
Exhibit 158: Over the last couple of years, deepwater discoveries have come to light - especially gas
| Announced | Discovery / field | Key operator | Country | Basin / area | Estimated reserve / resource value |
|---|---|---|---|---|---|
| 20-Apr-26 Geliga-1 | 20-Apr-26 Geliga-1 | Eni | Indonesia | Kutei Basin, Ganal block | ~ 5 Tcf gas in-place+300MMbbl condensate |
| 3-Apr-26 Zhylyoi carbonate | platform / Karaton-Kazhygali-Zhylyoi | KazMunayGas-linked exploration | Kazakhstan | Pre-Caspian / Zhylyoi carbonate platform | Resource potential cited at 4.7 Bntonnes hydrocarbons ; wider massif ~20 Bn tonnes standard fuel |
| 4-Mar-26 Baragzai X-1 / X-01, Nashpa Block | 4-Mar-26 Baragzai X-1 / X-01, Nashpa Block | OGDCL | Pakistan | Kohat / Nashpa Block, Khyber Pakhtunkhwa | Flow-tested oil &gas; reported 3,100 bpd oil + 8.15 MMscfd gas ; reserves not disclosed |
| 12-Mar-26 Barokah-1 | 12-Mar-26 Barokah-1 | PETRONAS North Ketapang | Indonesia | North Ketapang PSC, offshore East Java / Northern Madura | Hydrocarbon discovery; resource volume not disclosed |
| 23-Dec-25 Qinhuangdao 29-6 | 23-Dec-25 Qinhuangdao 29-6 | CNOOC | China | Bohai Sea | > 100 MMtonnesoil equivalent in-place ; discovery well tested ~ 2,560 bpd oil |
| 9-Dec-25 Konta-1 | 9-Dec-25 Konta-1 | Eni | Indonesia | Kutei Basin, Muara Bakau PSC | 600 Bcf GIIP , upside > 1 Tcf |
| 24-Oct-25 Qijiang shale oil reserve | 24-Oct-25 Qijiang shale oil reserve | Sinopec | China | Sichuan Basin, Chongqing | ~ 100 MMtonnesshale oil reserve |
| 15-Sep-25 Ustyurt deep gas discovery | 15-Sep-25 Ustyurt deep gas discovery | NOC | Uzbekistan | Ustyurt Plateau, Karakalpakstan | 'Very large' gas reserve; volume not disclosed |
| 27-Sep-25 Sri Vijayapuram-2 / Vijayapuram-2 | 27-Sep-25 Sri Vijayapuram-2 / Vijayapuram-2 | Oil India Ltd | India | Andaman offshore block AN-OSHP-2018/1 | Natural gas occurrence; basin HRAS potential 371MMtoe , but field volume not yet disclosed |
| 7-Sep-25 Rashidpur-3 well reserve addition | 7-Sep-25 Rashidpur-3 well reserve addition | Sylhet Gas Fields Ltd / Petrobangla | Bangladesh | Rashidpur field, Sylhet / Bengal Basin | ~ 25.55 Bcf expected over 10 years |
| 1-Oct-25 Jamalpur gas discovery | 1-Oct-25 Jamalpur gas discovery | BAPEX | Bangladesh | Jamalpur / Bengal Basin area | Initial flow reported around 7.2 MMscfd ; reserve volume not disclosed |
| 13-May-25 Puguang-area deep shale gas well | 13-May-25 Puguang-area deep shale gas well | Sinopec | China | Sichuan Basin | Tested 314,500 m³/d industrial gas flow; reserves not |
Source: Company data, Bloomberg and Morgan Stanley Research
disclosed
M
Fulfilling Asia's Reserve Potential
Looking at the evolution of Asia's upstream reserve development over the past fifteen years, the pace of development has been slow for oil (proved reserves broadly flat over the period, with some decline in key countries), while gas has seen modest progress (proved reserves growing at ~2.5% CAGR, led primarily by China, Myanmar, and Papua New Guinea, and to a lesser extent India and Malaysia, offsetting declines in Bangladesh, Indonesia, and Thailand) ( Exhibit 160 & Exhibit 161 ). From an energy consumption perspective, reserve life (on a 2P basis) has declined across Asia (with Brunei as an exception) and averages ~9-10 years as of 2024, underscoring the region's continued reliance on external energy sources (reserve
life based on production volumes stands at ~15-20 years) ( Exhibit 159 ).
That said, PTTEP (focused primarily on Southeast Asia and the Middle East) and Petronas have increased their reserve base, reserve life, and reserve replacement ratios by prioritizing development of Malaysian and Thai assets, highlighting the region's potential if investment follows. This follows three years of sustained production and reserve declines. In addition, several countries - particularly Malaysia, Indonesia, and India - have made promising discoveries over the past three years ( Exhibit 158 ), significantly expanding 2P and 3P resource potential, which can convert to 1P-2P reserves as investment accelerates.
Exhibit 159: Asia's reserve life based on energy consumption averages ~9-10 years (vs. ~15 years on production), implying that Asia's reliance on external energy will remain elevated
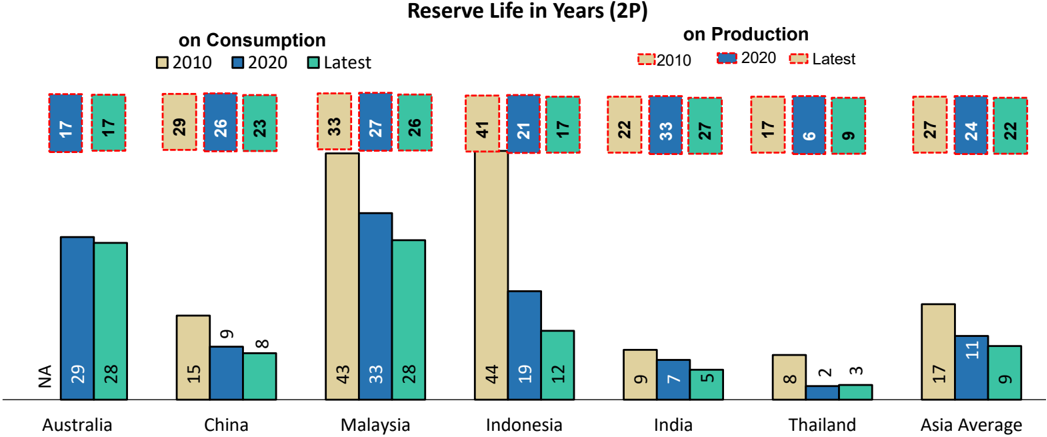
Source: Statistical Review of World Energy, Morgan Stanley Research estimates
Exhibit 160: Asia's 1P oil reserves
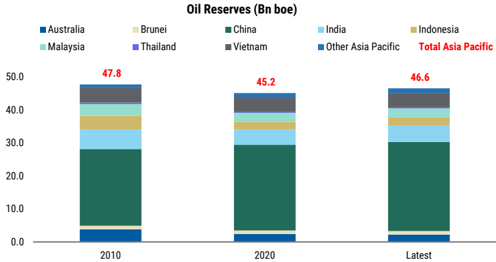
Source: Statistical Review of World Energy, Morgan Stanley research
Exhibit 161: Asia's 1P gas reserves
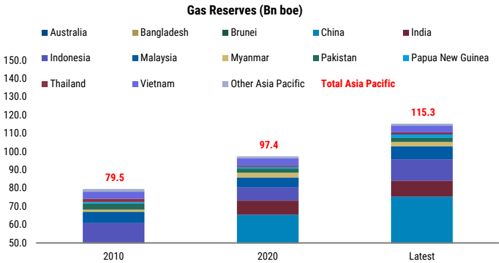
Source: Statistical Review of World Energy, Morgan Stanley research
M
Exhibit 162: Asia upstream capex cycle fairly muted over last 5-7 years with a focus on maintaining current levels of production
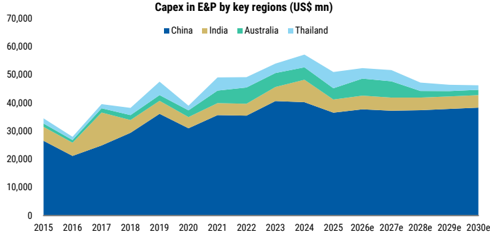
Source: Company data, Morgan Stanley Research estimates
China's Unconventional Resources to See Development Boost
China has discovered and is rapidly commercializing a new category of unconventional gas - 'coal-measure shale gas' - extracted from deep coal-bearing strata where coalbed methane, coal-measure shale gas, and tight sandstone gas are co-located and co-produced from a single well system. The flagship Daji gas field in the Ordos Basin provides proof of concept, scaling daily output from ~150,000m³ in 2019 to >11mn m³ by mid-2026 - a ~70x increase in seven years - with annual production now >4bcm. Crucially, Daji demonstrates that China's deep coal-measure formations can scale commercially using factory-style horizontal drilling, multi-stage hydraulic fracturing, and multi-gas co-production techniques, effectively replicating the US-style supply transformation ( Exhibit 165 ). This engineering scalability marks a key inflection, signaling that coal-measure shale gas is transitioning from an exploration theme to a commercially viable growth engine, with the potential to reshape China's gas supply mix over the next decade ( Exhibit 164 ).
Geological Matrix: Coal-measure shale gas is unconventional natural gas trapped within interbedded layers of coal, dark mud-shale, and tight sandstone (collectively referred to as 'coal measures').
Exhibit 163: Asia upstream volume growth potential stacks up favorably among global peers
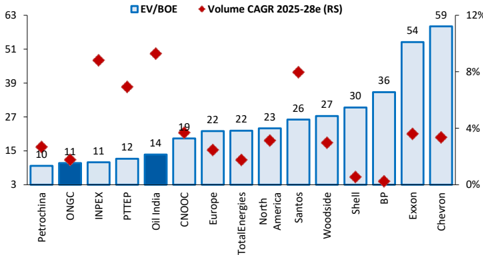
Source: Company data, Morgan Stanley research
Source and Reservoir Fusion: Coal seams and surrounding carbonaceous shale act as both the source rock (gas generation) and reservoir (gas storage).
High Free-Gas content: Unlike traditional coalbed methane (CBM) which relies primarily on adsorption and requires water drainage for depressurization - deep coal-measure shales contain a high proportion of free gas alongside adsorbed gas. This enables immediate highvolume production upon drilling, followed by longer-term desorption.
Resource Potential and Key Basins in China
- Enormous Resource Base: China's abundant coal resources underpin significant coal-measure shale gas potential. Resources at depths shallower than 6,000m are estimated at ~55tcm, with technically recoverable volumes of ~13tcm.
- Ordos Basin: The core of China's 'coal shale gas' development, with ~30.5tcm of resources. PetroChina has achieved commercial breakthroughs here (e.g., the Daji block), delivering high yields from deep coal-measure formations.
- Qinshui and Junggar Basins: The Permo-Carboniferous coalmeasure shales in Shanxi's Qinshui Basin, along with deep coal formations in Xinjiang's Junggar Basin, represent key development areas for co-located gas resources.
replicateu dul oss multiple Coar ollale basilis
Exmbre 104. Ulla lolal ollale yao productiol, do o Ul lulal yas vulpul
200-
250-
1751
200-
M
150-
125-
• 150L
• 100 -
100-
751
50 -
50
25-
0
Production (bcm)
11%
28
25
L%.
2024
2024
Mature growth
37%
28%
38%
188
29%
112
Exhibit 164: China total shale gas production, as % of total gas output
12%
31
2%
27
2025
2025
Coal shale gas (bcm)
%)
224
Plateau
20540%
transiti991
1560%
41%
-50%
-
40%
-
35%
-
40%
31%
- 30%
(%)
gas
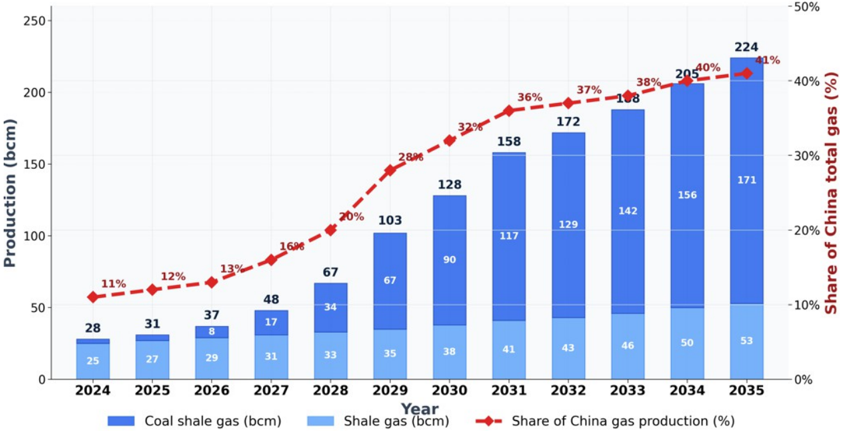
Source: Sinopec, PetroChina, Morgan Stanley estimate=beyond 2025
Exhibit 165: China coal-shale gas potential production ramp - assuming Daji-style engineering scalability is replicated across multiple coal-shale basins
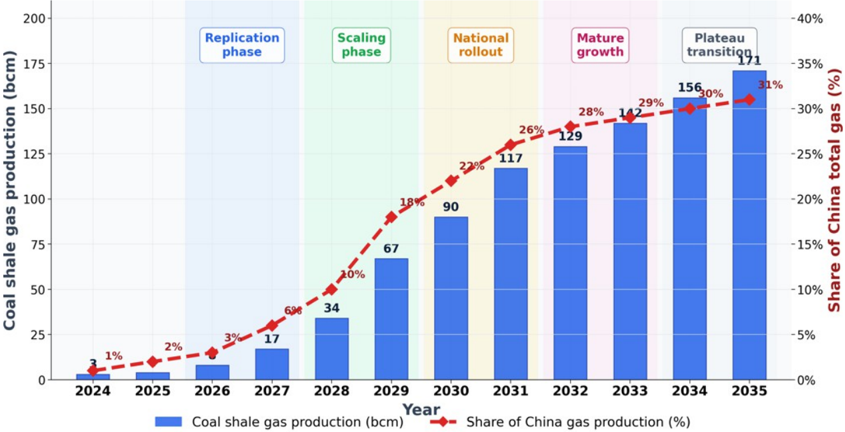
Source: PetroChina, Morgan Stanley estimates = beyond 2025
Asia Upstream Dependence Remains High
Dependency on oil and gas in the primary energy mix remains high across Asian countries, with most securing more than half of their oil requirements externally ( Exhibit 166 ). Moreover, non-energy uses of these fossil fuels remain underappreciated, including natural gas as a feedstock for fertilizer production, and naphtha and other hydrocarbons as inputs for polymers, yarns, and a wide range of chemical intermediates.
During 2008-17, countries such as India, Malaysia, and China initiated their first deepwater projects. However, this cycle experienced cost overruns and project delays, while US shale development further dampened E&P capex as companies prioritized backfill projects and field life extensions. In addition, the time from exploration to project start-up and production has increased by ~25% over the past two decades ( Exhibit 167 ) from <15 years in 1990-2000 to ~20 years post-2020.
slayes ul new conventional ull dila yao projecto, 199u lU <U<4
20
15
10
5
M
Exhibit 166: Asia oil import dependence remains elevated as upstream focus has been limited
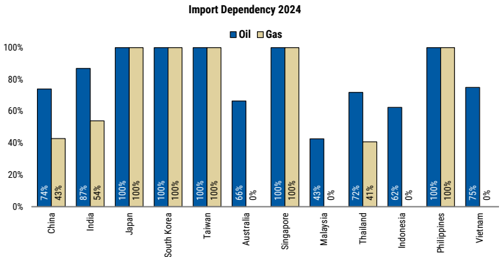
Source: Energy Statistics 2025, Morgan Stanley Research
Assessing The Path Forward for Asia's Two Large Upstream Players :
- PetroChina: After a decline in exploration capex in 2025, PetroChina targets ~US$32bn of E&P capex, focused on exploration and development in key domestic basins - Songliao, Ordos, Junggar, Tarim, Sichuan, and Bohai Bay alongside intensified efforts in unconventional resources (shale oil, shale gas, coalbed methane) and accelerated gas storage build-out. On the back of recent discoveries, we expect China's gas production to grow at ~5% through 2030 ( Exhibit 168 ).
- ONGC and Oil India: ONGC is monetizing key oil and gas assets India - KG Basin, Daman and Mumbai High, and the company is leveraging technical partnerships with BP to increase efficiency of production. There have also been discoveries in the deepwater Andaman Basin ( Exhibit 169 ) with resource discoveries by Oil India.
Exhibit 168: PetroChina: We expect gas production to inflect further
with new discoveries
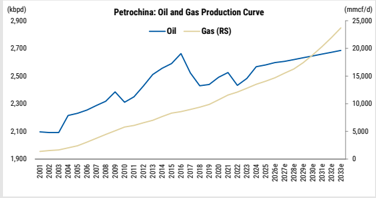
Source: Company data, e = Morgan Stanley Research estimates
169:
Exhibit
ONGC: We expect energy security focus to reverse
natural gas decline rate
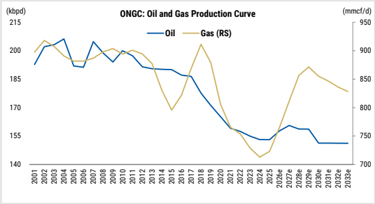
Source: Company data, e = Morgan Stanley Research estimates
Exhibit 167: Average time periods for exploration to development stages of new conventional oil and gas projects,1990 to 2024
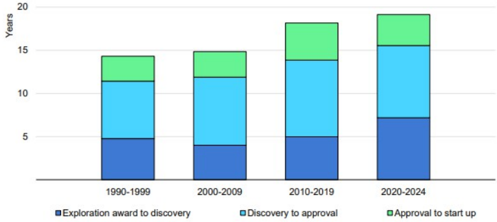
Source: IEA analysis based on data from Rystad Energy (2025)
M
Exhibit 170: Oil Production: Asia forms 8% of global crude oil production and is largely led by China
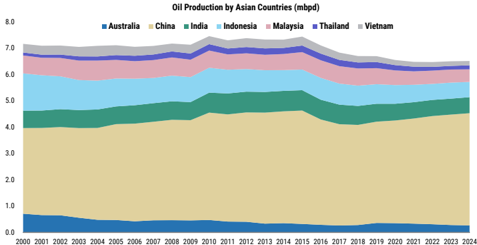
Source: Energy Statistics, Morgan Stanley Research
Exhibit 171: Gas Production: Asia is about 11% of global gas production with China, Australia, Malaysia and Indonesia the key producers
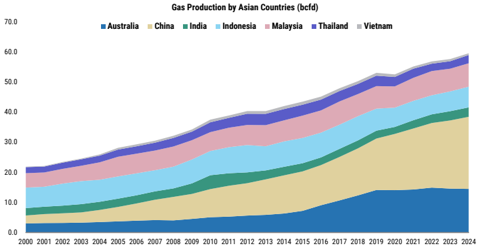
Source: Energy Statistics, Morgan Stanley Research
M
Upstream Energy: Beneficiaries of Higher Oil and Natural Gas Production
Exhibit 172: Upstream O&G and Integrated Oil Majors
| Market cap, current,USD | 3MADTV,USD (MM) | Rating | Share price, last Price Target (Local %Upsidefrom | Share price, last Price Target (Local %Upsidefrom | Share price, last Price Target (Local %Upsidefrom | Country | |||||
|---|---|---|---|---|---|---|---|---|---|---|---|
| BBGTickers | CompanyName | Ticker | close | CCY) | last close | Sub-Sector | MSAnalyst | ||||
| (MM) | |||||||||||
| Upstream O&GandIntegrated Oil Majors | Upstream O&GandIntegrated Oil Majors | ||||||||||
| 883HK | CNOOC | 0883.HK | 151,424.5 | 557.5 | Overweight | 27.80HKD | 28.90HKD | 4.0% | China | Upstream | Jack Lu |
| 601857CG | PetroChina | 601857.SS | 265,102.1 | 543.4 | Overweight | 11.63 | 14.70 | 26.4% | China | Upstream | Jack Lu |
| ONGCIS | Oil &Natural Gas Corp. | ONGC.NS | 39,090.6 | 69.6 | Overweight | 296.50 | 363.00 | 22.4% | India | Upstream | Mayank Maheshwari |
| OINL IS | Oil India Limited | OILI.NS | 8,620.1 | 34.2 | Overweight | 501.70 | 566.00 | 12.8% | India | Upstream | Mayank Maheshwari |
| 1605 JT | INPEX | 1605.T | 31,396.5 | 307.4 | Overweight | 3,990.00 | 3,970.00 | -0.5% | Japan | Upstream | Reiji Ogino |
| 1662 JT | Japan Petroleum Exploration | 1662.T | 3,253.0 | 55.7 | Equal-Weight | 2,021.00 | 1,910.00 | -5.5% | Japan | Upstream | Reiji Ogino |
| WDSAU | Woodside Energy Group Ltd | WDS.AX | 42,483.4 | 184.6 | Underweight | 32.50AUD | 28.00AUD | -13.8% | Australia | Upstream | Rob Koh |
| STO AU | Santos | STO.AX | 18,103.6 | 92.1 | Equal-Weight | 8.09AUD | 7.50AUD | -7.3% | Australia | Upstream | Rob Koh |
| PTTEP TB | PTT Exploration &Production | PTTEP.BK | 18,536.4 | 115.0 | Overweight | 153.00 | 163.00 | 6.5% | Thailand | Upstream | Mayank Maheshwari |
| XOMUN | Exxon Mobil Corporation | XOM.N | 628,249.6 | 777.0 | Overweight | 151.57 | 171.00 | 12.8% | United States of America | Intergrated | Devin McDermott |
| CVXUN | Chevron Corporation | CVX.N | 370,437.2 | 598.4 | Overweight | 186.00 | 212.00 | 14.0% | United States of America | Intergrated | Devin McDermott |
| TTE US | TotalEnergies SE | TTE.N | 209,978.5 | 26.4 | Overweight | 91.76 | 103.30 | 12.6% | France | Intergrated | Martijn Rats |
| SHEL LN | Shell PLC | SHEL.L | 238,183.5 | 269.8 | Equal-Weight | 3,148.50 | 3,495.00GBp | 11.0% | United Kingdom | Intergrated | Martijn Rats |
| BP US | BP plc | BP.N | 116,233.2 | 105.2 | Overweight | 44.40 | 49.40 | 11.3% | United Kingdom | Intergrated | Martijn Rats |
Source: Company data, Refinitiv, Bloomberg, Morgan Stanley Research
M
Energy Services and Logistics
Global shipyard capacity has reduced by 60%, with the number of shipyards declining from a 2007 peak of 699 to fewer than 350 in 2025. China, South Korea, and Japan account for >85% of the global shipbuilding industry, prompting countries in the region to expand capacity from both energy and defense security perspectives ( Exhibit 9 ). Other Asian markets, including Vietnam, the Philippines, and India, also offer significant potential, with governments beginning to incentivize new investments in 2025. India has outlined a US$5bn plan to revive shipbuilding through financial support and interest cost incentives under the National Shipbuilding Mission, while South Korea has committed US$1.44bn to improve automation and industry attractiveness. Vietnam provides meaningful incentives to expand its global market share, including preferential corporate income tax (CIT) rates of 10% for 15 years, a '4-year exemption and 9-year 50% reduction' tax holiday, and import duty exemptions.
Exhibit 173: Asia O&G capex increasing in recent years
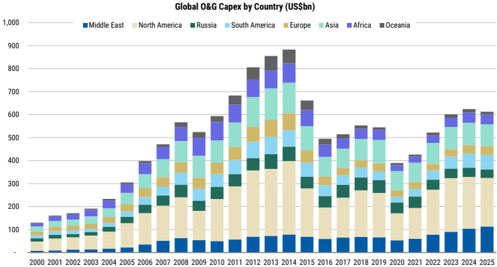
Source: Rystad Energy, Morgan Stanley Research
Energy Services: Back to its Place in the Sun
Within energy services, a recovery in upstream investment following a decade of decline should support stronger order books for Asian shipyards. The industry saw an initial leg of orderbook growth during 2022-25, and the 2026 energy shock should further accelerate demand for jack-ups, FPSOs, and FLNG units in Asia through 2030. Given the long-dated nature of energy investments, we expect upstream supply chain spending to skew toward the later part of the decade. We prefer Seatrium, SBM Offshore, Technip Energies and Saipem ( Exhibit 178 ). In the US, we prefer HAL and SLB .
Looking at the history of energy spending since 1945, two major upcycles stand out - the 1970s following oil price shocks, and the early 2000s ( Exhibit 175 ), when constrained reserve additions preceded the emergence of shale as an economically and technologically viable solution.
Exhibit 174: Current environment could drive upside to what looks like a stable spending curve over the coming years
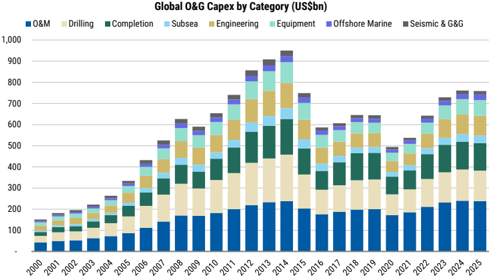
Source: Rystad Energy, Morgan Stanley Research
camble 1o.Laek ul supply m 19rus allu vellallu growull Luous lymmeu the last lwo super cycles ul uro spellully
M
We expect consensus expectations for energy spending over the coming years to move higher as these themes continue to develop. The magnitude of any increase, however, remains uncertain, given ongoing questions around the energy transition, long-term demand outlook, and technological evolution.
Looking back over the last 25 years of IEA commentary ( Exhibit 176 ), we identify three distinct phases in market thinking. Between 2000 and 2015, urgency around increasing investment was high. Between 2016 and 2020, concerns around new technologies and energy transition risks became more prominent. Since 2021, energy security has re-emerged as a dominant theme, a trend that could accelerate further following recent developments in the Middle East.
Exhibit 175: Lack of supply in 1970s and demand growth in 2000s ignited the last two super-cycles of OFS spending
1945 1955 1965
Source: Rystad Energy, Morgan Stanley Research
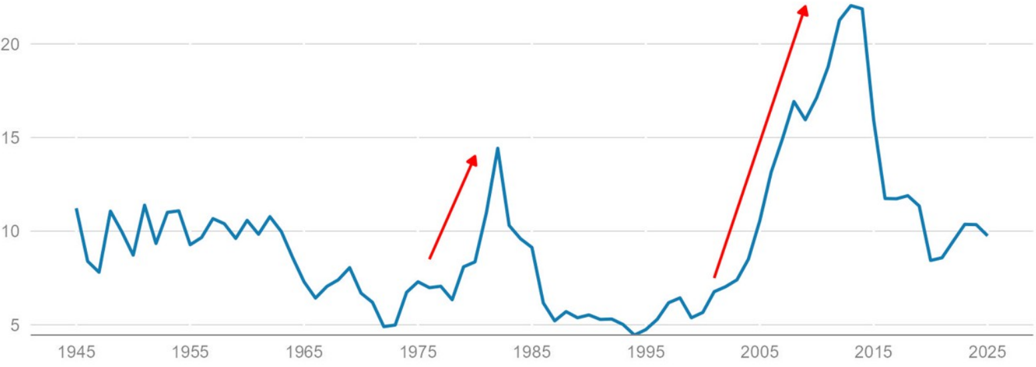
Source: Rystad Energy, Morgan Stanley Research
1975
1985
1995
2005
2015
20
15
10
5
2025
pullll!
M
Exhibit 176: Evolution of conviction in the necessity of more oil & gas investments: Could we be close to another turning point?
2000
2001|
2002
2003
2004
2005
2006
2007
2008
2009
2011
2013
2014
2015
2016
2017
2018
2020
2022
2025|
Consuming regions...will become much more dependent on imported oil and gas. As demand grows, massive investment in oil production facilities will be
needed, particularly in the Middle East.
Massive investment in energy production and transportation infrastructure will be needed to exploit these reserves. The capability, and willingness, of
Middle East oil producers to exploit their low-cost reserves is a major source of uncertainty.
Necessary expansion...will call for massive investment at every link in the energy supply chain. Investment of almost $4.2 trillion will be needed for new power generation capacity alone between now and 2030.
| Huge investments will be needed in oilfields, tankers, pipelines and refineries, $3 trillion from 2003 to 2030... global production of conventional oil will not peak before 2030 if the necessary investments are made. |
|---|
| The world needs sustained investment in oil and gas in any plausible future... The question is not whether investment is needed — it is. The question is whether it will materialise in time. |
| (The world faces] sustained growth in demand for the region's oil and gas...supply challenges requiring investment. |
| Some $22 trillion of investment in supply infrastructure is needed to meet projected global demand. Mobilising all this investment will be challenging |
| The immediate risk to supply is not one of a lack of global resources, but rather a lack of investment where it is needed. Upstream investment has been rising rapidly in nominal terms, but much of the increase is due to surging costs and the need to combat rising decline rates. |
| Falling energy investment will have far-reaching consequences. Energy investment worldwide has plunged.... Many ongoing projects have been slowed and a number of planned projects have been postponed or cancelled. |
| Political turmoil in the Middle East and North Africa and its impact on oil and gas investment [central concern]... [Delayed investment leads to] a supply crunch and higher prices. (Deferred Investment Case) |
| Huge volumes of oil are needed to meet growing demand and offset declines in existing fields... dependent on highly complex and capital-intensive |
| deepwater developments, requiring levels of upstream investment beyond those of either the Middle East or Russia. Investment of some $900 billion per year in upstream oil and gas development is needed by the 2030s to meet projected demand, but there are many |
| uncertainties over whether this investment will be forthcoming in time. An annual $630 billion in worldwide upstream oil and gas investment...is required just to compensate for declining production at existing fields, and that is |
| before any increase in demand is taken into account. Phase II: Less straight-forward investment cycle (2016-2020) |
| A shortfall of new projects...would lead to a period of market volatility. There is also the possibility that a surfeit of investment...could lead to some projects |
| Today's low levels of upstream investment [could] eventually lead to a price spike... [Yet) the rapid deployment and falling costs of clean energy technologies |
| Investment in oil and gas supply has fallen sharply... (Risk of:) are we heading for an oil supply shock? |
| Phase III: Energy security returns / Energy diversification (2021-2025) |
| Despite higher prices and huge windfall profits...upstream spending is the only significant segment that remains below pre-Covid levels... some [governments] seeking to increase or diversify oil and gas supply; many looking to accelerate structural change. |
| Geopolitical fragility coexists with subdued oil prices...oil market balances showing a large surplus of supply over demand. Countries are prioritising energy |
| Source: IEA World Energy Outlook (various editions), Morgan Stanley Research |
M
Energy Logistics: Higher for Longer Rates
50,000.00
The available compliant tanker fleet (i.e., vessels that are fully insured and not engaged in sanctioned oil trade) saw only modest growth in 2024-25, reflecting earlier low ordering activity and shipyard bottlenecks. New deliveries reached multi-decade lows during this period, keeping effective supply tight. However, strong cash flows have driven a pickup in new orders since 2022, with the global tanker orderbook rising to >20% of the existing fleet for delivery over the next 3-5 years as of April 2026 ( Exhibit 177 ).
Couran.
We believe risk-reward remains skewed to the upside, supported by a potential shortage of 'compliant' vessels, global oil restocking demand, and stronger bargaining power for shipowners. We prefer tanker shipyards, including Hanwha Aerospace, which owns Hanwha Ocean, as well as tanker operators, including COSCO Shipping Energy Transportation and Mitsui O.S.K. ( Exhibit 179 ) The available compliant tanker fleet is increasingly constrained by vessel age , as older ships are less fuel-efficient and more exposed to tightening environmental requirements. Per Clarkson, ~22% of tanker tonnage is already 20 years or older, while the average fleet age exceeds 14 years, leaving a significant portion more vulnerable to slower sailing speeds, weaker carbon-intensity performance, and rising compliance costs. Older non-eco vessels already face stricter
18,000.00
- 16,000.00
regulatory impact, and owners show limited willingness to retrofit aging ships for compliance.
- 12,000.00
A meaningful portion of the global tanker fleet is now tied up in 'shadow' trade carrying sanctioned oil from Russia, Iran, and others, and does not compete in the mainstream market. As of March 2026, ~19% of crude tankers and ~10% of product tankers are sanctioned, accounting for ~16% of total tanker capacity. Including 'shadow but not sanctioned' vessels, Clarkson estimates ~24% of the fleet is effectively non-compliant. These vessels are often older, underinsured, and operate with limited transparency, removing a substantial share of supply from the compliant market. This dynamic reduces the pool of insurable, tradable tonnage and keeps effective supply tight. As long as sanctions persist or intensify, compliant owners benefit from reduced competition. Conversely, any easing of sanctions or reintegration of shadow vessels would expand supply.
Geopolitical uncertainty could disrupt global oil trade flows and create inefficiencies in shipping, as operators adjust capacity across regions to reflect shifting trade patterns. While global vessel availability may remain sufficient in aggregate, route dislocations could drive temporary mismatches between supply and demand, increasing the need for additional capacity to accommodate changing trade routes ( Exhibit 178 ).
Exhibit 177: Energy logistics costs remain elevated as geopolitical risk premiums and more complex transit requirements take shape in an increasingly multi-polar world
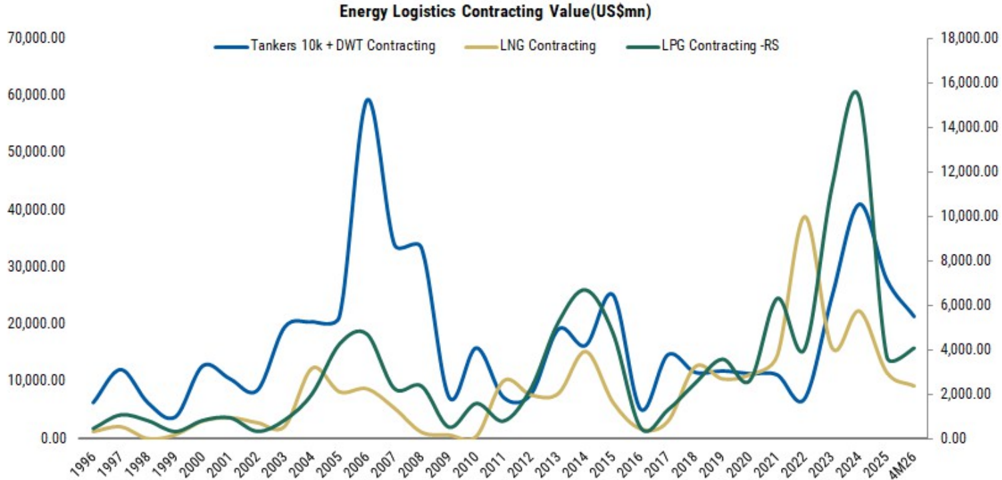
Source: Clarkson, Morgan Stanley Research
—LPG Contracting -RS
Muule cast Commel Flaybook
M
Market Concentration
Owners idle capacity for higher return
Comments
Supply growth to accelerate vs. 2025, but remains moderate in 2026.
Higher market concentration and bargaining power from vessel owners
During the late 1960s and early 1970s, tanker owners enjoyed an unprecedented boom. Oil was the world's dominant trade commodity, and the Suez Canal's closure in 1967 forced Middle East oil bound for Europe to travel around the Cape of Good Hope, doubling the distance and effectively doubling tanker demand. Freight rates and vessel prices surged, and industry experts proclaimed a 'new era' of growth. This triggered new building activities from the market, which led to oversupply in the following years. fleet dynamics "Dark Fleet" move faster.
Geopolitical disruptions
Global oil trade map shift
Exhibit 178: Tanker - Middle East Conflict Playbook
Compliant Demand
Effective capacity erosion from a mismatch of vessel demand and supply
- Near-term positive: capacity disruption;
| Strait to stay closed | - Medium- to long-term negative: potentially lower | ||
|---|---|---|---|
| Strait of Hormuz | Reopening of the strait | Reopening of the strait | shipment demand globally Potential restocking to drive higher shipment |
| Production hikes OPEC and non-OPEC | Slower-than-expected | Slower-than-expected | Higher shipment demand and longer voyages if |
| Production Sanctions on Russian and Iranian oil exports Sanctions relief | production hike production increases from non-OPEC countries Oil production capacity disrupted amid conficts | Impacts on compliant vessel demand | |
| U.S. Strategic Petroleum Reserve SPR Releases | Longer shipment distance | ||
| Oil exports in the Red Sea | Higher exports from Yanbu Yanbu exports disrupted | Higher exports from Yanbu Yanbu exports disrupted |
Source: Morgan Stanley Research
M
Oil Services, Equipment & Logistics: Key Beneficiaries
Exhibit 179: Key beneficiaries within Oil Services, Equipment & Logistics
| BBGTickers | CompanyName | Ticker | Market cap, current,USD (MM) | 3MADTV,USD (MM) | Rating | Share price, last close | Price Target (Local CCY) | %Upsidefrom last close | Country | Sub-Sector | MSAnalyst |
|---|---|---|---|---|---|---|---|---|---|---|---|
| Oil Services | |||||||||||
| TE FP | Technip EnergiesNV | TE.PA | 7,696.3 | 23.2 | Equal-Weight | 35.66 | 36.50 | 2.4% | France | LNGexport terminal Equipment | Guilherme Levy |
| SPMIM | Saipem | SPMI.MI | 10,491.3 | 163.9 | Overweight | 4.45 | 4.90 | 10.2% | Italy | EPC | Guilherme Levy |
| HALUN | HalliburtonCo | HAL.N | 34,836.1 | 155.3 | Overweight | 42.98 | 42.00 | -2.3% | United States of America | Integrated Oilfield Services | Joe Laetsch |
| SLBUN | SchlumbergerNV | SLB.N | 83,185.0 | 209.0 | Overweight | 56.77 | 57.00 | 0.4% | United States of America | Integrated Oilfield Services | Joe Laetsch |
| 028050 KP | SamsungE&ACoLtd | 028050.KS | 7,300.2 | 103.7 | Overweight | 47,400.00 | 63,000.00HKD | 32.9% | Korea; Republic (S. Korea) | EPC | Joon Seok |
| WORAU | Worley Ltd* | WOR.AX | 4,250.8 | 24.5 | Not Covered | 8.67 | NA | NA | Australia | LNGDesign/Operations | Not Covered |
| PWRUS | Quanta Services Inc* | PWR.N | 114,917.6 | 160.4 | Not Covered | 765.81 | NA | NA | United States of America | Gas pipeline construction | Not Covered |
| 601808CG | China Oilfield Services Ltd. | 601808.SS | 6,234.8 | 103.8 | Underweight | 14.31 | 13.70 | -4.3% | China | Offshore Energy Operator | Jack Lu |
| STM SP | Seatrium Limited | SEAT.SI | 6,322.2 | 31.9 | Underweight | 2.23 | 1.85 | -17.0% | Singapore | Offshore Energy EPC | Mayank Maheshwari |
| SBMONA | SBMOffshoreNV | SBMO.AS | 7,184.2 | 19.8 | Overweight | 35.42EUR | 45.00EUR | 27.0% | Netherlands | Offshore Energy Operator | Guilherme Levy |
| 6269 JP | Modec Inc* | 6269.T | 5,677.3 | 169.3 | Not Covered | 82.83 | NA | NA | Japan | Offshore Energy Operator | Not Covered |
| RIGUN | Transocean Ltd. | RIG.N | 7,301.5 | 48.8 | Equal-Weight | 6.54 | 7.00 | 7.0% | Switzerland | Offshore Energy Operator | Joe Laetsch |
| HONUS | Honeywell International Inc | HON.O | 138,478.6 | 865.8 | Equal-Weight | 217.15 | 245.00HKD | 12.8% | United States of America | Equipment | Christopher Snyder |
| LT IS | Larsen &Toubro Ltd | LART.NS | 55,661.8 | 156.4 | Overweight | 3,921.00 | 4,968.00HKD | 26.7% | India | EPC | Girish Achhipalia |
| 014620 KS | Sung Kwang Bend CoLtd | 014620.KQ | 658.5 | 10.8 | Overweight | 33,350.00 | 50,000.00 | 49.9% | Korea; Republic (S. Korea) | LNGEquipment | Young Suk Shin |
| 023160 KS | TK Corp | 023160.KQ | 655.5 | 13.3 | Equal-Weight | 35,500.00 | 48,000.00 | 35.2% | Korea; Republic (S. Korea) | LNGEquipment | Young Suk Shin |
| Shipping and Shipyards | |||||||||||
| 009540 KS | HDKorea Shipbuilding &Offshore Engineering | CoLtd009540.KS | 22,303.0 | 69.6 | Not Covered | 311.08 | NA | NA | Korea; Republic (S. Korea) | LNGCarrier Shipbuilding | Not Covered |
| 012450 KS | Hanwha Aerospace | 012450.KS | 44,917.4 | 261.8 | Overweight | 1,249,000.00 | 1,800,000.00 | 44.1% | Korea; Republic (S. Korea) | LNGCarrier Shipbuilding | Joon Seok |
| 028260 KP | SamsungC&T | 028260.KS | 47,859.2 | 111.4 | Overweight | 370,500.00 | 340,000.00 | -8.2% | Korea; Republic (S. Korea) | LNGCarrier Shipbuilding | HeewonChoi |
| 010140 KS | Samsung Heavy Industries CoLtd* | 010140.KS | 18,746.5 | 130.5 | Not Covered | 21.03 | NA | NA | Korea; Republic (S. Korea) | LNGCarrier Shipbuilding | Not Covered |
| 329180 KS | HDHyundai Heavy Industries CoLtd* | 329180.KS | 50,345.0 | 158.8 | Not Covered | 473.48 | NA | NA | Korea; Republic (S. Korea) | LNGCarrier Shipbuilding | Not Covered |
| YZJ SP | Yangzijiang Shipbuilding (Holdings) Ltd* | YAZG.SI | 12,344.8 | 69.2 | Not Covered | 3.11 | NA | NA | China | LNGCarrier Shipbuilding | Not Covered |
| 1138HK | COSCOSHIPPINGEnergy Transportation | 1138.HK | 3,117.2 | 101.9 | Overweight | 18.55HKD | 26.00HKD | 40.2% | China | Tankers | Qianlei Fan |
| 601872CG | China Merchants Energy Shipping Co. Ltd. | 601872.SS | 21,140.6 | 531.3 | Overweight | 17.73 | 25.10 | 41.6% | China | Tankers | Qianlei Fan |
| 9104 JT | Mitsui O.S.K. Lines | 9104.T | 13,502.9 | 223.1 | Underweight | 5,846.00 | 3,580.00 | -38.8% | Japan | Tankers | Takuya Osaka |
| Energy &CommodityTraders | |||||||||||
| 8001 JT | Itochu | 8001.T | 103,165.1 | 204.4 | Overweight | 1,935.00 | 2,400.00 | 24.0% | Japan | Energy Trading | Yu Shirakawa |
| 8031 JT | Mitsui &Co. | 8031.T | 106,960.2 | 304.2 | Overweight | 5,804.00 | 5,500.00 | -5.2% | Japan | Energy Trading | Yu Shirakawa |
| 8002 JT | Marubeni | 8002.T | 61,417.1 | 196.4 | Equal-Weight | 5,374.00 | 5,000.00 | -7.0% | Japan | Energy Trading | Yu Shirakawa |
| 8058 JT | Mitsubishi Corp. | 8058.T | 129,854.3 | 404.7 | Equal-Weight | 5,436.00 | 5,150.00 | -5.3% | Japan | Energy Trading | Yu Shirakawa |
Source: Company data, Refinitiv, Morgan Stanley Research. *non-covered company
camble 100. ve see capacily expans on uum mateu by mula allu ooutheast Aola, wille ullas Unyuly expalloon y'auually slowollu cuou
M
Chemicals: Security Needs Underappreciated
Downstream value chains ( Exhibit 22 ), particularly across petrochemicals, bulk chemicals and fertilizers, appear in our view to be the least insulated from the energy access crisis (as is being currently demonstrated), and will likely see the biggest wave of self sufficiency-focused investments and supply chain realignments. It is interesting that many of these products at a global level in aggregate are oversupplied and should not lead to shortages (particularly on petrochemicals, select bulk chemicals and generic agrochemical intermediates). However, with capacity concentrations in certain countries and feedstock availability challenges like we saw in 1Q26, this could very quickly lead to stresses across supply chains.
10mntpa
Couran. Maraon Ctanlou Doonarah natimatoo
Exhibit 180: We see capacity expansion dominated by India and Southeast Asia, while China's ongoing expansion gradually slows into 2030
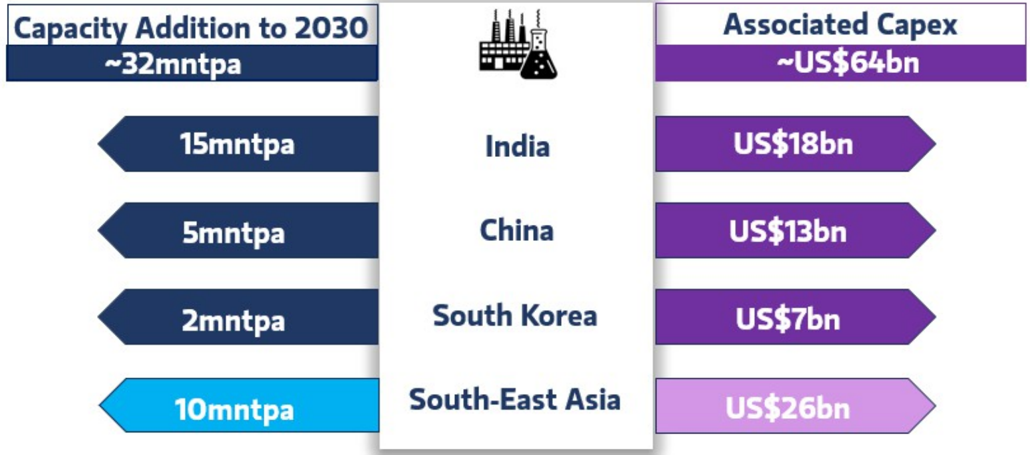
Source: Morgan Stanley Research estimates
While these investments could lead to a new supply glut in five years, as each country ensures self sufficiency across critical products, the ongoing period of access challenges, limited visibility on feedstock sourcing and an extended period of restocking will keep petrochemical and fertilizer prices elevated, likely incentivizing the next leg of investments. Prior to 2026, value chains like polyethylene, polypropylene, polyesters, soda ash, and phenolics among others were digesting a significant wave of new investments seen across China, multiple closures and asset rationalizations in Europe, the Americas and partially in Asia, and a halving of capex intensity across Asian companies ( Exhibit 184 ). We estimate Asia will likely see capacity expansion of >30mntpa, necessitating investments of >US$60bn over 2030 ( Exhibit 180 ).
M
Circularity in Supply Chains Emerging
Across the entire energy value chain, chemicals, fertilizer and industrial gas value chains appear least insulated to external energy shocks in the absence of full backward integration into starting feedstocks. Despite multiple companies being integrated one or two steps below, curtailed access to basic feedstocks like crude, propane and natural gas have led to significant dislocations across multiple petrochemical value chains with implications across multiple downstream industries. We estimate that nearly ~12mntpa of ethylene cracker capacity and an equivalent quantum of downstream capacities across chemical chains have been impacted in Asia, either by way of force majeure or significantly reduced operating rates due to challenges on sourcing gas, propane or naphtha, as well as second derivative effects from limited availability of intermediate chemicals like ammonia, nitric value chain and sulphuric acid derivatives ( Exhibit 189 ).
While government responses have ranged from export controls to reduced import duties and rationing feedstock access, these measures in our view only offer limited respite and will require more structural reforms by way of new capacity investments, diversifying feedstock arrangements and developing storage infrastructure. The tightness seen in petrochemical, agrochemical and select bulk chemical value chains is unlikely to be fully transient (we expect constrained capacities to gradually normalize and filter into lower prices, but will likely settle above 2025 lows to reflect higher operating costs, increased restocking demand, and economies and companies building out more security buffers).
Exhibit 181: Asia: Stacking up the feedstock exposures by region and corporates for chemical producers
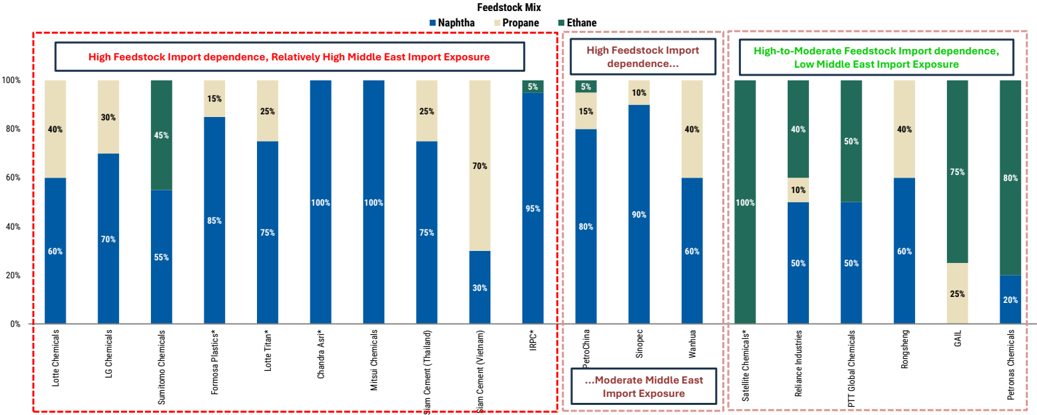
Source: Company data, Morgan Stanley Research
M
Exhibit 182: How Asian and global petrochemical majors are positioned across product chains
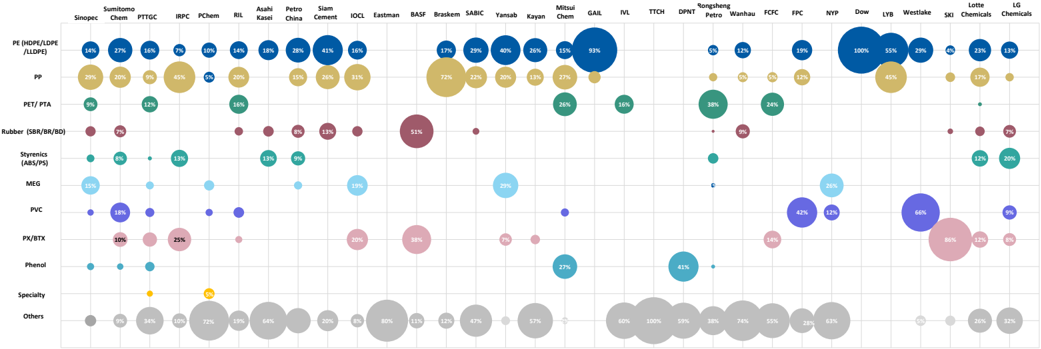
Source: Bloomberg, IHS, Company data
A Chemicals Consolidation Cycle in Asia?
Given the nature of well supplied markets in key chains, companies were significantly cutting back on growth capex across the region prior to 2026 (with capex intensity nearly halving across Asia, a trend which has steadily accelerated since 2024), impairing loss-making or sub-operating assets outside of their core operating strengths where profitability was significantly challenged and pursuing asset divestitures, particularly in non-core chemicals ( Exhibit 183 ). We estimate that investments would continue to significantly decline in 2027 as companies focus on delevering balance sheets, improving cashflows and monetising assets. However, there will be an increased focussed on consolidation in Asia for chemical assets, and regulators and corporates both look to secure supplies but also remaining profitable through cycles.
Exhibit 183: Asian chemicals trade at 1x book, with units below 2002 troughs
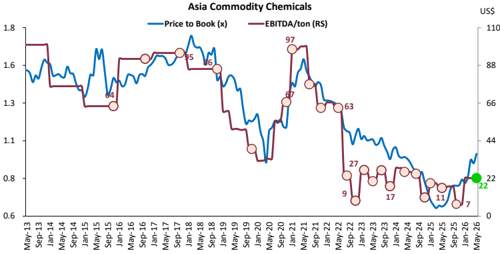
Source: Company data, Refinitiv, Morgan Stanley Research
Exhibit 184: Peak investment cycle is behind us; we expect lower capex intensity to be the new normal
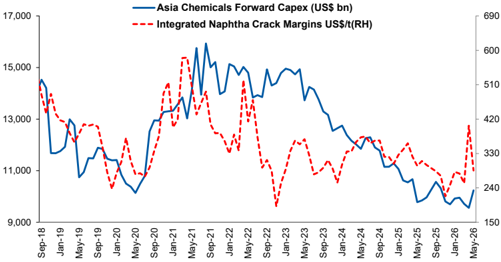
Source: Bloomberg, Company data, Morgan Stanley research
M
What Investments Are Happening in Asia?
Similarly, while China's wave of petrochemical expansion since 2018 is well documented, what is less appreciated is the expansion in China's manufacturing scale in generic agrochemical intermediates, particularly since 2021. China's investments into new pesticide, formulation and technical manufacturing capacity as well as a push for new product registrations both in China and global markets have translated into 500kt of new pesticide capacity, >500kt of formulations and >1.1mnt of intermediate capacity by the end of 2023. With the focus on optimizing fertilizer and crop chemicals consumption, a lot of this capacity is geared to meet world markets ( Exhibit 188 ). In the case of pesticides, the recent wave of generic capacity additions (as envisaged under the 13th Five-Year Plan) has not only underpinned a ~30% increase in pesticide production, but has also led to China's exports now making up >80% of domestic manufacturing (vs. pre-COVID exports making up ~60% of production).
In addition, India is seeing a wave of refrigerant gas capacity expansions, particularly in R-32 (as India is among the handful of countries that can still add new capacity, even as long-term demand fundamentals look attractive). We expect R-32 capacity in India to rise by ~3x by 2026-end (similar to the wave of new investments in China in 2021-23) ( Exhibit 186 ).
After this cycle, we expect the next wave of new investments to happen in the next generation of refrigerant gases, namely hydrofluoroolefins (HFOs) across India and China ( Exhibit 187 ), with companies already committing investments of US$3.5bn (including in value chain) to add 110ktpa of new capacity by 2026-28 (presently, these capacities are present largely in Europe and North America) and we expect Asia's competitiveness as a dependable exporter for these chemicals to steadily increase through the decade. We are increasingly seeing global incumbents partner with Asian players to build HFO supply chains especially in India: Honeywell with Navin Fluorine (NAFL) and Chemours with SRF. NAFL has already commissioned a 40ktpa HFO plant in collaboration with Honeywell in 2025, one of the first such facilities in India, and further debottlenecking could drive incremental capacity. Meanwhile, new entrant Stallion has tied up with Daikin for HFC -32 sourcing and is exploring HFOs, although it has yet to announce any formal partnerships or JV structures.
India could stand out with new investments following consumption growth in petrochemicals
India is expanding petrochemical investments quite significantly to improve self reliance by the end of this decade. India has deployed >US$31bn of new investments over the next seven years across the PE, PP, PTA and PVC value chains to meet India's annual demand growth of 12% over the same period ( Exhibit 185 ). Similarly, to meet increasing needs from the Western hemisphere, specialty chemical companies in India are investing in new multi-purpose capacities, expanding into new chemistries and developing capabilities to cater to contract/custom manufacturing enquires. This also helps domestic security in chemical supply chains of flurochemicals, organic chemicals and specific acids like nitric and sulfuric acids (used in mining).
In our base case, we assume incremental investments of >US$60bn, led by India and to some degree in Southeast Asian countries like Indonesia. We also expect incumbents across Asia to invest in improving feedstock flexibility (across oil, gas and coal), make investments to enhance storage (both raw materials and finished products), and undertake feedstock diversification across multiple supplier countries to ensure adequate buffers.
M
Exhibit 185: PE, PP, PTA and PVC are key petrochemical products seeing capacity additions
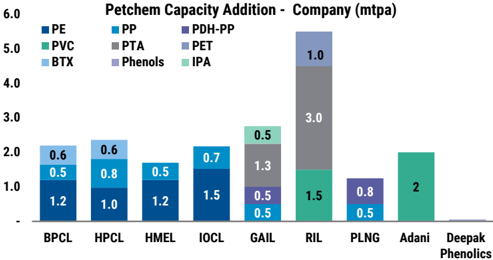
Source: Company data, Morgan Stanley Research.
Exhibit 187: China's announced HFO capacity additions is 4x of India's announced capacity
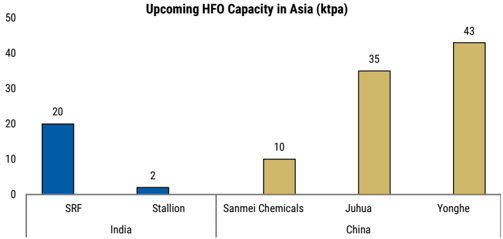
Source: Company data, Morgan Stanley Research
Exhibit 186: We also expect to see refrigerant gas capacity to nearly double by CY27
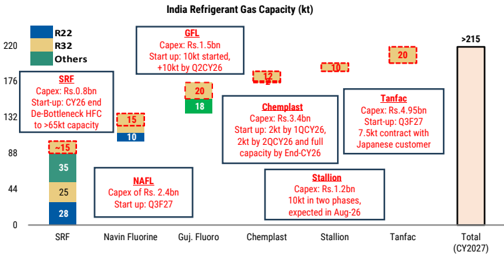
Source: Company data, Morgan Stanley Research.
Exhibit 188: China agrochemicals continues to see significant capacity expansions in generic products
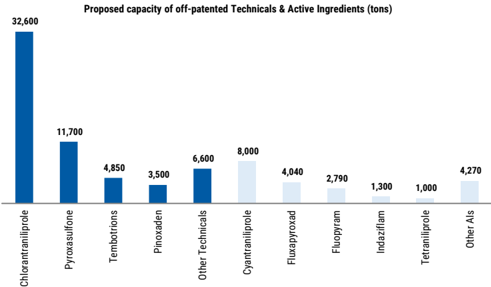
Source: Agropages, Morgan Stanley Research
M
Global Anti-Involution in the Works
Prior to 2026, anti-involution - i.e. addressing excessive and in many cases uneconomic capacity - was already underway, particularly in China and to a degree in South Korea. In addition, numerous countries, particularly in Europe but also Asian companies with European capacity bases, were rationalizing excessive, loss-making capacities, reducing investments or outright exiting business segments due to lack of competitiveness. To that end, we estimate >20mntpa of petrochemical and bulk chemical capacity has been impacted across olefins, phenols, soda ash, PVC, polyurethanes, polyester and chlor-alkali value chains ( Exhibit 189 ).
Exhibit 189: Asian chemical companies have announced restructuring, prolonged turnarounds and permanent closures as a part of their anti-involution drive; we map the value chains below
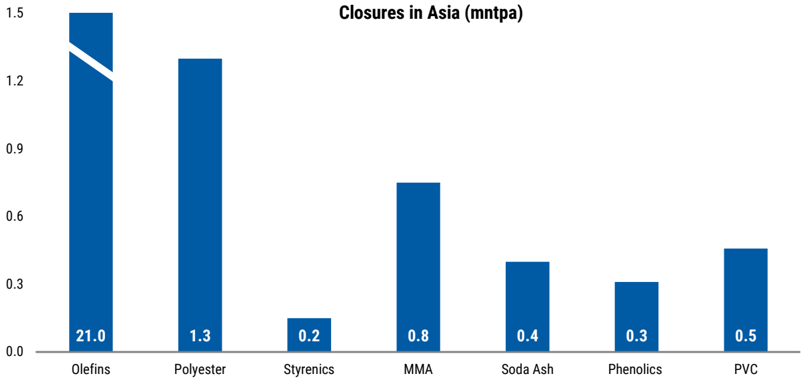
Source: Company data, Morgan Stanley Research
Camble 190. Aola 15 expecteu lo see bopo/oll capex lll the leftlizer value Chlam, lal gely mmogen maters
M
Fertilizers - Food Security in Focus
Food security is converging with energy security as governments recognize fertilizer supply, energy-intensive production, and commodity logistics as strategic vulnerabilities. Ammonia - both a fertilizer input and energy carrier - links food and energy security: disruptions to natural gas supply (ammonia's primary feedstock) or chokepoint closures immediately threaten agricultural output. With energy shocks and freight dislocation, fertilizer prices are witnessing increasing volatility, while testing new highs with each dislocation, despite reasonable oversupply at global scale. South-East Asia
10mntpa
Agrarian countries like India, Thailand and even Australia and New Zealand are net importers of fertilizers while China is a net exporter. Investments in new fertilizer manufacturing capacities are already underway in countries like India, which is poised to increase fertilizer capacity (in particular urea) to increase by 5mnt, while diversifying its import dependence away from the Middle East towards Central and West Asia. We estimate Asian economies will invest US$37bn to put up approximately 23mntpa of incremental production capacities led by India, China, Malaysia, Indonesia and the Philippines seek to lower external dependence, particularly on the Middle East ( Exhibit 190 ).
The key feedstock of fertilizers is natural gas which is imported in all countries that are setting up new capacities. We do not expect this dependence to reduce, however, there should be some diversification of supply sources including the US and Africa.
We think that path to self sufficiency will continue in nitrogen-based fertilizers especially in countries like India and China through major urea expansions and indigenous nutrients. For P&K fertilizers, where resource endowments remain a bottleneck, overseas resource tie-ups and expanded overseas investments will help secure domestic supply. Japan and South Korea have prioritized efficiency, stockpiling, supply-chain diversification and increasing investments in the fertilizer value chain in Africa and Egypt. Southeast Asian economies are increasingly pursuing import substitution through potash mining, ammonia, urea, and NPK capacity additions, while Taiwan has expanded ammonia storage to strengthen supply security. Countries like Australia and the Philippines will see their first indigenous fertilizer plants towards the end of the decade.
The domestic producers for fertilizers in Malaysia and Indonesia benefit from higher urea and ammonia prices as they have access to cheaper domestic feedstock, while certain other high cost exporters will see some competition in Asia as domestic capacity fulfills consumption locally, especially in India.
Exhibit 190: Asia is expected to see US$37bn capex in the fertilizer value chain, largely in nitrogen nutrients
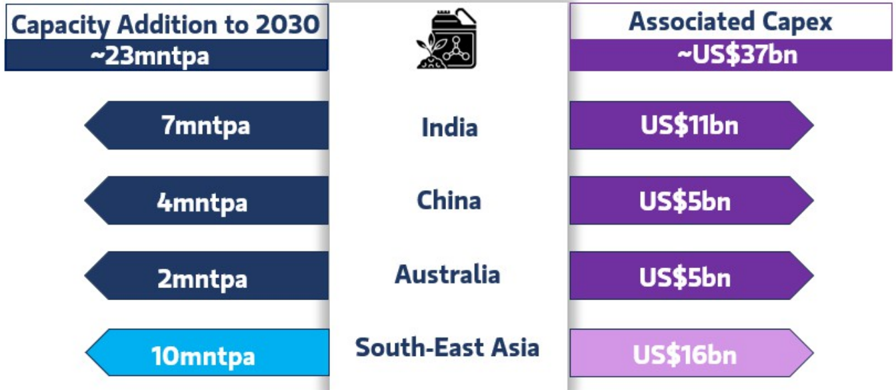
Source: Morgan Stanley Research estimates
M
Why is Fertilizer Supply to Asia Important?
The backdrop on fertilizers is also fairly unique in that while global markets are well supplied on N, P, K, the distribution of capacities is quite concentrated in places abundant with natural resources such as gas, phosphate rock among others (particularly in Central and West Asia), creating regional imbalances and periods of significantly elevated prices (particularly in South Asia, which relies heavily on imports) when the flow of goods is impacted.
Global fertilizer markets are structurally well supplied, with capacity growth consistently outpacing demand across nitrogen, phosphate and potash. By the late 2020s, global nitrogen capacity (on a nutrient basis) is projected to approach ~200mnt (vs. demand ~120mnt), phosphate capacity ~65+mnt (vs. demand ~35-40mnt), and potash capacity 60+mnt (vs. demand ~45-47mnt), implying persistent surplus capacity and utilization rates generally in the 55-70% range ( Exhibit 191 and Exhibit 192 ). This reflects continued investments in
Exhibit 191: Global fertilizer demand trends have been relatively inelastic, growing at 1.5-2% p.a...
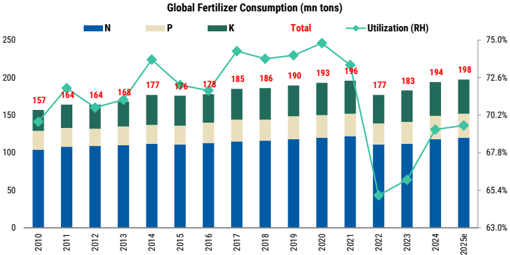
Source: FAOSTAT, IFA, Morgan Stanley research. Note: Volumes expressed in nutrient metric tonnes. Nutrient tonnes reflect the N, P2O5 and K2O content of nitrogen, phosphate and potash fertilizers respectively low-cost production regions such as the Middle East, North America and parts of Eastern Europe, alongside incremental additions in Africa and Southeast Asia.
However, despite this apparent global adequacy, many Asian economies remain structurally dependent on imports due to limited domestic resource endowments - particularly for potash and phosphate - and constraints around feedstock availability for nitrogen. Major agricultural demand centers such as India, China (for certain nutrients), and Southeast Asia collectively account for a disproportionate share of global import demand, relying heavily on exports from a concentrated group of suppliers including Canada (potash), Morocco (phosphates), and Russia/Belarus/Middle East producers (across nutrients) ( Exhibit 195 ). As a result, fertilizer availability in Asia is less a function of global capacity sufficiency and more exposed to trade flows, geopolitics and export policies, reinforcing the region's vulnerability to supply disruptions despite an overall balanced-to-long global market ( Exhibit 194 ).
Exhibit 192: ...while capacity and footprint expansion, while adequate has been concentrated in few regions driving trade imbalances
Source: FAOSTAT, IFA, Morgan Stanley research, Note: Volumes expressed in nutrient metric tonnes. Nutrient tonnes reflect the N, P2O5 and K2O content of nitrogen, phosphate and potash fertilizers respectively
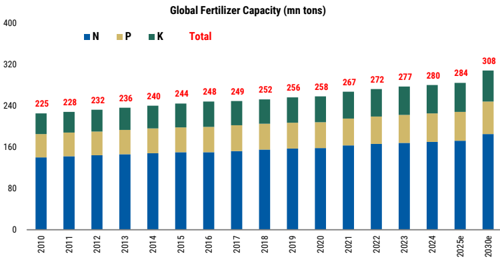
LULt resticleu urea expollo
M
Asia's Self Reliance Remains Low
Nigeria
6%
11%
European
Union
Asia's potash (K) is almost entirely import-dependent in nearly all countries (often 95-100%), phosphates (P) are also heavily importreliant in major agricultural economies like India and much of Southeast Asia (typically 70-90%+), while nitrogen (N) is the only nutrient with partial self-sufficiency, concentrated in a few producers such as China, Indonesia, and Vietnam. Many advanced and smaller
Exhibit 193: Asia's import dependency across key nutrients remains significantly elevated
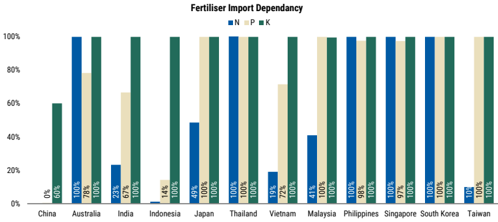
Source: Morgan Stanley Research
Rest of the
World
63%
economies (e.g. Japan, Korea, Australia, the Philippines) remain highly dependent on imported nitrogen as well ( Exhibit 193 ). Crucially, this dependence has persisted despite rising demand and increasing policy focus on food and input security - reflecting structural constraints such as limited domestic resource endowments (especially for potash and phosphate rock), high capital intensity of production, and reliance on globally traded feedstocks like natural gas, phosphate rock and potassium ( Exhibit 197 ).
Exhibit 194: High population and agricultural density countries are largely dependant on Middle Eastern supplies for urea. China in 2024 restricted urea exports
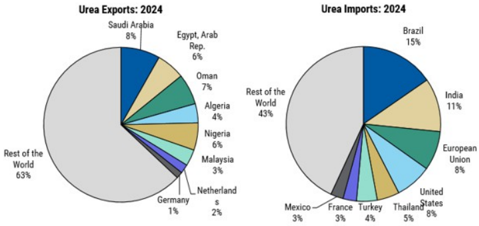
Source: World Integrated Trade Solution, Morgan Stanley Research
Exhibit 195: Middle Eastern countries are the top three exporters of urea, and a key source of supply for a number of Asian economies
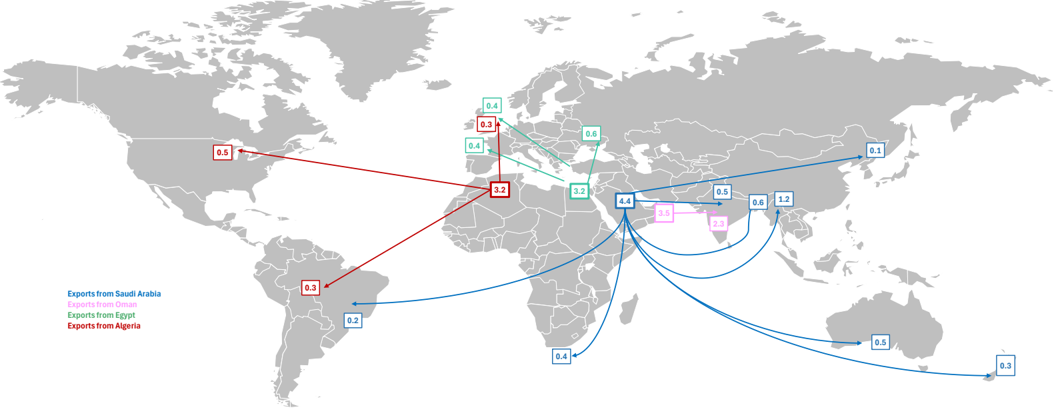
Source: World Integrated Trade Statistics, Morgan Stanley Research
M
Exhibit 196: For most Asian economies, agriculture is a key contributor of GDP
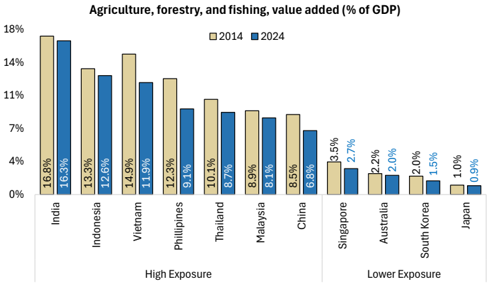
Source: World Bank, Morgan Stanley Research
Exhibit 198: India and China collectively hold 60% of Asia's arable land
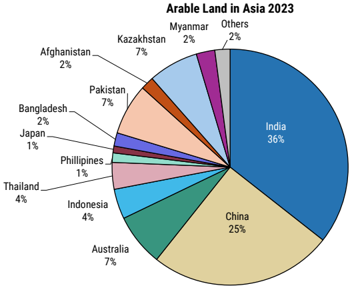
Source: World Bank, Morgan Stanley Research
Exhibit 197: Southeast Asia's capacity across the fertilizer production value chain is limited
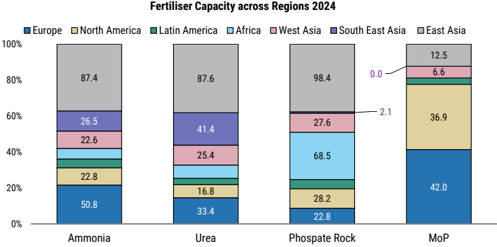
Source: International Fertilizer Association, Morgan Stanley Research
Exhibit 199: Area of arable land has declined in most economies, signifying the rising importance of fertilizers to yields
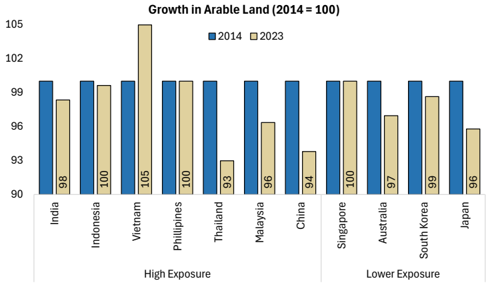
Source: World Bank, Morgan Stanley Research
M
Chemicals and Fertilizers: Key Beneficiaries
Exhibit 200: Chemicals and Fertilizers: Who Benefits?
| BBGTickers | CompanyName | Ticker | Market cap, current,USD (MM) | 3MADTV,USD (MM) | Rating | Share price, last Price Target (Local %Upsidefrom | Share price, last Price Target (Local %Upsidefrom | Share price, last Price Target (Local %Upsidefrom | Country | Sub-Sector | MSAnalyst |
|---|---|---|---|---|---|---|---|---|---|---|---|
| BBGTickers | CompanyName | Ticker | Market cap, current,USD (MM) | 3MADTV,USD (MM) | Rating | close | CCY) | last close | Country | Sub-Sector | MSAnalyst |
| Chemicals &Fertilisers | |||||||||||
| SCCTB | Siam Cement | SCC.BK | 8,446.5 | 43.0 | Overweight | 227.00 | 270.00 | 18.9% | Thailand | Chemicals | Mayank Maheshwari |
| PTTGC TB | PTT Global Chemicals | PTTGC.BK | 5,487.5 | 35.3 | Overweight | 39.25 | 43.00 | 9.6% | Thailand | Chemicals | Mayank Maheshwari |
| PCHEMMK | Petronas Chemicals Group Berhad | PCGB.KL | 11,204.1 | 27.0 | Overweight | 5.49 | 6.24 | 13.7% | Malaysia | Chemicals | Mayank Maheshwari |
| NFIL IS | Navin Fluorine International Ltd. | NAFL.NS | 3,740.0 | 16.0 | Underweight | 6,950.50 | 5,720.00 | -17.7% | India | Chemicals | Vivek Rajamani |
| PI IS | PI Industries Ltd. | PIIL.NS | 4,771.2 | 9.1 | Overweight | 2,997.60 | 3,883.00 | 29.5% | India | Chemicals | Vivek Rajamani |
| SRF IS | SRF Limited | SRFL.NS | 8,462.7 | 17.5 | Underweight | 2,721.20 | 2,209.00 | -18.8% | India | Chemicals | Vivek Rajamani |
| 051910 KP | LGChem | 051910.KS | 18,606.2 | 93.2 | Equal-Weight | 388,500.00 | 430,000.00 | 10.7% | Korea; Republic (S. Korea) | Chemicals | Young Suk Shin |
| 011170 KP | Lotte Chemical Corp | 011170.KS | 2,585.7 | 19.9 | Underweight | 89,100.00 | 78,000.00 | -12.5% | Korea; Republic (S. Korea) | Chemicals | Young Suk Shin |
| 600028CG | China Petroleum &Chemical Corp. | 600028.SS | 74,342.6 | 333.0 | Equal-Weight | 5.20 | 8.00 | 53.8% | China | Chemicals | Jack Lu |
| IVL TB | Indorama Ventures PCL | IVL.BK | 4,195.7 | 26.2 | Overweight | 24.10 | 26.90 | 11.6% | Thailand | Chemicals | Mayank Maheshwari |
| 4183 JT | Mitsui Chemicals | 4183.T | 4,987.9 | 40.4 | Overweight | 1,951.50 | 2,900.00 | 48.6% | Japan | Chemicals | Takato Watabe |
| 8058 JT | Mitsubishi Corp. | 8058.T | 129,854.3 | 404.7 | Equal-Weight | 5,500.00 | 5,150.00 | -6.4% | Japan | Chemicals | Yu Shirakawa |
| FERTIGLBDH | Fertiglobe PLC | FERTIGLB.AD | 7,548.7 | 7.4 | Overweight | 3.34 | 3.80AED | 13.8% | United Arab Emirates | Chemicals | Ricardo Rezende |
| 1301 TT | Formosa Plastics Corp* | 1301.TW | 9,675.5 | 59.4 | Not Covered | 47.65 | NA | NA | Taiwan | Chemicals | NANA |
| 002493CS | Rongsheng Petrochemical CoLtd | 002493.SZ | 19,758.9 | 130.6 | Equal-Weight | 13.44 | 10.60 | -21.1% | China | Chemicals | Jack Lu |
| 600309CG | Wanhua Chemical | 600309.SS | 38,373.0 | 483.8 | Overweight | 83.29 | 101.00 | 21.3% | China | Chemicals | Kaylee Xu |
| LYBUN | LyondellBasell Industries N.V. | LYB.N | 25,099.7 | 136.3 | Overweight | 73.27 | 77.00 | 5.1% | United Kingdom | Chemicals | Vincent Andrews |
| DOWUN | DowInc. | DOW.N | 29,406.3 | 121.6 | Equal-Weight | 40.80 | 41.00 | 0.5% | United States of America | Chemicals | Vincent Andrews |
| LINUS | Linde PLC | LIN.O | 232,962.9 | 1205.8 | Overweight | 503.87 | 530.00 | 5.2% | United Kingdom | Gases | Vincent Andrews |
| AI FP | Air Liquide | AIRP.PA | 119,862.7 | 202.2 | Equal-Weight | 175.82 | 168.00 | -4.4% | France | Gases | Thomas Wrigglesworth |
Source: Company data, Refinitiv, Bloomberg, Morgan Stanley Research estimates. *non-covered company
M
BluePaper
Appendix: Equities to Play Powering AI & The Changing Face of Power Markets
Exhibit 201: Changing Face of Power exposed equities
| Rank Company Name | Ticker | Market cap, current, USD (MM) 3M | ADTV, USD (MM) Rating | Share price, last close | Price Target (Local CCY) | %Upside from last close | Geography | Sub-Sector | Key Exposure Thesis | MS Analyst |
|---|---|---|---|---|---|---|---|---|---|---|
| Power Generators | ||||||||||
| 1 NextEra Energy | NEE.N | 198,921 | 234 Overweight | 93.36 | 107.00 | 14.6% | USA | Diversified IPP | Expanding renewable portfolio | David Arcaro |
| 2 Gulf Development | GULF.BK | 27,332 | 99 Overweight | 59.75 | 76.00 | 27.2% | Thailand | Diversified IPP | Integrated DC + generation portfolio | Mayank Maheshwari |
| 3 RWE | RWEG.DE | 52,408 | 77 Overweight | 55.20 | 66.00 | 19.6% | Germany | Diversified IPP | Tight electricity markets rewarding flexibility + value creation in renewables in Europe & US | Robert Pulleyn |
| 4 Adani Power | ADAN.NS | 42,416 | 82 Overweight | 221.33 | 173.00 | -21.8% | India | Thermal Power | Play on India's Energy Security and Transition | Girish Achhipalia |
| 5 Hokkaido Electric Power | 9509.T | 1,384 | 26 Overweight | 980.90 | 2,400.00 | 144.7% | Japan | Integrated Power Utility | The company's service area is cooler hence making Hokkaido an advantageous location for AI datacenters | Reiji Ogino |
| 6 Vistra Corp | VST.N | 53,589 | 156 Overweight | 139.68 | 208.00 | 48.9% | USA | Diversified IPP | Tight electricity markets + Nuclear | David Arcaro |
| 7 JSW Energy | JSWE.NS | 10,379 | 13 Overweight | 515.05 | 624.00 | 21.2% | India | Diversified IPP | Play on India's Energy Security and Transition | Girish Achhipalia |
| 8 Talen Energy | TLN.O | 18,611 | 257 Overweight | 334.24 | 498.00 | 49.0% | USA | Diversified IPP | Tight electricity markets + Nuclear | David Arcaro |
| 9 NTPC | NTPC.NS | 39,953 | 51 Overweight | 395.25 | 403.00 | 2.0% | India | Diversified IPP | Play on India's Energy Security and Transition | Girish Achhipalia |
| 10 Keppel | KPLM.SI | 15,475 | 49 Overweight | 10.60 | 16.00 | 50.9% | Singapore | Diversified IPP | Tight electricity markets as Singapore expands DC capacity | Mayank Maheshwari |
| 11 EDP | EDP.LS | 21,281 | 37 Equal-Weight | 4.28 | 4.60 | 7.6% | Portugal | Diversified IPP | Value creation in EU & US renewables + integrated model adapted to the new more complex power system | Arthur Sitbon |
| 12 Tohoku Electric Power | 9506.T | 3,405 | 19 Overweight | 1,051.50 | 1,540.00 | 46.5% | Japan | Integrated Power Utility | Benefits from cheaper gas cost in gas trading & power generation business | Reiji Ogino |
| 13 AES Corp | AES.N | 10,247 | 33 Equal-Weight | 14.47 | 15.00 | 3.7% | USA | Diversified IPP | Expanding renewable portfolio | David Arcaro |
| 14 DEWA | DEWAA.DU | 37,981 | 6 Equal-Weight | 2.68 | 3.00 | 11.9% | UAE | Integrated Power Utility | Electricity demand growth in Dubai + increased exposure to | Ricardo Rezende |
| 15 CGN | 1816.HK | 4,948 | 35 Equal-Weight | 3.39 HKD | 3.02 HKD | -10.9% | China | Nuclear | renewables Nuclear generator, beneficiary of volume growth | Eva Hou |
| Power 16 China Resources Power | 0836.HK | 13,808 | 34 Equal-Weight | 20.10 | 19.80 | -1.5% | China | Diversified IPP | Baseload + Renewables | Eva Hou |
| Grid Operators | ||||||||||
| 1 SSE | SSE.L | 41,867 | 67 Overweight | 2,271.00 GBp | 2,950.00 GBp | 29.9% | UK | Grid Operator | Transmission infrastructure growth + renewable deployment | Robert Pulleyn |
| 2 Power Grid (India) | PGRD.NS | 29,890 | 47 Equal-Weight | 305.85 | 295.00 | -3.5% | India | Grid Operator | Transmission infrastructure growth in India | Girish Achhipalia |
| 3 Tenaga Nasional | TENA.KL | 21,978 | 25 Overweight | 14.54 | 15.60 | 7.3% | Malaysia | Integrated Power Utility | Single grid operator benefits from power demand + renewables grid capex | Mayank Maheshwari |
| 4 National Grid | NG.L | 86,997 | 122 Overweight | 1,188.00 GBp | 1,480.00 GBp | 24.6% | UK | Grid Operator | Transmission infrastructure growth in UK & US | Sarah Lester |
| 5 Sempra | SRE.N | 61,656 | 107 Overweight | 90.43 | 104.00 | 15.0% | USA | Grid Operator | Transmission infrastructure growth | David Arcaro |
| 6 Iberdrola SA | IBE.MC | 155,945 | 122 Equal-Weight | 19.20 | 20.00 | 4.2% | Spain | Grid Operator | Transmission infrastructure growth + renewable deployment | Robert Pulleyn |
| Gas Players | ||||||||||
| 1 Petrochina | 0857.HK | 29,808 | 228 Overweight | 10.89 HKD | 13.25 HKD | 21.7% | China | Gas Producer | Domestic gas pricing reforms | Jack Lu |
| 2 GAIL | GAIL.NS | 11,062 | 22 Equal-Weight | 162.13 | 150.00 | -7.5% | India | Gas Transmission | Integrated Gas Player | Mayank Maheshwari |
| 3 Cheniere Energy Inc | LNG.N | 51,196 | 175 Overweight | 241.84 | 308.00 | 27.4% | USA | LNG Export | LNG Export Demand | Devin McDermott |
| 4 EQT Corp | EQT.N | 34,983 | 100 Overweight | 56.22 | 74.00 | 31.6% | USA | Gas Producer | LNG Export Demand | Devin McDermott |
| 5 ADNOC Gas | ADNOCGAS.AD | 71,467 | 24 Overweight | 3.28 AED | 4.20 AED | 28.0% | UAE | Gas Processing + | Domestic gas demand in the UAE + LPG/LNG exports | Ricardo Rezende |
| 6 PTT Group | PTT.BK | 32,770 | 119 Equal-Weight | 36.25 | 39.80 | 9.8% | Thailand | LNG/LPG Export Integrated Energy | Integrated Gas Player | Mayank Maheshwari |
| Grid Equipment | ||||||||||
| 1 CATL | 300750.SZ | 281,513 | 1,498 Overweight | 423.60 | 595.00 | 40.5% | China | Battery Energy Storage | Higher renewable curtailments require more storage | Jack Lu |
| 2 Schneider Electric | SCHN.PA | 180,395 | 311 Overweight | 263.75 | 300.00 | 13.7% | France | Power Grid Equipment | Power demand growth requires grid hardening capex | Max Yates |
| 3 NARI Tech | 600406.SS | 31,797 | 405 Overweight | 26.48 | 32.25 | 21.8% | China | Power Grid Equipment | Power demand growth requires grid hardening capex | Eva Hou |
| 4 HD Hyundai Electric | 267260.KS | 32,012 | 119 Overweight | 1,179,000.00 | 1,500,000.00 | 27.2% | S. Korea | Power Grid Equipment | Power demand growth requires grid hardening capex | Ryan Kim |
| 5 Polycab India | POLC.NS | 14,251 | 45 Overweight | 9,152.50 | 8,707.00 | -4.9% | India | Wires and cables | Targets 10% export exposure by F26 | Girish Achhipalia |
| 6 Ningbo Orient Wires & Cables | 603606.SS | 6,258 | 101 Overweight | 58.66 | 73.32 | 25.0% | China | Wires and cables | Targets 10% export exposure by F26 | Eva Hou |
| 7 Pinggao Electric Equipment | 600312.SS | 4,501 | 109 Overweight | 21.59 | 27.85 | 29.0% | China | Power Grid Equipment | Power demand growth requires grid hardening capex | Eva Hou |
| Gas/Nuclear Power 1 GE Vernova | GEV.N | 288,062 | 470 Overweight | 1,049.23 | 1,250.00 | 19.1% | USA | Gas Turbines | Higher demand for gas baseload drives turbine sales | David Arcaro |
| 2 Siemens Energy | ENR1n.DE | 171,289 | 502 Overweight | 169.54 | 200.00 | 18.0% | Germany | Gas Turbines | Higher demand for gas baseload drives turbine sales | Max Yates |
| Mitsubishi Heavy | 7011.T | 92,042 | 744 NA | 4,080.00 | NA | NA | Japan | Gas Turbines | Higher demand for gas baseload drives turbine sales | Takeshi Kitaura |
| 3 3 Doosan Enerbility | 034020.KS | 54,583 | 382 Overweight | 110,800.00 | 110,000.00 | -0.7% | Korea | Nuclear Equipment | Nuclear Renaissance | Heewon Choi |
| Renewable Equipment | ||||||||||
| 1 Bloom Energy | BE.N | 83,982 | 198 Overweight | 275.95 | 310.00 | 12.3% | USA | Fuel Cells | Powering AI drives demand for faster time to power | David Arcaro |
| 2 Reliance Industries | RELI.NS | 193,667 | 284 Overweight | 1,336.40 | 1,803.00 | 34.9% | India | Solar Module | New Energy equipment manufacturing ramps up | Mayank Maheshwari |
| 1 Hoyuan | 603185.SS | 2,172 | 85 NA | NA | NA | NA | NA | Solar Module | Solid execution weighed down by vertical integration | NA NA |
| 2 Longi | 601012.SS | 18,625 | 463 Underweight | 15.60 | 14.01 | -10.2% | China | Solar Module | We expect consistently low unit gross profit due to oversupply | Eva Hou |
| 3 Tongwei | 600438.SS | 11,257 | 144 Equal-Weight | 16.25 | 21.85 | 34.5% | China | Solar Module | EW; await opportunity when poly prices recover | Eva Hou |
| Goldwind | 2208.HK | 1,654 | 67 | HKD | HKD | 13.6% | China | Wind | Eva Hou | |
| 4 | Equal-Weight | 14.73 | 16.74 | Remain EW on ongoing WTG GPM pressure | ||||||
| 5 JA Solar 6 Consolidated Edison | 002459.SZ ED.N | 5,416 40,213 | 132 Equal-Weight 65 Underweight | 10.37 105.36 | 13.98 105.00 | 34.8% -0.3% | China USA | Solar Module Integrated | Margin pressure during industry downcycle Below-average earnings growth vs peers | Eva Hou David Arcaro |
| 7 Vestas | VWS.CO | 29,856 | 71 | 190.90 DKK | 190.00 DKK | -0.5% | Denmark | Wind | Dominant Wind Turbine Manufacturer, Demanding | Max Yates |
| Equal-Weight | Valuations |
Source: Refinitiv, Morgan Stanley Research Estimates, priced on 18 May 2026.
For important disclosures regarding companies that are the subject of this screen, please see the Morgan Stanley Research Disclosure Website at www.morganstanley.com/researchdisclosures.
M
Exhibit 202: Powering AI-Exposed Equities
| BBG Tickers | Company Name | Ticker | Market cap, current, USD (MM) 3M ADTV, USD (MM) | Rating | Share price, last close | Price Target (Local CCY) | %Upside from last close | Country | Sub-Sector | Key Exposure Thesis | MS Analyst |
|---|---|---|---|---|---|---|---|---|---|---|---|
| Exposed to Powering AI Grid Operators | Thematic | 29.0% | |||||||||
| TNB MK | Tenaga Nasional | TENA.KL | 21,822 | 25 Overweight | 14.54 | 15.60 7.3% | Malaysia | Grid Operator | Single grid operator benefits from doubling power demand | Mayank Maheshwari | |
| 015760 KP | Korea Electric Power | 015760.KS | 17,520 | 94 Equal-Weight | 38,750.00 | 50,000.00 29.0% | S. Korea | Grid Operator | Higher power demand and grid upgrades drive returns | Young Suk Shin | |
| Power Generators | 18.3% | ||||||||||
| 9509 JP | Hokkaido Electric Power | 9509.T | 1,365 | 25 Overweight | 980.90 | 2,400.00 | 144.7% | Japan | Integrated Power Utility | The company's service area is cooler hence making Hokkaido an advantageous location for AI datacenters | Reiji Ogino |
| SCI SP | Sembcorp Industries | SCIL.SI | 8,786 | 33 Overweight | 6.13 | 7.50 | 22.3% | Singapore | Hybrid Power | Tight electricity markets as Singapore expands DC capacity | Mayank Maheshwari |
| KEP SP | Keppel | KPLM.SI | 15,591 | 49 Overweight | 10.60 | 16.00 | 50.9% | Singapore | Hybrid Power | Tight electricity markets as Singapore expands DC capacity | Mayank Maheshwari |
| GULF TB | Gulf Development | GULF.BK | 27,256 | 98 Overweight | 59.75 | 76.00 | 27.2% | Thailand | Hybrid Power | Integrated DC + generation portfolio | Mayank Maheshwari |
| AGL AU | AGL Energy | AGL.AX | 4,539 | 19 Underweight | 9.09 | 9.28 | 2.1% | Australia | Integrated utility | Leverage to power prices and renewable development | Rob Koh |
| 1816 HK | CGN Power | 1816.HK | 4,919 | 35 Equal-Weight | 3.39 HKD | 3.02 HKD | -10.9% | China | Nuclear | Increased power demand from datacenters | Eva Hou |
| 836 HK | China Resources Power | 0836.HK | 13,649 | 35 Equal-Weight | 20.10 | 19.80 | -1.5% | China | Hybrid Power | Increased Clean power demand from datacenters | Eva Hou |
| Gas Pipelines | -19.0% | ||||||||||
| GAIL IS | GAIL | GAIL.NS | 11,228 | 22 Equal-Weight | 162.13 | 150.00 | -7.5% | India | Gas Pipelines | Integrated Gas Player | Mayank Maheshwari |
| 9531 JT | Tokyo Gas | 9531.T | 14,041 | 60 Equal-Weight | 6,722.00 | 5,290.00 -21.3% | Japan | Gas Pipelines | Integrated Gas Player | Reiji Ogino | |
| 9532 JP | Osaka Gas | 9532.T | 14,564 | 47 Equal-Weight | 5,732.00 | 4,110.00 | -28.3% | Japan | Gas Pipelines | Integrated Gas Player | Reiji Ogino |
| Data Center Operators | 21.5% | ||||||||||
| 018260 KP | Samsung SDS | 018260.KS | 8,958 | 24 Overweight | 189,000.00 | 250,000.00 | 32.3% | S. Korea | Data Centers | AI data center build outs driving longer term growth and higher margins | Seyon Park |
| NXT AU | NEXTDC | NXT.AX | 5,802 | 18 | Overweight 14.87 | 18.00 | 21.0% | Australia | Data Centers | Early DCs have >20% IRR, but higher land/development costs point to 10-12% ahead. | Andrew McLeod |
| ST SP | Singapore Telecom | STEL.SI | 60,237 | 75 | Overweight 4.82 | 5.50 | 14.1% | Singapore | Data Centers | STEL's connectivity, power partnerships, and access to Nvidia's GPUs are key advantages to epand its AI DC footprint | Da Wei Lee |
| GMG AU | Goodman Group | GMG.AX | 43,671 | 67 Overweight | 31.38 | 36.15 | 15.2% | Australia | Data Centers | Global DC 3.9GW DC pipeline of secured power, plus ~1-2GW in procurement. Est A$40bn+ end product at 50%+ margins | Simon Chan |
| MAQ AU | Macquarie Technology | MAQ.AX | 1,229 | 2 Overweight | 76.10 | 82.00 | 7.8% | Australia | Data Centers | High quality portfolio + an attractive pipeline of future DC re- investment opportunities | Andrew McLeod |
| KDCREIT SP | Keppel DC REIT | KEPE.SI | 4,375 | 16 Equal-Weight | 2.29 | 2.30 | 0.4% | Singapore | Data Centers | Pure-play DC REIT | Derek Chang |
| 1686 HK | SUNeVision | 1686.HK | 1,831 | 9 Overweight | 6.75 | 9.00 | 33.3% | Hong Kong | Data Centers | Leading position in Hong Kong IDC market | Tom Tang |
| VNET US | VNET Group | VNET.O | 2,938 | 43 Overweight | 10.09 USD | 58.6% | China | Data Centers | China data center demand growth | Tom Tang | |
| Equipment Manufacturers | 16.00 USD | 17.9% | |||||||||
| Mitusbishi Heavy | 7011.T | 94,311 | 745 Overweight | 4,080.00 | 5,500.00 | 34.8% | Japan | Gas Turbines | Higher demand for gas baseload drives turbine sales | Takeshi Kitaura | |
| Hitachi | 6501.T | 136,691 | 479 Equal-Weight | 4,812.00 | 5,200.00 | 8.1% | Japan | Power Grid Systems | Overseas sales of power grid systems | Kazuo Yoshikawa | |
| 2308 TT | Delta Electronics | 2308.TW | 96,568 | 397 Overweight | 2,075.00 | 2,700.00 | 30.1% | Taiwan | Power Electronics | Key vendor of power electronics (~62% of total revenue) that improves electrical efficiency of data centers | Sharon Shih |
| 3750 HK | CATL | 3750.HK | 18,767 | 334 Overweight | 680.00 HKD | 815.00 HKD | 19.9% | China | Battery Energy Storage | DCs drive faster BESS adoption | Jack Lu |
| POLYCAB IS | Polycab India | POLC.NS | 13,992 | 46 | Overweight 9,152.50 | 8,707.00 | -4.9% | India | Wires and cables | Targets 10% export exposure by F26 | Girish Achhipalia |
| 600406 CG | NARI Tech | 600406.SS | 33,135 | 420 Overweight | 26.48 | 32.25 | 21.8% | China | Power Grid Equipment | Power demand growth requires grid hardening capex | Eva Hou |
| XJ Electric | 000400.SZ | 4,154 | 158 Equal-Weight | 26.36 | 32.18 | 22.1% | China | Power Grid Equipment | Power demand growth requires grid hardening capex | Eva Hou | |
| 600312 CG | Pinggao Electric | 600312.SS | 4,685 | 110 | Overweight | 27.85 | 29.0% | China | Power Grid Equipment | demand growth requires grid hardening | Eva Hou |
| 000400 CS | 120 Overweight | 21.59 | 1,500,000.00 | 27.2% | S. Korea | Power Grid Equipment | Power capex Power demand growth requires grid hardening capex | Ryan Kim | |||
| 267260 KS 010120 KS | HD Hyundai Electric LS Electric | 267260.KS 010120.KS | 30,901 28,630 | 145 Overweight | 1,179,000.00 259,000.00 | 240,000.00 | -7.3% | S. Korea | Power Grid Equipment | Power demand growth requires grid hardening capex | Ryan Kim |
| Integrated Energy | 22.1% | ||||||||||
| PTT TB | PTT Group | PTT.BK | 32,679 | 119 Equal-Weight | 36.25 | 39.80 9.8% | Thailand | Integrated Energy | Integrated Energy | Mayank Maheshwari | |
| RIL IS | Reliance Industries | RELI.NS | 192,283 | 285 Overweight | 1,336.40 | 1,803.00 34.9% | India | Integrated Energy | Integrated Energy + expansion in new energy and AI DCs | Mayank Maheshwari | |
| 857 HK | PetroChina | 0857.HK | 29,803 | 228 Overweight | 10.89 HKD | 13.25 HKD | 21.7% | China | Integrated Energy | Integrated Gas Player | Jack Lu |
| Liquid Cooling | 15.8% | ||||||||||
| 3017 TT | AVC | 3017.TW | 18,419 | 277 Overweight | 2,455.00 | 3,333.00 | 35.8% | Taiwan | Liquid Cooling | Liquid Cooling Exposure | Sharon Shih |
| 3324 TT | Auras | 3324.TWO | 2,730 | 96 Equal-Weight | 995.00 | 1,025.00 | 3.0% | Taiwan | Liquid Cooling | Liquid Cooling Exposure | Sharon Shih |
| 002837 CH | Envicool | 002837.SZ | 14,470 | 670 Overweight | 100.49 | 118.00 | 17.4% | China | Liquid Cooling | Liquid Cooling Exposure | Chelsea Wang |
| 000977 CS | Inspur Electronic Information | 000977.SZ | 12,864 | 438 Equal-Weight | 70.21 | 75.00 | 6.8% | China | Liquid Cooling | Liquid Cooling Exposure | Howard Kao |
Source: Refinitiv, Morgan Stanley Research Estimates, priced on 18 May 2026.
For important disclosures regarding companies that are the subject of this screen, please see the Morgan Stanley Research Disclosure Website at www.morganstanley.com/researchdisclosures.
This report references U.S. Executive Order 14032 and/or entities or securities that are designated thereunder. U.S. persons may be prohibited from buying certain securities of entities named in this report. Readers are solely responsible for ensuring that their investment activities are carried out in compliance with applicable laws.
This report references export controls and/or entities that may be subject to export control restrictions. Readers are solely responsible for ensuring that their investment or trade activities are carried out in compliance with applicable laws.
This report references U.S. Executive Order 14105 and/or entities that may be in scope of such order. U.S. persons may be prohibited from engaging in certain transactions or otherwise require certain other transactions be notified to the U.S. Department of Treasury. Readers are solely responsible for ensuring that their investment or trade activities are carried out in compliance with applicable laws.
This report references jurisdiction(s) or person(s) which may be the subject of economic sanctions. Readers are solely responsible for ensuring that their investment activities are carried out in compliance with applicable laws.
M
Disclosure Section
The information and opinions in Morgan Stanley Research were prepared or are disseminated by Morgan Stanley & Co. LLC and/or Morgan Stanley C.T.V.M. S.A. and/or Morgan Stanley México, Casa de Bolsa, S.A. de C.V. and/or Morgan Stanley Canada Limited and/or Morgan Stanley & Co. International plc and/or Morgan Stanley Europe S.E. and/or RMB Morgan Stanley Proprietary Limited and/or Morgan Stanley MUFG Securities Co., Ltd. and/or Morgan Stanley Capital Group Japan Co., Ltd. and/or Morgan Stanley Asia Limited and/or Morgan Stanley Asia (Singapore) Pte. (Registration number 199206298Z) and/or Morgan Stanley Asia (Singapore) Securities Pte Ltd (Registration number 200008434H), regulated by the Monetary Authority of Singapore (which accepts legal responsibility for its contents and should be contacted with respect to any matters arising from, or in connection with, Morgan Stanley Research) and/or Morgan Stanley Taiwan Limited and/or Morgan Stanley & Co International plc, Seoul Branch, and/or Morgan Stanley Australia Limited (A.B.N. 67 003 734 576, holder of Australian financial services license No. 233742, which accepts responsibility for its contents), and/or Morgan Stanley Wealth Management Australia Pty Ltd (A.B.N. 19 009 145 555, holder of Australian financial services license No. 240813, which accepts responsibility for its contents), and/or Morgan Stanley India Company Private Limited having Corporate Identification No (CIN) U22990MH1998PTC115305, regulated by the Securities and Exchange Board of India ('SEBI') and holder of licenses as a Research Analyst (SEBI Registration No. INH000001105), Stock Broker (SEBI Stock Broker Registration No. INZ000244438), Merchant Banker (SEBI Registration No. INM000011203), and depository participant with National Securities Depository Limited (SEBI Registration No. IN-DP-NSDL-567-2021) having registered office at Altimus, Level 39 & 40, Pandurang Budhkar Marg, Worli, Mumbai 400018, India; Telephone no. +91-22-61181000; Compliance Officer Details: Mr. Tejarshi Hardas, Tel. No.: +91-22-61181000 or Email: tejarshi.hardas@morganstanley.com; Grievance officer details: Mr. Tejarshi Hardas, Tel. No.: +91-22-61181000 or Email: msic-compliance@morganstanley.com which accepts the responsibility for its contents and should be contacted with respect to any matters arising from, or in connection with, Morgan Stanley Research, and their affiliates (collectively, "Morgan Stanley"). Morgan Stanley India Company Private Limited (MSICPL) may use AI tools in providing research services. All recommendations contained herein are made by the duly qualified research analysts.
For important disclosures, stock price charts and equity rating histories regarding companies that are the subject of this report, please see the Morgan Stanley Research Disclosure Website at www.morganstanley.com/eqr/disclosures/webapp/generalresearch, or contact your investment representative or Morgan Stanley Research at 1585 Broadway, (Attention: Research Management), New York, NY, 10036 USA.
For valuation methodology and risks associated with any recommendation, rating or price target referenced in this research report, please contact the Client Support Team as follows: US/Canada +1 800 303-2495; Hong Kong +852 2848-5999; Latin America +1 718 754-5444 (U.S.); London +44 (0)20-7425-8169; Singapore +65 6834-6860; Sydney +61 (0)2-9770-1505; Tokyo +81 (0)3-6836-9000. Alternatively you may contact your investment representative or Morgan Stanley Research at 1585 Broadway, (Attention: Research Management), New York, NY 10036 USA.
圖片清單(已驗證 2026-07-02)
回補驗證:僅涵蓋已被 lib 頁嵌入的圖片,非全量驗證。
| 檔名 | size | 分類 | 親眼所見內容 |
|---|---|---|---|
報告_MS_能源算力Supercycle_20260521_015.png |
22KB | 真資料圖 | 瀑布圖,標題「Total Gas turbine + Primary engine + Fuel cell Supply (GW)」,橫軸列出 GEV、GEV Aeroderiv、SIE Energy、Mitsubishi、Baker Hughes、Doosan Enertility、CAT Solar Turbine、Others、Total 2028 GT Supply、Total GT 2030 Supply、ITAI + Boom、Engines for DCs (Primary)、Bloom Energy、Total all of 2030 supply,各柱標示 GW 數值,縱軸 0-120 |
報告_MS_能源算力Supercycle_20260521_091.png |
81KB | 真資料圖 | 長條圖,標題「Grid equipment delivery lead times by component, Q2 2024」,橫軸為 GSU Transformers、Power Transformers、HV Circuit Breakers、Pad-Mount Transformers - 3 Phase、Pad-Mount Transformers - 1 Phase、Pole-Mount Transformers、Wire & Cable,每柱標示 Max/Avg/Min 數值,右上圖例為 3rd Quartile/Average/1st Quartile |