PDF 原檔:報告_MS_聯發科2454_20260927_original.pdf
圖片清單(已驗證 2026-09-29)
ingest 時建立的「眼見為憑」圖片索引,是 lib/ 嵌圖的唯一真相來源;<40KB 未列者預設 logo/小圖表,008(13KB)未 Read。
| 檔名 | size | 分類 | 親眼所見內容 |
|---|---|---|---|
報告_MS_聯發科2454_20260927_001.png |
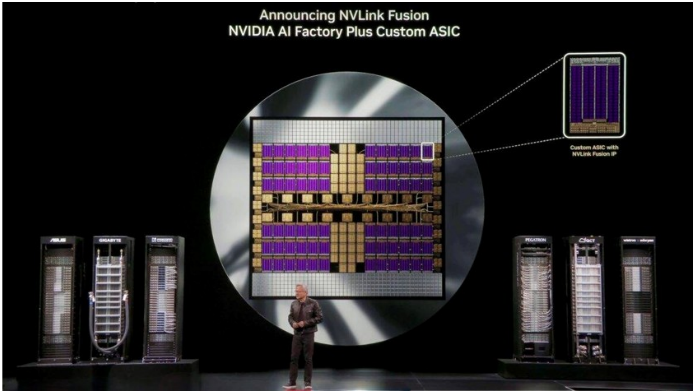
239KB | 真資料圖 | Nvidia 發表會投影片「Announcing NVLink Fusion — NVIDIA AI Factory Plus Custom ASIC」:圓形晶圓內為含多顆紫色運算區塊的客製 ASIC 版圖,右上放大標示「Custom ASIC with NVLink Fusion IP」,左右各三座機架(含 ASUS/GIGABYTE/Pegatron/Quanta 等標示)(報告 Exhibit 2,來源 Nvidia) |
報告_MS_聯發科2454_20260927_003.png |
249KB | 真資料圖 | 「CoWoS Enables AI Compute Scaling」:縱軸 Interposer Size、橫軸 2016-2027,CoWoS-S 由 1.5-reticle 至 3.3-reticle、CoWoS-R 1.4-reticle、CoWoS-L/R 由 3.3-reticle 經 5.5-reticle 至 9.7-reticle(2027),右側附 SoC+HBM 與 SoIC+HBM+IO 封裝示意;1 reticle ~830mm²(報告 Exhibit 5,來源 Winway/TSMC) |
報告_MS_聯發科2454_20260927_005.png |
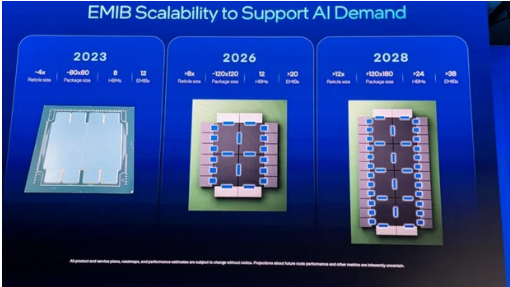
168KB | 真資料圖 | Intel「EMIB Scalability to Support AI Demand」:2023/2026/2028 三欄,Reticle size 約 4x/>8x/>12x,Package size 約 ~80x80/~120x120/~120x180,HBM 數 8/12/>24,EMIB 數 12/>20/>38,附各年封裝俯視示意(報告 Exhibit 7,來源 Intel) |
報告_MS_聯發科2454_20260927_006.png |
60KB | 真資料圖 | 聯發科一年期預期本益比走勢圖 2006-2026:平均 18x、+1SD 23x、-1SD 12x,2026 年急升至約 36-40x(報告 Exhibit 11,財務估值類) |
報告_MS_聯發科2454_20260927_010.png |
60KB | 真資料圖 | 聯發科股價(藍線)與 MS 目標價沿革(紅虛線)2023-09 至 2026-09,目標價末段標示 2088、2588、2988、5088、5588,股價收於約 5,300(財務股價類) |
報告_MS_聯發科2454_20260927_007.png |
39KB | 真資料圖 | Risk-reward 圖:現價 NT$5,285,12 個月後情境 bull NT$8,500(+60.83%)/base NT$6,188(+17.09%)/bear NT$3,150(-40.40%),選擇權隱含機率 >8,500 約 5.7%、>6,188 約 26.1%、<3,150 約 17.6%(財務股價類) |
報告_MS_聯發科2454_20260927_002.png |
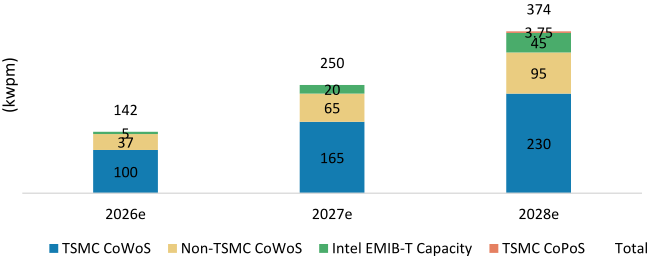
21KB | 真資料圖 | 堆疊長條「Total 2.5D packaging capacity」單位 kwpm:2026e 總 142(TSMC CoWoS 100、Non-TSMC CoWoS 37、Intel EMIB-T 5)/2027e 總 250(165/65/20)/2028e 總 374(230/95/45,另有 TSMC CoPoS 3.75)(報告 Exhibit 4) |
報告_MS_聯發科2454_20260927_004.png |
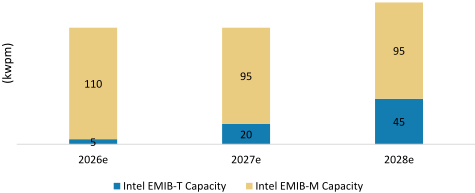
9KB | 真資料圖 | 堆疊長條「Intel EMIB Capacity」kwpm:EMIB-T 2026e 5/2027e 20/2028e 45;EMIB-M 110/95/95(報告 Exhibit 6) |
報告_MS_聯發科2454_20260927_009.png |
37KB | 真資料圖 | FY2026e MS 預估對共識區間:營收 NT$671,881mn(共識均值 664,932)、EBITDA 140,344(133,436)、淨利 116,823(109,700)、EPS 73.35(68.47)(財務類) |
原始內容
| Morgan Stanley Taiwan Limited+ Charlie Chan Equity Analyst C arlie.C an@morganstanley.com | +886 2 2730-1725 |
|---|---|
| Daniel Yen, CFA Equity Analyst Daniel.Yen@morganstanley.com | +886 2 2730-2863 |
| Morgan Stanley Asia Limited+ Daisy Dai, CFA Equity Analyst Daisy.Dai@morganstanley.com | +852 2848-7310 |
| Morgan Stanley Taiwan Limited+ Lucas Wang Researc Associate Lucas.Wang@morganstanley.com | +886 2 2730-2875 |
MediaTek(2454.TW, 2454 TT)
Top Pick
Greater China Technology Semicond ctors | Taiwan
| Stock Rating | Overweight Attractive |
|---|---|
| Ind stry View | |
| Price target | NT$6,188.00 |
| Up/downside to price target (%) | 1 |
| Shr price, close (Sep 24, 2026) | NT$5,285.00 |
| 52-Week Range | NT$5,480.00- |
| 1,130.00 | |
| Sh out, dil, curr (mn) | 1,565 |
| Mkt cap, curr (mn) | NT$8,2 2,001 |
| EV, curr (mn) | NT$8,056,4 2 |
| Avg daily trading value (mn) | NT$26,540 |
| Fiscal Year Ending | 12/25 | 12/26e | 12/27e | 12/28e |
|---|---|---|---|---|
| EPS (NT$)** | 66.1 | 3.35 | 146.9 | 342.3 |
| Prior EPS (NT$)** | 62. 9 | 3.22 | - | 308.25 |
| EPS (NT$)§ | 66.05 | 68.41 | 146.83 | 2 0.53 |
| Revenue, net (NT$ bn) | 596.0 | 6 1.9 | 1,095.6 | 2,315.2 |
| ModelWare net inc (NT | 105.3 | 116.8 | 233.8 | 545.3 |
| $ bn) ROE (%) | 26.0 | 28.5 | 48.8 | 8.6 |
| Div yld (%) | 19.2 | 0.0 | 0.0 | 0.0 |
Unless otherwise noted, all metrics are based on Morgan Stanley ModelWare framework
- ** = Based on consensus methodology
- § = Consensus data is provided by Refinitiv Estimates
- e = Morgan Stanley Research estimates
Morgan Stanley does and seeks to do business with companies covered in Morgan Stanley Research. As a result, investors should be aware that the firm may have a conflict of interest that could affect the objectivity of Morgan Stanley Research. Investors should consider Morgan Stanley Research as only a single factor in making their investment decision.
For analyst certification and other important disclosures, refer to the Disclosure Section, located at the end of this report.
= Analysts employed by non-U.S. affiliates are not registered with FINRA, may not be associated persons of the member and may not be subject to FINRA restrictions on communications with a subject company, public appearances and trading securities held by a research analyst account.
M Idea September 27, 2026 09:43 PM GMT
MediaTek | Asia Pacific
TSMC CoWoS support eases MediaTek's 2028 TPU production concerns; OW
| What's Changed | To | |
|---|---|---|
| MediaTek (2454.TW) Price Target | From NT$5,588.00 | NT$6,188.00 |
Thesis largely unchanged but we raise our price target to NT $6 188 to bake in: 1) more secured TPU production in 2028 and 2) a second cloud AI ASIC revenue contribution.
Current debate: Can MediaTek meet Street 2028 forecasts given Intel MIB-T supply issue? Intel's EMIB-T substrate supply has been a potential bottleneck for future TPU v9 (" umufish") shipments in 2028, making some investors reluctant to own MediaTek. The issue stems from a supply-demand mismatch. We forecast 3mn TPU v9 units, as demand from Google (covered by Brian Nowak) remains strong. owever, as discussed in our AI Supply Chain Tracker, we expect only 2mn EMIB-T substrates, i.e. 40-45k wafer-equivalent EMIB-T capacity in 2028. This aligns with Digitimes' report that Google is considering CoWoS as a backup for its 2027 TPU on lagging EMIB-T substrate yields. For TSMC, supporting CoWoS could also help regain market share from EMIB-T. Our checks indicate that both MediaTek and TSMC are engaging to meet customer (Google) demand.
TSMC's willingness to support production increases confidence in our aggressive 2028 PS forecast: Assuming TSMC CoWoS-L can support 0.5mn TPU v9 units and EMIB-T can support 2.5mn units, our 3mn-unit target for 2028 appears highly achievable, with a higher ASP from the CoWoS version. CoWoS-L carries a structurally higher cost, and the RDL (redistribution layer) interposer connection requires tape-out of three additional photomask layers. owever, our checks also suggest that Google is willing to pay these incremental costs to secure dual sourcing, which should help MediaTek sustain its gross margin.
New debate: Who could be the second CSP customer? Investors have asked whether MediaTek could win Tesla's AI6 edge AI chip program. We believe AI6 is better suited to GUC, given its 10%-25% margin profile. Considering the higher tech content of MediaTek's design services, incl. IP + design capabilities, we believe MediaTek targets a 30%-35% margin profile. Instead, we see a growing probability that MediaTek wins a cloud AI ASIC project from an AI-focused CSP and/or AI lab customer through its Nvidia / NVLink Fusion partnership. In previous notes, we highlighted interest from both SpaceX and an AI lab customer. The customer's decision could come in 4Q26 and serve as a significant catalyst for MediaTek. With TPU upside and a potential new project, we expect MediaTek AI ASIC-related revenue of US$13.5bn and US$54bn in 2027 and 2028, resp., representing c.38% and 72% of total revenue. Reiterate Top Pick.
M Idea
TSMC CoWoS capacity support eases concerns regarding MediaTek 2028 TPU production
Smartphone market still lukewarm into 2027, but can serve as a long-term option value: At our recent China Best Conference, meetings involving China smartphone OEM and NAND module makers appeared to indicate China's smartphone demand may not recover in 2027, as mobile DRAM prices may not be falling anytime soon. We expect MediaTek's 3Q26 revenue to be ahead of guidance because of customer pull-in to avoid the SoC price hike rather than due to demand improvement.
That said, once AI smartphones become a killer application, MediaTek should rank among the best-positioned semiconductor companies to provide the edge computing capabilities required in handsets. We also believe 2028 should be a strong year for MediaTek's smartphone SoC business.
1. Google TPU supply chain update
TSMC CoWoS may support both 3nm (Zebrafish) and 2nm (Humufish) MediaTek TPU in 2028: In our earlier report, MediaTek: 2Q26 results preview: Smartphone weak, but Cloud AI taking off; OW (26 Jul 2026), we noted that MediaTek may secure a portion of CoWoS capacity for 2nm TPU to ensure minimum volume production. But, we believe it will use EMIB-T from Intel (covered by Joseph Moore) as the primary solution to reduce costs and scale volume in 2028, if execution proceeds well. Our recent industry checks suggest TSMC CoWoS would continue to support both 3nm (Zebrafish) and 2nm ( umufish) MediaTek TPU in 2028. We now assume around 500k units of 2nm TPU going through CoWoS production as a second source. The 3nm TPU in 2028 of around 2mn units is higher than our initial expectation of 1mn units. We therefore raise our MediaTek 2028 TPU revenue assumption to US$51.5bn.
2nm TPU TAM is supported by different SKU: At our AI Summit, MediaTek management stated that its design service is capable of both training and inference design. Recently, investors have been asking whether MediaTek is involved in the design of 2nm TriggerFish TPU, intended for AI inference. Our supply chain checks suggest this could be true. The TriggerFish chip has more features (I/O die upgrade, one more simulation die, and change of BM controller to BM4e), so we think MediaTek's 2nm TPU blended ASP could go higher. We estimate ASP at US$12-20k (we now model US$13k). But again, the EMIB-T substrate yield should be the key risk to volume.
CoWoS constraint eased, but ABF substrate supply still the gating factor for TPU bull case: In our recent AI supply chain tracker, we noted that MediaTek's 180k CoWoS-S booking implies ~3.6mn units of TPU 8t (ZebraFish) in 2027, above our original 3mn shipment assumption. owever, we continue to bake in some conservatism as we had assumed ABF substrate shortages. So, we still forecast 3mn units in 2027.
M Idea
Exhibit 1: MediaTek's Google TPU volume forecasts (v8t, v9, and v10) based on our Asia supply c ain c ecks
| k Units | 2023 | 2024 | 2025e | 2026e | 2027e | 2028e |
|---|---|---|---|---|---|---|
| v5 | 500 | 2,400 | 250 | |||
| v6 (Trillium) | 1,200 | |||||
| v8t (Zebrafish; 3nm, by MediaTek) | 500 | 3,000 | 2,000 | |||
| v9 (Humufish; 2nm EMIB-T, by MediaTek) | 2,500 | |||||
| v9 (Humufish; 2nm CoWoS, by MediaTek) | 500 | |||||
| v10 (Icefish; 1.4nm, by MediaTek) | unknown | |||||
| Total | 500 | 2,400 | 1,750 | 3,300 | 7,500 | >9000 |
Source: Morgan Stanley Researc estimates
2. Who could be the second and third custo er for MediaTek in AI ASICs?
NVLink Fusion partnership should be the key catalyst for MediaTek to win new projects:
Through the NVLink Fusion platform, MediaTek's XPU customers can leverage NVIDIA's scale-up and scale-out networking technologies to build AI server systems.
In our report, MediaTek: NVIDIA and Alphabet Invest in MediaTek's CB for Extensive Partnership in ASIC; Stay OW, Top Pick (31 Aug 2026), we shared that MediaTek had maintained its 2027 ASIC TAM and market share guidance despite the broader partnership, noting that commercialization would take time. owever, we believe the partnership materially increases MediaTek's chances of winning a second CSP customer.
Overall, we see upside to our 2028 ASIC revenue assumptions, driven by: 1) a higher probability of winning a second or even third CSP customer; 2) greater revenue from material preparation; and 3) a strengthened partnership with Alphabet on TPU programs.
In today's research, we incorporate potential revenue contributions from new customers.
Exhibit 2: NVLink Fusion to support connection wit custom ASIC
Source: Nvidia
MediaTek's second CSP customer could begin contributing revenue from subsystem builds in 2028: We believe the subsystem would include procurement of key components such as BM and ABF substrates, as well as wafer foundry capacity prepayments.
M Idea
Our checks suggest MediaTek may target subsystem builds for a second CSP customer rather than supplying the XPU itself. We now expect an initial revenue contribution in 2028, based on approximately 100k subsystem units at an ASP of US$25k.
We therefore assume a US$2.5bn revenue contribution in 2028, based on 100k units and an ASP of US$25k, including BM chip consignment, known-good dies (KGDs) for compute chips, and chiplets.
On margin trends, management highlighted continued value creation for customers across both silicon and packaging design. As a result, we expect ASICs to remain accretive to operating margins. At the gross margin level, management indicated that margins vary by project, potentially reflecting support for full-rack systems. We model 2nm TPU gross margins at c.35% (vs. c.40% for 3nm TPUs) given the larger revenue scale. We continue to expect operating margins of ~20-25%, above the smartphone business unit's 15-20%.
Exhibit 3: MediaTek AI ASIC/subsystem revenue projection
| 2027e | 2028e | 2029e | ||
|---|---|---|---|---|
| TPU v8t (Zebrafish) | 3 | 2 | ||
| TPU v9 (Humufish; EMIB-T) | 2.5 | 4 | ||
| Volume (mn) | TPU v9 (Humufish; CoWoS) | 0.5 | ||
| TPU v10 (Icefish) | 1 | |||
| 2nd Customer Subsystem | 0.1 | 0.5 | ||
| TPU v8t | 4.5 | 4.5 | ||
| TPU v9; EMIB-T | 13 | 13 | ||
| Chip ASP Recognized by MediaTek (US$k) | TPU v9; CoWoS | 20 | ||
| TPU v10 | 18 | |||
| 2nd Customer Subsystem | 25 | 25 | ||
| TPU v8t | 13.5 | 9 | ||
| TPU v9; EMIB-T | 32.5 | 52 | ||
| TPU v9; CoWoS | 10 | |||
| Revenue (US$bn) | TPU v10 | 18 | ||
| Total TPU Revenue | 13.5 | 51.5 | 70 | |
| 2nd Customer Subsystem | 2.5 | 12.5 | ||
| Total MediaTek Revenue (US$bn) | Total MediaTek Revenue (US$bn) | 35 | 75 | NA |
| AI ASIC Revenue % | AI ASIC Revenue % | 38% | 72% | NA |
Source: Morgan Stanley Researc estimates
3. Why TSMC is otivated to support MediaTek and Google?
TSMC's CoWoS-L solution carries a structurally higher cost due to its larger reticle size, as we discussed in The Foundry Floorplan: TSMC preview update; CoWoS vs. EMIB competition (14 Apr 2026). We believe TSMC also wants to address growing competition from Intel's EMIB-T, which we estimate will reach 40-45k wafer equivalent capacity 2028, implying a 10-15% share of the 2.5D packaging market.
For MediaTek to adopt TSMC's CoWoS-L as a second source alongside EMIB-T, the RDL (redistribution layer) connection to the interposer requires tape-out of three additional photomask layers. owever, our checks suggest that Google is willing to absorb the incremental costs associated with dual sourcing, which should allow MediaTek to sustain its gross margin.
M Idea
Exhibit 4: Total 2.5D packaging capacity from 2026-2028 (excluding EMIB-M w ic is mainly for CPU production)
Total 2.5D Packaging Capacity (Average)
Source: Morgan Stanley Researc estimates
Exhibit 5: TSMC's roadmap for interposer size
CoWoS Enables Al Compute Scaling
Source: Winway, TSMC
Intel EMIB-T can support 2.5 n units of our 2028 TPUv9 ship ent in 2028
Average EMIB-T capacity is around 5kwpm in 2026, which we expect to further scale to 1520kwpm in 2027 and 40-45kwpm in 2028. All of the capacity mentioned above is converted for 12-inch wafer equivalent, which we believe would be much easier to M Idea communicate with customers compared with TSMC CoWoS capacity.
Although some small projects are ongoing, we still see MediaTek/Google umufish consuming most of the capacities during 2027-28. We now expect Intel EMIB-T could produce close to 2.5mn units of umufish from late 2027-2028, by assuming 4-5 chips per wafer of EMIB-T, while TSMC CoWoS could support around 500k units.
We see current average EMIB-M capacity being 110kwpm, which would slightly decrease to 95kwpm in 2027 as Intel is converting some capacities toward EMIB-T.
Exhibit 6: We expect Intel's EMIB-T capacity to reac 20kwpm in 2027 and 45kwpm in 2028; EMIB-M capacity is currently at 110kwpm, w ic would be down to 95kwpm due to conversion Exhibit 7: Intel's EMIB can easily support larger c ips wit more reticles (>12x) if its supply c ain execution proceeds well
Intel EMIB Capacity (Average)
Source: Morgan Stanley Researc estimates
Source: Intel
M Idea
Earnings estimate revisions and quarterly financials
We raise 2028 earnings estimates by 11%, while 2026/27 numbers are largely unchanged: Our higher 2028 estimates mostly reflect stronger TPU shipment and subsystem build for a second CSP customer.
Exhibit 8: MediaTek: Earnings estimate revisions
| (NT$ mn) | Current New 2026e | Previous Old 2026e | Diff. % | Current New 2027e | Previous Old 2027e | Diff. % | Current New 2028e | Previous Old 2028e | Diff. % |
|---|---|---|---|---|---|---|---|---|---|
| Net sales | 671,881 | 671,881 | 0% | 1,095,554 | 1,095,554 | 0% | 2,315,233 | 2,083,124 | 11% |
| Gross profit | 305,311 | 305,312 | 0% | 461,508 | 461,508 | 0% | 882,302 | 801,064 | 10% |
| Operating profit | 116,528 | 116,531 | 0% | 262,019 | 262,019 | 0% | 630,311 | 566,006 | 11% |
| Pretax income | 135,851 | 135,662 | 0% | 277,019 | 277,019 | 0% | 645,311 | 581,006 | 11% |
| Reported net income | 116,823 | 116,620 | 0% | 233,811 | 233,811 | 0% | 545,288 | 490,950 | 11% |
| Reported basic EPS | 73.35 | 73.22 | 0% | 146.97 | 146.97 | 0% | 342.37 | 308.25 | 11% |
| Reported diluted EPS | 73.27 | 73.14 | 0% | 146.81 | 146.81 | 0% | 341.99 | 307.91 | 11% |
| Margins | |||||||||
| Gross margin | 45.4% | 45.4% | 42.1% | 42.1% | 38.1% | 38.5% | |||
| Operating margin | 17.3% | 17.3% | 23.9% | 23.9% | 27.2% | 27.2% | |||
| Pretax margin | 20.2% | 20.2% | 25.3% | 25.3% | 27.9% | 27.9% | |||
| Net margin | 17.4% | 17.4% | 21.3% | 21.3% | 23.6% | 23.6% |
Source: Morgan Stanley Researc estimates
Exhibit 9: MediaTek: Quarterly financials
| (NT$ mn) | 1Q26 | 2Q26 | 3Q26e | 4Q26e | 1Q27e | 2Q27e | 3Q27e | 4Q27e | 2024 | 2025 | 2026e | 2027e | 2028e |
|---|---|---|---|---|---|---|---|---|---|---|---|---|---|
| Total revenues | 149,151 | 152,183 | 154,613 | 215,935 | 221,504 | 242,352 | 292,895 | 338,804 | 530,586 | 595,966 | 671,881 | 1,095,554 | 2,315,233 |
| Q/Q Change | -0.7% | 2.0% | 1.6% | 39.7% | 2.6% | 9.4% | 20.9% | 15.7% | |||||
| Y/Y Change | -2.7% | 1.2% | 8.8% | 43.8% | 48.5% | 59.3% | 89.4% | 56.9% | 22.4% | 12.3% | 12.7% | 63.1% | 111.3% |
| Cost of Sales | 80,095 | 81,875 | 83,500 | 121,100 | 126,907 | 139,384 | 170,328 | 197,427 | 267,200 | 312,886 | 366,570 | 634,046 | 1,432,931 |
| Percent of Revenues | 53.7% | 53.8% | 54.0% | 56.1% | 57.3% | 57.5% | 58.2% | 58.3% | 50.4% | 52.5% | 54.6% | 57.9% | 61.9% |
| Gross Profit | 69,055 | 70,308 | 71,113 | 94,835 | 94,596 | 102,968 | 122,566 | 141,378 | 263,386 | 283,080 | 305,311 | 461,508 | 882,302 |
| Gross Margin | 46.3% | 46.2% | 46.0% | 43.9% | 42.7% | 42.5% | 41.8% | 41.7% | 49.6% | 47.5% | 45.4% | 42.1% | 38.1% |
| Incremental Margin | NM | 41% | 33% | 39% | -4% | 40% | 39% | 41% | 58% | 30% | 29% | 37% | 35% |
| Total Opex | 46,165 | 47,440 | 46,723 | 48,456 | 47,988 | 48,809 | 50,572 | 52,120 | 160,974 | 179,610 | 188,783 | 199,489 | 251,991 |
| Percent of Revenues | 31.0% | 31.2% | 30.2% | 22.4% | 21.7% | 20.1% | 17.3% | 15.4% | 30.3% | 30.1% | 28.1% | 18.2% | 10.9% |
| R&D | 38,345 | 39,361 | 39,411 | 39,511 | 39,550 | 39,750 | 39,950 | 40,150 | 131,993 | 148,306 | 156,627 | 159,400 | 178,210 |
| Percent of Revenues | 25.7% | 25.9% | 25.5% | 18.3% | 17.9% | 16.4% | 13.6% | 11.9% | 24.9% | 24.9% | 23.3% | 14.5% | 7.7% |
| General & Adm Exp. | 2,805 | 3,397 | 3,447 | 3,547 | 2,900 | 3,000 | 3,300 | 3,500 | 11,891 | 10,856 | 13,195 | 12,700 | 15,900 |
| Percent of Revenues | 1.9% | 2.2% | 2.2% | 1.6% | 1.3% | 1.2% | 1.1% | 1.0% | 2.2% | 1.8% | 2.0% | 1.2% | 0.7% |
| Selling Expenses | 5,015 | 4,682 | 3,865 | 5,398 | 5,538 | 6,059 | 7,322 | 8,470 | 17,090 | 20,448 | 18,961 | 27,389 | 57,881 |
| Percent of Revenues | 3.4% | 3.1% | 2.5% | 2.5% | 2.5% | 2.5% | 2.5% | 2.5% | 3.2% | 3.4% | 2.8% | 2.5% | 2.5% |
| Operating Income | 22,891 | 22,868 | 24,390 | 46,379 | 46,609 | 54,159 | 71,994 | 89,257 | 102,412 | 103,470 | 116,528 | 262,019 | 630,311 |
| Operating Margin | 15.3% | 15.0% | 15.8% | 21.5% | 21.0% | 22.3% | 24.6% | 26.3% | 19.3% | 17.4% | 17.3% | 23.9% | 27.2% |
| Total Non-operating Income (loss) | 4,129 | 5,094 | 5,050 | 5,050 | 3,750 | 3,750 | 3,750 | 3,750 | 17,107 | 21,418 | 19,322 | 15,000 | 15,000 |
| Profit Before Taxes | 27,019 | 27,962 | 29,440 | 51,429 | 50,359 | 57,909 | 75,744 | 93,007 | 119,519 | 124,888 | 135,851 | 277,019 | 645,311 |
| Percent of Revenues | 18.1% | 18.4% | 19.0% | 23.8% | 22.7% | 23.9% | 25.9% | 27.5% | 22.5% | 21.0% | 20.2% | 25.3% | 27.9% |
| Change vs Year Ago | -22% | -16% | -2% | 89% | 86% | 107% | 157% | 81% | 37.7% | 4.5% | 8.8% | 103.9% | 132.9% |
| Taxes | 2,643 | 3,357 | 4,563 | 7,972 | 7,806 | 8,976 | 11,740 | 14,416 | 12,378 | 18,770 | 18,534 | 42,938 | 100,023 |
| Tax Rate | 9.8% | 12.0% | 15.5% | 15.5% | 15.5% | 15.5% | 15.5% | 15.5% | 10.4% | 15.0% | 13.6% | 15.5% | 15.5% |
| Minor interest | 222 | 270 | 0 | 0 | 0 | 0 48,933 | 0 64,004 | 0 | 754 | 798 105,319 | 493 116,823 | 270 | 0 |
| Total Net Income to Parent | 24,154 | 24,335 | 24,877 | 43,458 | 42,553 19.2% | 20.2% | 21.9% | 78,591 | 106,387 20.1% | 17.7% | 17.4% | 233,811 | 545,288 |
| Percent of Revenues | 16.2% | 16.0% | 16.1% | 20.1% | 23.2% | 21.3% | 23.6% | ||||||
| Change vs Year Ago | -17.6% | -12.6% | -1.4% | 89.6% | 76.2% | 101.1% | 157.3% | 80.8% | 38.2% | -1.0% | 10.9% | 100.1% | 133.2% |
| Reported Basic EPS (NT$, TW GAAP) | 15.17 | 15.28 | 15.62 | 27.29 | 26.72 | 30.72 | 40.19 | 49.34 | 66.93 | 66.17 | 73.35 | 146.97 | 342.37 |
| Reported Diluted EPS (NT$, TW GAAP) | 15.15 | 15.26 | 15.60 | 27.26 | 26.69 | 30.69 | 40.14 | 49.29 | 66.81 | 66.07 | 73.27 | 146.81 | 341.99 |
Source: Company data, Morgan Stanley Researc estimates M Idea
Raise price target from NT$5 588 to NT$6 188
We continue to derive our price target (our base-case scenario value) from a residual income model. The price target change mostly reflects our earnings estimate changes. All of our key valuation assumptions remain unchanged: cost of equity at 9.2% (beta of 1.2, risk-free rate of 2%, and risk premium of 6%), intermediate growth rate of 12%, and terminal growth rate of 3.0%.
Our bull- and bear-case scenario values rise from NT$7,675 to NT$8,500 and NT$2,845 to NT$3,150, respectively.
Exhibit 10: MediaTek: Residual income model
| (NT$ mn) | 2026e | 2027e | 2028e | 2029e | 2030e | 2031e | 2032e | 2033e | 2034e | 2035e | 2036e | 2037e |
|---|---|---|---|---|---|---|---|---|---|---|---|---|
| Total Equity | 478,709 | 693,702 | 1,127,416 | 1,414,944 | 1,736,975 | 2,097,651 | 2,501,607 | 2,954,038 | 3,460,761 | 4,028,290 | 4,663,923 | 5,375,832 |
| Net Profit | 116,823 | 233,811 | 545,288 | 610,722 | 684,009 | 766,090 | 858,021 | 960,984 | 1,076,302 | 1,205,458 | 1,350,113 | 1,512,126 |
| ROAE | 26.3% | 39.9% | 59.9% | 48.0% | 43.4% | 40.0% | 37.3% | 35.2% | 33.6% | 32.2% | 31.1% | 30.1% |
| Residual Income | 70,031 | 146,894 | 351,603 | 437,931 | 483,949 | 534,232 | 589,677 | 651,142 | 719,510 | 795,717 | 880,781 | 975,822 |
| Spread | 17.1% | 30.7% | 50.7% | 38.8% | 34.2% | 30.8% | 28.1% | 26.0% | 24.4% | 23.0% | 21.9% | 20.9% |
| Ending Equity Capital | 478,709 | |||||||||||
| PV of Forecast Period | 3,230,987 | |||||||||||
| PV of Continuing Value | 6,156,971 | |||||||||||
| Equity Value | 9,866,666 | |||||||||||
| No. of Shares | 1,594 | |||||||||||
| Projected Price (NT$) | 6,188 |
Source: Company data, Morgan Stanley Researc estimates M Idea
Relative valuation
We view the P/E as relatively attractive - even after the share price rally - given strong AI demand. Although MediaTek faces smartphone headwinds in 2026, we believe it is time to look beyond 2026. We think this margin pressure is fully priced in, while TPU upside is not. We believe the stock should trade more than +1SD above its historical average, supported by strong TPU demand. Our price target of NT$6,188 implies 42x 2027 EPS, on our estimates.
Exhibit 11: MediaTek: One-year forward P/E trend
2006 2007 2008 2009 2010 2011 2012 2013 2014 2015 2016 2017 2018 2019 2020 2021 2022 2023 2024 2025 2026 MediaTek One-year Forward P/E
Source: Company data, FactSet, Morgan Stanley Researc M Idea
Risk Reward - MediaTek (2454.TW) Risk Reward - MediaTek (2454.TW) Top Pick
AI ASIC demand likely to offset smartphone headwind; Top Pick
NT$6,188.00 PRICE TARGET
Base case, residual income model. Key assumptions: cost of equity 9.2%, intermediate growth rate 12.0%, terminal growth rate 3.0%.
NT$5,534.27
MS PT
Mean
Consensus Price Target Distribution
NT$1,751.00
NT$10,369.00
Source: Refinitiv, Morgan Stanley Research Morgan Stanley Estimates
RISK REWARD CHART AND OPTIONS IMPLIED PROBABILITIES (12M)
Key: Historical Stock Performance Current Stock Price Price Target
Source: Refinitiv, Morgan Stanley Research, Morgan Stanley Institutional Equities Division. The probabilities of our Bull, Base, and Bear case scenarios playing out were estimated with implied volatility data from the options market as of 24 Sep 2026. All figures are approximate risk-neutral probabilities of the stock reaching beyond the scenario price in either three-months ' or one-years ' time. View explanation of Options Probabilities methodology here
BULL CASE
BASE CASE
OVERWEIGHT THESIS
- ▪We expect MediaTek's gross margin to decline in both 2026 and 2027 as a result of smartphone headwinds and TPU margin dilution, but strong demand from TPU should drive earnings growth.
- ▪Overall AI ASIC demand looks very strong, especially from Google's TPU, which should benefit MediaTek in the coming years.
- ▪The AI smartphone replacement cycle is the key wild card. AI smartphone replacement could be too mild to pass through additional costs in Chinese smartphones.
- ▪Risk-reward is attractive at the current level given strong TPU demand. We believe the stock could re-rate to 42x 2027e P/E, more than double its 18x historical average since 2006.
Consensus Rating Distribution
Risk Reward Themes
New Data Era:
Positive
Technology Diffusion: Positive
View descriptions of Risk Rewards Themes here
BEAR CASE
58x 2027e EPS
MediaTek receives US licenses for shipments to all Chinese smartphone brands. Emerging market demand recovers to trend-line growth. MediaTek reaches 90% of an enlarged addressable market for 5G Android smartphones in 2027, including share gains in premium smartphone models. Blended ASP rises in 2027. Better business development in IoT, autos, enterprise networking chips, edge AI projects and AI ASIC business, especially on Google TPU demand.
42x 2027e EPS
MediaTek maintains around 35-40% overall share in the Chinese smartphone market, with a share of 30-40% in 5G SoC for 2025 (ex-Apple). Besides smartphones, AI ASIC should be the largest focus for the company now. We expect a >50% revenue CAGR during 2025-28. Non-smartphone business development stays on track, including IoT, autos, enterprise networking chips, edge AI projects and AI ASIC business.
21x 2027e EPS
Competitive pressures are worse than expected, with some market share loss, which hurts gross margin. Emerging market smartphone growth stalls. Chinese smartphone chipset vendors show a breakthrough in 5G technologies or foundry supply and start to take more market share in mid-range 5G smartphone SoCs. Slow new business development in ASIC, IoT and automotive, edge AI projects and AI ASIC business.
NT$3,150.00
NT$8,500.00
NT$6,188.00
M Idea
Risk Reward - MediaTek (2454.TW)
KEY EARNINGS INPUTS
| Drivers | Dec 2025 | Dec 2026eDec | 2027eDec | 2028e |
|---|---|---|---|---|
| Revenue from 5G Products (NT$, mn) | 291,637 | 281,035 | 301,505 | 341,338 |
| Revenue from Mid-low-end 4G Products (NT$, mn) | 4,854 | 1,198 | 1,137 | 1,186 |
| Revenue from Growing Products (NT$, mn) | 195,335 | 310,767 | 715,665 | 1,891,823 |
| Revenue from Mature Products (NT$, mn) | 34,922 | 32,983 | 32,857 | 32,682 |
INVESTMENT DRIVERS
- Market share in major smartphone brands
- Overall demand from non-smartphone businesses, such as TVs and set-top boxes
- Introduction of new products, such as SoC, smartphones, and tablets
GLOBAL REVENUE EXPOSURE
Source: Morgan Stanley Research Estimate View explanation of regional hierarchies here
MS ALPHA MODELS
2/5 MOST
3 Month
Horizon
Source: Refinitiv, FactSet, Morgan Stanley Research; 1 is the highest favored Quintile and 5 is the least favored Quintile
RISKS TO PT/RATING
RISKS TO UPSIDE
- Edge AI proliferates smartphone replacement cycle.
- Smartphone demand rises in China and other EMs.
- New products attract high demand, resulting in market share gains.
- Google's TPU spurs demand.
RISKS TO DOWNSIDE
- Smartphone demand deteriorates in China and other EMs.
- Competition heats up, resulting in pricing competition.
- New products attract low demand, causing market share loss.
- Margin dilution is more severe.
OWNERSHIP POSITIONING
Inst. Owners, % Active
71.3%
Source: Refinitiv, Morgan Stanley Research
MS ESTIMATES VS. CONSENSUS
M Idea
MediaTek: Financial Summary
Income Statement
Cash Flow Statement
| NT$mn (Years End Dec ) | 2024 | 2025 | 2026e | 2027e | 2028e |
|---|---|---|---|---|---|
| Net sales | 530,586 | 595,966 | 671,881 | 1,095,554 | 2,315,233 |
| COGS | (267,200) | (312,886) | (366,570) | (634,046) | (1,432,931) |
| Gross profit | 263,386 | 283,080 | 305,311 | 461,508 | 882,302 |
| Operating expenses | (160,974) | (179,610) | (188,783) | (199,489) | (251,991) |
| Operating income | 102,412 | 103,470 | 116,528 | 262,019 | 630,311 |
| Non-operating income | 17,107 | 21,418 | 19,322 | 15,000 | 15,000 |
| Pre-tax income | 119,519 | 124,888 | 135,851 | 277,019 | 645,311 |
| Income tax | (12,378) | (18,770) | (18,534) | (42,938) | (100,023) |
| Net income (excl. emp. bonus) | 133,925 | 132,647 | 146,645 | 292,602 | 681,610 |
| Employee Bonus Expense | 26,785 | 26,529 | 29,329 | 58,520 | 136,322 |
| Net income (incl. emp. bonus) | 106,387 | 105,319 | 116,823 | 233,811 | 545,288 |
| Adj.wtd.avg.shrs( m) | 1,589 | 1,592 | 1,593 | 1,591 | 1,593 |
| Reported EPS (NT$) | 66.93 | 66.17 | 73.35 | 146.97 | 342.37 |
| Diluted EPS (NT$) | 66.81 | 66.07 | 73.27 | 146.81 | 341.99 |
| EPS for Consensus (NT$) | 66.81 | 66.07 | 73.27 | 146.81 | 341.99 |
Balance Sheet
| NT$mn (Years End Dec ) | 2024 | 2025 | 2026e | 2027e | 2028e |
|---|---|---|---|---|---|
| Cash flow from Operations | 156,055 | 162,793 | 39,626 | 185,821 | 379,538 |
| Net profits | 106,385 | 105,319 | 116,823 | 233,811 | 545,288 |
| Depreciation | 20,936 | 22,974 | 23,808 | 24,641 | 25,474 |
| Equity investment losses (income) | (517) | (785) | 0 | 0 | 0 |
| Other adjustments | 29,251 | 35,284 | (101,005) | (72,631) | (191,224) |
| Cash flow from Investing | (35,928) | (37,754) | (74,260) | (122,445) | (343,102) |
| Capex | (13,787) | (15,059) | (5,000) | (5,000) | (5,000) |
| Change of LT Investment | (14,226) | (9,851) | 0 | 0 | 0 |
| Change of ST Investment | 283 | (69) | 0 | 0 | 0 |
| Other adjustments | (8,198) | (12,775) | (69,260) | (117,445) | (338,102) |
| Cash flow from financing | (90,119) | (87,675) | (71,117) | (43,459) | (137,049) |
| Increase in L/T debt | 0 | 60 | 50,000 | 50,000 | 50,000 |
| Increase in S/T debt | (1,260) | 0 | 0 | 0 | 0 |
| Cash Dividend Paid | (87,551) | (86,070) | (121,117) | (93,459) | (187,049) |
| Dir& Emp Bonus Paid | 0 | 0 | 0 | 0 | 0 |
| Issuance of stock | 0 | 0 | 0 | 0 | 0 |
| Other adjustments | (1,309) | (1,665) | 0 | 0 | 0 |
| Exchange rate adjustment | 0 | 0 | 0 | 0 | 0 |
| Net change in cash | 30,008 | 37,364 | -105,751 | 19,918 | -100,613 |
Financial Ratios
168,912 Margins (%)
| NT$mn (Years End Dec ) | 2024 | 2025 | 2026e | 2027e | 2028e |
|---|---|---|---|---|---|
| Cash | 203,696 | 235,290 | 129,539 | 149,457 | 48,844 |
| Mkt Securities | 15,928 | 12,419 | 12,419 | 12,419 | 12,419 |
| AR/NR | 44,713 | 62,121 | 79,877 | 130,246 | 275,248 |
| Inventory | 58,414 | 67,235 | 93,266 | 161,319 | 364,577 |
| Other | 28,274 | 20,392 | 13,849 | 22,582 | 47,723 |
| Current Assets | 351,025 | 397,456 | 328,950 | 476,023 | 748,812 |
| Long-term investments | 169,970 | 168,912 | 168,912 | 168,912 | 168,912 |
| Fixed assets | 56,917 | 60,427 | 65,427 | 70,427 | 75,427 |
| Other assets | 119,955 | 116,990 | 186,250 | 303,694 | 641,796 |
| Total Assets | 697,868 | 743,785 | 749,539 | 1,019,056 | 1,634,947 |
| S/T borrowings | 940 | 940 | 940 | 940 | 940 |
| AP/NP | 40,777 | 48,710 | 60,911 | 105,356 | 238,103 |
| Other ST liabilities | 225,186 | 253,700 | 177,739 | 187,818 | 237,248 |
| LT debt | 2,681 | 6,795 | 6,795 | 6,795 | 6,795 |
| Other LT liabilities | 23,228 | 24,444 | 24,444 | 24,444 | 24,444 |
| Total Liabilities | 292,812 | 334,590 | 270,830 | 325,354 | 507,531 |
| Common shares | 16,017 | 16,039 | 16,039 | 16,039 | 16,039 |
| Retained earning | 331,543 | 354,139 | 470,962 | 704,773 | 1,250,061 |
| Other shareholders' equity | 57,495 | 39,017 | (8,292) | (27,110) | (138,684) |
| Total Equity | 405,055 | 409,195 | 478,709 | 693,702 | 1,127,416 |
| Total Liab. & Shrhldr's Equity | 697,868 | 743,785 | 749,539 | 1,019,056 | 1,634,947 |
| 2024 | 2025 | 2026e | 2027e | 2028e | |
|---|---|---|---|---|---|
| Growth(%) | |||||
| Turnover | 22.4 | 12.3 | 12.7 | 63.1 | 111.3 |
| Operating profits | 42.6 | 1.0 | 12.6 | 124.9 | 140.6 |
| Pretax profits | 37.7 | 4.5 | 8.8 | 103.9 | 132.9 |
| Net profits | 38.8 | -1.0 | 10.6 | 99.5 | 132.9 |
| EPS | 38.1 | -1.1 | 10.9 | 100.4 | 132.9 |
| Margins (%) | |||||
| Gross Margin | 49.6 | 47.5 | 45.4 | 42.1 | 38.1 |
| Operating Margin | 19.3 | 17.4 | 17.3 | 23.9 | 27.2 |
| Pretax Margin | 22.5 | 21.0 | 20.2 | 25.3 | 27.9 |
| Net Profit | 20.1 | 17.7 | 17.4 | 21.3 | 23.6 |
| Return (%) | |||||
| ROAA | 16.0 | 14.6 | 15.6 | 26.4 | 41.1 |
| ROAE | 27.3 | 25.9 | 26.3 | 39.9 | 59.9 |
| Gearing (%) | |||||
| Net Debt/Equity | (50.1) | (57.3) | (26.9) | (21.4) | (4.2) |
| Liabilities/Equity | 72.3 | 81.8 | 56.6 | 46.9 | 45.0 |
| Ratios (X) | |||||
| Current ratio | 1.3 | 1.3 | 1.4 | 1.6 | 1.6 |
| Quick ratio | 0.9 | 1.0 | 0.9 | 1.0 | 0.7 |
| Others | |||||
| AR/NR Turnover (days) | 43 | 43 | 43 | 43 | 43 |
| Inventory Turnover (days) | 92 | 92 | 92 | 92 | 92 |
| AP Turnover (days) | 60 | 60 | 60 | 60 | 60 |
| Cash Conversion (days) | 75 | 75 | 75 | 75 | 75 |
e = Morgan Stanley Research Estimates
Source: Morgan Stanley Research, Company Data M Idea
Risk Reward Reference links
- View explanation of Options Probabilities methodology -
Options_Probabilities_Exhibit_Link.pdf
- View descriptions of Risk Rewards Themes - RR_Themes_Exhibit_Link.pdf
-
View explanation of regional hierarchies - GEG_Exhibit_Link.pdf
-
View explanation of Theme/Exposure methodology -
ESG_Sustainable_Solutions_External_Link.pdf
- View explanation of ERS methodology - ESG_ ERS_External_Link.pdf
M Idea