PDF 原檔:報告_GS_鴻勁7769_20260730_original.pdf
圖片清單(已驗證 2026-07-31)
| 檔名 | size | 分類 | 親眼所見內容 |
|---|---|---|---|
260730_gs_hon-precision_009.png |
69.3KB | 真資料圖 | GS rating and stock price target history 圖:評等與目標價沿革標註 4000/5000/5700/12000,涵蓋 2023-2026,Covered by Evelyn Yu since Nov 23, 2025 |
260730_gs_hon-precision_005.png |
50.2KB | 真資料圖 | Taiex vs. Hon Precision 股價走勢對照圖(雙軸,Nov-24 至 Jul-26) |
260730_gs_hon-precision_007.png |
48.5KB | 真資料圖 | Forward P/E band 圖(10x-50x 區間線+股價,Nov-24 至 Jul-26) |
260730_gs_hon-precision_008.png |
40.8KB | 真資料圖 | P/B vs. ROE 圖(ROE 長條圖+Fwd P/B 折線雙軸) |
260730_gs_hon-precision_006.png |
47.5KB | 真資料圖 | Forward P/B 圖(5x-16x 區間線+股價) |
260730_gs_hon-precision_002.png |
40.5KB | 真資料圖 | Price Performance 圖:7769.TW vs Taiwan SE Weighted Index,含 3m/6m/12m 絕對與相對報酬率表 |
260730_gs_hon-precision_003.png |
26.8KB | 真資料圖 | Revenue(NT$mn)長條圖+YoY% 折線,2024-2028E |
260730_gs_hon-precision_004.png |
16.7KB | 真資料圖 | GM/OpM 毛利率與營益率趨勢折線圖,2024-2028E |
260730_gs_hon-precision_001.png |
21.4KB | 真資料圖 | GS Factor Profile 雷達/橫條圖:Growth/Financial Returns/Multiple/Integrated 四構面百分位排名(相對 Asia ex. Japan 與 Taiwan Semiconductor) |
原始內容
For the exclusive use of KEVINLU@LENOVO.COM
Hon Precision (7769.TW)
Earnings Review: 2Q26 GM below; stronger customer demand into 2027 with higher content growth outlook; reiterate Buy
7769.TW
12m Pri c e Target:
NT$12,500.00
Pri c e:
NT$5,620.00
Upside:
122.4%
Hon Precision hosted its 2Q26 analyst meeting on 30 July. Overall, management reiterated its con fi dence in its growth outlook and has secured multiple projects with strong customer order forecasts into 2027. The company reiterated its target of growing capacity by 50% for 2027 . One of the key upside surprises, in our view, was the strong content value growth-driven by a much faster large-package solution penetration, which carries 20-25% higher ASP (vs. mainstream GPU handler solution) and is expected to reach 20-30%/50% of penetration in 1H27/2H27 , as customers prepare ahead of growing AI chip package sizes. Overall, on the back of solid customer demand and stronger-than-expected content value growth, we tweak up Hon's 2028E earnings by 4% and raise our 12m TP to NT$12,500 from NT$12,000. With 122% implied upside, we reiterate our Buy rating on Hon Precision.
50% of capacity expansion target in 2027 backed by strong demand outlook
During the meeting, management shared that 1H26 capacity has increased 45% YoY and guided that full-year 2026 capacity expansion is likely to exceed prior guidance of 40% YoY . However, even under this more aggressive expansion, management still sees supply falling short by year-end 2026, with capacity already planned out through 1Q27. For full-year 2027, the company reiterated its target to further expand its capacity by 50% YoY , primarily across Taiwan and mainland China sites. Management sees strong demand driven by 1) the ramp of new OSAT plants in Arizona and South East Asia; 2) strong demand from automotive and US EV giant's AI chip in 2027; 3) robust demand from mainland China with demand shifting towards higher end handlers; and 4) AI ASIC demand, which is expected to exceed GPU in 2027 - on the spec side, thermal requirements step up from roughly 3kW before to up to 10kW in 2027-28 (for both FT and SLT), lifting ASP by ~20%.
BUY
Evelyn Yu
+886(2)2730-4187 | evelyn.yu@gs.com Goldman Sachs (Asia) L.L.C., Taipei Branch
Ryan Huang, CFA
+886(2)2730-4084 | ryan.huang@gs.com Goldman Sachs (Asia) L.L.C., Taipei Branch
Key Data _____________________________________
Market cap: NT$1.0tr / $31.2bn
Enterprise value: NT$959.8bn / $29.6bn
3m ADTV: NT$5.6bn / $177.9mn
Taiwan
Taiwan Semiconductor
M&A Rank: 3
Leases incl. in net debt & EV?: Yes
| GS Forecast | 12/25 | __________ 12/26E | 12/27E | 12/28E |
|---|---|---|---|---|
| Revenue(NT$mn) New | 30,270.6 | 56,807.8 | 106,071.4 | 182,430.4 |
| Revenue (NT$ mn) Old | 30, 2 70.6 | 58,0 2 4.7 | 103,014.8 | 171,453.9 |
| EBITDA (NT$ mn) | 15,114.3 | 2 8,613. 2 | 56,376.9 | 100,340.0 |
| EPS(NT$) New | 75.71 | 130.55 | 251.16 | 443.86 |
| EPS (NT$) Old | 75.71 | 136.57 | 2 49.97 | 4 2 6.09 |
| P/E (X) | 2 0.7 | 43.0 | 22 .4 | 1 2 .7 |
| P/B (X) | 4.9 | 13.9 | 9.9 | 6.7 |
| Dividend yield (%) | 3.4 | 1.6 | 3.1 | 5.5 |
| CROCI (%) | 3 2 0. 2 | 175.1 | 16 2 . 2 | 70.5 |
| 6/26 | 9/26E | 12/26E | 3/27E | |
| EPS (NT$) | 30.44 | 35.64 | 38.77 | 49.03 |
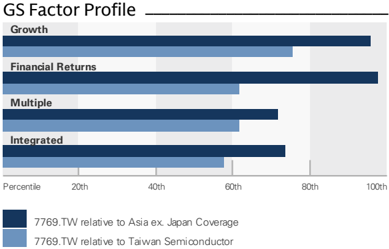
Source: Company data, Goldman Sachs Research estimates. See disclosures for details.
Goldman Sachs does and seeks to do business with companies covered in its research reports. As a result, investors should be aware that the fi rm may have a con fl ict of interest that could a ff ect the objectivity of this report. Investors should consider this report as only a single factor in making their investment decision. For Reg AC certi fi cation and other important disclosures, see the Disclosure Appendix, or go to www.gs.com/research/hedge.html. Analysts employed by non-US a ffi liates are not registered/quali fi ed as research analysts with FINRA in the U.S.
e92c7a75ab8b4efbba794e6b187208c8
For the exclusive use of KEVINLU@LENOVO.COM
BUY
Hon Precision (7769.TW)
Rating since Nov 23, 2025
Ratios & Valuation __________________________________________
| 12/25 | 12/26E | 12/27E | 12/28E | |
|---|---|---|---|---|
| P/E (X) | 20.7 | 43.0 | 22.4 | 1 2.7 |
| P/B (X) | 4.9 | 1 3.9 | 9.9 | 6.7 |
| FCF yield (%) | 6.2 | 1 .4 | 3.3 | 6.4 |
| EV/EBITDAR (X) | 1 3.4 | 33.5 | 1 6.7 | 9. 1 |
| EV/EBITDA (excl. leases) (X) | 1 3.4 | 33.5 | 1 6.7 | 9. 1 |
| CROCI (%) | 320.2 | 1 75. 1 | 1 62.2 | 70.5 |
| ROE (%) | 34.5 | 35.9 | 5 1 .8 | 63.5 |
| Net debt/equity (%) | (92. 1 ) | (70.4) | (67.0) | (67.2) |
| Net debt/equity (excl. leases) (%) | (92. 1 ) | (70.4) | (67.0) | (67.2) |
| Interest c ov er (X) | 1 9 , 849.2 | 37 , 645.0 | 79 , 996. 1 | 1 4 1,1 3 1 .7 |
| Days in v ent o ry o utst , sales | 1 27. 1 | 1 25.8 | 1 20.6 | 288.9 |
| Recei v able days | 35.3 | 29.0 | 28.7 | 76.3 |
| Days p ayable o utstandin g | 1 4 1 .8 | 1 49.4 | 1 57. 1 | 384.5 |
| DuP o nt ROE (%) | 2 1 .3 | 32.2 | 44.4 | 53.3 |
| Turn ov er (X) | 0.4 | 0.6 | 0.8 | 0.9 |
| L e v era g e (X) | 1 .3 | 1 .3 | 1 .3 | 1 .3 |
| G r o ss cas h in v ested (ex cas h ) (NT $ ) | 4 ,1 68.7 | 2 1, 496.9 | 33 , 682.4 | 1 9 1, 777.7 |
| A v era g e ca p ital e mp l o yed (NT $ ) | 6 , 234.0 | 1 3 , 078.6 | 27 , 576.4 | 4 1, 378. 1 |
| BVP S (NT $ ) | 322.52 | 405.32 | 565. 1 0 | 833. 1 5 |
Growth & Margins (%) ______________________________________
| 12/25 | 12/26E | 12/27E | 12/28E | |
|---|---|---|---|---|
| Total revenue growth | 116. 3 | 87.7 | 86.7 | 72.0 |
| EBITDA growth | 1 3 8.8 | 8 9 . 3 | 9 7.0 | 78.0 |
| EPS growth | 12 9 .8 | 72.4 | 9 2.4 | 76.7 |
| DPS growth | 1 33 . 9 | 72.4 | 9 2.4 | 76.7 |
| EBIT m argin | 4 9 .7 | 50.2 | 5 3 .0 | 54. 9 |
| EBITDA m argin | 4 9 . 9 | 50.4 | 5 3 .1 | 55.0 |
| Net inco m e m argin | 40.8 | 41. 3 | 42.6 | 4 3 .8 |
Price Performance __________________________________________
Absolute
Rel. to the Taiwan SE Weighted Index
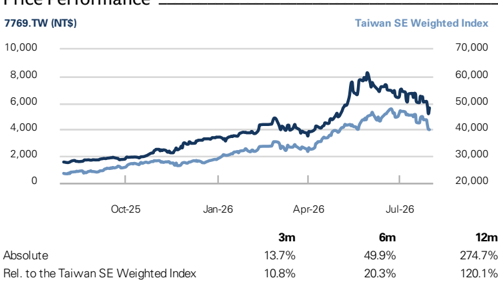
Source: FactSet. Price as of 30 Jul 2026 close.
Income Statement (NT$ mn) ________________________________
| 12/25 | 12/26E | 12/27E | 12/28E | |
|---|---|---|---|---|
| To t a l r e v e nu e | 30,270.6 | 56,807.8 | 106,071.4 | 182,430.4 |
| Co s t of good s s old | (13,157.0) | (24,747.2) | (44,991.4) | (75,474.3) |
| SG&A | (1,028.5) | (1,640.7) | (2,151.9) | (3,113.8) |
| R&D | (1,039.5) | (1,926.9) | (2,690.3) | (3,661.4) |
| Other operating inc./(exp.) | -- | -- | -- | -- |
| E BITDA | 15 , 11 4.3 | 28 , 61 3. 2 | 56 ,3 76 .9 | 1 00,340.0 |
| Depreciation& amortization | (68.6) | (120.0) | (139.1) | (159.1) |
| E BIT | 15 ,04 5 . 7 | 28 ,493. 1 | 56 , 2 3 7 . 8 | 1 00, 18 0.9 |
| Net intere s t inc./(exp.) | 306.4 | 780.6 | 720.2 | 727.3 |
| Income/(lo ss ) from a ss ociate s | -- | -- | -- | -- |
| Pre-tax pro fi t | 15 , 58 4. 2 | 2 9, 5 30.9 | 56 ,9 58 .0 | 1 00,90 8 . 2 |
| Provi s ion for taxe s | (3,222.4) | (6,041.6) | (11,767.6) | (21,043.8) |
| Minority intere s t | -- | -- | -- | -- |
| Preferred dividend s | -- | -- | -- | -- |
| N et inc . ( pre-ex c ept i o n a ls) | 12 ,3 61 . 8 | 2 3,4 8 9.3 | 4 5 , 1 90.3 | 7 9, 86 4.4 |
| Po s t-tax exceptional s | -- | -- | -- | -- |
| N et inc . ( po s t-ex c ept i o n a ls) | 12 ,3 61 . 8 | 2 3,4 8 9.3 | 4 5 , 1 90.3 | 7 9, 86 4.4 |
| E P S(b a sic , pre-ex c ept ) (N T $) | 75 . 71 | 1 30. 55 | 251 . 16 | 443. 86 |
| E P S(dilu te d , pre-ex c ept ) (N T $) | 75 . 5 4 | 1 30. 55 | 251 . 16 | 443. 86 |
| E P S(b a sic , po s t-ex c ept ) (N T $) | 75 . 71 | 1 30. 55 | 251 . 16 | 443. 86 |
| E P S(dilu te d , po s t-ex c ept ) (N T $) | 75 . 5 4 | 1 30. 55 | 251 . 16 | 443. 86 |
| DPS (NT$) | 53.00 | 91.39 | 175.81 | 310.70 |
| Div. payout ratio (%) | 70.0 | 70.0 | 70.0 | 70.0 |
| Balance Sheet (NT$ mn) | ______ | |||
| 12/25 | 12/26E | 12/27E | 12/28E | |
| C a sh& c a sh equiv a lents | 53,427.0 | 51,377.0 | 68,078.4 | 100,752.4 |
| Accounts receiv a ble | 2,934.5 | 6,100.2 | 10,584.7 | 65,703.8 |
| Inventory | 12,641.1 | 26,530.6 | 43,563.0 | 245,235.7 |
| Other current a ssets | 1,192.7 | 9,075.8 | 9,075.8 | 36,303.3 |
| Total current assets | 7 0, 1 9 5 .3 | 93,0 8 3. 5 | 1 3 1 ,30 2 .0 | 1 9 1 ,09 8 . 5 |
| Net PP&E | 2,105.8 | 2,626.6 | 2,835.5 | 11,845.9 |
| Net int a ngibles | 34.5 | 53.7 | 65.8 | 267.8 |
| Tot a l investments | 173.6 | 211.8 | 211.8 | 847.1 |
| Other long-term a ssets | 760.9 | 587.0 | 587.0 | 2,348.1 |
| Total assets | 7 3, 27 0. 1 | 9 6 , 562 . 7 | 1 3 5 ,00 2 . 1 | 1 9 4 ,999. 6 |
| Accounts p a y a ble | 5,724.7 | 14,532.9 | 24,184.4 | 134,838.0 |
| Short-term debt | -- | -- | -- | -- |
| Short-term le a se li a bilities | -- | -- | -- | -- |
| Other current li a bilities | 9,303.2 | 8,803.4 | 8,843.4 | 35,473.6 |
| Total current liabilities | 15 ,0 27 .9 | 2 3,33 6 .3 | 33,0 27 . 8 | 44 , 7 9 4 . 2 |
| Long-term debt | -- | -- | -- | -- |
| Long-term le a se li a bilities | -- | -- | -- | -- |
| Other long-term li a bilities | 211.1 | 296.3 | 296.3 | 1,185.3 |
| Total long-term liabilities | 211 . 1 | 2 9 6 .3 | 2 9 6 .3 | 1 , 185 .3 |
| Total liabilities | 15 , 2 39.0 | 2 3, 6 3 2 . 6 | 33,3 24 . 1 | 45 ,090. 5 |
| Preferred sh a res | -- | -- | -- | -- |
| Tot a l commonequity | 58,031.1 | 72,930.1 | 101,677.9 | 149,909.1 |
| Minority interest | -- | -- | -- | -- |
| Total liabilities &equity | 7 3, 27 0. 1 (53,427.0) | 9 6 , 562 . 7 (51,377.0) | 1 3 5 ,00 2 . 1 (68,078.4) | 1 9 4 ,999. 6 (100,752.4) |
| Net debt, a djusted |
Cash Flow (NT$ mn) ________________________________________
| Cash Flow (NT$ mn) | 12/25 | 12/26E | 12/27E | 12/28E |
|---|---|---|---|---|
| Net income | 12,361 . 8 | 23,489 . 3 | 45,190 . 3 | 79,864 . 4 |
| D&Aadd-back | 68 . 6 | 120 . 0 | 139 . 1 | 159 . 1 |
| Minority interest add-back | -- | -- | -- | -- |
| Net (inc)/dec w orking capital | (2,990 . 5) | (8,246 . 8) | (11,865 . 5) | (15,396 . 2) |
| Other operating cash flo w | 6,745 . 9 | (519 . 9) | -- | -- |
| Cash flow fro m operations | 16 , 185 . 8 | 1 4, 8 4 2 . 6 | 33,4 6 3. 9 | 6 4, 627 .3 |
| Capital expenditures | (285 . 7) | (725 . 0) | (320 . 0) | (320 . 0) |
| Acquisitions | -- | -- | -- | -- |
| Divestitures | -- | -- | -- | -- |
| Others | 854 . 3 | (7,515 . 7) | -- | -- |
| Cash flow fro m investing | 568 . 6 | ( 8 , 2 40. 7 ) | (3 2 0.0) | (3 2 0.0) |
| Repayment of lease liabilities | -- | -- | -- | -- |
| Dividends paid(common& pref) | (3,636 . 0) | (8,653 . 3) | (16,442 . 5) | (31,633 . 2) |
| Inc/(dec) in debt | (151 . 7) | -- | -- | -- |
| Other financing cash flo w s | 34,435 . 7 | 1 . 3 | 0 . 0 | 0 . 0 |
| Cash flow fro m financing | 30, 6 4 8 .0 | ( 8 , 651 . 9 ) | ( 16 ,44 2 . 5 ) | (3 1 , 6 33. 2 ) |
| Total cash flow | 4 7 ,40 2 .4 | ( 2 ,0 5 0.0) | 16 , 7 0 1 .4 | 3 2 , 67 4.0 |
| Free cash flo w | 15,900 . 1 | 14,117 . 6 | 33,143 . 9 | 64,307 . 3 |
Source: Company data, Goldman Sachs Research estimates.
e92c7a75ab8b4efbba794e6b187208c8
For the exclusive use of KEVINLU@LENOVO.COM
Large package solution adoption faster than expected
One of the key highlights of the meeting was Hon's large package solution, which is expected to start shipping in October 2026, with penetration anticipated to rise rapidly in 2027. As next-generation AI chips continue to grow in size, they no longer fi t within the current JEDEC tray and will instead require a mega tray, which can accommodate chips larger than 120mm x 150mm. Hon's large package solution can support both mega tray and JEDEC tray with automation and advanced ATC, and given its much higher spec, management expects ASP for the large package solution to be 20-25% higher vs. the current mainstream handler for GPU. The company now sees all end-customers engaging in discussions on large package solution adoption, and it now anticipates the solution to account for 20-30% of shipments in 1H27, and to rise rapidly to over 50% in 2H27 .
Multiple growth drivers across FT and SLT
Hon Precision now sees multiple opportunities across Final Test (FT) and System-level Test (SLT). The company is seeing strong demand from its US EV customer, whose AI chip has adopted Hon's highest-tier handler for both FT and SLT. For Hon's US CPU customer, we believe it will ship both FT and SLT handlers for the customer's next-generation general server CPU starting 2H26, with shipments likely reaching triple digits units in 2027. For AI ASIC, management now expects FT handlers for TPU to ship in high volume in 2H26, with potentially triple-digit units of handler demand in 2027 based on customers' forecast.
Mainland China market no longer a margin drag
Mainland China is emerging as one of Hon's fastest-growing end markets. Management sees trend for mainland China customers shifting demand towards higher end handler in order to better deal with the more challenging thermal requirements. To recall, one of the reasons for Hon Precision's 4Q26 GM miss was due to the higher mix from lower-margin mainland China business, so investors were worried on the potential impact on margin dilution. However, management guided that the mainland China business is no longer GM-dilutive and now runs on par with its US/EU customers. Overall, management now guides its mainland China revenue is expected to grow 60-80% YoY in 2026 and accelerate to above 100% YoY in 2027 .
Solid market share help ease investor concerns
Some investors had previously worried that Hon Precision might lose CPU SLT share at its US CPU customer against its key peer. Management reiterated its con fi dence and said that all the customer's CPU SLT handlers remain at Hon Precision, with triple-digit units or even more aggressive handler demand from customer. On the same customer's GPU SLT, quali fi cation is currently underway in Penang, and management is con fi dent of completing it as soon as possible. In addition, Hon Precision remains on track for a US GPU customer's SLT program, having already completed fi rst stage engineering sample quali fi cation. We believe these developments should ease investor concern over potential share loss, and we view the US GPU SLT opportunity as a potential upside to its growth outlook.
e92c7a75ab8b4efbba794e6b187208c8
For the exclusive use of KEVINLU@LENOVO.COM
2Q26 results recap, charts, and valuations
2Q26 GM below GSe/cons.
Hon Precision's 2Q26 revenue of NT$13.8bn (+29% QoQ, +100% YoY) came in inline with GSe but 10% higher vs. Bloomberg consensus, driven by robust AI/HPC testing demand. Margin-wise, 2Q26 GM of 56.1% was below GSe/cons. forecasts of 57.2%/56.9%, which we attribute to changes in product and client mix. For opex, the company's 2Q26 opex ratio of 7.6% was slightly higher vs. GSe/consensus of 5.3%/6.5%, and it is primarily due to a one-o ff treasury stock transfer expense incurred in May. As a result, Hon Precision's 2Q26 EPS of NT$30.44 came in slightly below GSe of NT$31.16, yet still ahead of Bloomberg consensus of NT$29.13.
Exhibit 1: 2Q26 results summary
| 2Q26 | 1Q26 | 2Q25 | %QoQ | %YoY | GS prev. | %Diff | Consensus | %Diff | |
|---|---|---|---|---|---|---|---|---|---|
| (NT$mn) | |||||||||
| Revenue | 13,794 | 10,725 | 6,885 | 28.6% | 100.4% | 13,679 | 0.8% | 12,546 | 9.9% |
| Gross profit | 7,737 | 6,032 | 4,037 | 28.3% | 91.6% | 7,824 | -1.1% | 7,134 | 8.5% |
| Op. income | 6,686 | 5,360 | 3,643 | 24.7% | 83.5% | 7,095 | -5.8% | 6,319 | 5.8% |
| Net income | 5,476 | 4,624 | 2,466 | 18.4% | 122.1% | 5,607 | -2.3% | 5,140 | 6.5% |
| EPS (NT$) | 30.44 | 25.70 | 15.26 | 18.4% | 99.4% | 31.16 | -2.3% | 29.13 | 4.5% |
| GM | 56.1% | 56.2% | 58.6% | -0.2% | -2.6% | 57.2% | -1.1% | 56.9% | -0.8% |
| OpM | 48.5% | 50.0% | 52.9% | -1.5% | -4.4% | 51.9% | -3.4% | 50.4% | -1.9% |
| NM | 39.7% | 43.1% | 35.8% | -3.4% | 3.9% | 41.0% | -1.3% | 41.0% | -1.3% |
Source: Company data, Bloomberg, Goldman Sachs Global Investment Research
Exhibit 2: Hon Precision's revenue growth outlook
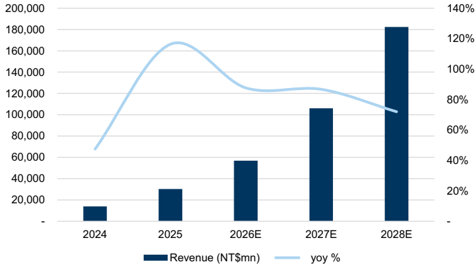
Source: Company data, Goldman Sachs Global Investment Research
Exhibit 3: Hon Precision's margin trend
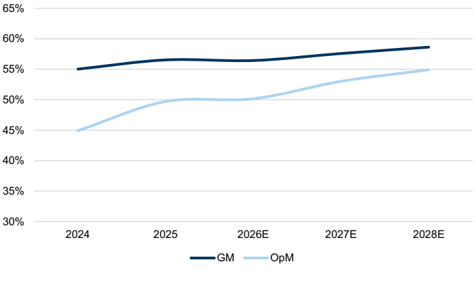
Source: Company data, Goldman Sachs Global Investment Research
e92c7a75ab8b4efbba794e6b187208c8
For the exclusive use of KEVINLU@LENOVO.COM
Earnings changes, valuation and risks
Forecast changes
After incorporating 2Q26 preliminary results, we revise our 2026-2028E EPS by -4.4%/0.5%/4.2% mainly as we factor in 1) lower 2Q26 bottom line result, and 2) stronger content value growth from large package solution mainly for 2027-2028E.
Exhibit 4: Earnings revisions
| 2026E | 2026E | 2026E | 2027E | 2027E | 2027E | 2028E | 2028E | 2028E | |
|---|---|---|---|---|---|---|---|---|---|
| (NT$mn) | Old | New | Diff (%) | Old | New | Diff (%) | Old | New | Diff (%) |
| Revenue | 58,025 | 56,808 | -2.1% | 103,015 | 106,071 | 3.0% | 171,454 | 182,430 | 6.4% |
| Gross profit | 33,416 | 32,061 | -4.1% | 61,184 | 61,080 | -0.2% | 103,517 | 106,956 | 3.3% |
| Op. income | 30,288 | 28,493 | -5.9% | 56,572 | 56,238 | -0.6% | 96,935 | 100,181 | 3.3% |
| Net income | 24,574 | 23,489 | -4.4% | 44,977 | 45,190 | 0.5% | 76,666 | 79,864 | 4.2% |
| EPS (NT$) | 136.57 | 130.55 | -4.4% | 249.97 | 251.16 | 0.5% | 426.09 | 443.86 | 4.2% |
| GM | 57.6% | 56.4% | -1.2% | 59.4% | 57.6% | -1.8% | 60.4% | 58.6% | -1.7% |
| OpM | 52.2% | 50.2% | -2.0% | 54.9% | 53.0% | -1.9% | 56.5% | 54.9% | -1.6% |
| NM | 42.4% | 41.3% | -1.0% | 43.7% | 42.6% | -1.1% | 44.7% | 43.8% | -0.9% |
| 3Q26E | 3Q26E | 3Q26E | 4Q26E | 4Q26E | 4Q26E | 1Q27E | 1Q27E | 1Q27E | |
|---|---|---|---|---|---|---|---|---|---|
| (NT$mn) | Old | New | Diff (%) | Old | New | Diff (%) | Old | New | Diff (%) |
| Revenue | 15,854 | 15,426 | -2.7% | 17,766 | 16,863 | -5.1% | 21,113 | 20,965 | -0.7% |
| Gross profit | 9,129 | 8,719 | -4.5% | 10,431 | 9,573 | -8.2% | 12,489 | 11,989 | -4.0% |
| Op. income | 8,315 | 7,853 | -5.6% | 9,517 | 8,594 | -9.7% | 11,474 | 10,917 | -4.9% |
| Net income | 6,718 | 6,412 | -4.5% | 7,625 | 6,977 | -8.5% | 9,202 | 8,823 | -4.1% |
| EPS (NT$) | 37.34 | 35.64 | -4.5% | 42.38 | 38.77 | -8.5% | 51.14 | 49.03 | -4.1% |
| GM | 57.6% | 56.5% | -1.1% | 58.7% | 56.8% | -1.9% | 59.2% | 57.2% | -2.0% |
| OpM | 52.4% | 50.9% | -1.5% | 53.6% | 51.0% | -2.6% | 54.3% | 52.1% | -2.3% |
| NM | 42.4% | 41.6% | -0.8% | 42.9% | 41.4% | -1.5% | 43.6% | 42.1% | -1.5% |
Source: Goldman Sachs Global Investment Research
Maintain Buy; TP up to NT$12,500 from NT$12,000
As a result of our upward earnings revisions, we raise our 12-month TP to NT$12,500 (from NT$12,000 previously). Our 12-month TP is based on 32x 2028E P/E (unchanged) discounted back to 2027E at a 13.6% CoE to arrive at our TP of NT$12,500. Our key assumptions for CoE include: (1) 1.5x beta (sourcing Bloomberg), (2) a 4.25% risk-free rate (inline with GS house view), and (3) a market risk premium of 6.25% (in line with GS house view). We adopt the 2028E discounted P/E method as we believe it best re fl ects Hon Precision's clear capacity expansion plan for the next several years with strong demand visibility. Overall, our new TP implies c.122% upside from the current share price, and we reiterate our Buy rating on Hon Precision.
e92c7a75ab8b4efbba794e6b187208c8
For the exclusive use of KEVINLU@LENOVO.COM
Exhibit 5: Hon Precision's P&L overview
| 1Q26 | 2Q26E | 3Q26E | 4Q26E | 1Q27E | 2Q27E | 3Q27E | 4Q27E | 2026E | 2027E | 2028E | |
|---|---|---|---|---|---|---|---|---|---|---|---|
| P&L | |||||||||||
| Revenue | 10,725 | 13,794 | 15,426 | 16,863 | 20,965 | 24,258 | 28,803 | 32,046 | 56,808 | 106,071 | 182,430 |
| Gross profit | 6,032 | 7,737 | 8,719 | 9,573 | 11,989 | 13,906 | 16,619 | 18,566 | 32,061 | 61,080 | 106,956 |
| Operating profit | 5,360 | 6,686 | 7,853 | 8,594 | 10,917 | 12,731 | 15,347 | 17,243 | 28,493 | 56,238 | 100,181 |
| Net income | 4,624 | 5,476 | 6,412 | 6,977 | 8,823 | 10,234 | 12,354 | 13,780 | 23,489 | 45,190 | 79,864 |
| EPS (NT$) | 25.70 | 30.44 | 35.64 | 38.77 | 49.03 | 56.88 | 68.66 | 76.58 | 130.55 | 251.16 | 443.86 |
| Margins (%) | |||||||||||
| GM | 56.2% | 56.1% | 56.5% | 56.8% | 57.2% | 57.3% | 57.7% | 57.9% | 56.4% | 57.6% | 58.6% |
| OpM | 50.0% | 48.5% | 50.9% | 51.0% | 52.1% | 52.5% | 53.3% | 53.8% | 50.2% | 53.0% | 54.9% |
| NM | 43.1% | 39.7% | 41.6% | 41.4% | 42.1% | 42.2% | 42.9% | 43.0% | 41.3% | 42.6% | 43.8% |
| YoY (%) | |||||||||||
| Revenue | 81.4% | 100.4% | 88.2% | 81.8% | 95.5% | 75.9% | 86.7% | 90.0% | 87.7% | 86.7% | 72.0% |
| Gross profit | 72.6% | 91.6% | 84.3% | 97.3% | 98.8% | 79.7% | 90.6% | 93.9% | 87.3% | 90.5% | 75.1% |
| Operating profit | 71.1% | 83.5% | 88.5% | 109.4% | 103.7% | 90.4% | 95.4% | 100.6% | 89.4% | 97.4% | 78.1% |
| Net income | 80.1% | 122.1% | 77.3% | 88.0% | 90.8% | 86.9% | 92.7% | 97.5% | 90.0% | 92.4% | 76.7% |
| EPS | 61.8% | 99.4% | 59.2% | 70.6% | 90.8% | 86.9% | 92.7% | 97.5% | 72.4% | 92.4% | 76.7% |
| QoQ (%) | |||||||||||
| Revenue | 15.6% | 28.6% | 11.8% | 9.3% | 24.3% | 15.7% | 18.7% | 11.3% | |||
| Gross profit | 24.3% | 28.3% | 12.7% | 9.8% | 25.2% | 16.0% | 19.5% | 11.7% | |||
| Operating profit | 30.6% | 24.7% | 17.4% | 9.4% | 27.0% | 16.6% | 20.5% | 12.4% | |||
| Net income | 24.6% | 18.4% | 17.1% | 8.8% | 26.5% | 16.0% | 20.7% | 11.5% | |||
| EPS | 13.1% | 18.4% | 17.1% | 8.8% | 26.5% | 16.0% | 20.7% | 11.5% |
Source: Company data, Goldman Sachs Global Investment Research
Exhibit 6: Taiex vs. Hon Precision
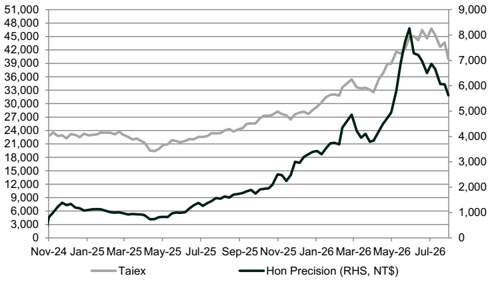
Source: Bloomberg
Exhibit 8: Forward P/B
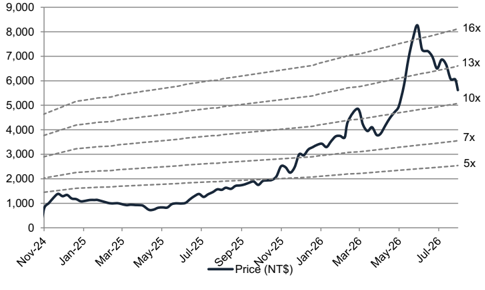
Source: Bloomberg
Exhibit 7: Forward P/E
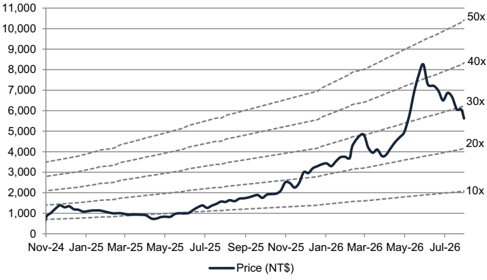
Source: Bloomberg
Exhibit 9: P/B vs. ROE
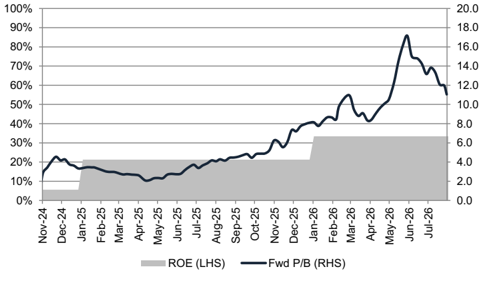
Source: Bloomberg
e92c7a75ab8b4efbba794e6b187208c8
For the exclusive use of KEVINLU@LENOVO.COM
Investment Thesis, Price Target Risks and Methodology
Investment Thesis - Hon Precision (7769.TW)
Hon Precision is a leading Taiwan-based semiconductor testing equipment provider specializing in test handler and Active Thermal Control (ATC) system, which are widely adopted in Final Test (FT) and System-Level Test (SLT). Hon Precision enjoys >90% of market share in the FT handler market for AI/HPC applications, enabling it to fully capture growth in both AI GPU and AI ASICs.
We like Hon Precision as we expect its revenue/earnings to accelerate in coming years driven by 1) growth in AI GPU/ASIC volume, 2) larger chip package size, 3) longer testing time, 4) higher power and thermal requirements, 5) rising adoption of SLT among AI ASICs, and 6) shorter chip upgrade cadence. Hon Precision shares are trading at a lower valuation versus its Taiwan/global peers in terms of forward P/E. We view the company as one of the most attractive names within our TW Advanced Semi Testing coverage, with meaningful re-rating potential as the market begins to re fl ect its strong earnings growth outlook.
Price Target Risks and Methodology - Hon Precision (7769.TW)
Valuation: We are Buy rated on Hon Precision. Our 12-month TP of NT$12,500 is based on a target P/E of 32x (based on close peer correlation analysis) applied to our 2028E EPS, and discounted back to 2027E at 13.6% CoE. Our key assumptions for CoE include: (1) 1.5x beta, (2) a 4.25% risk-free rate, and (3) a market risk premium at 6.25%.
Key downside risks to our views: (1) softer AI/HPC demand, (2) slower adoption of SLT among AI ASICs, and (3) intensifying competition.
e92c7a75ab8b4efbba794e6b187208c8
For the exclusive use of KEVINLU@LENOVO.COM