PDF 原檔:報告_GS_穩懋3105_20260724_original.pdf
圖片清單(已驗證 2026-07-27)
範圍性驗證:逐張 Read 圖表類候選(003/005/006/007);001/002 為股價走勢與 Key Data 區塊、004 為 China cellular PA 市佔堆疊圖(未逐張 Read,未嵌入),008 為 P&L 表截圖。
| 檔名 | size | 分類 | 親眼所見內容 |
|---|---|---|---|
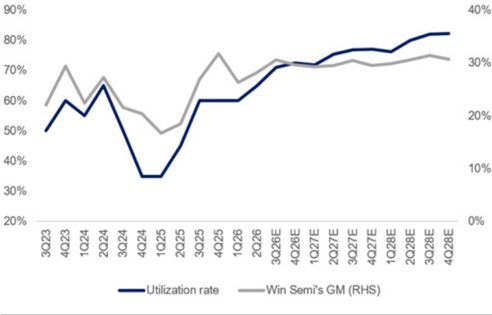
| 報告_GS_穩懋3105_20260724_003.png | 126KB | 真資料圖 | 折線雙軸圖,橫軸 3Q23→4Q28E。深藍線 Utilization rate 自 50% 起伏、4Q24 落至約 35%,其後回升至 2Q26 約 60%、2028E 逼近 82%;灰線 Win Semi's GM(右軸)由約 22% 降到 4Q24 約 18%,之後回升至 2028E 約 31% |
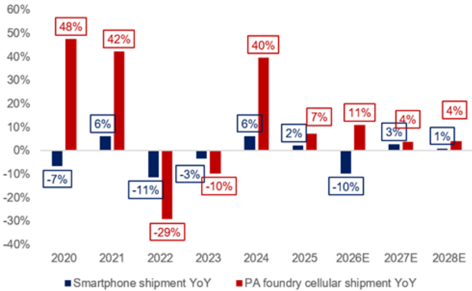
| 報告_GS_穩懋3105_20260724_005.png | 41KB | 真資料圖 | 雙色長條圖,橫軸 2020→2028E。深藍 Smartphone shipment YoY:-7%、6%、-11%、-3%、6%、2%、-10%、3%、1%;紅色 PA foundry cellular shipment YoY:48%、42%、-29%、-10%、40%、7%、11%、4%、4% |
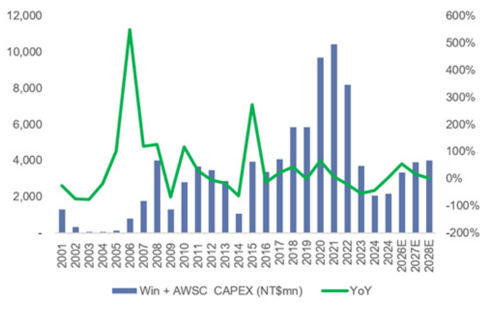
| 報告_GS_穩懋3105_20260724_006.png | 75KB | 真資料圖 | 長條+折線圖,橫軸 2001→2028E。藍柱為 Win + AWSC CAPEX(NT$mn),2021 年約 10,500 為高點,2023–2024 回落至約 2,000,2026E–2028E 回升至約 3,500–4,100;綠線為 YoY(右軸,-200%~600%) |
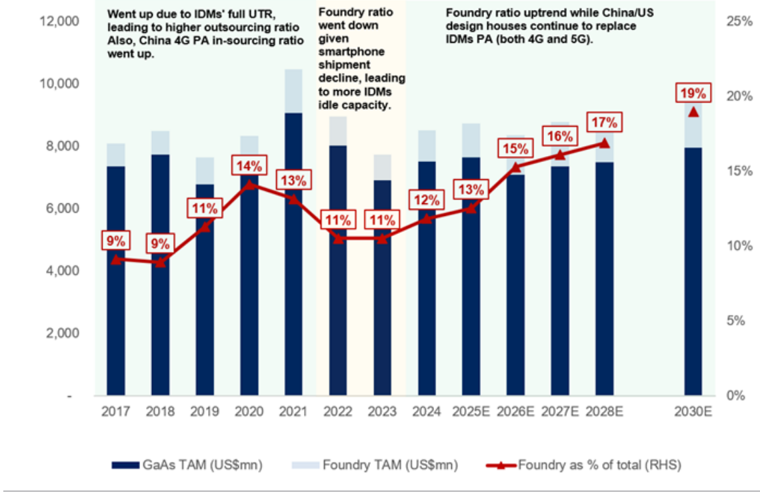
| 報告_GS_穩懋3105_20260724_007.png | 121KB | 真資料圖 | 堆疊柱+紅線圖,橫軸 2017→2028E 另加 2030E。柱為 GaAs TAM 與 Foundry TAM(US$mn,2021 高點約 10,500,2023 低點約 6,800,2028E 約 8,000、2030E 約 8,000);紅線 Foundry as % of total 由 2017 的 9% 上升到 2028E 17%、2030E 19%,圖上三段註記說明 2017-2021 IDM 滿載外包上升、2022-2023 手機出貨下滑使 IDM 有閒置產能、2024 之後中美設計公司持續取代 IDM PA |
原始內容
For the exclusive use of KEVINLU@LENOVO.COM
Win Semiconductors Corp. (3105.TWO)
Earnings Review: New optical product to ramp up in 2H26, higher margin but limited contribution; reiterate Sell
310 5 .TWO
12m Pri c e Target:
NT$142.00
Pri c e:
NT$341.
5
0
Downside:
5
8.4%
Win Semi's 2Q26 core business (operating income) was 56/5% higher than GSe/BBG consensus, mainly due to a more favorable product mix with higher contribution from high margin infrastructure business, which led to a 1.9ppt QoQ increase in 2Q26 GPM, and came in 0.4ppt above GSe but is 1.0ppt below BBG consensus. Win Semi's OPEX further declined to NT$743mn (vs. NT$778mn in 1Q26). NI was 114/52% higher than GSe/BBG consensus due to the NT$447mn recognized in non-operating income (account for 38% of total pretax income).
For 3Q26, the company expects revenue to increase by low teens QoQ, and expects optical business to deliver the strongest growth driven by the ramp up of new PD (photodiodes) products at the end of 2Q26, infrastructure should also see strong growth, while cellular and WiFi business might see fl attish to slight QoQ increase. On GM, the company guides the 3Q26 level to be around low-thirties %, which is better than our prior expectation but is in line with BBG consensus of 31.3%. Management indicated 2Q26 UTR to be higher at 65% (was 60% in 1Q26), with no guidance for 3Q26, and we expect UTR to further increase to ~70%.
Win Semi continued to highlight the company's progress with its AI-related business, expecting shipments of new PD (photodiodes) products for a single client to ramp up in 2H26. For new LD (laser diodes) products, the company is currently engaged with multiple clients on several new solutions (including CW laser and EML solutions), but expects to see more contribution in 2027/28. The company mentioned that CAPEX this year will mainly focus on expanding InP and GaN capacity for the datacom optical and infrastructure business. Overall, management now expect that the AI-related business might reach double-digits of total revenue in 2027 and potentially reach a similar scale as the cellular and infrastructure business in the long term (each at 30-35% in 2Q26).
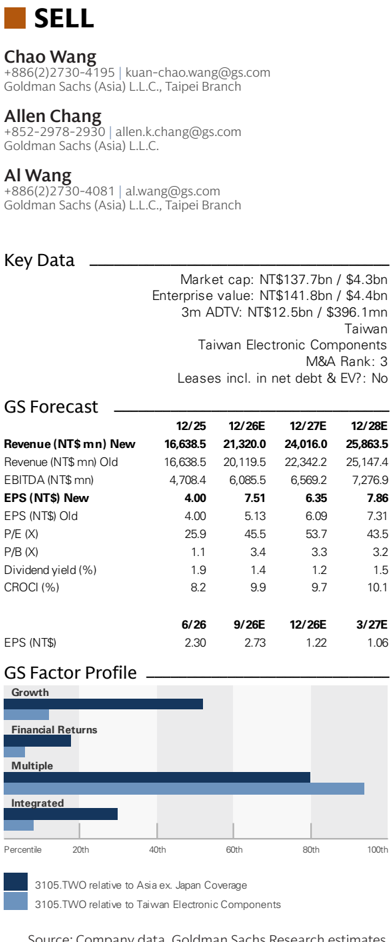
Key Data _____________________________________
Market cap: NT$137.7bn / $4.3bn
Enterprise value: NT$141.8bn / $4.4bn
3m ADTV: NT$12.5bn / $396.1mn
Taiwan
Taiwan Electronic Components
M&A Rank: 3
Leases incl. in net debt & EV?: No
| GS Forecast | 12/25 | __________ 12/26E | 12/27E | 12/28E |
|---|---|---|---|---|
| Revenue(NT$mn) New | 16,638.5 | 21,320.0 | 24,016.0 | 25,863.5 |
| Revenue (NT$ mn) Old | 16,638.5 | 20,119.5 | 22,342.2 | 25,147.4 |
| EBIT D A(NT$ mn) | 4,708.4 | 6,085.5 | 6,569.2 | 7,276.9 |
| EPS(NT$) New | 4.00 | 7.51 | 6.35 | 7.86 |
| EPS (NT$) Old | 4.00 | 5.13 | 6.09 | 7.31 |
| P/E (X) | 25.9 | 45.5 | 53.7 | 43.5 |
| P/B (X) | 1.1 | 3.4 | 3.3 | 3.2 |
| D ividend yield (%) | 1.9 | 1.4 | 1.2 | 1.5 |
| CROCI (%) | 8.2 | 9.9 | 9.7 | 10.1 |
| 6/26 | 9/26E | 12/26E | 3/27E | |
| EPS (NT$) | 2.30 | 2.73 | 1.22 | 1.06 |
Source: Company data, Goldman Sachs Research estimates. See disclosures for details.
Goldman Sachs does and seeks to do business with companies covered in its research reports. As a result, investors should be aware that the fi rm may have a con fl ict of interest that could a ff ect the objectivity of this report. Investors should consider this report as only a single factor in making their investment decision. For Reg AC certi fi cation and other important disclosures, see the Disclosure Appendix, or go to www.gs.com/research/hedge.html. Analysts employed by non-US a ffi liates are not registered/quali fi ed as research analysts with FINRA in the U.S.
e92c7a75ab8b4efbba794e6b187208c8
For the exclusive use of KEVINLU@LENOVO.COM
SELL
Win Semiconductors Corp. (3105.TWO) Rating since Dec 2, 2024
Ratios & Valuation __________________________________________
| 12/25 | 12/26E | 12/27E | 12/28E | |
|---|---|---|---|---|
| P/E (X) | 25.9 | 45.5 | 53.7 | 43.5 |
| P/B (X) | 1.1 | 3.4 | 3.3 | 3.2 |
| FCF yield (%) | 7.4 | 1.5 | 1.7 | 2.3 |
| EV/EBITDAR (X) | 10.6 | 24.5 | 22.5 | 20.1 |
| EV/EBITDA (excl. leases) (X) | 10.6 | 24.5 | 22.5 | 20.1 |
| CROCI (%) | 8.2 | 9.9 | 9.7 | 10.1 |
| ROE (%) | 4.3 | 7.6 | 6.2 | 7.5 |
| Net debt/equity (%) | 13.3 | 15.6 | 20.6 | 23.2 |
| Net debt/equity (excl. leases) (%) | 13.3 | 15.6 | 20.6 | 23.2 |
| Inte r est c ov e r (X) | 1.0 | 4.7 | 5.1 | 5.6 |
| Days in v ent or y o utst , sales | 109.4 | 92.4 | 93.4 | 94.2 |
| Recei v able days | 32.9 | 32.7 | 34.0 | 34.7 |
| Days p ayable o utstandin g | 39.9 | 42.5 | 42.7 | 43.7 |
| DuP o nt ROE (%) | 4.0 | 7.9 | 6.9 | 8.9 |
| Tu r n ov e r (X) | 0.3 | 0.4 | 0.4 | 0.4 |
| L e v e r a g e (X) | 1.4 | 1.5 | 1.5 | 1.6 |
| Gro ss cas h in v ested (ex cas h ) (NT $ ) | 61 , 343.0 | 63 , 693.2 | 67 , 123.2 | 70 , 164.4 |
| A v e r a g e ca p ital e mp l o yed (NT $ ) | 48 , 929.8 | 47 , 177.2 | 46 , 772.6 | 46 , 370.8 |
| BVP S (NT $ ) | 98.00 | 100.63 | 102.85 | 105.60 |
Growth & Margins (%) ______________________________________
| 12/25 | 12/26E | 12/27E | 12/28E | |
|---|---|---|---|---|
| Total revenue growth | (4 . 7) | 28 . 1 | 12 . 6 | 7 . 7 |
| EBITDA growth | (13 . 8) | 29 . 2 | 7 . 9 | 10 . 8 |
| EPS growth | 120 .5 | 88 . 0 | (1 5. 4) | 23 . 7 |
| DPS growth | NM | 144 . 1 | (1 5. 4) | 23 . 7 |
| EBIT margin | 4 . 3 | 13 . 7 | 13 . 1 | 13 . 3 |
| EBITDA margin | 28 . 3 | 28 .5 | 27 . 4 | 28 . 1 |
| Net income margin | 10 . 2 | 14 . 9 | 11 . 2 | 12 . 9 |
Price Performance __________________________________________
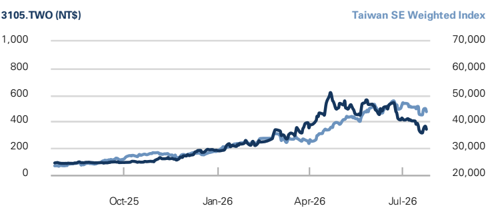
3m
(37.6)%
(44.3)%
6m
48.2%
12m
289.0%
8.5%
108.3%
Source: FactSet. Price as of 24 Jul 2026 close.
Absolute
Rel. to the Taiwan SE Weighted Index
Income Statement (NT$ mn) ________________________________
| 12/25 | 12/26E | 12/27E | 12/28E | |
|---|---|---|---|---|
| To t a l r e v e nu e | 16,6 3 8 . 5 | 21, 3 20 . 0 | 2 4 ,016 . 0 | 25,86 3. 5 |
| Cost of goods sold | (12,612 .4 ) | (15,172 . 2) | (16,882 . 8) | (17,9 33. 7) |
| SG&A | (1,711 . 1) | (1,807 . 1) | (2,098 . 7) | (2,172 .3 ) |
| R&D | (1,600 .3 ) | (1, 4 16 . 7) | (1,89 3. 1) | (2, 3 27 . 7) |
| Other operating inc . /(exp . ) | -- | -- | -- | -- |
| E BITDA | 4, 7 0 8 .4 | 6 ,0 85 . 5 | 6 , 56 9. 2 | 7 , 276 .9 |
| Depreciation& amortization | ( 3 ,99 3. 7) | ( 3 ,161 .4 ) | ( 3 , 4 27 . 8) | ( 3 ,8 4 7 . 1) |
| E BIT | 71 4. 7 | 2 ,9 2 4. 1 | 3, 1 4 1 .4 | 3,4 2 9. 8 |
| Net interest inc . /(exp . ) | (5 4 6 . 0) | ( 4 17 .3 ) | ( 43 7 . 8) | ( 4 85 .4 ) |
| Income/(loss) from associates Pre-tax pro fi t | 0 . 0 1 ,3 86 .9 | (1 4 9 . 2) 3, 221 .4 | (500 . 0) 2 , 6 4 1 .4 | -- 3,4 2 9. 8 |
| Provision for taxes | (297 . 1) | (686 .4 ) | (566 . 8) | (729 . 6) |
| Minority interest | 60 4. 0 | 6 4 9 . 2 | 619 . 0 | 6 3 1 . 2 |
| Preferred dividends | -- | -- | -- | -- |
| N et inc . ( pre-ex c ept i o n a ls) | 1 , 6 93. 8 | 3, 18 4. 1 | 2 , 6 93. 6 | 3,33 1 .4 |
| Post-tax exceptionals | -- | -- | -- | -- |
| N et inc . ( po s t-ex c ept i o | 1 , 6 93. 8 | 3, 18 4. 1 | 2 , 6 93. 6 | 3,33 1 .4 |
| n a ls) E P S(b a sic , pre-ex c ept ) (N T $) | 4.00 | 7 . 51 | 6 .3 5 | 7 . 86 |
| E P S(dilu te d , pre-ex c ept ) (N T $) | 4.00 | 7 . 51 | 6 .3 5 | 7 . 86 |
| E P S(b a sic , po s t-ex c ept ) (N T $) | 4.00 | 7 . 51 | 6 .3 5 | 7 . 86 |
| E P S(dilu te d , po s t-ex c ept ) (N T $) | 4.00 | 7 . 51 | 6 .3 5 | 7 . 86 |
| DPS (NT$) | 2 . 00 | 4. 88 | 4. 1 3 | 5 . 11 |
| Div . payout ratio (%) | 50 . 1 | 65 . 0 | 65 . 0 | 65 . 0 |
| Balance Sheet (NT$ mn) | ______ | |||
| 12/25 | 12/26E | 12/27E | 12/28E | |
| C a sh& c a sh equiv a lents | 7 ,066.9 | 6,343.4 | 4,665.0 | 4,005. 7 |
| Accounts receiv a ble | 1, 7 13.9 | 2,102.8 | 2,368. 7 | 2,550.9 |
| Inventory Other | 4,9 7 8.5 | 5,819.5 | 6,4 7 5.6 .6 | 6,8 7 8. 7 |
| current a ssets | 7 9 7 .6 | 7 9 7 .6 | 7 9 7 | 7 9 7 .6 |
| Total current assets | 1 4 ,556 .9 | 15,06 3. 2 | 1 4 , 3 06 . 8 | 1 4 ,2 3 2 . 8 |
| Net PP&E | 19,6 7 1.9 | 19,29 7 .5 | 18,856. 7 | 18,096. 7 |
| Net int a ngibles | 65.5 | (21.5) | (108.6) | (195.6) |
| Tot a l investments Other long-term a ssets | 21,091.0 5,343.4 | 20,941.8 5,343.4 | 20,441.8 5,343.4 | 20,441.8 5,343.4 |
| Total assets | 60,728 . 7 | 60,62 4.4 | 58,8 4 0 . 2 | 57, 9 1 9. 1 |
| Accounts p a y a ble | 1,8 0.5 | 2,081.4 | 2,211.0 | |
| 1,661.9 | 7 | |||
| Short-term debt | 330. 7 | 330. 7 | 330. 7 | 330. 7 |
| Short-term le a se li a bilities Other current li a bilities | -- 3,8 7 2.5 | -- 5,094.4 | -- 4, 77 5.5 | -- 5,190.0 |
| Total current liabilities | 5,865 . 1 | 7,2 9 5 . 6 | 7,187 . 6 | 7,7 3 1 . 7 |
| Long-term debt | 12,328.2 | 12,328.2 | 12,328.2 | 12,328.2 |
| Long-term le a se li a bilities | -- | -- | -- 544.5 | -- 544.5 |
| Other long-term li a bilities Total long-term liabilities | 544.5 | 544.5 12,872 . 7 | 12,872 . 7 | 12,872 . 7 |
| 12,872 . 7 | 20,060 .4 | 20,60 4. 5 | ||
| Total liabilities Preferred sh a res | 18,7 3 7 .9 -- | 20,168 .3 -- | -- | -- |
| Tot a l commonequity Minority interest | 41,545.3 | 42,659. 7 | 43,602.5 (4 ,822 . 6 ) | 44, 7 68.4 ( 7, 4 5 3. 8 ) |
| Total liabilities | 44 5 . 6 | ( 2,20 3. 6 ) 60,62 4.4 | 58,8 4 0 . 2 | 57, 9 1 9. |
| &equity | 60,728 . 7 | 6,315.5 | 7 ,993.9 | 1 |
| Net debt, a djusted | 5,592.0 | 8,653.2 | ||
| Cash Flow (NT$ mn) | __________ | |||
| 12/25 | 12/26E | 12/27E | 12/28E | |
| Net income | 1,693.8 | 3,184.1 | 2,693.6 | 3,331.4 |
| D&Aadd-back | 3,993.7 | 3,161.4 | 3,427.8 | 3,847.1 |
| Minority interest add-back | (604.0) | (649.2) | (619.0) | (631.2) |
| Net (inc)/dec working capital | 207.1 | (1,021.2) | (711.1) | (455.8) -- |
| Other operating cash flow Cash flow fro m operations | (337.6) 4,9 5 3.0 | 149.2 4, 82 4.4 | 500.0 5 , 2 9 1 .3 | 6 ,09 1 . 5 |
| Capital expenditures | (1,691.4) | (2,700.0) | (2,900.0) | (3,000.0) |
| Acquisitions | -- | -- | ||
| -- | -- | |||
| Divestitures | 6,292.1 | -- | -- | -- |
| Others Cash flow fro m investing | 511.6 5 , 112 .3 | -- ( 2 , 7 00.0) | -- ( 2 ,900.0) | -- (3,000.0) |
| Repayment of lease liabilities | -- | -- | -- | -- |
| Dividends paid(common& pref) | (423.9) | (847.9) | (2,069.7) | (1,750.8) |
| Inc/(dec) in debt | 791.3 | -- | -- | -- |
| Other financing | (8,785.0) | (2,000.0) | (2,000.0) | (2,000.0) |
| cash flows Cash flow fro m financing | ( 8 ,4 17 . 6 ) | ( 2 , 8 4 7 .9) | (4,0 6 9. 7 ) | (3, 75 0. 8 ) ( 65 9.3) |
| Total cash flow Free cash flow | 1 , 6 4 7 . 6 3,261.6 | ( 72 3. 5 ) 2,124.4 | ( 1 , 678 .4) 2,391.3 | 3,091.5 |
Source: Company data, Goldman Sachs Research estimates.
e92c7a75ab8b4efbba794e6b187208c8
For the exclusive use of KEVINLU@LENOVO.COM
Downward revision to PA foundry TAM on weaker smartphone shipment We have revised down our 2026/27/28E PA foundry TAM by 1/1/4% to
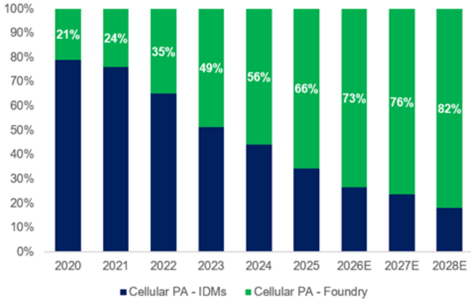
US$1.3bn/1.4bn/1.6bn as we factor in our latest smartphone shipment assumptions (-10%/+3% in 2026/27, was -6%/+2% previously, and now expect shipment to see +1% in 2028, see here) as end-demand continues to be impacted by high memory price (see here). Despite the near-term weakness in the smartphone market, we continue to believe the PA foundry house will gain share in the smartphone PA segment. This continues to be driven by the increasing design complexity and production costs of the PA, and we continue to see newer smartphone projects from design houses being allocated to foundries, which will bene fi t Win Semi in the long term. We expect the market TAM to deliver an 11% CAGR over 2025-30E (was 13% previously), and we expect foundries' cellular PA shipments to increase by 11% in 2026 (vs. 17% previously), while weak smartphone shipments continue to o ff set content value growth driven by higher 5G penetration in 2026.
Win Semi delivered 2Q26 revenue that in line with the company's guidance, with the cellular business seeing PA inventory pull-in. Management expects this momentum to continue into 3Q26 and guided revenue to be fl attish to slight QoQ growth in the cellular business. We now expect Win Semi's PA foundry revenue to grow 28% YoY in 2026, outpacing the overall PA foundry TAM growth of 17% YoY, as the company continue to focus on mid-to-high-end and premium smartphone models, which are relatively more resilient to rising memory costs, although management did acknowledge potential downside risks to end-demand if high-end smartphone prices increase. Moreover, we expect Win Semi's PA foundry market share to decline from 74% in 2020 to 52% in 2026, and further to 40-50% by 2030, but its revenue will continue to expand further due to the growing foundry TAM.
We continue to see a modest recovery in 2026 CAPEX plans among Taiwan PA foundry players. However, we do not see this as an indication of a more constructive demand outlook for the PA foundry industry. Win Semi reiterated its 2026 CAPEX guidance of NT$2-3bn, with the majority of spending allocated to the optical and infrastructure businesses rather than GaAs capacity expansion. We continue to believe GaAs capacity remains su ffi cient, with Win Semi's utilization rate likely reaching at most 80% during 2026-28E, implying no meaningful need for additional GaAs capacity expansion.
e92c7a75ab8b4efbba794e6b187208c8
continues to outgrowbim alla producema
100%
90%
90%
80%
80%
70%
70%
60%
50%
50%
40%
30%
40%
20%
30%
10%
0%
20%
For the exclusive use of KEVINLU@LENOVO.COM
2020
mcrease 1170/470/470114040/4 1405
o daually Improve staruing from 404o
60%
12,000
50%
10,000
40%
30%
40%
30%
49%
56%
8,000g
Exhibit 1: Win Semi's GM will be driven by utilization rate and product mix 20% 10% 6,000
4,000
0%
-10%
Source: Company data, Goldman Sachs Global Investment Research
Exhibit 3: China cellular PA market share - Foundry continues to outgrow IDM
Source: Company data, Goldman Sachs Global Investment Research
35%
48%
[-7%|
1..
2020
600%
400%
Exhibit 2: We expect cellular PA foundry shipments to increase 11%/4%/4% in 2026/27/28E 200%
100%
Source: Company data, Goldman Sachs Global Investment Research
Exhibit 4: We believe Taiwan PA foundries' CAPEX will gradually improve starting from 2026
Source: Company data, Goldman Sachs Global Investment Research
42%
e92c7a75ab8b4efbba794e6b187208c8
4U40/4 1405
Win Semi (3105. TWO)
12,000
Went up due to IDMs' full UTR,
Revenue went up.
10,000
5,257
Gross profits
Operating profits
Pre-tax income
8,000
Net profit
EPS, NT$
6,000
Gross margin (%)
9%
EBIT margin (%)
Net margin (%)
4,000
2,000
1,485
742
1,188
977
14%
2.30
28.2%
14.1%
18.6%
2017
2018
2019
2020
• GaAs TAM (US$mn)
For the exclusive use of KEVINLU@LENOVO.COM
9%
11%
13%
2021
Foundry ratio went down
2Q26
given
GS est.
Foundry ratio uptrend while China/US
QOQ
Diff (%)
shipment smartphone
5,109
to more IDMs
Exhibit 5: We believe the foundry penetration rate will grow to 15%/16%/17% in 2026/27/28E 16%
design houses continue to replace
IDMs PA (both 4G and 5G).
1Q26
QoQ
3%
2Q25
4,590
15%
149%
15%
477
532
123%
3,780
(551)
Source: Company data, Goldman Sachs Global Investment Research
Exhibit 6: Win Semi 2Q26 result vs. GSe/consensus
Source: Company data, Goldman Sachs Global Investment Research, Bloomberg
Investment view
Although the company will begin ramping up new PD product in 2H26 and is making progress on LD products (including CW lasers and EML solutions), we expect the datacom optical business to account for only a high-single-digit of 2026E revenue despite multiple-fold YoY growth. We believe Win Semi will remain primarily driven by its cellular business, and the limited contribution from datacom optical through 2026-27E is insu ffi cient to justify the high valuation that Win Semi is trading at (over 33x 2027E P/E based on GSe/BBG consensus, even after the stock has corrected by more than 30% since the last earnings release).
We maintain our conservative view on Win Semi's stock performance going forward, given (1) our Global Tech team's expectation that global smartphone shipments will decline 10% YoY in 2026E and grow only 3%/1% YoY in 2027/28E (see here), limiting upside for the cellular business; (2) our view that competitors such as AWSC are better
YoY
25%
YoY
39%
316%
Bloomberg consensus
5,298
-1%
717
66%
e92c7a75ab8b4efbba794e6b187208c8
For the exclusive use of KEVINLU@LENOVO.COM
positioned to gain share given their lower cost structures and more competitive pricing; and (3) the limited near-term contribution from the company's datacom optical products (e.g., PDs and LDs), with the higher margin LD products to see more contribution in 2027/28E.
Maintain Sell, with a new 12-m TP of NT$142 (from NT$124).
e92c7a75ab8b4efbba794e6b187208c8
camore lo Callings revisions table
NTSmn
1Q25
Revenue
Win Semi P&L (NT$ mn)
Sales
Gross profit
Operating expense
Gross Profit
Operating income
Pretax income
EBIT
Net Income
Net income
Taxes expense
0000000000000e
EPS (NTS).
Ratio analysis
EPS, NT$
As % of sales
Gross margin
Gross margin
Operating expense ratio
EBIT margin
Net margin
QoQ growth (%)
Operating margin
Revenue
Gross profit
Net income
YoY growth (%)
Revenue
4Q26E
1027E
5.691
2027E New
5.637
1.689
24,016
1.648
(888)
(947)
801
7,133
551
(110)
515
3.141
701
451
(90)
2,694
450
2027E Old
2Q27E
3Q27E
5.916
6,338
1,747
22,342
1,931
(976)
(1,046)
771
6.609
886
521
2,398
886
(125)
472
4Q27E
6.125
1.806
(1,023)
784
784
(157)
4%
705
2028E New
2024
2025
17.457
16.639
(3,280)
2028E Old
(3,311)
762
2026E
2027E
21.320
24.016
(3,224)
(3,992)
715
332
7,680
1,387
3,430
3,331
(296)
768
1.695
10%
-5%
3,053
2,924
3.141
3,221
(686)
3.101
3,184
2,641
wwwww
(567)
2,694
28%
13%
Diff.
2028E
25,864
(4,500)
3%
3.430
3.430
12%
7%
(730)
3,331
8%
(195)
1,067
3Q25
4.488
2026E New 2026E Old
1,205
4Q25
wwww...
4.794
1Q26
2026
4.590
5,257
1,525
1,485
1,209
(820)
386
897
(213)
1,070
2.53
26.9%
18.3%
8.6%
18.7%
72.7%
NA
21,320
(860)
20,120
(778)
(743)
3Q26E
5.781
1,766
(815)
665
950
5,592
431
742
Earnings revisions
1,029
We raise our 2026E revenue by 6% after factor in 2Q26 results and raise our 2027/28E revenue by 7/3% to factor in higher infrastructure and optical business contribution. We revise up our 2026/27/28E GM estimates by 1.0/0.1/0.1ppt as we expect more margin expansion from the new businesses. Overall, we revised up our 2026/27/28E EPS estimates by 46/4/7%. 5.13 4% 7.86 7.31 533 -0.9% -2.4% 4.9% 6.0% 7.1% 10.5% -3.4% -6.5%
7.51
977
1.159
72.4%
-35.2%
(815)
(217)
(61)
(2)
16
0.04
16.7%
22.8%
-6.1%
-3.5%
-21.0%
NA
NA
-3.9%
-48.2%
2025
(817)
(119)
(551)
61
(421)
(0.99)
18.5%
21.6%
-3.1%
5.7%
16.6%
NA
NA
NA
Exhibit 7: Earnings revisions table
-19.5%
-23.8%
3.2%
Gross profit
Operating income
Net income
| -39.8% 48.4% 28.5% | 101.2% 102.1% 112.7% | 46.5% | 36.3% | 17.7% | 9.4% 7.0% | 17% | 0% 53% | 16% 11% |
|---|---|---|---|---|---|---|---|---|
| NA NA 207.4% | NA NA 3166.5% NA | 146.5% | 62.6% | 4.0% NA | -6.8% -2.2% 36.9% | NA | -6% 309% 88% | 7% 9% 24% |
| NA NA 369.8% | NA NA | 8.2% | -15.7% | -8.0% | NA 121% | -15% |
Source: Goldman Sachs Global Investment Research
Valuation
We maintain our Sell rating, and revise up our TP from NT$124 to NT$142, based on the same target PE of 24x (1x STDV lower than the industry upcycle average valuation), factoring in our earnings revisions and, consistent with our group coverage practices, roll over our valuation period from 2H26-1H27 to 4Q26-3Q27.
29.4%
28.4%
72.1%
83.2%
39.1%
28.1%
18.6%
28.8%
-15.7%
55.5%
18.7%
-12.5%
-12.7%
22.8%
2.581
10.0%
5.0%
12.5%
14.8%
125.8%
9.6%
wwwwww.r
-11.5%
-33.9%
7.6%
For the exclusive use of KEVINLU@LENOVO.COM
Exhibit 8: P&L table
Source: Company data, Goldman Sachs Global Investment Research
Investment Thesis and TP & risks
Win Semi is a key GaAs-based semi foundry player with c.49% global market share as of 2025. We believe the company's market share could decline given its much higher-than-peer product pricing in the demand downtrend. We also expect the company to be impacted by the slow PA foundry market growth outlook given weak end-market demand and high inventory levels. This is despite some longer-term demand e92c7a75ab8b4efbba794e6b187208c8
For the exclusive use of KEVINLU@LENOVO.COM
drivers (China PA in-sourcing trend, WiFi 6E/7 upgrading trend, new smartphone/AR VR optical products, automotive LiDAR opportunity, satellite communication market opportunity, stronger 5G BTS deployment in EU/US market, datacom optical opportunity etc.), which should increase its revenue/GM in the long term. However, we believe Win Semi's market share loss will continue to weigh on its long-term growth opportunity. We are Sell-rated given the ongoing PA foundry industry downcycle, along with our cautious view on the company's market share outlook. Win Semi is now trading above its average downcycle P/E multiple. Key upside risks are (1) easing competition in the China PA foundry market, (2) faster-than-expected progress on 5G/WiFi 7 upgrade trend, and (3) faster-than-expected growth from LEO/AI-related business.
Our 12-month target price of NT$142 is based on a 24x 4Q26-3Q27 EPS, which is 1x STDV lower than the industry upcycle average valuation since 2016. Key upside risks are (1) easing competition in the China PA foundry market, (2) faster-than-expected progress on 5G/WiFi 7 upgrade trend, and (3) faster-than-expected growth from LEO/AI-related business.
e92c7a75ab8b4efbba794e6b187208c8
For the exclusive use of KEVINLU@LENOVO.COM