PDF 原檔:報告_GS_弘塑3131_20260805_original.pdf
圖片清單(已驗證 2026-08-06)
| 檔名 | size | 分類 | 親眼所見內容 |
|---|---|---|---|
報告_GS_弘塑3131_20260805_001.png |
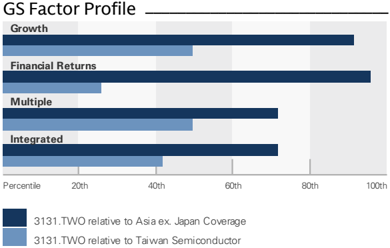
22KB | 真資料圖 | GS Factor Profile 橫條圖:3131.TWO 於 Growth/Financial Returns/Multiple/Integrated 四構面相對 Asia ex-Japan(深藍)與台灣半導體同業(淺藍)之百分位排名,Growth/Financial Returns 接近 90-100th percentile |
報告_GS_弘塑3131_20260805_002.png |
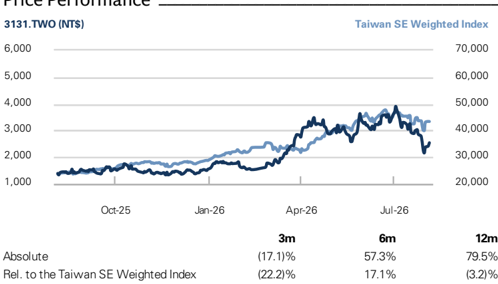
39KB | 真資料圖 | Price Performance 折線圖:3131.TWO(深藍)vs 台灣加權指數(淺藍),2025/10-2026/7;表列 3 個月 -17.1%、6 個月 +57.3%、12 個月 +79.5%(相對指數 -22.2%/+17.1%/-3.2%) |
報告_GS_弘塑3131_20260805_003.png |
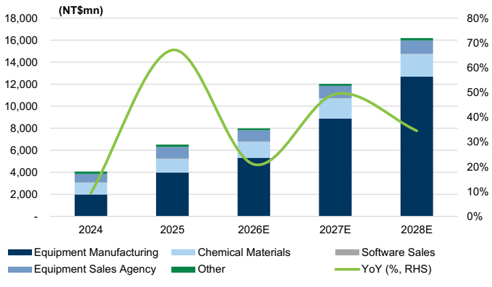
39KB | 真資料圖 | Exhibit 2:GPTC 營收成長展望堆疊長條圖(Equipment Manufacturing/Chemical Materials/Equipment Sales Agency/Software Sales/Other)+YoY% 折線,2024-2028E,YoY 成長率於 2027E 出現高峰後回落 |
報告_GS_弘塑3131_20260805_004.png |
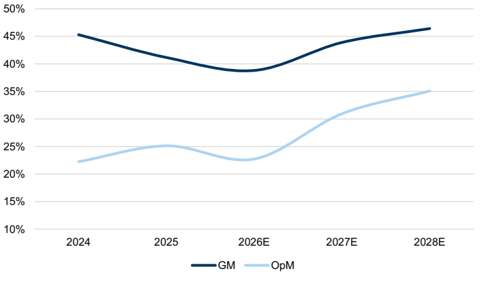
20KB | 真資料圖 | Exhibit 3:GPTC 毛利率(GM)與營益率(OpM)趨勢折線圖,2024-2028E,GM 於 2026E 落底約 39% 後回升至 2028E 約 46%,OpM 同步回升至約 35% |
報告_GS_弘塑3131_20260805_005.png |
48KB | 真資料圖 | Exhibit 6:Taiex vs GPTC 股價走勢對照圖,Aug-16 至 Aug-26 |
報告_GS_弘塑3131_20260805_006.png |
47KB | 真資料圖 | Exhibit 7:GPTC Forward P/E 本益比帶圖(15x-55x)與股價走勢對照 |
報告_GS_弘塑3131_20260805_007.png |
49KB | 真資料圖 | Exhibit 8:GPTC Forward P/B 淨值比帶圖(10x-22x)與股價走勢對照 |
報告_GS_弘塑3131_20260805_008.png |
33KB | 真資料圖 | Exhibit 9:P/B(線,右軸)vs ROE(柱狀,左軸)走勢對照圖,Aug-16 至 Aug-26 |
報告_GS_弘塑3131_20260805_009.png |
80KB | 真資料圖 | GS 評等與目標價歷史走勢圖(圖上標題誤植為「Grand Plastic Technology Corp.」,經核對即弘塑 Grand Process Technology/3131.TWO),目標價階梯自 1050 逐步上修至 4500、後修至 4200,B(Buy)評等區間自 Jun 25 起標示 |
原始內容
For the exclusive use of KEVINLU@LENOVO.COM
Grand Process Technology Corp. (3131.TWO)
Earnings Review: 2Q26 GM beat; strong multi-year growth outlook rea ffi rmed; reiterate Buy
3131.TWO
12m Pri c e Target:
NT$4,200.00
Pri
c
e:
NT$2,540.00
Upside:
65.4%
GPTC reported its 2Q26 preliminary results (see Exhibit 1) on 4 August. 2Q26 GM came in ahead of GSe, and management expects positive QoQ/YoY revenue growth into 3Q26 which we attributed to stronger ramp of CoWoS. More importantly, management reiterated its con fi dence in its multi-year growth outlook with demand/capacity to grow at a 45%/50% CAGR through 2028. We continue to see GPTC as key bene fi ciary from the solid 2.5D/3D packaging capacity expansion trend including CoWoS, SoIC, PLP, etc, with growth driven by content value increase thanks to ongoing technology migration as well we the continuous strong demand for advanced packaging capacity expansion driven by AI/HPC demand. While we tweaked down our 12m TP to NT$4,200 (based on 35x 2H27-1H28E EPS; from NT$4,500 previously) , as we lower our revenue/GM forecasts in 2027-28E to factor in the lower 2Q26 revenue and our view of a stronger ramp from 2.5D packaging (lower GM vs. 3D IC/PLP), our new TP still implies 65% of upside from here, we thus reiterate Buy on GPTC.
Building in our view of a stronger CoWoS expansion into 2027
In our TSMC report, we raised our end-2027E CoWoS (include WMCM) capacity to 280kwpm (vs. 250kwpm previously), fueled by stronger AI accelerator and server-CPU demand. However, we lowered our SoIC capacity to 12kwpm/37kwpm at end-2026/2027E (from 16kwpm/48kwpm previously) as we believe foundry customer has prioritized CoWoS expansion vs. SoIC given the stronger end customer demand especially from server CPU. Nevertheless, we believe this has partially been pushed out to 2028 and thus revised up our 3D IC capacity in end-2028 to 87kwpm (from 78kwpm previously).
Technology migration continues to drive higher content growth into 2028
Relative to 2.5D (i.e. CoWoS, FOCoS) packaging, we believe GPTC is
Goldman Sachs does and seeks to do business with companies covered in its research reports. As a result, investors should be aware that the fi rm may have a con fl ict of interest that could a ff ect the objectivity of this report. Investors should consider this report as only a single factor in making their investment decision. For Reg AC certi fi cation and other important disclosures, see the Disclosure Appendix, or go to ed as research www.gs.com/research/hedge.html. Analysts employed by non-US a ffi liates are not registered/quali fi analysts with FINRA in the U.S.
BUY
Evelyn Yu
+886(2)2730-4187 | evelyn.yu@gs.com Goldman Sachs (Asia) L.L.C., Taipei Branch
Ryan Huang, CFA
+886(2)2730-4084 | ryan.huang@gs.com Goldman Sachs (Asia) L.L.C., Taipei Branch
Key Data _____________________________________
Market cap: NT$73.8bn / $2.3bn
Enterprise value: NT$74.9bn / $2.3bn
3m ADTV: NT$1.7bn / $53.5mn
Taiwan
Taiwan Semiconductor
M&A Rank: 3
Leases incl. in net debt & EV?: Yes
| GS Forecast | 12/25 | __________ 12/26E | 12/27E | 12/28E |
|---|---|---|---|---|
| Revenue(NT$mn) New | 6,514.5 | 7,992.4 | 12,031.2 | 16,187.2 |
| Revenue (NT$ mn) Old | 6,514.5 | 8,721.7 | 12,955.4 | 18,047.5 |
| EBITD A (NT$ mn) | 1,766.2 | 1,972.0 | 3,889.9 | 5,859.3 |
| EPS(NT$) New | 45.45 | 62.06 | 101.89 | 154.28 |
| EPS (NT$) Old | 45.45 | 62.23 | 105.80 | 173.71 |
| P/E (X) | 29.7 | 40.9 | 24.9 | 16.5 |
| P/B (X) | 8.3 | 18.7 | 14.5 | 11.3 |
| Dividend yield (%) | 3.4 | 2.5 | 4.1 | 6.2 |
| CROCI (%) | 49.1 | 13.8 | 49.2 | 67.4 |
| 6/26 | 9/26E | 12/26E | 3/27E | |
| EPS (NT$) | 11.16 | 14.74 | 20.04 | 20.59 |
Source: Company data, Goldman Sachs Research estimates. See disclosures for details.
e92c7a75ab8b4efbba794e6b187208c8
For the exclusive use of KEVINLU@LENOVO.COM
Grand Process Technology Corp. (3131.TWO)
Rating since Jun 25, 2025
Ratios & Valuation __________________________________________
| 12/25 | 12/26E | 12/27E | 12/28E | |
|---|---|---|---|---|
| P/E (X) | 29.7 | 40.9 | 24.9 | 16.5 |
| P/B (X) | 8.3 | 18.7 | 14.5 | 11.3 |
| FCF y i eld (%) | 4.2 | 0.6 | 3.8 | 5.2 |
| EV/EBITDAR (X) | 22.5 | 38.0 | 19.1 | 12.5 |
| EV/EBITDA (excl. leases) (X) | 22.5 | 38.0 | 19.1 | 12.5 |
| CROCI (%) | 49.1 | 13.8 | 49.2 | 67.4 |
| ROE (%) | 28.6 | 41.6 | 66.0 | 77.4 |
| Net debt/equ i ty (%) | 5.9 | 26.8 | 1.3 | (11.5) |
| Net debt/equ i ty (excl. leases) (%) | 5.9 | 26.8 | 1.3 | (11.5) |
| Inte r est c ov e r (X) | 35.5 | 30.1 | 61.7 | 94.0 |
| Days i n v ent or y o utst , sales | 156.5 | 164.9 | 131.9 | 123.8 |
| Rece iv able days | 37.7 | 40.3 | 33.8 | 36.2 |
| Days p ayable o utstand i n g | 154.1 | 165.1 | 166.7 | 189.3 |
| DuP o nt ROE (%) | 27.8 | 45.5 | 58.3 | 68.4 |
| Tu r n ov e r (X) | 0.5 | 0.6 | 0.8 | 0.8 |
| L e v e r a g e (X) | 2.7 | 3.4 | 3.0 | 2.9 |
| Gro ss cas h i n v ested (ex cas h ) (NT $ ) | 5 , 948.6 | 6 , 191.0 | 6 , 509.1 | 7 , 348.1 |
| A v e r a g e ca pi tal e mp l o yed (NT $ ) | 4 , 199.8 | 5 , 037.8 | 5 , 101.5 | 5 , 506.4 |
| BVP S (NT $ ) | 163.26 | 135.71 | 174.89 | 225.61 |
Growth & Margins (%) ______________________________________
| 12/25 | 12/26E | 12/27E | 12/28E | |
|---|---|---|---|---|
| Total revenue growth | 59.9 | 22.7 | 50.5 | 34.5 |
| EBITDA growth | 76.8 | 11.7 | 97.3 | 50.6 |
| EPS growth | 56.2 | 36.5 | 64.2 | 51.4 |
| DPS growth | 108.9 | 36.5 | 64.2 | 51.4 |
| EBIT margin | 25.1 | 22.7 | 30.9 | 35.1 |
| EBITDA margin | 27.1 | 24.7 | 32.3 | 36.2 |
| Net income margin | 20.4 | 22.6 | 24.7 | 27.8 |
Price Performance __________________________________________
Source: FactSet. Price as of 4 Aug 2026 close.
Income Statement (NT$ mn) ________________________________
| 12/25 | 12/26E | 12/27E | 12/28E | |
|---|---|---|---|---|
| To t a l r e v e nu e | 6,514.5 | 7,992.4 | 12,031.2 | 16,187.2 |
| Cost of goods sold | (3,833.1) | (4,890.8) | (6,750.9) | (8,674.1) |
| SG&A | (699.7) | (822.1) | (969.2) | (1,108.5) |
| R&D | (345.3) | (463.6) | (587.9) | (726.0) |
| Other operating inc./(exp.) E BITDA | -- 1 , 766 . 2 | -- 1 ,9 72 .0 | -- 3, 88 9.9 | -- 5 , 85 9.3 |
| Depreciation& amortization | (129.8) | (156.1) | (166.7) | (180.6) |
| E BIT Net interest inc./(exp.) | 1 , 6 3 6 . 5 19.7 | 1 , 815 .9 | 3, 72 3. 2 20.3 | 5 , 678 . 6 20.3 |
| Income/(loss) from associates | -- | 18.8 2.7 | -- | -- |
| Pre-tax prof i t | 1 , 68 9. 8 | 2 , 258 .0 | 3, 76 3. 6 | 5 , 718 .9 |
| Provision for taxes | (364.8) | (457.9) | (786.8) | (1,211.5) |
| Minority interest | 2.4 | 2.7 | -- -- | -- -- |
| Preferred dividends ls) | -- | -- | ||
| N et inc . ( pre-ex c ept i o n a | 1 ,3 27 . 4 | 1 , 8 0 2 . 8 | 2 ,9 76 . 8 | 4 , 5 0 7 . 4 |
| Post-tax exceptionals N et inc . ( po s t-ex c ept i o n a | -- 1 ,3 27 . 4 | -- 1 , 8 0 2 . 8 | -- 2 ,9 76 . 8 | -- 4 , 5 0 7 . 4 |
| ls) E P S(b a sic , pre-ex c ept ) (N T $) | 45 . 45 | 62 .0 6 | 1 0 1 . 8 9 | 154 . 28 |
| E P S(dilu te d , pre-ex c ept ) (N T | 45 . 45 | 62 .0 6 | 1 0 1 . 8 9 | 154 . 28 |
| $) E P S(b a sic , po s t-ex c ept ) (N T $) | 45 . 45 | 62 .0 6 | 1 0 1 . 8 9 | 154 . 28 |
| E P S(dilu te d , po s t-ex c ept ) (N T $) | 45 . 45 | 62 .0 6 | 1 0 1 . 8 9 | 154 . 28 |
| DPS (NT$) | 46.19 | 63.07 | 103.55 | 156.79 |
| Div. payout ratio (%) | 101.6 | |||
| Balance Sheet (NT$ mn) | 101.6 | 101.6 | 101.6 | ______ |
| a lents | 12/25 2,544.6 | 12/26E 1,578.3 | 12/27E 2,571.5 1,232.7 | 12/28E 3,395.1 1,977.9 |
| C a sh& c a sh equiv Accounts receiv a ble | 767.4 | 996.5 4,107.4 | 4,585.3 | 6,392.3 |
| Inventory Other current a ssets | 3,113.5 3,348.4 | 3,479.3 | 3,479.3 | 3,479.3 |
| assets | 9 ,774. 2,204.7 | 1 0 ,161.5 | 11,868.8 | 15,244.7 |
| Total current | 0 | 2,368.1 | 2,540.7 | 2,780.6 |
| Net PP&E Net int a ngibles | 355.0 | 305.3 | 326.0 | 345.5 |
| Tot a l investments | 314.3 | 463.8 | 463.8 | 463.8 |
| Other long-term a ssets | 294.0 | 213.7 | 213.7 | 213.7 |
| Total assets | 12, 9 42.1 | 1 3 ,512.4 | 15,41 3 . 0 | 1 9 , 0 48. 3 |
| Accounts p a y a ble | 1,697.7 | 2,725.8 | 3,441.9 0.0 | 5,555.0 |
| Short-term debt Short-term le a se li a bilities | 100.0 | 0.0 | -- | 0.0 -- |
| Other current li a bilities | -- | -- 3,983.9 | 4,023.9 7,465.8 | 4,063.9 9 ,61 9 . 0 |
| Total current liabilities | 3,481.3 5,27 9 . 0 | 6,7 09 .7 | ||
| Long-term debt | 2,724.7 | 2,639.2 | 2,639.2 | 2,639.2 -- |
| Long-term le a se li a bilities | -- | -- | -- 198.6 | 198.6 |
| Other long-term li a bilities Total long-term liabilities | 168.6 2,8 93 . | 198.6 | 2,8 3 7.7 0 , 303 .5 | 2,8 3 12,456.7 |
| 3 | 2,8 3 7.7 | 1 | 7.7 | |
| Total liabilities Preferred sh a res | 8,172. 3 -- | 9 ,547.5 -- | -- | -- 6,563.9 |
| Tot a l commonequity Minority interest | 4,737.9 3 1. 9 | 3,937.3 27.6 | 5,081.9 27.6 | 27.6 |
| Total liabilities &equity | 9 | 1 3 ,512.4 | 15,41 3 . 0 67.7 | 1 9 , 0 48. 3 |
| Net debt, a djusted | (756.0) | |||
| (NT$ mn) | 12, 42.1 280.1 | __________ | ||
| 1,060.9 | 12/28E | |||
| Cash Flow Net income | 12/25 1,32 7 .4 129. 8 | 12/26E 1, 8 02. 8 | 12/27E 2,9 7 6. 8 166. 7 | 4,50 7 .4 1 8 0.6 |
| D&Aadd-back Minority interest add-back | (2.4) (66 8 .4) | 156.1 (2. 7 ) (194.9) | -- 2.0 | -- (439.0) |
| Net (inc)/dec working capital Other operating cash flow | 1,034.3 | -- | ||
| Cash flow fro m operations | 1 , 820 . 7 | (1,103.4) 657 . 8 | -- 1 4 5 | 4, 2 4 8 .9 |
| 3, .4 | ||||
| (250.2) | (320.0) | (400.0) | ||
| Capital expenditures Acquisitions | (143. 7 ) -- | -- | -- -- | -- |
| Divestitures | -- | -- | -- -- | |
| Others Cash flow fro m | (2,045.3) 2 , 18 9. 0 ) | 104.0 | . 0 | . 0 ) |
| investing | ( | ( 1 4 6 . 1 ) | -- (3 20 ) | (4 00 |
| Repayment of lease liabilities | -- | |||
| -- (642. 8 ) | -- | -- 8 32.2) | ||
| Dividends paid(common& pref) | (1,349.0) | (1, | (3,025.3) -- | |
| Inc/(dec) in debt Other financing | 1,363.6 ( 7 92.9) | (131.5) 2.4 | -- 0.0 | 0.0 |
| cash flows Cash flow fro m | ( 72 . 1 ) | ( 1 ,4 78 . 1 ) | ( 1 , 8 3 2 . 2 | 025 .3) |
| financing Total cash flow | (44 0 .4) | (9 66 .4) | ) 993. 2 | (3, 82 3. 6 |
| Free cash flow | 1,6 77 .0 | 40 7 . 7 | 2, 8 25.4 | 3, 8 4 8 .9 |
Source: Company data, Goldman Sachs Research estimates.
e92c7a75ab8b4efbba794e6b187208c8
For the exclusive use of KEVINLU@LENOVO.COM
competitively better positioned in 3D IC (i.e. SoIC), where higher technical requirements and stronger process complexity support market share gains, stronger pricing power, and higher pro fi tability. We estimate SoIC wet clean equipment ASP at US$1.5-2.0mn, vs. US$1.0-1.5mn for current 2.5D packaging wet clean equipment, and expect 3D IC-related shipments to be margin accretive, thereby supporting an improved structural gross margin pro fi le. Overall, we expect GPTC to bene fi t from the strong 3D IC capacity expansion in 2027 and 2028, supporting the overall revenue growth of 51%/35% YoY in 2027/2028E, with GM rising to 43.9%/46.4% from 38.8% in 2026E.
Risk-reward skewed to the upside
GPTC's shares have declined -35% from their recent peak in July (vs. TAIEX's -7%). We believe this weakness largely re fl ects a small cluster of market concerns, including a potential CPO delay, which investors in our conversations fear could weigh on SoIC capacity expansion. However, we believe GPTC's equipment demand remains solid, underpinned by robust 2.5D packaging demand, while SoIC and panel-level packaging (PLP) related wet clean equipment remain key content value drivers. In light of the solid demand/capacity expansion outlook and the favorable industry trend, we view the risk-reward as skewed to the upside for GPTC.
2Q26 results recap, charts and valuations
2Q26 GM beat GSe
GPTC 2Q26 revenue of NT$1,727mn miss GSe/cons. by 5.6%/13.1%, however, its GM of 38.9% (up 5.1ppt QoQ; down -1.7ppt YoY) came in higher vs. GSe of 35.9%, as 2Q26 no longer has the one o ff impact from share disposal of its Shanghai chemical subsidiary Chemstart, which incurred one-o ff bonus & employee compensation costs. On the operating level, 2Q26 opex ratio of 17.7% (down 2.9ppts QoQ) came in also better vs. GSe/cons of 19.1%/18.3% thanks to stringent cost control. Overall, GPTC's 2Q26 EPS of NT$11.16 beat GSe of NT$9.13, yet missed cons. of NT$12.70.
Exhibit 1: 2Q26 results summary
| 2Q26 | 1Q26 | 2Q25 | %QoQ | %YoY | GS prev. | %Diff | Consensus | %Diff | |
|---|---|---|---|---|---|---|---|---|---|
| (NT$mn) | |||||||||
| Revenue | 1,727 | 1,596 | 1,630 | 8.2% | 5.9% | 1,828 | -5.6% | 1,987 | -13.1% |
| Gross profit | 671 | 539 | 662 | 24.4% | 1.4% | 657 | 2.1% | 804 | -16.5% |
| Op. income | 365 | 210 | 407 | 73.8% | -10.3% | 307 | 18.8% | 441 | -17.3% |
| Net income | 324 | 463 | 206 | -30.0% | 57.2% | 267 | 21.3% | 386 | -16.0% |
| EPS (NT$) | 11.16 | 16.11 | 7.05 | -30.7% | 58.3% | 9.13 | 22.2% | 12.70 | -12.1% |
| GM | 38.9% | 33.8% | 40.6% | 5.1% | -1.7% | 35.9% | 2.9% | 40.5% | -1.6% |
| OpM | 21.1% | 13.2% | 25.0% | 8.0% | -3.8% | 16.8% | 4.3% | 22.2% | -1.1% |
| NM | 18.8% | 29.0% | 12.6% | -10.2% | 6.1% | 14.6% | 4.2% | 19.4% | -0.6% |
Source: Company data, Goldman Sachs Global Investment Research, Bloomberg
e92c7a75ab8b4efbba794e6b187208c8
For the exclusive use of KEVINLU@LENOVO.COM
Exhibit 2: GPTC's revenue growth outlook
Source: Company data, Goldman Sachs Global Investment Research
Exhibit 3: GPTC's margin trend
Source: Company data, Goldman Sachs Global Investment Research e92c7a75ab8b4efbba794e6b187208c8
For the exclusive use of KEVINLU@LENOVO.COM
Earnings changes, valuation and risks
Forecast changes
We trim our 2026/2027/2028E EPS by 0.3%/3.7%/11.2% mainly as we factor in 1) lower 2Q26 revenue, 2) lower SoIC capacity forecast, and 3) stronger ramp from 2.5D packaging (lower GM vs. 3D IC/PLP).
Exhibit 4: Earnings revisions
| 2026E | 2026E | 2026E | 2027E | 2027E | 2027E | 2028E | 2028E | 2028E | |
|---|---|---|---|---|---|---|---|---|---|
| (NT$mn) | Old | New | Diff (%) | Old | New | Diff (%) | Old | New | Diff (%) |
| Revenue | 8,722 | 7,992 | -8.4% | 12,955 | 12,031 | -7.1% | 18,048 | 16,187 | -10.3% |
| Gross profit | 3,270 | 3,102 | -5.2% | 5,708 | 5,280 | -7.5% | 8,594 | 7,513 | -12.6% |
| Op. income | 1,839 | 1,816 | -1.2% | 3,900 | 3,723 | -4.5% | 6,453 | 5,679 | -12.0% |
| Net income | 1,810 | 1,803 | -0.4% | 3,091 | 2,977 | -3.7% | 5,075 | 4,507 | -11.2% |
| EPS (NT$) | 62.23 | 62.06 | -0.3% | 105.80 | 101.89 | -3.7% | 173.71 | 154.28 | -11.2% |
| GM | 37.5% | 38.8% | 1.3% | 44.1% | 43.9% | -0.2% | 47.6% | 46.4% | -1.2% |
| OpM | 21.1% | 22.7% | 1.6% | 30.1% | 30.9% | 0.8% | 35.8% | 35.1% | -0.7% |
| NM | 20.8% | 22.6% | 1.8% | 23.9% | 24.7% | 0.9% | 28.1% | 27.8% | -0.3% |
| 3Q26E | 3Q26E | 3Q26E | 4Q26E | 4Q26E | 4Q26E | 1Q27E | 1Q27E | 1Q27E | |
|---|---|---|---|---|---|---|---|---|---|
| (NT$mn) | Old | New | Diff (%) | Old | New | Diff (%) | Old | New | Diff (%) |
| Revenue | 2,308 | 2,132 | -7.6% | 2,989 | 2,537 | -15.1% | 2,925 | 2,646 | -9.5% |
| Gross profit | 875 | 847 | -3.3% | 1,199 | 1,045 | -12.8% | 1,215 | 1,119 | -7.9% |
| Op. income | 501 | 524 | 4.7% | 821 | 717 | -12.6% | 792 | 753 | -4.9% |
| Net income | 412 | 431 | 4.5% | 669 | 586 | -12.4% | 628 | 602 | -4.3% |
| EPS (NT$) | 14.11 | 14.74 | 4.5% | 22.88 | 20.04 | -12.4% | 21.51 | 20.59 | -4.3% |
| GM | 37.9% | 39.7% | 1.8% | 40.1% | 41.2% | 1.1% | 41.6% | 42.3% | 0.7% |
| OpM | 21.7% | 24.6% | 2.9% | 27.5% | 28.3% | 0.8% | 27.1% | 28.5% | 1.4% |
| NM | 17.9% | 20.2% | 2.3% | 22.4% | 23.1% | 0.7% | 21.5% | 22.7% | 1.3% |
Source: Goldman Sachs Global Investment Research
Maintain Buy with TP revised down to NT$4,200 from NT$4,500
Alongside our downward earnings revisions, we tweak our 12-month TP to NT$4,200 (from NT$4,500 previously). Our 12-month TP is based on an unchanged target P/E multiple of 35x applied to our FY2H27E-1H28E EPS. Our 35x target P/E continues to be based on avg. fwd P/E during the CoWoS ramp-up in mid-2024 to 2025. Our new TP implies c.65% upside from current levels, and we maintain our Buy rating on GPTC.
e92c7a75ab8b4efbba794e6b187208c8
For the exclusive use of KEVINLU@LENOVO.COM
Exhibit 5: GPTC's P&L overview
| 1Q26 | 2Q26E | 3Q26E | 4Q26E | 1Q27E | 2Q27E | 3Q27E | 4Q27E | 2026E | 2027E | 2028E | |
|---|---|---|---|---|---|---|---|---|---|---|---|
| P&L | |||||||||||
| Revenue | 1,596 | 1,727 | 2,132 | 2,537 | 2,646 | 2,920 | 3,200 | 3,265 | 7,992 | 12,031 | 16,187 |
| Gross profit | 539 | 671 | 847 | 1,045 | 1,119 | 1,250 | 1,423 | 1,488 | 3,102 | 5,280 | 7,513 |
| Operating profit | 210 | 365 | 524 | 717 | 753 | 859 | 1,017 | 1,095 | 1,816 | 3,723 | 5,679 |
| Net income | 463 | 324 | 431 | 586 | 602 | 682 | 815 | 878 | 1,803 | 2,977 | 4,507 |
| EPS (NT$) | 16.11 | 11.16 | 14.74 | 20.04 | 20.59 | 23.35 | 27.88 | 30.07 | 62.06 | 101.89 | 154.28 |
| Margins (%) | |||||||||||
| GM | 33.8% | 38.9% | 39.7% | 41.2% | 42.3% | 42.8% | 44.5% | 45.6% | 38.8% | 43.9% | 46.4% |
| OpM | 13.2% | 21.1% | 24.6% | 28.3% | 28.5% | 29.4% | 31.8% | 33.5% | 22.7% | 30.9% | 35.1% |
| NM | 29.0% | 18.8% | 20.2% | 23.1% | 22.7% | 23.4% | 25.5% | 26.9% | 22.6% | 24.7% | 27.8% |
| YoY (%) | |||||||||||
| Revenue | 28.7% | 5.9% | 42.7% | 18.0% | 65.7% | 69.1% | 50.1% | 28.7% | 22.7% | 50.5% | 34.5% |
| Gross profit | 6.5% | 1.4% | 39.1% | 15.5% | 107.5% | 86.3% | 68.1% | 42.4% | 15.7% | 70.2% | 42.3% |
| Operating profit | -24.2% | -10.3% | 65.1% | 12.9% | 258.6% | 135.4% | 94.1% | 52.6% | 11.0% | 105.0% | 52.5% |
| Net income | 81.3% | 57.2% | 41.7% | 4.2% | 30.0% | 110.7% | 89.1% | 50.0% | 35.8% | 65.1% | 51.4% |
| EPS | 84.3% | 58.3% | 41.8% | 4.1% | 27.8% | 109.2% | 89.1% | 50.0% | 36.5% | 64.2% | 51.4% |
| QoQ (%) | |||||||||||
| Revenue | -25.7% | 8.2% | 23.5% | 19.0% | 4.3% | 10.4% | 9.6% | 2.0% | |||
| Gross profit | -40.4% | 24.4% | 26.2% | 23.4% | 7.1% | 11.7% | 13.8% | 4.6% | |||
| Operating profit | -67.0% | 73.8% | 43.5% | 36.9% | 5.0% | 14.1% | 18.4% | 7.7% | |||
| Net income | -17.7% | -30.0% | 33.0% | 36.0% | 2.7% | 13.4% | 19.4% | 7.9% | |||
| EPS | -16.4% | -30.7% | 32.1% | 36.0% | 2.7% | 13.4% | 19.4% | 7.9% |
Source: Company data, Goldman Sachs Global Investment Research
Exhibit 6: Taiex vs. GPTC
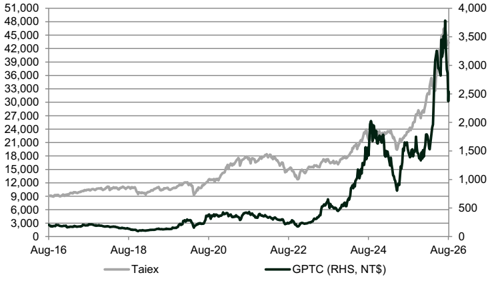
Source: Bloomberg
Exhibit 7: Forward P/E
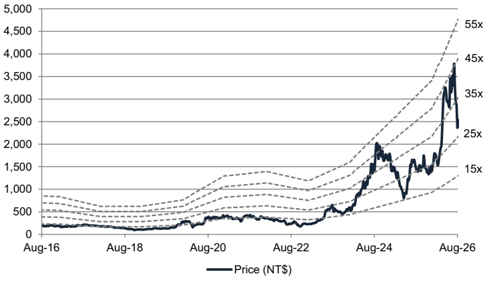
Source: Bloomberg
e92c7a75ab8b4efbba794e6b187208c8
For the exclusive use of KEVINLU@LENOVO.COM
Exhibit 8: Forward P/B
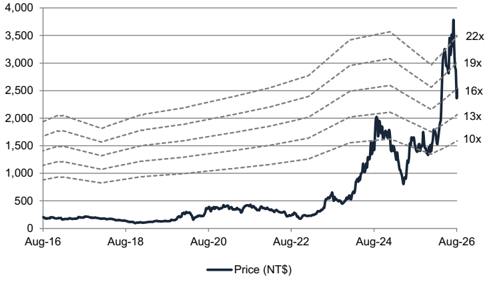
Source: Bloomberg
Exhibit 9: P/B vs. ROE
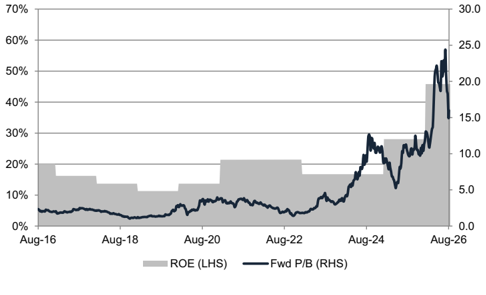
Source: Bloomberg
e92c7a75ab8b4efbba794e6b187208c8
For the exclusive use of KEVINLU@LENOVO.COM
Investment Thesis, Price Target Risks and Methodology
Investment Thesis - GPTC (3131.TWO)
GPTC is one of the premier suppliers of semiconductor wet processing equipment, primarily utilized in back-end advanced packaging processes. The company manufactures semiconductor wet processing equipment, including metal etching equipment and single-wafer cleaning equipment, as well as providing engineering and installation services to semiconductor manufacturers. GPTC is the main CoWoS wet clean equipment provider and has held 50% market share at TSMC and near 100% of market share at ASE/SPIL. GPTC is also the sole provider for SoIC wet clean equipment at TSMC given its leading technology versus local peers.
We favor GPTC as we expect its revenue/earnings CAGR to further accelerate to 40%/56% in 2025-28E, driven by 1) continued advanced packaging capacity expansion, and 2) equipment ASP increase amid rising advanced packaging (e.g. SoIC, CPO, FOPLP) technology complexity. The company is now trading below its AI cycle (2023-2025) average forward P/E of 29x; however, with proliferation of advanced packaging into non-AI application and increasing ASP thanks to rising technology complexity, we continue to see upside potential to its revenue and earnings growth and maintain a Buy rating on the name.
Price Target Risks and Methodology - GPTC (3131.TWO)
Valuation: We are Buy rated on GPTC. Our 12m TP of NT$4,200 is based on a target P/E multiple of 35x (based on avg. fwd P/E during the CoWoS ramp-up in mid-2024 to 2025) applied to our FY2H27E-1H28E EPS.
Key risks to our views: 1) softer AI/HPC demand, 2) slower adoption of new advanced packaging technologies, and 3) intensifying competition.
e92c7a75ab8b4efbba794e6b187208c8
For the exclusive use of KEVINLU@LENOVO.COM