PDF 原檔:報告_GF_臻鼎4958_20260525_original.pdf
原始內容
Zhen Ding Tech. Group (4958 TT)
AI Upside Continues
Maintain Buy, TP raised to NT$633: Since we initiated coverage on Zhen Ding in January, its stock price has rallied more than 220%, significantly outperforming peers. Moving forward, we still favor Zhen Ding for its market share gain in AI PCB and substrate supercycle. We now forecast Zhen Ding's EPS to be NT$16.41/31.63 for 2026/2027, highest among the street backed by its AI upside. We raised our multiple to 20x 2027E P/E, supported by the company's rapidly increasing AI exposure. In addition, we see further re-rating potential driven by its leadership in mSAP and the growing importance of mSAP in next-generation AI PCB.
AI market share gain: 1) Our checks indicate that Zhen Ding has captured ~20% share in Nvidia's compute tray, with ramp-up expected from late June and further penetration into switch trays beginning late 3Q26. 2) Zhen Ding has started shipments to Google in 1Q26. As Google's orders transit to V7 platform, we expect order to reaccelerate in 3Q26. 3) Driven by strong demand, mSAP pricing for optical modules increased by ~30% in 1Q26, while Zhen Ding maintains the leading global share in 1.6T optical module PCBs. As a result, we forecast Zhen Ding's AI revenue to reach RMB 6.3bn in 2026. Based on our estimates of AI PCB market TAM (RBM 92/197bn in 2026/2027) and Zhen Ding's market share gain, we expect Zhending's AI revenue to potentially reach RMB20bn in 2027.
ABF revenue contribution accelerates: ABF substrate pricing increased significantly in 1Q26, with domestic prices rising 20-30% and overseas prices up 10-20%, with another round of price adjustment expected in 2H26. Supported by higher ASP, capacity expansion, and improved utilization, we expect Zhen Ding's IC substrate GPM to improve significantly across 2026/2027.
mSAP to be the future of AI PCB: Due to more stringent line width and spacing requirements, we believe mSAP will become a critical technology trend for future AI PCB. We expect mSAP adoption to expand across 800G/1.6T optical modules, Nvidia's CoWoP solutions, and future CPO switches. As highlighted in our initiation report, we viewed AI exposure as the key rerating catalyst for Zhen Ding - a thesis that has already materialized, with the valuation rerating from 10-12x P/E to around 20x P/E. Looking ahead, we see another potential re-rating driven by mSAP, where Zhen Ding is well positioned to emerge as a leading beneficiary and capture incremental AI market share.
Risks: 1) AI demand slowing down; 2) Geo-political risks; 3) Intensifying competition.
Profit forecast
| FY2023 | FY2024 | FY2025 | FY2026E | FY2027E | |
|---|---|---|---|---|---|
| Revenue (m) | 151,398 | 171,663 | 182,522 | 240,095 | 333,640 |
| Revenue YoY ( % ) | -11.6% | 13.4% | 6.3% | 31.5% | 39.0% |
| Net profit (m) | 6,189 | 9,179 | 6,791 | 19,017 | 36,803 |
| Net profit YoY ( % ) | -56.4% | 48.3% | -26.0% | 180.0% | 93.5% |
| EPS ($) | 6.55 | 9.62 | 6.91 | 16.41 | 31.63 |
| P/E | 78.8 | 53.7 | 74.7 | 31.4 | 16.3 |
| ROE ( % ) | 7.0% | 8.6% | 6.2% | 9.4% | 14.6% |
Source: Company data, GF Securities (Hong Kong) Brokerage.
数据来源:公司财务报表,广发证券发展研究中心
Maintained Target price
Buy NT$633
Yang Zhou SFC CE No. BSF949 zhouyang@gfgroup.com.hk
Jeff Pu, CFA SFC CE No. BNO719 jeffpu@gfgroup.com.hk
Michelle Jing SFC CE No. BUK594 michellejing@gfgroup.com.hk
Earnings Review
1Q26 results review
Zhen Ding reported 1Q26 revenue of NT$40.7bn, -28.4% QoQ and +1.6% YoY. By end market, Mobile Communication revenue totaled NT$22.2bn (-41.4% QoQ, -9.7% YoY); Computers & Consumer Electronics totaled NT$10.5bn (-14.8% QoQ, -4.7% YoY); Server, Optical Communication & Others revenue totaled NT$4.1bn (+29.7% QoQ, +93.6% YoY); IC Substrate totaled NT$3.9bn (+12.3% QoQ, +65.3% YoY). The company's gross profit was NT$8.8bn, representing a 21.6% GPM (down 1ppt QoQ, up 7ppt YoY). The company's 1Q26 basic EPS was NT$1.33 +101% YoY and -58% QoQ.
We forecast revenue of NT$240/334bn in FY2026/2027
We expect Zhen Ding's revenue for 2026 and 2027 to reach NT$240.1bn and $333.6bn, representing YoY growth of 31.5% and 39.0%, respectively; Gross profit is forecasted at NT$58.9/100.2bn; GPM is forecasted to be 24.5%/30.0%; Net income is expected to reach NT$19.0/36.8bn, reflecting YoY changes of +180.0% and +93.5%. By segment, Mobile Communication contributes to 54%/43% of total revenue in 2026/2027; Computers & Consumer Electronics contributes to 21%/16% of total revenue in 2026/2027; Server, Optical Communication & Others contributes to 15%/30% of total revenue in 2026/2027.
Figure 1: Earnings revision
| NTDm | FY2025 | FY2026E | FY2026E | FY2027E | FY2027E | Change (%) | Change (%) |
|---|---|---|---|---|---|---|---|
| NTDm | FY2025 | Old | New | Old | New | FY2026E | FY2027E |
| Net sales | 182,522 | 226,246 | 240,095 | 285,527 | 333,640 | 6.1% | 16.9% |
| Gross profit | 36,136 | 51,230 | 58,918 | 72,075 | 100,170 | 15.0% | 39.0% |
| Op. profit | 13,932 | 26,450 | 32,269 | 43,114 | 66,727 | 22.0% | 54.8% |
| Pre-tax Income | 14,063 | 26,358 | 32,387 | 43,212 | 67,237 | 22.9% | 55.6% |
| Net profit | 6,791 | 15,023 | 19,017 | 24,157 | 36,803 | 26.6% | 52.4% |
| Key ratios (%) | |||||||
| Gross margin | 19.8% | 22.6% | 24.5% | 25.2% | 30.0% | ||
| Operating margin | 7.6% | 11.7% | 13.4% | 15.1% | 20.0% | ||
| Net profit margin | 3.7% | 6.6% | 7.9% | 8.5% | 11.0% |
Sources: Company data, GF Securities (Hong Kong) Brokerage
Figure 2: Zhen Ding's P&L forecast
| (NTD m) | FY25 | 1Q26 | 2Q26E | 3Q26E | 4Q26E | FY26E | 1Q27E | 2Q27E | 3Q27E | 4Q27E | FY27E |
|---|---|---|---|---|---|---|---|---|---|---|---|
| Sales | 182,522 | 40,728 | 44,414 | 70,458 | 84,495 | 240,095 | 71,857 | 72,711 | 87,178 | 101,894 | 333,640 |
| COGS | -146,385 | -31,917 | -33,916 | -53,805 | -61,539 | -181,177 | -53,053 | -51,502 | -60,442 | -68,473 | -233,470 |
| Gross profit | 36,136 | 8,812 | 10,497 | 16,653 | 22,956 | 58,918 | 18,804 | 21,209 | 26,736 | 33,421 | 100,170 |
| Opex | -22,205 | -6,308 | -5,335 | -7,201 | -7,804 | -26,649 | -8,164 | -6,878 | -8,501 | -9,900 | -33,443 |
| Operating profit | 13,932 | 2,503 | 5,162 | 9,452 | 15,152 | 32,269 | 10,640 | 14,330 | 18,236 | 23,521 | 66,727 |
| Non-op profit | -131 | -103 | 65 | 59 | 97 | 118 | 110 | 92 | 118 | 190 | 510 |
| Pre-tax profit | 14,063 | 2,400 | 5,227 | 9,511 | 15,249 | 32,387 | 10,750 | 14,422 | 18,353 | 23,711 | 67,237 |
| Minority interest | 3,815 | 511 | 990 | 1,762 | 2,858 | 6,121 | 2,014 | 2,943 | 3,972 | 5,200 | 14,129 |
| Income tax | -3,458 | -353 | -1,202 | -2,188 | -3,507 | -7,250 | -2,473 | -3,317 | -4,588 | -5,928 | -16,306 |
| Non-GAAP Net Income | 6,791 | 1,537 | 3,035 | 5,561 | 8,884 | 19,017 | 6,263 | 8,162 | 9,793 | 12,583 | 36,803 |
| Diluted EPS (NT$) | 7 | 1.33 | 2.62 | 4.80 | 7.67 | 16.43 | 5.40 | 7.03 | 8.43 | 10.82 | 31.67 |
| Diluted shares | 1,002 | 1,155 | 1,156 | 1,158 | 1,159 | 1,159 | 1,160 | 1,161 | 1,162 | 1,163 | 1,163 |
| Margin analysis | |||||||||||
| Gross margin | 20% | 22% | 24% | 24% | 27% | 25% | 26% | 29% | 31% | 33% | 30% |
| Operating margin | 8% | 6% | 12% | 13% | 18% | 13% | 15% | 20% | 21% | 23% | 20% |
| Pre-tax margin | 8% | 6% | 12% | 13% | 18% | 13% | 15% | 20% | 21% | 23% | 20% |
| Effective tax rate | 25% | 15% | 23% | 23% | 23% | 22% | 23% | 23% | 25% | 25% | 24% |
| Growth (YoY%) | |||||||||||
| Sales | 6% | 2% | 16% | 49% | 49% | 32% | 76% | 64% | 24% | 21% | 39% |
| Operating profit | 20% | 137% | 113% | 109% | 156% | 132% | 325% | 178% | 93% | 55% | 107% |
| Net income | -26% | 143% | 402% | 133% | 181% | 180% | 308% | 169% | 76% | 42% | 94% |
| EPS | -28% | 101% | 314% | 95% | 143% | 138% | 306% | 168% | 75% | 41% | 93% |
Sources: Company data, GF Securities (Hong Kong) Brokerage
Valuation and Recommendation
Maintain Buy with TP of NT$633
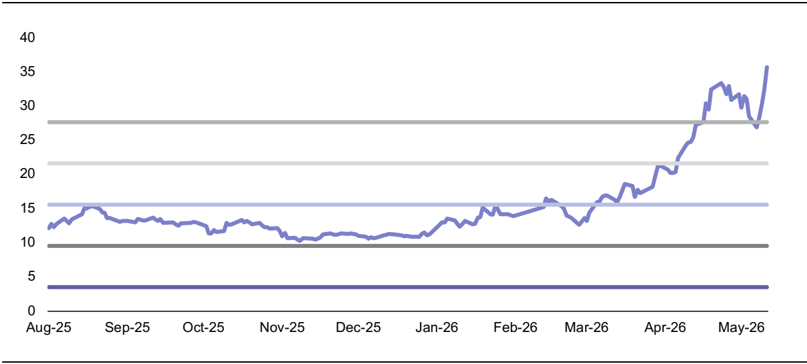
We favor Zhen Ding for its market share gain in AI PCB and substrate supercycle. We now forecast Zhen Ding ' s EPS to be NT$16.41/31.63 for 2026/2027, highest among the street backed by its AI upside. We raised our multiple to 20x 2027E P/E, supported by the company ' s rapidly increasing AI exposure. In addition, we see further re-rating potential driven by its leadership in mSAP and the growing importance of mSAP in next-generation AI PCB.
Figure 3: Zhen Ding's Forward P/E
Sources: Bloomberg, GF Securities (Hong Kong) Brokerage
Risks
1) AI demand slowing down; 2) Geo-political risks; 3) Intensifying competition.
| Balance Sheet | [Table_FinanceDetail] | [Table_FinanceDetail] | [Table_FinanceDetail] | [Table_FinanceDetail] | NTD m |
|---|---|---|---|---|---|
| FY23 | FY24 | FY25 | FY26E | FY27E | |
| Current assets | 114046 | 132509 | 127641 | 171215 | 206356 |
| Cash and cash equivalents | 65970 | 79830 | 71116 | 87532 | 108018 |
| Inventory | 15508 | 17990 | 19616 | 33263 | 38873 |
| Accounts Receivable | 29229 | 30183 | 27228 | 44817 | 53046 |
| Other current assets | 3339 | 4506 | 9681 | 5603 | 6418 |
| Non-current assets | 128730 | 133485 | 152402 | 209632 | 253078 |
| Long-term equity investment | - | - | - | - | - |
| Fixed assets | 105714 | 110173 | 123737 | 176989 | 217744 |
| Other long-term assets | 23016 | 23312 | 28665 | 32643 | 35334 |
| Total assets | 242776 | 265993 | 280043 | 380846 | 459434 |
| Current liabilities | 78939 | 69204 | 72821 | 89920 | 95046 |
| Accounts Payable | 19567 | 21716 | 22274 | 25008 | 25880 |
| Short-term borrowings | 33853 | 21706 | 12839 | 35265 | 39858 |
| Other current liabilities | 25519 | 25781 | 37708 | 29647 | 29308 |
| Non-current liabilities | 29510 | 44765 | 36509 | 26582 | 22883 |
| Long-term Debt | 18026 | 34012 | 15359 | 16607 | 12814 |
| Other non-current liabilities | 11484 | 10754 | 21151 | 9976 | 10070 |
| Total liabilities | 108450 | 113970 | 109330 | 116503 | 117929 |
| Total Equity | 134326 | 152024 | 170713 | 264344 | 341505 |
| Common stock | 9470 | 9567 | 10706 | 10058 | 10249 |
| Capital Reserves | 38556 | 40540 | 52902 | 40438 | 41233 |
| Retained earnings | 53049 | 59158 | 9957 | 73226 | 107093 |
| Other equities | (5378) | (447) | 50416 | 91655 | 133964 |
| Total Liabilities & Equity | 242776 | 265993 | 280043 | 380846 | 459434 |
| Income Statement | NTD m | ||||
|---|---|---|---|---|---|
| FY23 | FY24 | FY25 | FY26E | FY27E | |
| Revenue | 151398 | 171663 | 182522 | 240095 | 333640 |
| Cost of sales | (123939) | (139203) | (146385) | (181177) | (233470) |
| Gross profit | 27459 | 32460 | 36136 | 58918 | 100170 |
| Operating Expense | (18300) | (20875) | (22205) | (26649) | (33443) |
| Operating profit | 9160 | 11585 | 13932 | 32269 | 66727 |
| Interest Income | 548 | 565 | 244 | 285 | 510 |
| Interest Expense | - | - | - | - | - |
| Net other Non-op. Income/(Loss) | 1064 | (1126) | 2078 | 2006 | 2300 |
| Pre-tax profit | 10048 | 15044 | 14063 | 32387 | 67237 |
| Income tax | 616 | 1949 | 3458 | 7250 | 16306 |
| Profit for the year | 9432 | 13096 | 10605 | 25137 | 50931 |
| Minority interest | 3243 | 3917 | 3815 | 6121 | 14129 |
| Net profit to ord. equity | 6189 | 9179 | 6791 | 19017 | 36803 |
| EPS (NT$) | 6.55 | 9.62 | 6.91 | 16.41 | 31.63 |
| Cash Flow Statement | NTD m | ||||
|---|---|---|---|---|---|
| FY23 | FY24 | FY25 | FY26E | FY27E | |
| Operating cash flow | 33599 | 30339 | 27617 | 71087 | 79865 |
| Profit for the year | 6189 | 9179 | 6791 | 19017 | 36803 |
| Depreciation & amortization | 16140 | 17562 | 18552 | 22623 | 29435 |
| Change in working capital | 6887 | 386 | (2458) | 26034 | 9247 |
| Others | 4382 | 3212 | 4732 | 3414 | 4380 |
| Investing cash flow | (25730) | (8101) | (31960) | (52067) | (39184) |
| Capex | (25719) | (16257) | (33083) | (54329) | (40755) |
| Others | (12) | 8156 | 1123 | 2262 | 1571 |
| Free cash flow | 7880 | 14082 | (5467) | 16757 | 39109 |
| Financing cash flow | (495) | (7151) | (1865) | (4416) | (21691) |
| Change in Capital | - | - | - | - | - |
| Net Change in Debt | 10498 | 17068 | 15426 | 10745 | (2605) |
| Others | (10994) | (24219) | (17291) | (15161) | (19086) |
| Exchange influence | (1196) | 2994 | (2177) | 1812 | 1496 |
| Total cash generated | 7373 | 15087 | (6209) | 14603 | 18990 |
| Key Financial Ratios | |||||
|---|---|---|---|---|---|
| Growth | |||||
| Revenue growth | -11.6% | 13.4% | 6.3% | 31.5% | 39.0% |
| Operating profit growth | -59.2% | 26.5% | 20.3% | 131.6% | 106.8% |
| Net profit growth | -56.4% | 48.3% | -26.0% | 180.0% | 93.5% |
| Profitability | |||||
| Gross profit margin | 18.1% | 18.9% | 19.8% | 24.5% | 30.0% |
| Operating Profit Margin | 6.1% | 6.7% | 7.6% | 13.4% | 20.0% |
| Net profit margin | 6.2% | 7.6% | 5.8% | 10.4% | 15.0% |
| Key Ratio | |||||
| ROA | 4.0% | 5.1% | 3.9% | 7.5% | 11.9% |
| ROE | 7.0% | 8.6% | 6.2% | 9.4% | 14.6% |
| Stability | |||||
| Gross debt/equity | 80.7 | 75.0 | 57.8 | 44.1 | 34.5 |
| Interest Coverage | - | - | - | - | - |
| Current Ratio | 1.4 | 1.9 | 1.8 | 1.9 | 2.2 |
| Quick Ratio | 1.2 | 1.7 | 1.5 | 1.5 | 1.8 |
| Net debt/equity | Net Cash | Net Cash | Net Cash | Net Cash | Net Cash |
Rating definitions
Benchmark: Hang Seng Index (Hong Kong)
Company ratings
Buy
Stock expected to outperform benchmark by more than 10 %
Hold
Expected stock relative performance ranges between -10 % and 10 %
Underperform
Stock expected to underperform benchmark by more than 10 %
Sector ratings
Positive
Sector expected to outperform benchmark by more than 10%
Neutral
Expected sector relative performance ranges between -10% and 10%
Cautious
Sector expected to underperform benchmark by more than 10%
Hong Kong
Company
GF Securities (Hong Kong) Brokerage Limited
Address
27/F, GF Tower, 81 Lockhart Road, Wan Chai, Hong Kong
Telephone
(852) 37191111
michellejing@gfgroup.com.hk
Disclaimer
This report has been prepared by GF Securities (Hong Kong) Brokerage Limited ('GF Securities (Hong Kong) Brokerage'). According to the laws, regulations and regulatory requirements in different countries and regions, this report is distributed by GF Securities (Hong Kong) Brokerage with relevant legal and compliant operation qualifications in these countries and regions.
GF Securities (Hong Kong) Brokerage is licensed by the Securities and Futures Commission of Hong Kong ('SFC') to conduct Type 4 Regulated Activity 'Advising on Securities'. It is regulated by the SFC, and is responsible for the distribution of this report in Hong Kong. Information about the qualifications of the research analyst(s) who is(are) the author(s) of this report as licensed by the SFC are disclosed in the section where research analyst names are shown.
The research analyst(s) primarily responsible for the content of this report, in whole or in part, certifies that with respect to the company or relevant securities that the analyst(s) covered in this report: 1) all of the views expressed accurately reflect his or her personal views on the company or relevant securities mentioned herein; and 2) no part of his or her remuneration was, is, or will be, directly or indirectly, in connection with his or her specific recommendations or views expressed in this report.
This report is published solely for information purpose and does not constitute an offer to buy or sell any securities or a solicitation of an offer to buy, or recommendation for investment in, any securities.
The securities mentioned in this report may not be allowed to be sold in certain jurisdictions. No action has been taken to permit the distribution of the research report to any person in any jurisdiction that the circulation or distribution of such research report is unlawful. This report is distributed solely to clients or designated institutions authorized by GF Securities (Hong Kong) Brokerage, and is not distributed publicly. It is distributed to certain clients based on the conclusion that they are able to assess investment risks independently, execute investment decisions independently and assume corresponding risks independently.
This report has been issued and based on information obtained from sources generally available to the public and believed by the research analyst(s) to be reliable but which has not been independently verified. No representation or warranty, either express or implied, is made by GF Securities (Hong Kong) Brokerage as to their accuracy and completeness of the information contained in this report. GF Securities (Hong Kong) Brokerage accepts no liability for all loss arising from the use of the materials presented in this report, unless is excluded by applicable laws or regulations. Please be aware of the fact that investments involve risks and the price of securities may be fluctuated and therefore return may be varied, past results do not guarantee future performance. Any recommendation contained in this report does not have regard to the specific investment objectives, financial situation and the particular needs of any individuals. This report is not to be taken in substitution for the exercise of judgment by respective recipients of this report, where necessary, recipients should obtain professional advice before making investment decisions.
GF Securities (Hong Kong) Brokerage may have issued, and may in the future issue, other communications that are inconsistent with, and reach different conclusions from, the information presented in the research report. The points of view, opinions and analytical methods adopted in the research report are solely expressed by the analysts but not that of GF Securities (Hong Kong) Brokerage or its affiliates. The information, opinions and forecasts presented in the research report are the current opinions of the analysts as of the date appearing on this material only which may subject to change at any time without notice. The salesperson, dealer or other professionals of GF Securities (Hong Kong) Brokerage may deliver opposite points of view to their clients and the proprietary trading division with respect to market commentary or dealing strategy either in writing or verbally. The proprietary trading division of GF Securities (Hong Kong) Brokerage may have different investment decision which may be contrary to the opinions expressed in the research report. GF Securities (Hong Kong) Brokerage or its affiliates or respective directors, officers, analysts and employees related to research report business may have rights and interests in securities mentioned in the research report. Recipients should be aware of relevant disclosure of interest (if any) when reading this report.
GF Securities (Hong Kong) Brokerage and its affiliates may be seeking or building business relationships with company(ies) mentioned in this report. Therefore, investors should consider the impact on the independence of this report by GF Securities (Hong Kong) Brokerage and its affiliates due to potential conflicts of interests. Investors should not make any investment decisions based solely on the contents of this report. Investors should make their own investment decisions and bear their own risk. No written or verbal commitment of sharing gains or losses from securities investments in any form shall be effective.
This report may contain and/or describe/present factual historical information on prices of Futures contracts (the 'information'). Please note that this information is solely for the purpose of forming part of the argument/grounds/evidence in our research methodology/analysis to support our conclusion on our view of the relevant industry/company mentioned. It does not, by any means (express or implied) to be associated with or constituted as SFC Type 5 Regulated Activity (Advising on futures contracts).
Disclosure of Interests
- 1) The research analyst(s) and his/her associate has not served as an officer of the company(ies) mentioned in this report, and does not have any financial interests in the company(ies) mentioned in this report.
- 2) GF Securities (Hong Kong) Brokerage and/or its affiliates does not have any financial interests and has not invested in interests aggregate to an amount equal to or more than (i) 1 % of the market capitalization; or (ii) 1 % of the issued share capital, or issued units, in the company(ies) mentioned in this report.
- 3) GF Securities (Hong Kong) Brokerage and/or its affiliates does not have any market making activities, and has not employed any individual(s) serving as officer(s) of the company(ies) mentioned in this report.
- 4) GF Securities (Hong Kong) Brokerage and/or its affiliates does not have any investment banking relationship in Hong Kong with the company(ies) mentioned in this report in the past 12 months.
Copyright © GF Securities (Hong Kong) Brokerage
Without the prior written consent obtained from GF Securities (Hong Kong) Brokerage, any part of the materials contained herein should not (i) in any forms be copied or reproduced or (ii) be re-disseminated.
圖片清單(已驗證 2026-07-02)
回補驗證:僅涵蓋已被 lib 頁嵌入的圖片,非全量驗證。
| 檔名 | size | 分類 | 親眼所見內容 |
|---|---|---|---|
報告_GF_臻鼎4958_20260525_001.png |
33815 bytes | 真資料圖 | 折線圖搭配多條水平參考灰/藍線,橫軸Aug-25至May-26,股價由約12上漲至約36 |