PDF 原檔:報告_Daiwa_雙鴻3324_20260713_original.pdf
圖片清單(已驗證 2026-07-14)
| 檔名 | size | 分類 | 親眼所見內容 |
|---|---|---|---|
260713_daiwa_AURAS_001.png |
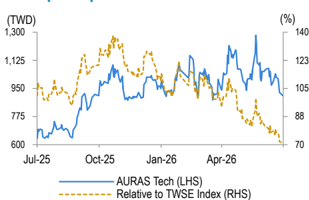
30KB | 真資料圖 | 股價走勢圖:AURAS Tech 股價(左軸 TWD 600–1,300)與相對 TWSE 指數表現(右軸 %),Jul-25 至 Jul-26 |
260713_daiwa_AURAS_002.png |
20KB | 文字卡 | 表格截圖:12-month range 640.00–1,280.00、市值 USD2.62bn、3m 日均成交 USD132.64m、股本 93m、大股東 Management 20.1% |
260713_daiwa_AURAS_003.png |
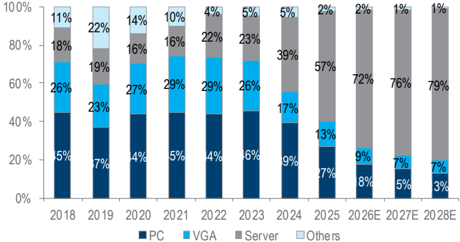
49KB | 真資料圖 | 產品組合堆疊柱狀圖 2018–2028E(PC/VGA/Server/Others 占比):Server 由 2025 57% 升至 2026E 72%、2027E 76%、2028E 79%,PC 與 VGA 占比逐年收斂 |
260713_daiwa_AURAS_004.png |
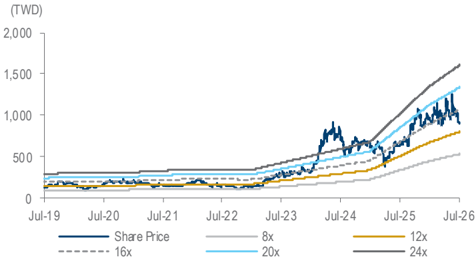
35KB | 真資料圖 | 1 年 forward PER band 圖(8x/12x/16x/20x/24x)與股價,Jul-19 至 Jul-26 |
原始內容
Taiwan
AURAS Technology (3324 TT)
Target price:
TWD1,640.00 (from TWD1,670.00)
Share price (13 Jul): TWD905.00 | Up/downside:
+81.2%
2Q26 results preview: stronger 2H26 outlook vs. 1H26
- Gross margin likely slightly down QoQ due to VGA and PC segments
- Solid order visibility with multiple thermal components and applications
- Reiterating our Buy (1) rating; trimming our 12-month TP to TWD1,640
What's new: Based on our recent check with management, we see a brighter-than-expected order outlook for 2H26, thanks to stronger-thanexpected demand for GB300 and ASICs. We reaffirm our Buy (1) rating, as we believe Auras' progress and speciality in liquid-cooling development and projects will continue to gain order share in GPU and ASIC AI servers. See our memo, 7 July 2026.
What's the impact: 2Q26 results preview (see page 2). Auras recorded an all-time high quarterly revenue of TWD8,699m (+1.7% QoQ and +63.9% YoY) for 2Q26. For its upcoming 2Q26 results, we now expect its EPS to be TWD12.33 vs. our previous forecast of TWD13.38 and the Bloomberg consensus forecast of TWD13.29, mainly on slightly weaker-than-expected gross margin of 29% (Daiwa forecast vs. previous forecast of 29.8% and the Bloomberg consensus forecast of 29.5%) due to lower-than-expected utilisation rates in the VGA and PC segments. We now expect its 3Q26 revenue to be TWD9,400m (+8.1% QoQ and +57.8% YoY vs. previous TWD9,900m and the Bloomberg consensus forecast of TWD9,427m). In our view, this revenue momentum is likely to mainly come from GB300 and one US CSP project. However, looking to 4Q26, we forecast its revenue of TWD10,790m (vs. our previous TWD9,979m and Bloomberg consensus forecast of TWD9,955m). We expect some revenue upside potential from the transition of liquid cooling from air cooling to CPU projects.
Stronger 2H26 outlook vs. 1H26, with rising liquid-cooling revenue exposure; complete thermal solutions. Auras maintained its revenue guidance of 60-70% YoY growth for 2026, mainly due to orders for DIMM cold plates and one ASIC project in 2H26. For its product offering, Auras has solid, comprehensive solutions in cold plate modules, manifolds (inner manifolds, rack manifolds, and building manifolds), and CDUs (air-to-liquid and liquid-to-liquid), helping it gain share from peers. We raise our 202628E EPS by 1-3%, mainly on higher revenue and operating margin assumptions.
What we recommend: We reiterate our Buy (1) call and trim our 12M TP to TWD1,640 (from TWD1,670), still based on a target PER of 25x, close to the midpoint of its past-3-year range of 11-38x (average PER: 20x), on our 1-year forward EPS. Key downside risks: softer-than-expected end-market demand, lower-than-expected penetration rate of new specs and delays in liquid-cooling development.
How we differ: Our 2027-28E EPS are 4-16% above Bloomberg consensus, as we are more aggressive on revenue and gross and operating margins.
Daiwa
5
3
→
2
1
Buy
Helen Chien
Helen Chien
(886) 2 8758 6254 helen.chien@daiwacm-cathay.com.tw
Neil Teng, CFA (886) 2 8758 6256 neil.teng@daiwacm-cathay.com.tw
Forecast revisions (%)
| Year to 31 Dec | 26E | 27E | 28E |
|---|---|---|---|
| Revenue change | 0.7 | 0.8 | 0.8 |
| Net profit change | (1.0) | (0.5) | 1.9 |
| Core EPS (FD) change | 0.5 | 1.0 | 3.4 |
Source: Daiwa forecasts
Share price performance
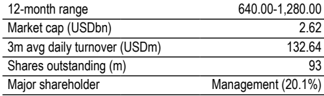
| 12-month range | 640.00-1,280.00 |
|---|---|
| Market cap (USDbn) | 2.62 |
| 3m avg daily turnover (USDm) | 132.64 |
| Shares outstanding (m) | 93 |
| Major shareholder | Management (20.1%) |
Financial summary (TWD)
| Year to 31 Dec | 26E | 27E | 28E |
|---|---|---|---|
| Revenue (m) | 37,441 | 46,096 | 55,458 |
| Operating profit (m) | 6,776 | 9,404 | 12,090 |
| Net profit (m) | 5,239 | 7,182 | 9,238 |
| Core EPS (fully-diluted) | 55.961 | 76.712 | 98.671 |
| EPS change (%) | 102.8 | 37.1 | 28.6 |
| Daiwa vs Cons. EPS (%) | (0.9) | 4.4 | 16.1 |
| PER (x) | 16.2 | 11.8 | 9.2 |
| Dividend yield (%) | 2.8 | 3.9 | 5.0 |
| DPS | 25.5 | 35.0 | 45.0 |
| PBR (x) | 5.7 | 4.5 | 3.6 |
| EV/EBITDA (x) | 11.8 | 8.8 | 6.8 |
| ROE (%) | 40.8 | 43.6 | 44.3 |
Source: FactSet, Daiwa forecasts
Auras: revenue and earnings forecasts revisions
| 2026E | 2026E | 2026E | 2027E | 2027E | 2027E | 2028E | 2028E | 2028E | |
|---|---|---|---|---|---|---|---|---|---|
| (TWDm) | New | Previous | Change | New | Previous | Change | New | Previous | Change |
| Sales | 37,441 | 37,173 | 0.7% | 46,096 | 45,749 | 0.8% | 55,458 | 55,023 | 0.8% |
| Gross profit | 11,232 | 11,338 | -0.9% | 14,520 | 14,411 | 0.8% | 17,747 | 17,607 | 0.8% |
| Gross margin | 30.0% | 30.5% | -0.5pp | 31.5% | 31.5% | 0pp | 32.0% | 32.0% | 0pp |
| Operating profit | 6,776 | 6,727 | 0.7% | 9,404 | 9,104 | 3.3% | 12,090 | 11,555 | 4.6% |
| Operating margin | 18.1% | 18.1% | 0pp | 20.4% | 19.9% | 0.5pp | 21.8% | 21.0% | 0.8pp |
| Net profit | 5,239 | 5,290 | -1.0% | 7,182 | 7,219 | -0.5% | 9,238 | 9,065 | 1.9% |
| Net margin | 14.0% | 14.2% | -0.2pp | 15.6% | 15.8% | -0.2pp | 16.7% | 16.5% | 0.2pp |
| Fully-diluted EPS (TWD) | 55.96 | 55.67 | 0.5% | 76.71 | 75.97 | 1.0% | 98.67 | 95.40 | 3.4% |
Source: Daiwa forecasts
Auras: 2Q26 results preview
| (TWDm) | Daiwa's 2Q26 forecasts | Our previous forecasts | Differ | Bloomberg consensus | Differ |
|---|---|---|---|---|---|
| Revenue | 8,699 | 8,742 | -0.5% | 8,790 | -1.0% |
| Gross profit | 2,523 | 2,605 | -3.2% | 2,590 | -2.6% |
| Operating profit | 1,483 | 1,565 | -5.3% | 1,579 | -6.1% |
| Profit before tax | 1,529 | 1,611 | -5.1% | 1,601 | -4.5% |
| Net profit | 1,138 | 1,235 | -7.8% | 1,232 | -7.6% |
| EPS | 12.33 | 13.38 | -7.9% | 13.29 | -7.3% |
| Margin | |||||
| Gross margin | 29.0% | 29.8% | -0.8pp | 29.5% | -0.5pp |
| Operating margin | 17.0% | 17.9% | -0.9pp | 18.0% | -0.9pp |
| Pre-tax margin | 17.6% | 18.4% | -0.9pp | 18.2% | -0.6pp |
| Net margin | 13.1% | 14.1% | -1pp | 14.0% | -0.9pp |
Source: Company, Bloomberg, Daiwa forecasts
Auras: quarterly and annual P&L
| 2026E | 2026E | 2026E | 2026E | 2027E | 2026E 2027E | 2026E 2027E | 2026E 2027E | 2028E | |||
|---|---|---|---|---|---|---|---|---|---|---|---|
| (TWDm) | 1Q26 | 2Q26E | 3Q26E | 4Q26E | 1Q27E | 2Q27E | 3Q27E | 4Q27E | |||
| Revenue | 8,552 | 8,699 | 9,400 | 10,790 | 10,400 | 10,800 | 12,100 | 12,796 | 37,441 | 46,096 | 55,458 |
| Gross profit | 2,537 | 2,523 | 2,820 | 3,353 | 3,172 | 3,326 | 3,812 | 4,210 | 11,232 | 14,520 | 17,747 |
| Operating profit | 1,520 | 1,483 | 1,670 | 2,103 | 2,022 | 2,096 | 2,512 | 2,774 | 6,776 | 9,404 | 12,090 |
| Pre-tax profit | 1,570 | 1,529 | 1,716 | 2,149 | 2,073 | 2,147 | 2,562 | 2,825 | 6,964 | 9,607 | 12,294 |
| Net profit | 1,164 | 1,138 | 1,290 | 1,647 | 1,529 | 1,589 | 1,926 | 2,138 | 5,239 | 7,182 | 9,238 |
| Basic EPS (TWD) | 12.61 | 12.33 | 13.97 | 17.84 | 16.56 | 17.21 | 20.85 | 23.15 | 56.74 | 77.78 | 100.05 |
| Margin | |||||||||||
| Gross margin | 29.7% | 29.0% | 30.0% | 31.1% | 30.5% | 30.8% | 31.5% | 32.9% | 30.0% | 31.5% | 32.0% |
| Operating margin | 17.8% | 17.0% | 17.8% | 19.5% | 19.4% | 19.4% | 20.8% | 21.7% | 18.1% | 20.4% | 21.8% |
| Pre-tax margin | 18.4% | 17.6% | 18.3% | 19.9% | 19.9% | 19.9% | 21.2% | 22.1% | 18.6% | 20.8% | 22.2% |
| Net margin | 13.6% | 13.1% | 13.7% | 15.3% | 14.7% | 14.7% | 15.9% | 16.7% | 14.0% | 15.6% | 16.7% |
| YoY | |||||||||||
| Revenue | 93.7% | 63.9% | 57.8% | 42.0% | 21.6% | 24.1% | 28.7% | 18.6% | 60.9% | 23.1% | 20.3% |
| Gross profit | 109.9% | 81.9% | 59.0% | 67.3% | 25.1% | 31.9% | 35.2% | 25.6% | 76.3% | 29.3% | 22.2% |
| Operating profit | 169.7% | 134.0% | 68.3% | 96.7% | 33.1% | 41.4% | 50.4% | 31.9% | 107.9% | 38.8% | 28.6% |
| Pre-tax profit | 135.6% | 625.2% | 42.4% | 79.8% | 32.0% | 40.5% | 49.3% | 31.4% | 112.5% | 38.0% | 28.0% |
| Net profit | 127.7% | 620.0% | 32.5% | 77.3% | 31.4% | 39.6% | 49.3% | 29.8% | 103.7% | 37.1% | 28.6% |
| QoQ | |||||||||||
| Revenue | 12.6% | 1.7% | 8.1% | 14.8% | -3.6% | 3.8% | 12.0% | 5.8% | |||
| Gross profit | 26.6% | -0.5% | 11.8% | 18.9% | -5.4% | 4.9% | 14.6% | 10.5% | |||
| Operating profit | 42.1% | -2.4% | 12.6% | 25.9% | -3.9% | 3.7% | 19.8% | 10.4% | |||
| Pre-tax profit | 31.3% | -2.6% | 12.2% | 25.2% | -3.5% | 3.6% | 19.3% | 10.2% | |||
| Net profit | 25.3% | -2.2% | 13.3% | 27.7% | -7.2% | 3.9% | 21.2% | 11.0% |
Source: Company, Daiwa forecasts
Auras: product mix
Source: Company, Daiwa forecasts
AURAS Technology (3324 TT): 13 July 2026
Auras: 1-year forward PER
Source: Bloomberg, Daiwa forecasts
Daiwa
Financial summary
Key assumptions
| Year to 31 Dec | 2021 | 2022 | 2023 | 2024 | 2025 | 2026E | 2027E | 2028E |
|---|---|---|---|---|---|---|---|---|
| Server revenue YoY growth (%) | 17.7 | 37.7 | (5.8) | 109.7 | 117.9 | 102 | 30 | 25 |
| PC revenue YoY growth (%) | 20.5 | (4.9) | (4.6) | 5.4 | 1.7 | 5 | 5 | 5 |
| VGA revenue YoY growth (%) | 26.6 | (2.3) | (17.6) | (20.5) | 18.1 | 5 | 5 | 5 |
| Others revenue YoY growth (%) | (15.2) | (58.5) | 5.2 | 35.7 | (37.7) | 10 | 10 | 10 |
Profit and loss (TWDm)
| Year to 31 Dec | 2021 | 2022 | 2023 | 2024 | 2025 | 2026E | 2027E | 2028E |
|---|---|---|---|---|---|---|---|---|
| Server | 2,257 | 3,107 | 2,927 | 6,139 | 13,375 | 27,018 | 35,123 | 43,904 |
| PC | 6,422 | 6,106 | 5,824 | 6,138 | 6,242 | 6,554 | 6,882 | 7,226 |
| Other Revenue | 5,579 | 4,643 | 3,962 | 3,502 | 3,659 | 3,868 | 4,091 | 4,328 |
| Total Revenue | 14,258 | 13,857 | 12,713 | 15,779 | 23,276 | 37,441 | 46,096 | 55,458 |
| Other income | 0 | 0 | 0 | 0 | 0 | 0 | 0 | 0 |
| COGS | (11,595) | (11,135) | (9,708) | (11,753) | (16,904) | (26,208) | (31,576) | (37,711) |
| SG&A | (771) | (914) | (951) | (1,201) | (1,702) | (2,583) | (3,042) | (3,438) |
| Other op.expenses | (513) | (635) | (678) | (914) | (1,411) | (1,873) | (2,074) | (2,218) |
| Operating profit | 1,379 | 1,173 | 1,376 | 1,911 | 3,259 | 6,776 | 9,404 | 12,090 |
| Net-interest inc./(exp.) | (22) | (29) | (5) | 9 | (34) | (96) | (96) | (96) |
| Assoc/forex/extraord./others | 64 | 483 | 197 | 446 | 53 | 284 | 300 | 300 |
| Pre-tax profit | 1,421 | 1,628 | 1,568 | 2,366 | 3,277 | 6,964 | 9,607 | 12,294 |
| Tax | (268) | (341) | (329) | (434) | (580) | (1,323) | (1,825) | (2,336) |
| Min. int./pref. div./others | (21) | (23) | (7) | (39) | (126) | (401) | (600) | (720) |
| Net profit (reported) | 1,133 | 1,264 | 1,232 | 1,893 | 2,572 | 5,239 | 7,182 | 9,238 |
| Net profit (adjusted) | 1,133 | 1,264 | 1,232 | 1,893 | 2,572 | 5,239 | 7,182 | 9,238 |
| EPS (reported)(TWD) | 13.117 | 14.676 | 14.281 | 21.227 | 28.256 | 56.742 | 77.782 | 100.046 |
| EPS (adjusted)(TWD) | 13.117 | 14.676 | 14.281 | 21.227 | 28.256 | 56.742 | 77.782 | 100.046 |
| EPS (adjusted fully-diluted)(TWD) | 12.596 | 14.044 | 13.678 | 20.688 | 27.598 | 55.961 | 76.712 | 98.671 |
| DPS (TWD) | 6.000 | 6.500 | 6.350 | 10.000 | 12.000 | 25.534 | 35.002 | 45.021 |
| EBIT | 1,379 | 1,173 | 1,376 | 1,911 | 3,259 | 6,776 | 9,404 | 12,090 |
| EBITDA | 1,899 | 1,709 | 1,847 | 2,420 | 3,931 | 7,447 | 10,076 | 12,762 |
Cash flow (TWDm)
| Year to 31 Dec | 2021 | 2022 | 2023 | 2024 | 2025 | 2026E | 2027E | 2028E |
|---|---|---|---|---|---|---|---|---|
| Profit before tax | 1,421 | 1,628 | 1,568 | 2,366 | 3,277 | 6,964 | 9,607 | 12,294 |
| Depreciation and amortisation | 520 | 536 | 470 | 509 | 672 | 672 | 672 | 672 |
| Tax paid | (149) | (271) | (368) | (468) | (417) | (1,323) | (1,825) | (2,336) |
| Change in working capital | (233) | (769) | 296 | (667) | (3,812) | (3,706) | (3,874) | (2,752) |
| Other operational CF items | (115) | 116 | 6 | (97) | (315) | 96 | 96 | 96 |
| Cash flow from operations | 1,444 | 1,240 | 1,971 | 1,643 | (594) | 2,703 | 4,677 | 7,974 |
| Capex | (1,030) | (615) | (835) | (1,436) | (2,234) | (2,000) | (2,000) | (2,000) |
| Net (acquisitions)/disposals | 96 | 11 | (85) | (41) | (370) | (376) | (376) | (376) |
| Other investing CF items | (105) | (28) | (134) | (90) | (90) | 0 | 0 | 0 |
| Cash flow from investing | (1,038) | (633) | (1,053) | (1,567) | (2,695) | (2,376) | (2,376) | (2,376) |
| Change in debt | 677 | (61) | (386) | 1,608 | 2,762 | 0 | 0 | 0 |
| Net share issues/(repurchases) | (447) | 0 | 0 | 167 | 155 | 0 | 0 | 0 |
| Dividends paid | (482) | (517) | (577) | (571) | (903) | (1,108) | (2,358) | (3,232) |
| Other financing CF items | (51) | (52) | (43) | 160 | (64) | 0 | 0 | 0 |
| Cash flow from financing | (303) | (629) | (1,007) | 1,364 | 1,950 | (1,108) | (2,358) | (3,232) |
| Forex effect/others | 0 | 0 | 0 | 0 | 0 | 0 | 0 | 0 |
| Change in cash | 102 | (22) | (89) | 1,441 | (1,338) | (781) | (57) | 2,366 |
| Free cash flow | 414 | 625 | 1,136 | 208 | (2,828) | 703 | 2,677 | 5,974 |
Source: FactSet, Daiwa forecasts
AURAS Technology (3324 TT): 13 July 2026
Daiwa
Financial summary continued …
Balance sheet (TWDm)
| Year to 31 Dec | 2021 | 2022 | 2023 | 2024 | 2025 | 2026E | 2027E | 2028E |
|---|---|---|---|---|---|---|---|---|
| Cash & short-term investment | 1,494 | 1,484 | 1,366 | 2,809 | 1,439 | 657 | 600 | 2,966 |
| Inventory | 2,301 | 2,081 | 2,391 | 2,934 | 6,179 | 7,949 | 10,494 | 11,947 |
| Accounts receivable | 4,849 | 4,570 | 4,613 | 5,462 | 10,128 | 14,538 | 18,919 | 22,148 |
| Other current assets | 334 | 286 | 284 | 475 | 842 | 842 | 842 | 842 |
| Total current assets | 8,978 | 8,420 | 8,653 | 11,680 | 18,587 | 23,987 | 30,856 | 37,904 |
| Fixed assets | 2,442 | 2,715 | 3,126 | 4,083 | 6,150 | 6,750 | 7,350 | 7,950 |
| Goodwill & intangibles | 125 | 173 | 187 | 212 | 197 | 197 | 197 | 197 |
| Other non-current assets | 350 | 435 | 646 | 951 | 1,190 | 1,190 | 1,190 | 1,190 |
| Total assets | 11,895 | 11,743 | 12,612 | 16,926 | 26,125 | 32,125 | 39,593 | 47,241 |
| Short-term debt | 416 | 1,498 | 232 | 475 | 2,678 | 2,678 | 2,678 | 2,678 |
| Accounts payable | 4,938 | 3,668 | 4,136 | 5,019 | 9,311 | 11,813 | 14,891 | 16,847 |
| Other current liabilities | 315 | 454 | 419 | 407 | 534 | 122 | 122 | 122 |
| Total current liabilities | 5,670 | 5,620 | 4,787 | 5,902 | 12,523 | 14,612 | 17,691 | 19,647 |
| Long-term debt | 350 | 255 | 172 | 313 | 630 | 630 | 630 | 630 |
| Other non-current liabilities | 967 | 58 | 786 | 1,423 | 1,477 | 1,477 | 1,477 | 1,477 |
| Total liabilities | 6,986 | 5,933 | 5,745 | 7,638 | 14,630 | 16,719 | 19,798 | 21,754 |
| Share capital | 884 | 884 | 895 | 918 | 931 | 923 | 923 | 923 |
| Reserves/R.E./others | 3,859 | 4,682 | 5,741 | 8,043 | 10,154 | 13,671 | 17,461 | 22,432 |
| Shareholders' equity | 4,743 | 5,566 | 6,635 | 8,961 | 11,085 | 14,594 | 18,384 | 23,356 |
| Minority interests | 166 | 244 | 231 | 327 | 410 | 811 | 1,411 | 2,131 |
| Total equity & liabilities | 11,895 | 11,743 | 12,612 | 16,926 | 26,125 | 32,125 | 39,593 | 47,241 |
| EV | 83,671 | 84,746 | 83,502 | 82,540 | 86,512 | 87,695 | 88,352 | 86,706 |
| Net debt/(cash) | (728) | 269 | (961) | (2,020) | 1,869 | 2,651 | 2,708 | 342 |
| BVPS (TWD) | 53.654 | 62.968 | 74.140 | 97.655 | 119.093 | 158.055 | 199.102 | 252.946 |
Key ratios (%)
| Year to 31 Dec | 2021 | 2022 | 2023 | 2024 | 2025 | 2026E | 2027E | 2028E |
|---|---|---|---|---|---|---|---|---|
| Sales (YoY) | 16.7 | (2.8) | (8.3) | 24.1 | 47.5 | 60.9 | 23.1 | 20.3 |
| EBITDA (YoY) | (3.9) | (10.0) | 8.0 | 31.1 | 62.4 | 89.5 | 35.3 | 26.7 |
| Operating profit (YoY) | (11.7) | (14.9) | 17.3 | 38.8 | 70.6 | 107.9 | 38.8 | 28.6 |
| Net profit (YoY) | 1.9 | 11.6 | (2.5) | 53.6 | 35.9 | 103.7 | 37.1 | 28.6 |
| Core EPS (fully-diluted) (YoY) | (0.2) | 11.5 | (2.6) | 51.3 | 33.4 | 102.8 | 37.1 | 28.6 |
| Gross-profit margin | 18.7 | 19.6 | 23.6 | 25.5 | 27.4 | 30 | 31.5 | 32 |
| EBITDA margin | 13.3 | 12.3 | 14.5 | 15.3 | 16.9 | 19.9 | 21.9 | 23 |
| Operating-profit margin | 9.7 | 8.5 | 10.8 | 12.1 | 14.0 | 18.1 | 20.4 | 21.8 |
| Net profit margin | 7.9 | 9.1 | 9.7 | 12.0 | 11.1 | 14 | 15.6 | 16.7 |
| ROAE | 24.3 | 24.5 | 20.2 | 24.3 | 25.7 | 40.8 | 43.6 | 44.3 |
| ROAA | 10.3 | 10.7 | 10.1 | 12.8 | 11.9 | 18 | 20 | 21.3 |
| ROCE | 26.5 | 17.7 | 18.6 | 22.0 | 26.2 | 40.4 | 45 | 46.6 |
| ROIC | 29.9 | 18.1 | 18.2 | 23.7 | 26.0 | 34.9 | 37.6 | 40.5 |
| Net debt to equity | n.a. | 4.8 | n.a. | n.a. | 16.9 | 18.2 | 14.7 | 1.5 |
| Effective tax rate | 18.8 | 21.0 | 21.0 | 18.4 | 17.7 | 19 | 19 | 19 |
| Accounts receivable (days) | 122.0 | 124.1 | 131.8 | 116.5 | 122.2 | 120.2 | 132.5 | 135.1 |
| Current ratio (x) | 1.6 | 1.5 | 1.8 | 2.0 | 1.5 | 1.6 | 1.7 | 1.9 |
| Net interest cover (x) | 63.6 | 40.9 | 255.1 | n.a. | 95.8 | 70.4 | 97.7 | 125.6 |
| Net dividend payout | 45.7 | 44.3 | 44.5 | 47.1 | 42.5 | 45 | 45 | 45 |
| Free cash flow yield | 0.5 | 0.7 | 1.3 | 0.2 | n.a. | 0.8 | 3.2 | 7.1 |
Source: FactSet, Daiwa forecasts
Company profile
Founded in 1998 and listed on Taiwan's OTC stock board in May 2005, AURAS Technology (Auras) is a leading global thermal solutions provider that offers a one-stop shopping model. Its major clients include Quanta, Compal, HP, Lenovo, Dell, Amazon and Meta. Major applications for the company's products are notebooks (consumer, commercial and gaming), desktops, VGA, servers and others.
AURAS Technology (3324 TT): 13 July 2026
Daiwa
ESG analysis
ESG risks
| Risks | Management | Analyst comments | |
|---|---|---|---|
| G | Executive/board quality | 2 | The CEO and Chairperson of Auras are the same individual, and we see the Chairperson has served as Auras' vice president for 14 years, which is a positive sign from an executive perspective. We see no issue with its board quality. |
| G | Capital management | 2 | Auras' dividend payout ratio was 42-46% over 2019-25, which we consider reasonable as the company is at a fast-growing stage. |
| G | Related party & transaction | 2 | Cost of goods generated from related-party transactions was less than 1% of total COGS during 2022-25, and we found no suspicious activity. |
| E | Supply chain management | 1 | Auras has a complete process to select and review its supply chain to make sure its supply- chain management meets ESG requirements. For example, those who submit ICP testing report and have ISO9001, QC080000 and ESG-related certifications would be the preferred choice as suppliers. |
| E | Data security | 2 | To protect business information, Auras introduced the ISO 27001 management system in 2022, improving its information security system. Thus, when the company's business activities are affected by major disasters or equipment failure, Auras can effectively reduce the damage to an acceptable level, and ensure that the information operation process can be rebuilt. |
Note: Management score represents a company's ability to manage/benefit from certain ESG topics. The scores range from 1 to 3, with 1 being the strongest.
Update Date: 6 May 2026
Source: Daiwa, Company
AURAS Technology (3324 TT): 13 July 2026
Daiwa