PDF 原檔:報告_Daiwa_邁科6831_20260722_original.pdf
圖片清單(已驗證 2026-07-23)
| 檔名 | size | 分類 | 親眼所見內容 |
|---|---|---|---|
報告_Daiwa_邁科6831_20260722_003.png |
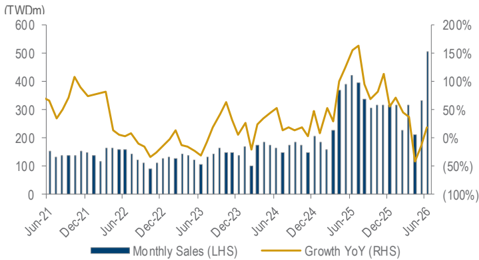
44KB | 真資料圖 | 邁科月營收柱狀圖(TWDm,左軸)與 YoY 成長率折線圖(右軸),Jun-21 至 Jun-26,顯示 2025 下半年起營收與成長率同步跳升 |
報告_Daiwa_邁科6831_20260722_004.png |
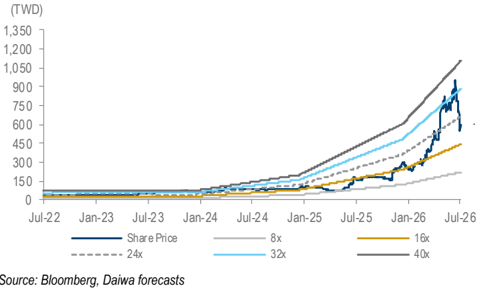
41KB | 真資料圖 | 邁科 1 年期遠期 PER 圖,股價線疊加 8x/16x/24x/32x/40x 估值倍數帶,顯示股價自 2025 年中起穿越上緣區間 |
其餘 001、002 均 <40KB,依規則預設非必要逐張 Read 之候選(推測為封面/版頭圖)。
原始內容
Taiwan
Taiwan Microloops (6831 TT)
Target price:
TWD1,325.00 (from TWD1,150.00)
Share price (22 Jul): TWD635.00 | Up/downside: +108.7%
Intact fundamentals - accumulate on weakness
- Intact strong earnings visibility over 2026-28E
- Upside from rising order volume from a key ODM client
- Reaffirming our Buy (1) rating and raising 12-month TP to TWD1,325
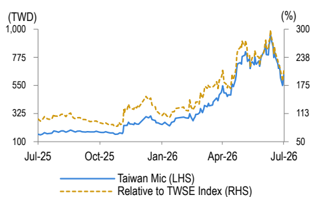
What's new: Microloops' share price has corrected by 27% MTD, which we attribute to profit taking pressure on top of stock market volatility. However, based on our market research, we believe its fundamentals remain strong considering the stock is trading at a 2027E PER of 16.9x, supported by a 139.7% earnings CAGR over 2026-28E. We reaffirm our Buy (1) rating, as we believe Microloops' progress in liquid-cooling projects will continue to gain order share in ASIC AI servers, and it benefits from its strategic position with its key ODM client. See our Initiation report, 18 June 2026.
What's the impact: 2Q26 results preview (see P2). Microloops recorded strong revenue of TWD1,047m (+22.5% QoQ and +0.6% YoY) for its preliminary 2Q26 revenue. With its 2Q26 results scheduled to be released in mid-August, we now expect its EPS at TWD1.09, vs. our previous forecast of TWD1.08 and the Bloomberg consensus forecast of TWD2.35. We now expect its 3Q26 revenue to be TWD2,400m (+129.3% QoQ; +107.9% YoY) vs. our previous forecast of TWD2,900m and Bloomberg consensus of TWD2,572m. In our view, the revenue momentum will likely be driven by one US CSP project in 2026. Looking to 4Q26E, we forecast revenue of TWD3,105m vs. previous forecast of TWD3,029m and Bloomberg consensus of TWD2,540m.
A preferred name in thermal solutions with order share gain potential.
Microloops is a key partner of its main ODM client for air- and liquidcooling solutions for ASICs, presenting revenue upside for Microloops (switch and new clients). Microloops' air-cooling orders share for one of its key US CSPs has surpassed 40% currently and we expect Microloops to see ASP upgrade benefits from air-cooling to liquid-cooling mainly in 2027. Given the gross margin for Taiwan thermal solutions has trended up due to thermal design power (TDP) upgrade, which offers gross margin upside for Microloops, we assume gross margins of 26% in 2026E and 28% in 2027E. We trim our 2026E EPS by 3% on our relatively conservative revenue assumptions, but our EPS for 2027-28E remains largely unchanged.
What we recommend: We reaffirm our Buy (1) call and raise our 12M TP to TWD1,325 (from TWD1,150), still based on a target PER of 40x, implying a 0.29x PEG over 2026-28E, applied to our 1-year-forward EPS. Key downside risks: weaker-than-expected global AI server demand and slower-than expected ASIC AI server development progress.
How we differ: Our 2027E EPS is 18% higher than the Bloomberg consensus, likely on our more aggressive revenue and gross-/operatingmargin assumptions.
Daiwa
5
3
→
2
1
Buy
Helen Chien
Helen Chien
(886) 2 8758 6254 helen.chien@daiwacm-cathay.com.tw
Neil Teng, CFA (886) 2 8758 6256 neil.teng@daiwacm-cathay.com.tw
Forecast revisions (%)
| Year to 31 Dec | 26E | 27E | 28E |
|---|---|---|---|
| Revenue change | (4.8) | (4.8) | (4.8) |
| Net profit change | (2.9) | 0.1 | 0.2 |
| Core EPS (FD) change | (2.9) | 0.1 | 0.2 |
Source: Daiwa forecasts
Share price performance
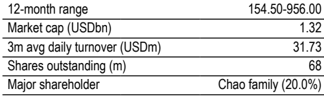
| 12-month range | 154.50-956.00 |
|---|---|
| Market cap (USDbn) | 1.32 |
| 3m avg daily turnover (USDm) | 31.73 |
| Shares outstanding (m) | 68 |
| Major shareholder | Chao family (20.0%) |
Financial summary (TWD)
| Year to 31 Dec | 26E | 27E | 28E |
|---|---|---|---|
| Revenue (m) | 7,407 | 14,813 | 29,626 |
| Operating profit (m) | 1,369 | 3,377 | 7,792 |
| Net profit (m) | 1,017 | 2,533 | 5,844 |
| Core EPS (fully-diluted) | 15.067 | 37.527 | 86.575 |
| EPS change (%) | 205.1 | 149.1 | 130.7 |
| Daiwa vs Cons. EPS (%) | (0.8) | 17.9 | 0.2 |
| PER (x) | 42.1 | 16.9 | 7.3 |
| Dividend yield (%) | 1.4 | 3.5 | 8.2 |
| DPS | 9.0 | 22.5 | 51.9 |
| PBR (x) | 12.2 | 8.0 | 4.4 |
| EV/EBITDA (x) | 26.7 | 11.9 | 5.5 |
| ROE (%) | 32.2 | 57.2 | 77.6 |
Source: FactSet, Daiwa forecasts
Microloops: revenue and earnings forecasts revisions
| 2026E | 2026E | 2026E | 2027E | 2027E | 2027E | 2028E | 2028E | 2028E | |
|---|---|---|---|---|---|---|---|---|---|
| (TWDm) | New | Previous | Change | New | Previous | Change | New | Previous | Change |
| Sales | 7,407 | 7,777 | -4.8% | 14,813 | 15,554 | -4.8% | 29,626 | 31,108 | -4.8% |
| Gross profit | 1,926 | 2,022 | -4.8% | 4,148 | 4,200 | -1.2% | 8,888 | 9,021 | -1.5% |
| Gross margin | 26.0% | 26.0% | 0pp | 28.0% | 27.0% | 1pp | 30.0% | 29.0% | 1pp |
| Operating profit | 1,369 | 1,414 | -3.2% | 3,377 | 3,375 | 0.1% | 7,792 | 7,777 | 0.2% |
| Operating margin | 18.5% | 18.2% | 0.3pp | 22.8% | 21.7% | 1.1pp | 26.3% | 25.0% | 1.3pp |
| Net profit | 1,017 | 1,047 | -2.9% | 2,533 | 2,531 | 0.1% | 5,844 | 5,833 | 0.2% |
| Net margin | 13.7% | 13.5% | 0.3pp | 17.1% | 16.3% | 0.8pp | 19.7% | 18.8% | 1pp |
| Fully-diluted EPS (TWD) | 15.07 | 15.51 | -2.9% | 37.53 | 37.50 | 0.1% | 86.58 | 86.41 | 0.2% |
Source: Daiwa forecasts
Microloops: 2Q26 results preview
| (TWDm) | Daiwa's 2Q26 forecasts | Our previous forecasts | Differ | Bloomberg consensus | Differ |
|---|---|---|---|---|---|
| Revenue | 1,047 | 993 | 5.4% | 1,436 | -27.1% |
| Gross profit | 230 | 228 | 0.8% | 365 | -36.9% |
| Operating profit | 114 | 116 | -1.8% | 239 | -52.2% |
| Profit before tax | 100 | 97 | 3.0% | 224 | -55.5% |
| Net profit | 74 | 73 | 1.6% | 171 | -56.8% |
| EPS (TWD) | 1.09 | 1.08 | 1.6% | 2.35 | -53.5% |
| Margin | |||||
| Gross margin | 22.0% | 23.0% | -1pp | 25.4% | -3.4pp |
| Operating margin | 10.9% | 11.7% | -0.8pp | 16.6% | -5.7pp |
| Pre-tax margin | 9.5% | 9.8% | -0.2pp | 15.6% | -6.1pp |
| Net margin | 7.1% | 7.3% | -0.3pp | 11.9% | -4.8pp |
Source: Company, Bloomberg, Daiwa forecasts
Microloops: quarterly and annual P&L
| 2026E | 2026E | 2026E | 2026E | 2027E | 2027E | 2027E | 2027E | 2026E | 2027E | 2028E | |
|---|---|---|---|---|---|---|---|---|---|---|---|
| (TWDm) | 1Q26 | 2Q26E | 3Q26E | 4Q26E | 1Q27E | 2Q27E | 3Q27E | 4Q27E | |||
| Revenue | 854 | 1,047 | 2,400 | 3,105 | 3,000 | 3,300 | 3,900 | 4,613 | 7,407 | 14,813 | 29,626 |
| Gross profit | 156 | 230 | 648 | 892 | 780 | 891 | 1,092 | 1,385 | 1,926 | 4,148 | 8,888 |
| Operating profit | 56 | 114 | 504 | 695 | 630 | 726 | 917 | 1,105 | 1,369 | 3,377 | 7,792 |
| Pre-tax profit | 56 | 100 | 505 | 696 | 630 | 726 | 917 | 1,105 | 1,356 | 3,377 | 7,792 |
| Net profit | 45 | 74 | 373 | 525 | 473 | 545 | 687 | 829 | 1,017 | 2,533 | 5,844 |
| Basic EPS (TWD) | 0.66 | 1.09 | 5.53 | 7.78 | 7.00 | 8.07 | 10.18 | 12.28 | 15.07 | 37.53 | 86.58 |
| Margin | |||||||||||
| Gross margin | 18.2% | 22.0% | 27.0% | 28.7% | 26.0% | 27.0% | 28.0% | 30.0% | 26.0% | 28.0% | 30.0% |
| Operating margin | 6.5% | 10.9% | 21.0% | 22.4% | 21.0% | 22.0% | 23.5% | 24.0% | 18.5% | 22.8% | 26.3% |
| Pre-tax margin | 6.5% | 9.5% | 21.0% | 22.4% | 21.0% | 22.0% | 23.5% | 24.0% | 18.3% | 22.8% | 26.3% |
| Net margin | 5.2% | 7.1% | 15.6% | 16.9% | 15.8% | 16.5% | 17.6% | 18.0% | 13.7% | 17.1% | 19.7% |
| YoY | |||||||||||
| Revenue | 50.7% | 0.6% | 107.9% | 230.1% | 251.1% | 215.3% | 62.5% | 48.6% | 100.0% | 100.0% | 100.0% |
| Gross profit | 30.7% | 10.0% | 102.1% | 306.7% | 401.6% | 286.9% | 68.5% | 55.2% | 121.8% | 115.4% | 114.3% |
| Operating profit | 150.6% | 3.4% | 137.1% | 759.0% | 1,025.9% | 536.3% | 81.8% | 58.9% | 221.3% | 146.7% | 130.7% |
| Pre-tax profit | 232.5% | 143.5% | 147.3% | 703.1% | 1,030.3% | 627.7% | 81.6% | 58.8% | 289.2% | 149.1% | 130.7% |
| Net profit | 232.5% | 190.9% | 150.1% | 366.5% | 959.7% | 637.5% | 84.1% | 57.8% | 238.3% | 149.1% | 130.7% |
| QoQ | |||||||||||
| Revenue | -9.2% | 22.5% | 129.3% | 29.4% | -3.4% | 10.0% | 18.2% | 18.3% | |||
| Gross profit | -29.1% | 48.1% | 181.4% | 37.6% | -12.5% | 14.2% | 22.6% | 26.8% | |||
| Operating profit | -30.9% | 103.9% | 341.7% | 37.9% | -9.4% | 15.2% | 26.2% | 20.6% | |||
| Pre-tax profit | -35.7% | 79.0% | 405.8% | 37.9% | -9.5% | 15.2% | 26.2% | 20.6% | |||
| Net profit | -60.4% | 65.6% | 405.8% | 40.6% | -10.0% | 15.2% | 26.2% | 20.6% |
Source: Company, Daiwa forecasts
Microloops: monthly sales
Source: Company, Daiwa forecasts
Taiwan Microloops (6831 TT): 22 July 2026
Microloops: 1-year-forward PER
Source: Bloomberg, Daiwa forecasts
Daiwa
Financial summary
Key assumptions
| Year to 31 Dec | 2021 | 2022 | 2023 | 2024 | 2025 | 2026E | 2027E | 2028E |
|---|---|---|---|---|---|---|---|---|
| Thermal module revenue growth (%) | 74.4 | 7.6 | 2.1 | 22.1 | 84.7 | 100.0 | 100.0 | 100.0 |
| Others revenue growth (%) | 111.1 | 81.5 | (51.9) | (9.7) | 289.9 | 100.0 | 100.0 | 100.0 |
| Key ASIC project revenue (TWDm) | 0 | 0 | 0.0 | 0.0 | 0 | 2,520.0 | 6,804.0 | 15,750.0 |
Profit and loss (TWDm)
| Year to 31 Dec | 2021 | 2022 | 2023 | 2024 | 2025 | 2026E | 2027E | 2028E |
|---|---|---|---|---|---|---|---|---|
| Thermal module | 1,493 | 1,607 | 1,641 | 2,005 | 3,702 | 7,403 | 14,806 | 29,612 |
| Others | 1 | 1 | 1 | 0 | 2 | 4 | 7 | 14 |
| Other Revenue | 30 | 0 | 0 | 0 | 0 | 0 | 0 | 0 |
| Total Revenue | 1,524 | 1,608 | 1,642 | 2,005 | 3,703 | 7,407 | 14,813 | 29,626 |
| Other income | 0 | 0 | 0 | 0 | 0 | 0 | 0 | 0 |
| COGS | (1,245) | (1,245) | (1,258) | (1,542) | (2,835) | (5,481) | (10,666) | (20,739) |
| SG&A | (141) | (169) | (184) | (205) | (268) | (348) | (489) | (681) |
| Other op.expenses | (100) | (85) | (91) | (130) | (174) | (208) | (281) | (415) |
| Operating profit | 38 | 108 | 109 | 127 | 426 | 1,369 | 3,377 | 7,792 |
| Net-interest inc./(exp.) | (6) | (7) | 8 | 8 | (9) | 3 | 0 | 0 |
| Assoc/forex/extraord./others | (5) | 9 | 17 | 6 | (69) | (16) | 0 | 0 |
| Pre-tax profit | 28 | 111 | 134 | 141 | 348 | 1,356 | 3,377 | 7,792 |
| Tax | 18 | (23) | (31) | (35) | (48) | (339) | (844) | (1,948) |
| Min. int./pref. div./others | 0 | 0 | 0 | 0 | 0 | 0 | 0 | 0 |
| Net profit (reported) | 46 | 87 | 103 | 106 | 301 | 1,017 | 2,533 | 5,844 |
| Net profit (adjusted) | 46 | 87 | 103 | 106 | 301 | 1,017 | 2,533 | 5,844 |
| EPS (reported)(TWD) | 1.215 | 2.223 | 2.033 | 1.800 | 4.943 | 15.067 | 37.527 | 86.575 |
| EPS (adjusted)(TWD) | 1.215 | 2.223 | 2.033 | 1.800 | 4.943 | 15.067 | 37.527 | 86.575 |
| EPS (adjusted fully-diluted)(TWD) | 1.214 | 2.214 | 2.024 | 1.794 | 4.938 | 15.067 | 37.527 | 86.575 |
| DPS (TWD) | 0.000 | 0.190 | 0.780 | 1.250 | 3.000 | 9.040 | 22.516 | 51.945 |
| EBIT | 38 | 108 | 109 | 127 | 426 | 1,369 | 3,377 | 7,792 |
| EBITDA | 112 | 185 | 204 | 246 | 493 | 1,602 | 3,742 | 8,325 |
Cash flow (TWDm)
| Year to 31 Dec | 2021 | 2022 | 2023 | 2024 | 2025 | 2026E | 2027E | 2028E |
|---|---|---|---|---|---|---|---|---|
| Profit before tax | 28 | 111 | 134 | 141 | 348 | 1,356 | 3,377 | 7,792 |
| Depreciation and amortisation | 79 | 67 | 78 | 113 | 136 | 249 | 364 | 534 |
| Tax paid | (3) | (7) | (9) | (3) | (53) | (339) | (844) | (1,948) |
| Change in working capital | (141) | 29 | (12) | (114) | (679) | (1,113) | (2,888) | (5,023) |
| Other operational CF items | 53 | 74 | (12) | (0) | 6 | (3) | 0 | 0 |
| Cash flow from operations | 16 | 274 | 180 | 137 | (240) | 150 | 10 | 1,355 |
| Capex | (393) | (85) | (167) | (511) | (325) | (520) | (900) | (1,200) |
| Net (acquisitions)/disposals | 19 | (17) | 325 | 10 | (105) | (105) | (105) | (105) |
| Other investing CF items | (13) | (17) | (18) | (17) | (12) | 0 | 0 | 0 |
| Cash flow from investing | (387) | (119) | 140 | (518) | (442) | (625) | (1,005) | (1,305) |
| Change in debt | 274 | (95) | (248) | 20 | 363 | 617 | 2,500 | 2,500 |
| Net share issues/(repurchases) | 0 | 0 | 0 | 0 | 0 | 0 | 0 | 0 |
| Dividends paid | 0 | 0 | (23) | (44) | (75) | (203) | (610) | (1,520) |
| Other financing CF items | (12) | 268 | (42) | 320 | 956 | 0 | 0 | 0 |
| Cash flow from financing | 262 | 172 | (313) | 296 | 1,245 | 414 | 1,890 | 980 |
| Forex effect/others | 0 | 0 | 0 | 0 | 0 | 0 | 0 | 0 |
| Change in cash | (109) | 327 | 7 | (85) | 563 | (61) | 895 | 1,030 |
| Free cash flow | (377) | 121 | 16 | (382) | (563) | (370) | (890) | 155 |
Source: FactSet, Daiwa forecasts
Taiwan Microloops (6831 TT): 22 July 2026
Daiwa
Financial summary continued …
Balance sheet (TWDm)
| Year to 31 Dec | 2021 | 2022 | 2023 | 2024 | 2025 | 2026E | 2027E | 2028E |
|---|---|---|---|---|---|---|---|---|
| Cash & short-term investment | 277 | 603 | 609 | 528 | 1,106 | 1,046 | 1,940 | 2,971 |
| Inventory | 226 | 207 | 194 | 207 | 439 | 790 | 1,394 | 2,648 |
| Accounts receivable | 546 | 442 | 657 | 869 | 1,932 | 3,403 | 7,121 | 13,927 |
| Other current assets | 37 | 23 | 25 | 69 | 188 | 188 | 188 | 188 |
| Total current assets | 1,086 | 1,275 | 1,485 | 1,673 | 3,665 | 5,427 | 10,643 | 19,734 |
| Fixed assets | 498 | 534 | 329 | 809 | 1,017 | 1,422 | 2,153 | 3,104 |
| Goodwill & intangibles | 12 | 8 | 10 | 36 | 24 | 24 | 24 | 24 |
| Other non-current assets | 96 | 138 | 93 | 312 | 312 | 312 | 312 | 312 |
| Total assets | 1,692 | 1,956 | 1,917 | 2,830 | 5,018 | 7,184 | 13,132 | 23,174 |
| Short-term debt | 126 | 38 | 0 | 20 | 383 | 500 | 1,500 | 2,500 |
| Accounts payable | 587 | 535 | 697 | 888 | 1,379 | 2,246 | 3,838 | 7,033 |
| Other current liabilities | 29 | 41 | 67 | 91 | 217 | 217 | 217 | 217 |
| Total current liabilities | 743 | 613 | 764 | 999 | 1,980 | 2,963 | 5,555 | 9,751 |
| Long-term debt | 218 | 210 | 0 | 0 | 0 | 500 | 2,000 | 3,500 |
| Other non-current liabilities | 44 | 54 | 18 | 257 | 220 | 220 | 220 | 220 |
| Total liabilities | 1,004 | 877 | 781 | 1,257 | 2,200 | 3,683 | 7,775 | 13,471 |
| Share capital | 374 | 434 | 509 | 600 | 675 | 675 | 675 | 675 |
| Reserves/R.E./others | 313 | 644 | 626 | 973 | 2,143 | 2,826 | 4,682 | 9,029 |
| Shareholders' equity | 688 | 1,079 | 1,135 | 1,573 | 2,818 | 3,501 | 5,357 | 9,704 |
| Minority interests | 0 | 0 | 0 | 0 | 0 | 0 | 0 | 0 |
| Total equity & liabilities | 1,692 | 1,956 | 1,917 | 2,830 | 5,018 | 7,184 | 13,132 | 23,174 |
| EV | 42,930 | 42,508 | 42,254 | 42,355 | 42,140 | 42,817 | 44,422 | 45,892 |
| Net debt/(cash) | 67 | (355) | (609) | (508) | (723) | (46) | 1,560 | 3,029 |
| BVPS (TWD) | 18.370 | 27.413 | 22.313 | 26.725 | 46.337 | 51.872 | 79.364 | 143.757 |
Key ratios (%)
| Year to 31 Dec | 2021 | 2022 | 2023 | 2024 | 2025 | 2026E | 2027E | 2028E |
|---|---|---|---|---|---|---|---|---|
| Sales (YoY) | 70.8 | 5.5 | 2.1 | 22.1 | 84.7 | 100.0 | 100.0 | 100.0 |
| EBITDA (YoY) | 3.7 | 64.5 | 10.6 | 20.5 | 100.7 | 224.8 | 133.5 | 122.5 |
| Operating profit (YoY) | (51.7) | 181.1 | 0.9 | 16.9 | 234.4 | 221.3 | 146.7 | 130.7 |
| Net profit (YoY) | (32.0) | 92.2 | 18.2 | 2.4 | 183.8 | 238.3 | 149.1 | 130.7 |
| Core EPS (fully-diluted) (YoY) | (40.3) | 82.3 | (8.6) | (11.4) | 175.3 | 205.1 | 149.1 | 130.7 |
| Gross-profit margin | 18.3 | 22.6 | 23.4 | 23.1 | 23.4 | 26.0 | 28.0 | 30.0 |
| EBITDA margin | 7.4 | 11.5 | 12.4 | 12.3 | 13.3 | 21.6 | 25.3 | 28.1 |
| Operating-profit margin | 2.5 | 6.7 | 6.6 | 6.4 | 11.5 | 18.5 | 22.8 | 26.3 |
| Net profit margin | 3.0 | 5.4 | 6.3 | 5.3 | 8.1 | 13.7 | 17.1 | 19.7 |
| ROAE | 6.8 | 9.9 | 9.3 | 7.8 | 13.7 | 32.2 | 57.2 | 77.6 |
| ROAA | 3.2 | 4.8 | 5.3 | 4.5 | 7.7 | 16.7 | 24.9 | 32.2 |
| ROCE | 4.4 | 9.2 | 8.9 | 9.3 | 17.8 | 35.6 | 50.6 | 63.4 |
| ROIC | 11.7 | 11.6 | 13.4 | 12.0 | 23.3 | 37.0 | 48.8 | 59.5 |
| Net debt to equity | 9.8 | n.a. | n.a. | n.a. | n.a. | n.a. | 29.1 | 31.2 |
| Effective tax rate | (64.9) | 20.9 | 22.9 | 25.1 | 13.7 | 25.0 | 25.0 | 25.0 |
| Accounts receivable (days) | 102.2 | 112.2 | 122.2 | 138.9 | 138.0 | 131.5 | 129.7 | 129.7 |
| Current ratio (x) | 1.5 | 2.1 | 1.9 | 1.7 | 1.9 | 1.8 | 1.9 | 2.0 |
| Net interest cover (x) | 6.7 | 16.4 | n.a. | n.a. | 48.1 | n.a. | n.a. | n.a. |
| Net dividend payout | 0.0 | 8.5 | 38.4 | 69.4 | 60.7 | 60.0 | 60.0 | 60.0 |
| Free cash flow yield | n.a. | 0.3 | 0.0 | n.a. | n.a. | n.a. | n.a. | 0.4 |
Source: FactSet, Daiwa forecasts
Company profile
Founded in 2002, Taiwan Microloops Corp. (Microloops) is a leading global provider of system-level thermal modules for AI data centres, including ASICs, network interface cards (NICs) and switches, as well as notebooks and graphics cards (VGAs). Headquartered in New Taipei City, Taiwan, the company operates manufacturing facilities in China and Vietnam. Its core product offerings currently focus on aircooling solutions, including 2.5DVC and 3DVC modules, while it is also expanding into liquid cooling, and developing immersion cooling technologies for next-generation servers in collaboration with Intel.
Taiwan Microloops (6831 TT): 22 July 2026
Daiwa
ESG analysis
ESG risks
| Risks | Management | Analyst comments | |
|---|---|---|---|
| Executive/board quality | 1 | The positions of Chairperson and President (CEO equivalent) are held by Mr. Yuan-Shan Chao and Mr. Chun-Hung Lin, respectively. We note that Chairperson Chao has extensive senior management experience in finance, having previously served as CFO of Walsin Lihwa Corporation and Vice President of Finance at Winbond Electronics, while President Lin holds a PhD in Mechanical Engineering and brings significant R&D and project management experience from the Cooler Master Group. This separation of roles -combined with a Board consisting of 7 directors including 3 independent directors who possess diverse professional qualifications across finance, accounting, law, business management, and industrial knowledge -is a positive sign from a corporate governance perspective. | |
| G | Capital management | 1 | Over 2023-2025, Microloop recorded dividend payout ratios of 38%, 69% and 61%. Management aims to further increase the ratio to 70% over the mid-to-long-term to balance shareholder returns while meeting reinvestment needs. This approach reflects a prudent capital management policy and consistent financial discipline. |
| Related party transaction | & | 1 | The company engages in transactions with subsidiaries (such as those in Samoa, Huizhou, and Vietnam) primarily for normal operational purposes, such as the procurement of equipment by Microloops Huizhou. To ensure risk control and firewall mechanisms, all interactions are governed by established internal controls, including the "Regulations Governing the Financial and Business Matters Between Related Parties" and the "Regulations Governing the Supervision and Management of Subsidiaries", ensuring that no irregular or non-transparent transactions were identified. |
| E | Supply chain management | 1 | Microloops has a structured procurement process utilising its "Procurement Management Regulations" to select suppliers, giving preference to those with environment-related licenses who emphasise environmental protection and social responsibility. The company maintains stable, mutual-trust relationships with major raw material suppliers (including Sankou Precision and Thermal Science Technology) and promotes ethical management policies by requiring cooperating partners to sign an "Integrity Commitment Letter". This reflects strong supply chain transparency, environmental compliance regarding RoHS and lead-free regulations, and robust quality control measures. |
| S | Data security | 1 | The company has established a dedicated Information Security Department led by an Information Security Officer to oversee security management, officially obtaining the ISO 27001 Information Security Management System certificate in 2025/4. Guided by its "Computer Processing Operations Cycle" and "Information Security Management Regulations", the company conducts regular asset inventory and risk assessments while enforcing anti-virus mandates, server password updates, and strict employee access controls. Backup systems, redundancies, and regular disaster recovery drills are actively in place, allowing the company to ensure system availability and minimise operational damage during major incidents or equipment failures. |
Note: Management score represents a company's ability to manage/benefit from certain ESG topics. The scores range from 1 to 3, with 1 being the strongest.
Update Date: 18 Jun 2026
Source: Daiwa, Company
Taiwan Microloops (6831 TT): 22 July 2026
Daiwa