PDF 原檔:報告_Daiwa_聯發科2454_20260731_original.pdf
圖片清單(已驗證 2026-08-03)
| 檔名 | size | 分類 | 親眼所見內容 |
|---|---|---|---|
260731_daiwa_mtk UG_003.png |
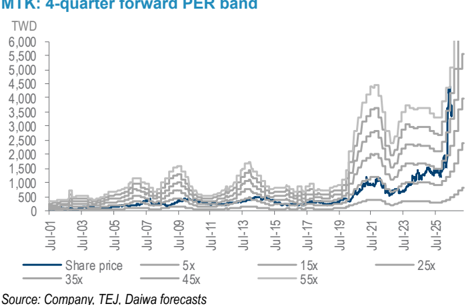
57KB | 真資料圖 | MTK: 4-quarter forward PER band 折線圖,橫軸 Jul-01 至 Jul-26,多條 PER 倍數帶(5x/15x/25x/35x/45x/55x,灰線)與藍色 Share price 實際走勢 |
260731_daiwa_mtk UG_002.png |
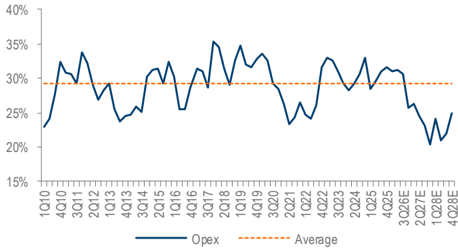
46KB | 真資料圖 | MTK opex ratio trend 折線圖,橫軸 1Q10 至 4Q28E,藍線為 Opex 比率、橘虛線為 Average(約 29%),2026E-28E 段呈下滑趨勢 |
260731_daiwa_mtk UG_001.png |
25KB | 真資料圖 | 股價相對表現折線圖,橫軸 Jul-25 至 Jul-26,藍線 Mediatek(LHS)股價、橘虛線 Relative to TWSE Index(RHS) |
原始內容
e
Taiwan
MediaTek (2454 TT)
Target price:
TWD4,088.00 (from TWD2,454.00)
Share price (31 Jul): TWD3,555.00 | Up/downside: +15.0%
Upgrading: value unlocked after expectation reset
- 2Q26 results upbeat but 3Q26 guidance downbeat
- Mobile irrelevant now given likely strong AI ramp ahead
- Upgrading rating to Buy (1) with higher 12M TP of TWD4,088
What's new: MediaTek (MTK) released upbeat 2Q26 results but downbeat 3Q26 guidance. Though the cash-cow mobile business looks to be weakening on commodity cost inflation, its new AI business appears to be running ahead of expectation. We raise our AI accelerator assumption and expect MTK's AI ASIC revenue contribution to overtake Mobile in mid-2027, a year earlier than our previous forecast. Aided by the recent reset of equity market's hefty expectation unlocking value for reinvestment, in our view, we upgrade our rating 2 notches to Buy (1) with a refreshed TP of TWD4,088.
What's the impact: Results upbeat but guidance downbeat. MTK reported 2Q26 net profit of TWD24bn, 5%/8% above our/consensus estimates, thanks to lower income tax and higher top line, which beat guidance (TWD140-149bn) and market expectations on better share gain in its Smart-edge business, partially offset by lower margins (table on p.2 for more details). Guided 3Q26 top line missed our previous forecast due to weaker-than-expected Mobile business, where management failed to realise its previous expectation calling 2Q26 as the trough , though it maintains its forecast for this year's global smartphone shipment to drop c.15% YoY. That said, it sees its AI ASIC business as progressing even stronger for 'substantial' growth into 2027.
Weaker Mobile more than offset by stronger AI. Following its upward revision in the previous quarter, MTK at today's call further lifted its AI accelerator (ex-HBM) serviceable addressable market (SAM) to USD80bn for 2027 (previous: USD70-80bn), targeting a market share of 15-20% (previous: 10-15%), which translates into USD12-16bn potential revenue for the company. This suggests its first AI ASIC for a hyperscale customer is on track for mass production (MP) in 4Q26, while the second chip for the same customer is on track for MP by early 2028, with higher dollar value on stronger performance/watt and lower total cost of ownership (TCO). Net of the AI strength and mobile weakness, we raise our 2027-28E EPS by 2330%, where we now forecast MTK's AI ASIC revenue to reach USD2.1bn, USD15bn, and USD22bn for 2026, 2027 and 2028, respectively.
What we recommend: Given our forecast revisions, we lift our 12M TP for MTK to TWD4,088 (previous: TWD2,454), now based on our 4-quarter forward PER target of 36x (previous: 27x), justified by our 2025-28E EPS CAGR of 36% on 1x PEG. We upgrade our rating 2 notches to Buy (1) with key downside risk of any AI accelerator ramps below our expectation.
How we differ: While our 2026-27E EPS are 7-10% above the consensus forecasts, we see the street as too aggressive on MTK's 2028 AI business.
31 July 2026
Daiwa
5
3
2
1
Buy
Rick Hsu
Rick Hsu (886) 2 8758 6261
rick.hsu@daiwacm-cathay.com.tw
Sharon Kao (886) 2 8758 6255 sharon.kao@daiwacm-cathay.com.tw
Forecast revisions (%)
| Year to 31 Dec | 26E | 27E | 28E |
|---|---|---|---|
| Revenue change | 1.6 | 26.9 | 27.4 |
| Net profit change | (2.2) | 29.6 | 22.6 |
| Core EPS (FD) change | (2.2) | 29.6 | 22.6 |
Source: Daiwa forecasts
Share price performance
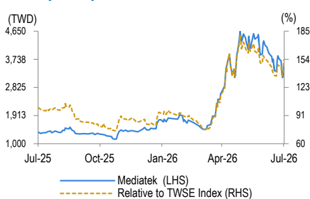
| 12-month range | 1,145.00-4,640.00 |
|---|---|
| Market cap (USDbn) | 175.59 |
| 3m avg daily turnover (USDm) | 1,465.34 |
| Shares outstanding (m) | 1,604 |
| Major shareholder | Vanguard Group Inc (3.7%) |
Financial summary (TWD)
| Year to 31 Dec | 26E | 27E | 28E |
|---|---|---|---|
| Revenue (m) | 661,687 | 1,125,506 | 1,363,441 |
| Operating profit (m) | 112,100 | 252,796 | 293,039 |
| Net profit (m) | 112,878 | 229,616 | 267,463 |
| Core EPS (fully-diluted) | 70.377 | 143.160 | 166.757 |
| EPS change (%) | 7.2 | 103.4 | 16.5 |
| Daiwa vs Cons. EPS (%) | 7.4 | 9.9 | (37.9) |
| PER (x) | 50.5 | 24.8 | 21.3 |
| Dividend yield (%) | 1.5 | 1.7 | 2.8 |
| DPS | 54.0 | 60.0 | 100.0 |
| PBR (x) | 13.1 | 10.0 | 8.4 |
| EV/EBITDA (x) | 39.2 | 18.0 | 15.0 |
| ROE (%) | 27.0 | 45.8 | 42.9 |
Source: FactSet, Daiwa forecasts
MTK: quarterly P&L estimates and forecasts
Source: Company, Daiwa estimates and forecasts
Daiwa
| TWDm | 1Q26 | 2Q26 | 3Q26E | 4Q26E | 1Q27E | 2Q27E | 3Q27E | 4Q27E | 2025 | 2026E | 2027E | 2028E |
|---|---|---|---|---|---|---|---|---|---|---|---|---|
| Total revenue | 149,151 | 152,183 | 158,928 | 201,425 | 203,429 | 236,753 | 281,135 | 404,189 | 595,966 | 661,687 | 1,125,506 | 1,363,441 |
| Total revenue (USDm) | 4,721 | 4,811 | 4,967 | 6,295 | 6,357 | 7,399 | 8,785 | 12,631 | 19,102 | 20,810 | 35,172 | 42,608 |
| COGS | -80,095 | -81,875 | -85,417 | -108,239 | -109,863 | -128,895 | -153,734 | -221,237 | -312,886 | -355,626 | -613,729 | -758,920 |
| Gross profit | 69,055 | 70,308 | 73,511 | 93,186 | 93,566 | 107,858 | 127,401 | 182,952 | 283,080 | 306,060 | 511,777 | 604,521 |
| Opex | -46,165 | -47,440 | -48,791 | -51,565 | -53,298 | -58,005 | -65,223 | -82,455 | -179,610 | -193,960 | -258,981 | -311,482 |
| Operating profit | 22,891 | 22,868 | 24,720 | 41,621 | 40,268 | 49,853 | 62,177 | 100,498 | 103,470 | 112,100 | 252,796 | 293,039 |
| EBITDA | 28,892 | 29,009 | 31,126 | 49,739 | 48,508 | 59,521 | 73,707 | 117,091 | 126,444 | 138,766 | 298,826 | 349,958 |
| Non-op gain/loss | 4,129 | 5,094 | 4,900 | 4,959 | 4,680 | 4,740 | 4,840 | 5,000 | 21,418 | 19,082 | 19,260 | 23,860 |
| Pretax profit | 27,019 | 27,962 | 29,620 | 46,580 | 44,948 | 54,593 | 67,017 | 105,498 | 124,888 | 131,182 | 272,056 | 316,899 |
| Income taxes & MI | -2,865 | -3,627 | -4,591 | -7,220 | -7,012 | -8,517 | -10,455 | -16,458 | -19,569 | -18,303 | -42,441 | -49,436 |
| Net profit | 24,154 | 24,335 | 25,029 | 39,360 | 37,936 | 46,077 | 56,563 | 89,040 | 105,319 | 112,878 | 229,616 | 267,463 |
| FD O/S (m) | 1,604 | 1,604 | 1,604 | 1,604 | 1,604 | 1,604 | 1,604 | 1,604 | 1,604 | 1,604 | 1,604 | 1,604 |
| FD EPS (TWD) | 15.06 | 15.17 | 15.60 | 24.54 | 23.65 | 28.73 | 35.27 | 55.51 | 65.66 | 70.38 | 143.16 | 166.76 |
| Margin | ||||||||||||
| Gross | 46% | 46% | 46% | 46% | 46% | 46% | 45% | 45% | 47% | 46% | 45% | 44% |
| Operating | 15% | 15% | 16% | 21% | 20% | 21% | 22% | 25% | 17% | 17% | 22% | 21% |
| EBITDA | 19% | 19% | 20% | 25% | 24% | 25% | 26% | 29% | 21% | 21% | 27% | 26% |
| Net | 16% | 16% | 16% | 20% | 19% | 19% | 20% | 22% | 18% | 17% | 20% | 20% |
| Revenue mix | ||||||||||||
| Mobile phone | 50% | 42% | 40% | 32% | 31% | 29% | 28% | 18% | 55% | 40% | 25% | 22% |
| Smart edge | 45% | 53% | 54% | 63% | 64% | 66% | 68% | 79% | 40% | 54% | 71% | 74% |
| Power IC | 5% | 6% | 6% | 5% | 5% | 5% | 4% | 3% | 5% | 6% | 4% | 4% |
| Growth (QoQ) | ||||||||||||
| Total revenue | -1% | 2% | 4% | 27% | 1% | 16% | 19% | 44% | ||||
| Gross profit | 0% | 2% | 5% | 27% | 0% | 15% | 18% | 44% | ||||
| Operating profit | 5% | 0% | 8% | 68% | -3% | 24% | 25% | 62% | ||||
| EBITDA | 4% | 0% | 7% | 60% | -2% | 23% | 24% | 59% | ||||
| Net profit | 5% | 1% | 3% | 57% | -4% | 21% | 23% | 57% | ||||
| FD EPS | 5% | 1% | 3% | 57% | -4% | 21% | 23% | 57% | ||||
| Growth (YoY) | ||||||||||||
| Total revenue | -3% | 1% | 12% | 34% | 36% | 56% | 77% | 101% | 12% | 11% | 70% | 21% |
| Gross profit | -6% | -5% | 11% | 35% | 35% | 53% | 73% | 96% | 7% | 8% | 67% | 18% |
| Operating profit | -24% | -22% | 11% | 90% | 76% | 118% | 152% | 141% | 1% | 8% | 126% | 16% |
| EBITDA | -19% | -17% | 11% | 80% | 68% | 105% | 137% | 135% | 3% | 10% | 115% | 17% |
| Net profit | -18% | -13% | -1% | 72% | 57% | 89% | 126% | 126% | -1% | 7% | 103% | 16% |
| FD EPS | -18% | -13% | -1% | 72% | 57% | 89% | 126% | 126% | -1% | 7% | 103% | 16% |
MTK: 2Q26 results review and 3Q26 guidance check
| 2Q26 | 2Q26 | 2Q26 | Growth | Growth | 3Q26E | ||
|---|---|---|---|---|---|---|---|
| TWDm | Actual | Daiwa | Variance | QoQ | YoY | Guidance | Daiwa (previous) |
| Revenue | 152,183 | 145,255 | 5% | 2% | 1% | Sales = TWD152.2-159.8bn at FX of TWD32/USD | TWD168bn (+10% QoQ) |
| Gross profit | 70,308 | 68,179 | 3% | 2% | -5% | GM = 46% +/- 1.5pp | 46.3% |
| Operating profit | 22,868 | 22,569 | 1% | 0% | -22% | Opex = 31% +/- 2pp | 27.3% |
| Pretax profit | 27,962 | 27,469 | 2% | 3% | -16% | ||
| Income tax & MI | 3,627 | 4,258 | -15% | 37% | -30% | ||
| Net profit | 24,335 | 23,212 | 5% | 1% | -13% | ||
| Adjusted EPS (TWD) | 15.17 | 14.47 | 5% | 1% | -13% | ||
| Margin | |||||||
| Gross | 46.2% | 46.9% | -0.7% | ||||
| Operating | 15.0% | 15.5% | -0.5% | ||||
| Tax rate | 13.0% | 15.5% | -2.5% | ||||
| Net | 16.0% | 16.0% | 0.0% | ||||
| Revenue mix* | |||||||
| Mobile phone | 41% | 48% | below | ||||
| Smart edge | 53% | 46% | above | ||||
| Power IC | 6% | 6% | in line |
Source: Company, Daiwa estimates and forecasts
Note: * Mobile phone includes smartphone and tablet; Smart edge includes IoT, computing & ASIC, digital TV, monitor & optical storage; Power IC includes PMIC and power discrete that support mobile phone and smart edge products
MTK: opex ratio trend
Source: Company, Daiwa estimates and forecasts
MediaTek (2454 TT): 31 July 2026
Source: Company, TEJ, Daiwa forecasts
Financial summary
Key assumptions
| Year to 31 Dec | 2021 | 2022 | 2023 | 2024 | 2025 | 2026E | 2027E | 2028E |
|---|---|---|---|---|---|---|---|---|
| Smartphone chipset ASP (US$) | 13.91 | 16.39 | 15.99 | 16.66 | 18.29 | 18.11 | 17.58 | 16.99 |
| Smartphone chipset shipment ('000) | 647 | 588 | 439 | 545 | 555 | 441 | 486 | 541 |
| Total handset market share (%) | 50.8 | 50.2 | 41.4 | 49.9 | 50.1 | 39.4 | 42.4 | 45.2 |
Profit and loss (TWDm)
| Year to 31 Dec | 2021 | 2022 | 2023 | 2024 | 2025 | 2026E | 2027E | 2028E |
|---|---|---|---|---|---|---|---|---|
| Optical Storage Revenue | 12,670 | 13,662 | 14,172 | 15,201 | 15,132 | 15,519 | 15,715 | 15,784 |
| Digital Home Revenue | 38,270 | 39,307 | 40,345 | 44,076 | 47,508 | 51,119 | 52,473 | 53,294 |
| Other Revenue | 442,475 | 495,827 | 378,929 | 471,309 | 533,326 | 595,048 | 1,057,318 | 1,294,364 |
| Total Revenue | 493,415 | 548,796 | 433,446 | 530,586 | 595,966 | 661,687 | 1,125,506 | 1,363,441 |
| Other income | 0 | 0 | 0 | 0 | 0 | 0 | 0 | 0 |
| COGS | (261,810) | (277,892) | (226,079) | (267,200) | (312,886) | (355,626) | (613,729) | (758,920) |
| SG&A | (27,484) | (27,242) | (24,182) | (28,980) | (31,289) | (33,428) | (45,765) | (57,614) |
| Other op.expenses | (96,081) | (116,874) | (111,385) | (131,993) | (148,321) | (160,532) | (213,216) | (253,868) |
| Operating profit | 108,040 | 126,788 | 71,800 | 102,412 | 103,470 | 112,100 | 252,796 | 293,039 |
| Net-interest inc./(exp.) | 1,458 | 2,847 | 6,908 | 10,696 | 10,167 | 11,120 | 13,260 | 17,360 |
| Assoc/forex/extraord./others | 17,354 | 5,925 | 8,074 | 6,410 | 11,251 | 7,962 | 6,000 | 6,500 |
| Pre-tax profit | 126,852 | 135,561 | 86,783 | 119,519 | 124,888 | 131,182 | 272,056 | 316,899 |
| Tax | (14,980) | (16,936) | (9,591) | (12,378) | (18,770) | (17,430) | (40,808) | (47,535) |
| Min. int./pref. div./others | (451) | (484) | (212) | (754) | (799) | (873) | (1,632) | (1,901) |
| Net profit (reported) | 111,421 | 118,141 | 76,979 | 106,387 | 105,319 | 112,878 | 229,616 | 267,463 |
| Net profit (adjusted) | 111,421 | 118,141 | 76,979 | 106,387 | 105,319 | 112,878 | 229,616 | 267,463 |
| EPS (reported)(TWD) | 70.561 | 74.593 | 48.509 | 66.924 | 66.157 | 70.377 | 143.160 | 166.757 |
| EPS (adjusted)(TWD) | 70.561 | 74.593 | 48.509 | 66.924 | 66.157 | 70.377 | 143.160 | 166.757 |
| EPS (adjusted fully-diluted)(TWD) | 69.687 | 73.864 | 48.122 | 66.422 | 65.664 | 70.377 | 143.160 | 166.757 |
| DPS (TWD) | 37.101 | 73.330 | 76.238 | 55.075 | 54.066 | 54.000 | 60.000 | 100.000 |
| EBIT | 108,040 | 126,788 | 71,800 | 102,412 | 103,470 | 112,100 | 252,796 | 293,039 |
| EBITDA | 118,661 | 141,768 | 90,000 | 123,348 | 126,444 | 138,766 | 298,826 | 349,958 |
Cash flow (TWDm)
| Year to 31 Dec | 2021 | 2022 | 2023 | 2024 | 2025 | 2026E | 2027E | 2028E |
|---|---|---|---|---|---|---|---|---|
| Profit before tax | 126,852 | 135,561 | 86,783 | 119,519 | 124,888 | 131,182 | 272,056 | 316,899 |
| Depreciation and amortisation | 10,621 | 14,980 | 18,200 | 20,936 | 22,974 | 26,666 | 46,030 | 56,919 |
| Tax paid | (14,980) | (16,936) | (9,591) | (12,378) | (18,770) | (17,430) | (40,808) | (47,535) |
| Change in working capital | (53,649) | 164 | 30,356 | (1,001) | (19,508) | (2,500) | (100,000) | 20,000 |
| Other operational CF items | (21,750) | 10,814 | 40,344 | 28,979 | 53,209 | (873) | (1,632) | (1,901) |
| Cash flow from operations | 47,095 | 144,583 | 166,091 | 156,055 | 162,793 | 137,044 | 175,645 | 344,382 |
| Capex | (16,985) | (13,622) | (9,325) | (13,787) | (15,059) | (16,542) | (28,138) | (34,086) |
| Net (acquisitions)/disposals | 2,170 | (19,666) | (12,042) | (14,671) | (10,649) | 0 | 0 | 0 |
| Other investing CF items | (14,109) | (4,247) | (7,379) | (7,471) | (12,046) | 0 | 0 | 0 |
| Cash flow from investing | (28,924) | (37,535) | (28,746) | (35,928) | (37,754) | (16,542) | (28,138) | (34,086) |
| Change in debt | 31,335 | (48,575) | (2,328) | (1,260) | 60 | (3,368) | (1,684) | (842) |
| Net share issues/(repurchases) | 0 | 0 | 0 | 0 | 0 | 0 | 0 | 0 |
| Dividends paid | (58,585) | (116,141) | (120,981) | (87,551) | (86,070) | (86,611) | (96,235) | (160,391) |
| Other financing CF items | (701) | 8,435 | 4,740 | (1,309) | (1,665) | 0 | 0 | 0 |
| Cash flow from financing | (27,951) | (156,280) | (118,569) | (90,119) | (87,675) | (89,979) | (97,918) | (161,233) |
| Forex effect/others | (3,094) | 13,030 | (883) | 8,292 | (5,770) | 0 | 0 | 0 |
| Change in cash | (12,875) | (36,202) | 17,894 | 38,300 | 31,594 | 30,523 | 49,589 | 149,063 |
| Free cash flow | 30,109 | 130,961 | 156,767 | 142,268 | 147,734 | 120,502 | 147,508 | 310,296 |
Source: FactSet, Daiwa forecasts
MediaTek (2454 TT): 31 July 2026
Daiwa
Financial summary continued …
Balance sheet (TWDm)
| Year to 31 Dec | 2021 | 2022 | 2023 | 2024 | 2025 | 2026E | 2027E | 2028E |
|---|---|---|---|---|---|---|---|---|
| Cash & short-term investment | 204,764 | 164,810 | 180,673 | 219,624 | 247,709 | 278,232 | 327,821 | 476,884 |
| Inventory | 73,271 | 70,703 | 43,220 | 58,414 | 67,235 | 77,235 | 157,235 | 137,235 |
| Accounts receivable | 58,660 | 40,842 | 55,834 | 44,713 | 62,121 | 61,621 | 141,621 | 121,621 |
| Other current assets | 10,171 | 21,298 | 11,161 | 28,275 | 20,391 | 15,000 | 15,000 | 15,000 |
| Total current assets | 346,865 | 297,654 | 290,889 | 351,025 | 397,456 | 432,088 | 641,677 | 750,740 |
| Fixed assets | 49,111 | 53,862 | 53,291 | 56,917 | 60,427 | 50,672 | 41,986 | 30,537 |
| Goodwill & intangibles | 73,526 | 73,455 | 81,245 | 82,257 | 80,262 | 77,000 | 75,000 | 72,000 |
| Other non-current assets | 191,375 | 183,430 | 209,614 | 207,668 | 205,640 | 201,912 | 201,912 | 201,912 |
| Total assets | 660,877 | 608,399 | 635,038 | 697,868 | 743,785 | 761,671 | 960,574 | 1,055,188 |
| Short-term debt | 51,267 | 3,700 | 2,200 | 940 | 940 | 940 | 940 | 940 |
| Accounts payable | 96,748 | 74,028 | 130,541 | 151,181 | 156,525 | 165,710 | 225,710 | 205,710 |
| Other current liabilities | 63,091 | 63,843 | 99,258 | 114,782 | 145,885 | 123,368 | 126,684 | 130,842 |
| Total current liabilities | 211,106 | 141,570 | 231,999 | 266,902 | 303,350 | 290,018 | 353,334 | 337,492 |
| Long-term debt | 1,684 | 863 | 4,605 | 2,681 | 6,735 | 3,368 | 1,684 | 842 |
| Other non-current liabilities | 14,439 | 22,907 | 24,229 | 23,228 | 24,504 | 24,500 | 26,000 | 26,500 |
| Total liabilities | 227,229 | 165,341 | 260,833 | 292,812 | 334,590 | 317,885 | 381,018 | 364,834 |
| Share capital | 15,988 | 15,994 | 15,996 | 16,017 | 16,039 | 16,039 | 16,039 | 16,039 |
| Reserves/R.E./others | 416,027 | 424,115 | 352,209 | 380,610 | 384,562 | 418,279 | 552,418 | 661,314 |
| Shareholders' equity | 432,015 | 440,109 | 368,206 | 396,627 | 400,601 | 434,319 | 568,457 | 677,353 |
| Minority interests | 1,633 | 2,949 | 6,000 | 8,428 | 8,594 | 9,467 | 11,100 | 13,001 |
| Total equity & liabilities | 660,877 | 608,399 | 635,038 | 697,868 | 743,785 | 761,671 | 960,574 | 1,055,188 |
| EV | 5,551,720 | 5,544,603 | 5,534,031 | 5,494,326 | 5,470,460 | 5,437,443 | 5,387,802 | 5,239,799 |
| Net debt/(cash) | (151,813) | (160,246) | (173,868) | (216,002) | (240,034) | (273,925) | (325,198) | (475,102) |
| BVPS (TWD) | 273.588 | 277.882 | 232.031 | 249.503 | 251.642 | 270.787 | 354.420 | 422.314 |
Key ratios (%)
| Year to 31 Dec | 2021 | 2022 | 2023 | 2024 | 2025 | 2026E | 2027E | 2028E |
|---|---|---|---|---|---|---|---|---|
| Sales (YoY) | 53.2 | 11.2 | (21.0) | 22.4 | 12.3 | 11.0 | 70.1 | 21.1 |
| EBITDA (YoY) | 123.4 | 19.5 | (36.5) | 37.1 | 2.5 | 9.7 | 115.3 | 17.1 |
| Operating profit (YoY) | 150.0 | 17.4 | (43.4) | 42.6 | 1.0 | 8.3 | 125.5 | 15.9 |
| Net profit (YoY) | 172.3 | 6.0 | (34.8) | 38.2 | (1.0) | 7.2 | 103.4 | 16.5 |
| Core EPS (fully-diluted) (YoY) | 170.8 | 6.0 | (34.8) | 38.0 | (1.1) | 7.2 | 103.4 | 16.5 |
| Gross-profit margin | 46.9 | 49.4 | 47.8 | 49.6 | 47.5 | 46.3 | 45.5 | 44.3 |
| EBITDA margin | 24.0 | 25.8 | 20.8 | 23.2 | 21.2 | 21.0 | 26.6 | 25.7 |
| Operating-profit margin | 21.9 | 23.1 | 16.6 | 19.3 | 17.4 | 16.9 | 22.5 | 21.5 |
| Net profit margin | 22.6 | 21.5 | 17.8 | 20.1 | 17.7 | 17.1 | 20.4 | 19.6 |
| ROAE | 27.7 | 27.1 | 19.0 | 27.8 | 26.4 | 27.0 | 45.8 | 42.9 |
| ROAA | 18.7 | 18.6 | 12.4 | 16.0 | 14.6 | 15.0 | 26.7 | 26.5 |
| ROCE | 24.4 | 27.1 | 17.3 | 25.9 | 25.1 | 25.9 | 49.1 | 46.0 |
| ROIC | 40.4 | 39.3 | 26.4 | 47.2 | 49.1 | 57.3 | n.a | n.a |
| Net debt to equity | n.a. | n.a. | n.a. | n.a. | n.a. | n.a. | n.a. | n.a. |
| Effective tax rate | 11.8 | 12.5 | 11.1 | 10.4 | 15.0 | 13.3 | 15.0 | 15.0 |
| Accounts receivable (days) | 34.0 | 33.1 | 40.7 | 34.6 | 32.7 | 34.1 | 33.0 | 35.2 |
| Current ratio (x) | 1.6 | 2.1 | 1.3 | 1.3 | 1.3 | 1.5 | 1.8 | 2.2 |
| Net interest cover (x) | n.a. | n.a. | n.a. | n.a. | n.a. | n.a. | n.a. | n.a. |
| Net dividend payout | 142.8 | 103.8 | 102.1 | 125.6 | 80.8 | 82.2 | 85.3 | 69.9 |
| Free cash flow yield | 0.5 | 2.3 | 2.7 | 2.5 | 2.6 | 2.1 | 2.6 | 5.4 |
Source: FactSet, Daiwa forecasts
Company profile
Ranked No.5 in the world by 2023 fabless semiconductor revenue, MediaTek (MTK) offers diverse products across optical storage, digital home, smartphone, PC, ASIC, automotive and other IoT applications. MTK has successfully captured the industry demand cycles from optical disk drives to feature phones to smartphones, and now positions itself well as a platform provider to capitalise on the next demand cycle of the BigData/AI to help facilitate digital transformation in human lives.
MediaTek (2454 TT): 31 July 2026
Daiwa
ESG analysis
ESG risks
| Risks | Management | Analyst comments | |
|---|---|---|---|
| Executive/board quality | 2 | MTK's Board of Directors (BoD) has 8 members with diverse backgrounds in foundry, IC design and electronics. Among its BoD, 4 members are independent directors, representing 50% of total directors. Its Chairman and CEO are not the same person, but its CEO is also one of the directors. MTK conducts internal annual performance evaluation of the BoD, individual directors and functional committees. The board currently includes only one female director out of eight members, which represents 12.5% of the total. The company recognizes this gender imbalance and is actively working toward a more inclusive and balanced board composition | |
| G | Capital management | 2 | MTK's dividend payout ratios in the past 5 years were above 60% with increasing cash dividend in the past 3 years in dollar amount. In addition, MTK is committed to paying a special dividend of TWD16/share over 2021-24 on top of its regular annual dividend. MTK is one of the leading fabless chipmakers in the world with continued efforts in new product development for diversified applications; therefore, it will continue to invest in its research & development. We see its dividend payout as appropriate. |
| Related party & transaction | 1 | MTK's revenue from related parties was less than 1% of its total revenue in 2024 and transaction terms were not abnormal compared to other customers. It also had related-party transactions with King Yuan Electronics Co., Ltd. and King Long Tech (Suzhou) Ltd for IC testing, experimental services, and manufacturing technology services in 2021. The purchase amount from related parties was less than 7% of its total cost of goods sold/purchases in 2024. Thus, we do not see meaningful impact on its business operation. | |
| S | Supply chain management | 2 | MTK has established its "Supplier Code of Conduct", which covers areas such as labour and human rights, health and safety, environmental protection, code of ethics, and management. It requires all suppliers to sign a guarantee to comply with this code of conduct. MTK implements an annual review to continuously track the actual compliance of suppliers. We believe these measures can help MTK reduce supply chain risk. |
| E | Water & wastewater management | 1 | As a fabless without manufacturing plants, MTK does not produce much wastewater compared to manufacturing companies, and thus has relatively limited impact on the environment. MTK has initiated water conservation methods, including efficient enhancement of using water- saving apparatuses, installing rainwater recycling tanks and using recycled water in cooling towers. |
| E | Waste & hazardous materials management | 1 | MTK prioritises waste reduction, classification for reuse, adherence to recycling, and reutilisation to manage waste efficiently and maximise the benefits of recycling. Also, it chooses only qualified partners for waste disposal and recycling, and also audits the waste processes regularly to ensure legal disposal of its waste and to fulfil its responsibility in waste management supervision. |
| E | GHG emissions | 1 | The main source for MTK's GHG emissions is externally purchased electricity, which accounts for over 90% of its total emissions. To enhance energy efficiency and reduce emissions, the company implemented several measures, including ongoing improvements to data center efficiency, full adoption of LED lighting in offices, and optimized operation of chiller units. MediaTek continued advancing its renewable energy strategy and alignment with global climate initiatives such as SBT and RE100. In early 2025, the Company passed the SBTi review and set targets based on a 2020 baseline, including a 40% reduction in Scope 1 and 2 emissions by 2030, net zero by 2050, and achieving 100% renewable energy use across global offices (excluding data centers) by 2030. |
Note: Management score represents a company's ability to manage/benefit from certain ESG topics. The scores range from 1 to 3, with 1 being the strongest.
Update Date: 4 Feb 2026 Source: Daiwa, Company
MediaTek (2454 TT): 31 July 2026
Daiwa