PDF 原檔:報告_Daiwa_富世達6805_20260804_original.pdf
圖片清單(已驗證 2026-08-06)
| 檔名 | size | 分類 | 親眼所見內容 |
|---|---|---|---|
報告_Daiwa_富世達6805_20260804_001.png |
32KB | 真資料圖 | 富世達股價(藍線,TWD,LHS)+ 相對 TWSE 指數(黃色虛線,%,RHS)走勢圖,Aug-25 至 Aug-26 |
報告_Daiwa_富世達6805_20260804_002.png |
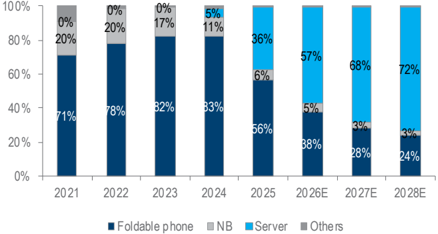
35KB | 真資料圖 | 富世達營收結構堆疊長條圖,2021-2028E,分 Foldable phone/NB/Server/Others 四類,顯示 Server 占比自 2021 年 0% 快速攀升至 2028E 72%,Foldable phone 占比同步由 71% 降至 24% |
報告_Daiwa_富世達6805_20260804_003.png |
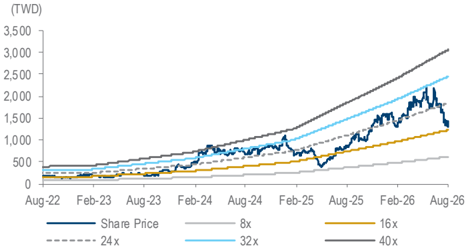
40KB | 真資料圖 | 富世達 1-year forward PER 河流圖,Aug-22 至 Aug-26,股價線(深藍)疊加 8x/16x/24x/32x/40x 本益比帶,近期股價貼近 24x 上緣 |
原始內容
Taiwan
Fositek Corp (6805 TT)
Target price:
TWD2,615.00 (from TWD2,600.00)
Share price (4 Aug): TWD1,590.00 | Up/downside: +64.5%
Investor meeting: positive tone over 2026-27 outlook
- 2Q26 results missed, but historical-high gross margins
- Stronger revenue outlook in 2H26 vs. 1H26, driven by server segment
- Reaffirming our Buy (1) rating; raising 12M TP to TWD2,615
What's new: We attended Fositek's investor meeting following its 2Q26 results announcement on 4 August. We believe the company will benefit from the AI server trend with rising liquid cooling penetration rate in the following years, with rising server revenue over 2026-28E. Given the company's share-gain potential, we reaffirm our Buy (1) rating. See our memo , 7 July 2026.
What's the impact: 2Q26 results missed, but historical-high margins
set. Fositek's 2Q26 revenue of TWD3,740m (-10.6% QoQ, +42.7% YoY) missed our and Bloomberg consensus estimates by 12.1% and 12.8%, respectively, due to the product transition in the foldable phone and server segments. Its 2Q26 gross margin came in at 34.0% (vs. 32.3% in 1Q26 and 24.1% in 2Q25), a record-high level above our (33.0%) and consensus (32.9%) estimates, mainly on manufacturing process improvements and better-than-expected product mix (server revenue accounted for 55.7% in 1H26, up from 36.3% in 2025). Its operating margin of 27.9% (vs. 26.8% in 1Q26 and 19.0% in 2Q25), also a record-high level, beat our (27.2%) and consensus (26.9%) estimates, on better opex control. Thus, its operating profit of TWD1,043m (-6.9% QoQ, +110.0% YoY) missed our and consensus estimates by 9.9% and 9.5%, respectively. Overall, its net profit of TWD849m (-7.4% QoQ, +157.0% YoY) missed our and consensus estimates by 16.0% and 12.4%, respectively. Its 2Q26 EPS finished at TWD12.39. Its 2Q26 product mix was: server (54.9%, +259.9% YoY), foldable phone (38.3%, -20.5% YoY), NB (6.0%, -0.8% YoY) and others (0.7%, +49.1% YoY).
Brighter 2H26 vs. 1H26. We expect a strong 2H26 revenue vs. 1H26 and gross margin expansion on the ramping up of GPU and ASIC projects in 2H26. Due to the rise in liquid cooling penetration rate, product application and QD shipments per rack, we expect its revenue to grow 40.9% YoY in 2026E and 41.7% YoY in 2027E. We lower our 2026-28E EPS by 5-11% due to our slightly conservative revenue and higher tax rate estimates.
What we recommend: We reaffirm our Buy (1) call and raise our 12M TP to TWD2,615 (from TWD2,600), now based on a target PER of 32x (from 33x vs. its past-3-year range of 9-43x [average of 24x]) on decelerating earnings momentum, translating to a 0.8x PEG over 2026-28E on our 1year forward EPS. Key downside risks: lower-than-expected market share for key clients, slower-than-expected penetration rate of foldable phones and geopolitical risks.
How we differ: Our 2026-27E EPS are 5-8% below the Bloomberg consensus, likely as we are more conservative on revenue.
Daiwa
5
3
→
2
1
Buy
Helen Chien
Helen Chien
(886) 2 8758 6254 helen.chien@daiwacm-cathay.com.tw
Neil Teng, CFA (886) 2 8758 6256 neil.teng@daiwacm-cathay.com.tw
Forecast revisions (%)
| Year to 31 Dec | 26E | 27E | 28E |
|---|---|---|---|
| Revenue change | (6.2) | (5.7) | (5.5) |
| Net profit change | (11.3) | (6.9) | (4.6) |
| Core EPS (FD) change | (11.2) | (6.9) | (4.6) |
Source: Daiwa forecasts
Share price performance
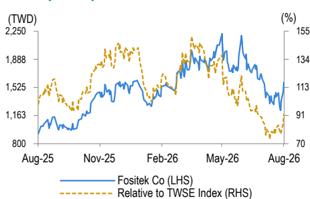
| 12-month range | 943.00-2,215.00 |
|---|---|
| Market cap (USDbn) | 3.36 |
| 3m avg daily turnover (USDm) | 89.13 |
| Shares outstanding (m) | 69 |
| Major shareholder | AVC (16.9%) |
Financial summary (TWD)
| Year to 31 Dec | 26E | 27E | 28E |
|---|---|---|---|
| Revenue (m) | 17,494 | 24,793 | 30,230 |
| Operating profit (m) | 4,948 | 7,711 | 9,825 |
| Net profit (m) | 4,046 | 6,254 | 7,935 |
| Core EPS (fully-diluted) | 58.996 | 91.206 | 115.720 |
| EPS change (%) | 90.4 | 54.6 | 26.9 |
| Daiwa vs Cons. EPS (%) | (8.0) | (4.6) | 0.9 |
| PER (x) | 27.0 | 17.4 | 13.7 |
| Dividend yield (%) | 1.9 | 2.9 | 3.6 |
| DPS | 29.5 | 45.6 | 57.9 |
| PBR (x) | 10.1 | 7.3 | 5.5 |
| EV/EBITDA (x) | 18.4 | 11.5 | 8.7 |
| ROE (%) | 45.0 | 48.5 | 45.6 |
Source: FactSet, Daiwa forecasts
Fositek: revenue and earnings forecasts revisions
| 2026E | 2026E | 2026E | 2027E | 2027E | 2027E | 2028E | 2028E | 2028E | |
|---|---|---|---|---|---|---|---|---|---|
| (TWDm) | New | Previous | Change | New | Previous | Change | New | Previous | Change |
| Sales | 17,494 | 18,644 | -6.2% | 24,793 | 26,294 | -5.7% | 30,230 | 31,998 | -5.5% |
| Gross profit | 5,948 | 6,283 | -5.3% | 8,925 | 9,071 | -1.6% | 11,185 | 11,199 | -0.1% |
| Gross margin | 34.0% | 33.7% | 0.3pp | 36.0% | 34.5% | 1.5pp | 37.0% | 35.0% | 2pp |
| Operating profit | 4,948 | 5,314 | -6.9% | 7,711 | 7,914 | -2.6% | 9,825 | 9,839 | -0.1% |
| Operating margin | 28.3% | 28.5% | -0.2pp | 31.1% | 30.1% | 1pp | 32.5% | 30.8% | 1.8pp |
| Net profit | 4,046 | 4,560 | -11.3% | 6,254 | 6,720 | -6.9% | 7,935 | 8,318 | -4.6% |
| Net margin | 23.1% | 24.5% | -1.3pp | 25.2% | 25.6% | -0.3pp | 26.2% | 26.0% | 0.3pp |
| Fully diluted EPS (TWD) | 59.00 | 66.47 | -11.2% | 91.21 | 97.96 | -6.9% | 115.72 | 121.26 | -4.6% |
Source: Daiwa forecasts
Fositek: 2Q26 results review
| (TWDm) | Fositek's 2Q26 results | Our forecasts | Differ | Bloomberg consensus | Differ |
|---|---|---|---|---|---|
| Revenue | 3,740 | 4,253 | -12.1% | 4,287 | -12.8% |
| Gross profit | 1,273 | 1,404 | -9.3% | 1,410 | -9.7% |
| Operating profit | 1,043 | 1,159 | -9.9% | 1,153 | -9.5% |
| Profit before tax | 1,075 | 1,204 | -10.6% | 1,188 | -9.5% |
| Net profit | 849 | 1,011 | -16.0% | 969 | -12.4% |
| EPS | 12.39 | 14.75 | -16.0% | 14.23 | -12.9% |
| Margin | |||||
| Gross margin | 34.0% | 33.0% | 1pp | 32.9% | 1.2pp |
| Operating margin | 27.9% | 27.2% | 0.7pp | 26.9% | 1pp |
| Pre-tax margin | 28.8% | 28.3% | 0.5pp | 27.7% | 1pp |
| Net margin | 22.7% | 23.8% | -1.1pp | 22.6% | 0.1pp |
Source: Company, Bloomberg, Daiwa forecasts
Fositek: quarterly and annual P&L
| 2026E | 2026E | 2026E | 2026E 2027E | 2026E 2027E | 2026E 2027E | 2026E 2027E | |||||
|---|---|---|---|---|---|---|---|---|---|---|---|
| (TWDm) | 1Q26 | 2Q26E | 3Q26E | 4Q26E | 1Q27E | 2Q27E | 3Q27E | 4Q27E | |||
| Revenue | 4,184 | 3,740 | 4,550 | 5,020 | 5,500 | 6,000 | 6,300 | 6,993 | 17,494 | 24,793 | 30,230 |
| Gross profit | 1,352 | 1,273 | 1,561 | 1,762 | 1,870 | 2,100 | 2,268 | 2,687 | 5,948 | 8,925 | 11,185 |
| Operating profit | 1,120 | 1,043 | 1,316 | 1,468 | 1,600 | 1,820 | 1,988 | 2,303 | 4,948 | 7,711 | 9,825 |
| Pre-tax profit | 1,165 | 1,075 | 1,348 | 1,500 | 1,639 | 1,859 | 2,027 | 2,342 | 5,089 | 7,867 | 9,982 |
| Net profit | 917 | 849 | 1,071 | 1,208 | 1,303 | 1,478 | 1,612 | 1,862 | 4,046 | 6,254 | 7,935 |
| Basic EPS (TWD) | 13.38 | 12.39 | 15.63 | 17.62 | 19.01 | 21.56 | 23.51 | 27.16 | 59.01 | 91.23 | 115.75 |
| Margin | |||||||||||
| Gross margin | 32.3% | 34.0% | 34.3% | 35.1% | 34.0% | 35.0% | 36.0% | 38.4% | 34.0% | 36.0% | 37.0% |
| Operating margin | 26.8% | 27.9% | 28.9% | 29.2% | 29.1% | 30.3% | 31.6% | 32.9% | 28.3% | 31.1% | 32.5% |
| Pre-tax margin | 27.9% | 28.8% | 29.6% | 29.9% | 29.8% | 31.0% | 32.2% | 33.5% | 29.1% | 31.7% | 33.0% |
| Net margin | 21.9% | 22.7% | 23.5% | 24.1% | 23.7% | 24.6% | 25.6% | 26.6% | 23.1% | 25.2% | 26.2% |
| YoY | |||||||||||
| Revenue | 85.8% | 42.7% | 27.6% | 26.3% | 31.5% | 60.4% | 38.5% | 39.3% | 40.9% | 41.7% | 21.9% |
| Gross profit | 171.2% | 101.9% | 58.2% | 52.6% | 38.3% | 64.9% | 45.3% | 52.5% | 81.9% | 50.1% | 25.3% |
| Operating profit | 206.3% | 110.0% | 66.0% | 68.9% | 42.8% | 74.4% | 51.1% | 56.8% | 96.0% | 55.8% | 27.4% |
| Pre-tax profit | 177.1% | 172.5% | 62.3% | 66.9% | 40.7% | 72.9% | 50.4% | 56.1% | 100.0% | 54.6% | 26.9% |
| Net profit | 157.3% | 157.0% | 56.0% | 60.7% | 42.1% | 74.1% | 50.4% | 54.1% | 90.4% | 54.6% | 26.9% |
| QoQ | |||||||||||
| Revenue | 5.2% | -10.6% | 21.7% | 10.3% | 9.6% | 9.1% | 5.0% | 11.0% | |||
| Gross profit | 17.1% | -5.8% | 22.6% | 12.9% | 6.1% | 12.3% | 8.0% | 18.5% | |||
| Operating profit | 28.9% | -6.9% | 26.1% | 11.6% | 9.0% | 13.8% | 9.2% | 15.8% | |||
| Pre-tax profit | 29.6% | -7.7% | 25.3% | 11.3% | 9.2% | 13.4% | 9.0% | 15.5% | |||
| Net profit | 22.1% | -7.4% | 26.2% | 12.7% | 7.9% | 13.4% | 9.0% | 15.5% |
Source: Company, Daiwa forecasts
Fositek: product mix
Source: Company, Daiwa forecasts
Fositek Corp (6805 TT): 4 August 2026
Fositek: 1-year forward PER
Source: Bloomberg, Daiwa forecasts
Daiwa
Financial summary
Key assumptions
| Year to 31 Dec | 2021 | 2022 | 2023 | 2024 | 2025 | 2026E | 2027E | 2028E |
|---|---|---|---|---|---|---|---|---|
| Foldable phone revenue YoY growth | 0 | 8.9 | 19.1 | 45.9 | 3.6 | (5.0) | 5 | 5 |
| (%) NB YoY growth (%) | 0 | 2.4 | (5.5) | (7.7) | (11.1) | 0.0 | 0 | 0 |
| Server revenue YoY growth (%) | 0 | 0 | 0.0 | 0.0 | 935.9 | 120.0 | 70 | 30 |
Profit and loss (TWDm)
| Year to 31 Dec | 2021 | 2022 | 2023 | 2024 | 2025 | 2026E | 2027E | 2028E |
|---|---|---|---|---|---|---|---|---|
| Foldable phone | 3,572 | 3,889 | 4,633 | 6,759 | 7,001 | 6,651 | 6,984 | 7,333 |
| Server | 0 | 0 | 0 | 435 | 4,506 | 9,914 | 16,853 | 21,909 |
| Other Revenue | 1,449 | 1,125 | 1,011 | 994 | 906 | 929 | 955 | 988 |
| Total Revenue | 5,020 | 5,014 | 5,644 | 8,188 | 12,414 | 17,494 | 24,793 | 30,230 |
| Other income | 0 | 0 | 0 | 0 | 0 | 0 | 0 | 0 |
| COGS | (3,827) | (3,848) | (4,326) | (6,361) | (9,144) | (11,546) | (15,867) | (19,045) |
| SG&A | (133) | (153) | (151) | (180) | (187) | (262) | (347) | (393) |
| Other op.expenses | (251) | (238) | (286) | (450) | (559) | (738) | (868) | (967) |
| Operating profit | 809 | 775 | 881 | 1,197 | 2,524 | 4,948 | 7,711 | 9,825 |
| Net-interest inc./(exp.) | (9) | (15) | 1 | 52 | 41 | 17 | 17 | 17 |
| Assoc/forex/extraord./others | (24) | 76 | 30 | 245 | (21) | 124 | 140 | 140 |
| Pre-tax profit | 776 | 835 | 911 | 1,495 | 2,545 | 5,089 | 7,867 | 9,982 |
| Tax | (243) | (271) | (283) | (267) | (419) | (1,043) | (1,613) | (2,046) |
| Min. int./pref. div./others | 0 | 0 | 0 | 0 | 0 | 0 | 0 | 0 |
| Net profit (reported) | 533 | 564 | 628 | 1,227 | 2,125 | 4,046 | 6,254 | 7,935 |
| Net profit (adjusted) | 533 | 564 | 628 | 1,227 | 2,125 | 4,046 | 6,254 | 7,935 |
| EPS (reported)(TWD) | 9.289 | 9.331 | 10.185 | 17.904 | 31.002 | 59.013 | 91.233 | 115.754 |
| EPS (adjusted)(TWD) | 9.289 | 9.331 | 10.185 | 17.904 | 31.002 | 59.013 | 91.233 | 115.754 |
| EPS (adjusted fully-diluted)(TWD) | 9.276 | 9.311 | 10.174 | 17.890 | 30.982 | 58.996 | 91.206 | 115.720 |
| DPS (TWD) | 3.688 | 4.000 | 6.115 | 8.000 | 10.500 | 29.507 | 45.617 | 57.877 |
| EBIT | 809 | 775 | 881 | 1,197 | 2,524 | 4,948 | 7,711 | 9,825 |
| EBITDA | 910 | 966 | 1,043 | 1,638 | 2,801 | 5,396 | 8,269 | 10,478 |
Cash flow (TWDm)
| Year to 31 Dec | 2021 | 2022 | 2023 | 2024 | 2025 | 2026E | 2027E | 2028E |
|---|---|---|---|---|---|---|---|---|
| Profit before tax | 776 | 835 | 911 | 1,495 | 2,545 | 5,089 | 7,867 | 9,982 |
| Depreciation and amortisation | 126 | 115 | 132 | 196 | 298 | 325 | 419 | 513 |
| Tax paid | (78) | (128) | (125) | (173) | (337) | (1,043) | (1,613) | (2,046) |
| Change in working capital | (726) | 1,400 | 221 | (212) | (260) | (554) | (108) | (316) |
| Other operational CF items | 386 | 96 | 80 | 103 | (274) | (17) | (17) | (17) |
| Cash flow from operations | 484 | 2,318 | 1,218 | 1,409 | 1,970 | 3,799 | 6,549 | 8,115 |
| Capex | (204) | (106) | (189) | (541) | (322) | (500) | (500) | (500) |
| Net (acquisitions)/disposals | 0 | 3 | 5 | (70) | 6 | 0 | 0 | 0 |
| Other investing CF items | 54 | (16) | 2 | (53) | (47) | 0 | 0 | 0 |
| Cash flow from investing | (150) | (119) | (182) | (664) | (362) | (500) | (500) | (500) |
| Change in debt | 644 | 77 | (521) | (10) | (10) | 0 | 0 | 0 |
| Net share issues/(repurchases) | 0 | 0 | 0 | 0 | 0 | 0 | 0 | 0 |
| Dividends paid | (19) | (272) | (242) | (377) | (548) | (720) | (2,023) | (3,127) |
| Other financing CF items | 650 | (19) | 1,833 | (35) | (45) | 0 | 0 | 0 |
| Cash flow from financing | 1,275 | (214) | 1,071 | (422) | (603) | (720) | (2,023) | (3,127) |
| Forex effect/others | 0 | 0 | 0 | 0 | 0 | 0 | 0 | 0 |
| Change in cash | 1,609 | 1,985 | 2,107 | 324 | 1,005 | 2,579 | 4,026 | 4,488 |
| Free cash flow | 280 | 2,131 | 949 | 713 | 1,881 | 3,299 | 6,049 | 7,615 |
Source: FactSet, Daiwa forecasts
Fositek Corp (6805 TT): 4 August 2026
Daiwa
Financial summary continued …
Balance sheet (TWDm)
| Year to 31 Dec | 2021 | 2022 | 2023 | 2024 | 2025 | 2026E | 2027E | 2028E |
|---|---|---|---|---|---|---|---|---|
| Cash & short-term investment | 1,854 | 3,841 | 5,898 | 6,336 | 7,446 | 10,025 | 14,051 | 18,539 |
| Inventory | 1,111 | 943 | 999 | 2,902 | 3,606 | 5,282 | 6,198 | 7,647 |
| Accounts receivable | 1,375 | 452 | 1,462 | 2,166 | 2,300 | 3,930 | 5,080 | 6,493 |
| Other current assets | 49 | 36 | 105 | 260 | 143 | 143 | 143 | 143 |
| Total current assets | 4,390 | 5,272 | 8,464 | 11,664 | 13,494 | 19,380 | 25,472 | 32,822 |
| Fixed assets | 324 | 312 | 359 | 758 | 817 | 992 | 1,073 | 1,060 |
| Goodwill & intangibles | 13 | 12 | 15 | 18 | 17 | 17 | 17 | 17 |
| Other non-current assets | 113 | 107 | 92 | 318 | 351 | 351 | 351 | 351 |
| Total assets | 4,840 | 5,704 | 8,930 | 12,758 | 14,678 | 20,739 | 26,912 | 34,249 |
| Short-term debt | 369 | 703 | 440 | 430 | 420 | 420 | 420 | 420 |
| Accounts payable | 1,502 | 1,865 | 3,224 | 5,811 | 5,911 | 8,662 | 10,618 | 13,162 |
| Other current liabilities | 129 | 133 | 166 | 291 | 503 | 228 | 228 | 228 |
| Total current liabilities | 1,999 | 2,701 | 3,830 | 6,533 | 6,833 | 9,310 | 11,266 | 13,810 |
| Long-term debt | 515 | 258 | 22 | 22 | 22 | 22 | 22 | 22 |
| Other non-current liabilities | 256 | 359 | 483 | 657 | 629 | 629 | 629 | 629 |
| Total liabilities | 2,770 | 3,318 | 4,335 | 7,212 | 7,485 | 9,962 | 11,918 | 14,462 |
| Share capital | 605 | 605 | 686 | 686 | 686 | 686 | 686 | 686 |
| Reserves/R.E./others | 1,466 | 1,781 | 3,910 | 4,861 | 6,507 | 10,092 | 14,308 | 19,102 |
| Shareholders' equity | 2,070 | 2,386 | 4,595 | 5,546 | 7,193 | 10,777 | 14,994 | 19,787 |
| Minority interests | 0 | 0 | 0 | 0 | 0 | 0 | 0 | 0 |
| Total equity & liabilities | 4,840 | 5,704 | 8,930 | 12,758 | 14,678 | 20,739 | 26,912 | 34,249 |
| EV | 108,030 | 106,121 | 103,564 | 103,117 | 101,998 | 99,418 | 95,393 | 90,905 |
| Net debt/(cash) | (971) | (2,880) | (5,437) | (5,884) | (7,003) | (9,582) | (13,608) | (18,096) |
| BVPS (TWD) | 36.079 | 39.467 | 74.534 | 80.906 | 104.919 | 157.208 | 218.717 | 288.635 |
Key ratios (%)
| Year to 31 Dec | 2021 | 2022 | 2023 | 2024 | 2025 | 2026E | 2027E | 2028E |
|---|---|---|---|---|---|---|---|---|
| Sales (YoY) | 125.8 | (0.1) | 12.6 | 45.1 | 51.6 | 40.9 | 41.7 | 21.9 |
| EBITDA (YoY) | 158.0 | 6.1 | 8.0 | 57.1 | 71.0 | 92.7 | 53.2 | 26.7 |
| Operating profit (YoY) | 179.5 | (4.2) | 13.7 | 36.0 | 110.8 | 96.0 | 55.8 | 27.4 |
| Net profit (YoY) | 153.3 | 5.8 | 11.3 | 95.5 | 73.2 | 90.4 | 54.6 | 26.9 |
| Core EPS (fully-diluted) (YoY) | 48.7 | 0.4 | 9.3 | 75.8 | 73.2 | 90.4 | 54.6 | 26.9 |
| Gross-profit margin | 23.8 | 23.3 | 23.3 | 22.3 | 26.3 | 34.0 | 36.0 | 37.0 |
| EBITDA margin | 18.1 | 19.3 | 18.5 | 20.0 | 22.6 | 30.8 | 33.4 | 34.7 |
| Operating-profit margin | 16.1 | 15.5 | 15.6 | 14.6 | 20.3 | 28.3 | 31.1 | 32.5 |
| Net profit margin | 10.6 | 11.3 | 11.1 | 15.0 | 17.1 | 23.1 | 25.2 | 26.2 |
| ROAE | 36.1 | 25.3 | 18.0 | 24.2 | 33.4 | 45.0 | 48.5 | 45.6 |
| ROAA | 13.9 | 10.7 | 8.6 | 11.3 | 15.5 | 22.8 | 26.3 | 25.9 |
| ROCE | 39.6 | 24.6 | 21.0 | 21.7 | 37.0 | 52.5 | 57.9 | 55.1 |
| ROIC | 56.2 | n.a | n.a. | n.a. | n.a. | n.a | n.a | n.a |
| Net debt to equity | n.a. | n.a. | n.a. | n.a. | n.a. | n.a. | n.a. | n.a. |
| Effective tax rate | 31.3 | 32.4 | 31.1 | 17.9 | 16.5 | 20.5 | 20.5 | 20.5 |
| Accounts receivable (days) | 65.8 | 66.5 | 61.9 | 80.9 | 65.7 | 65.0 | 66.3 | 69.9 |
| Current ratio (x) | 2.2 | 2.0 | 2.2 | 1.8 | 2.0 | 2.1 | 2.3 | 2.4 |
| Net interest cover (x) | 91.5 | 50.1 | n.a. | n.a. | n.a. | n.a. | n.a. | n.a. |
| Net dividend payout | 39.7 | 42.9 | 60.0 | 44.7 | 33.9 | 50.0 | 50.0 | 50.0 |
| Free cash flow yield | 0.3 | 2.0 | 0.9 | 0.7 | 1.7 | 3.0 | 5.5 | 7.0 |
Source: FactSet, Daiwa forecasts
Company profile
Fositek is a provider of foldable phone hinges, foldable laptop/tablet hinges, AR/VR glasses hinges, ultra-thin laptop hinges and keyboard hinges, as well as hinges for medical instruments and automobile applications. Its major clients include Huawei and Motorola.
Fositek Corp (6805 TT): 4 August 2026
Daiwa
ESG analysis
ESG risks
| Risks | Management | Analyst comments | |
|---|---|---|---|
| G | Executive/board quality | 1 | The CEO and chairperson of Fositek are not the same individual, and we see no issue with its board quality. Besides, we note that the chairperson has 24 years of experience in this industry and took over the role of chairman at Fositek in 2014, which is a positive sign from a governance perspective. |
| G | Capital management | 2 | Fositek's dividend payout ratio was 40-60% over 2022-25, due likely to its capacity expansion plans. |
| G | Related party & transaction | 2 | Revenue generated from related-party transactions (mainly for AVC and SZFSD) was 0-16% of total revenue during 2022-25, and we found no suspicious activity. |
| E | Supply chain management | 1 | Fositek maintains smooth communication channels with its suppliers and executes its business operations effectively. In response to ESG issues, Fositek actively implements supply chain management, striving to optimise the overall environment through product design, raw-material procurement, manufacturing, transportation, packaging and recycling processes. It integrates upstream and downstream suppliers to establish a green supply chain. For example, Fositek has required its suppliers to sign environmental protection agreements since 2021, committing to comply with hazardous substance control regulations. |
| G | Data security | 2 | To protect company information and customer data, Fositek has passed the IEC/ISO 27001 information security management system certification and will continue to enhance execution in various management areas. |
Note: Management score represents a company's ability to manage/benefit from certain ESG topics. The scores range from 1 to 3, with 1 being the strongest.
Update Date: 7 May 2026
Source: Daiwa, Company
Fositek Corp (6805 TT): 4 August 2026
Daiwa