PDF 原檔:報告_Daiwa_台表科6278_20261027_original.pdf
原始內容
Taiwan Surface Mounting Technology (6278 TT)
Target price: n.a.
Shareprice(27Oct):TWD278.50 | Up/downside:-
Optical segment to boost revenue and margins
- Company expects stronger revenue YoY growth for 2027 vs. 2026…
- … driven by optical segment with sequentially increasing contribution
- New optical transceiver client underway, on top of the existing 3
Background: We met with Taiwan Surface Mounting Technology (TSMT) on 27 October. According to management, its product mix for 3Q26 was TFT-LCD 47%, Mini LED 9%, DRAM module 15%, auto 10%, cable 7%, touch 4% and others 8%. TSMT is positive on its optical transceiver, DRAM module, auto, low-earth orbit satellites (LEO), server and robotic segments. The QFII holding in TSMT was 29.7% on 22 October vs. 19.8% at the end of 2025.
Highlights: 4Q26 and 2027 outlook update - an upward revision. TSMT guided for its 4Q26 revenue to grow by 5-8% QoQ, and 2027 revenue to grow by at least 20% (some upside potential subject to raw material conditions) for 2027 thanks to multiple revenue drivers, including optical transceivers, DRAM module, auto, LEO, server and robotic segments. For 4Q26 and 2027, the company expects its quarterly revenue and gross margin to further expand sequentially on a more favourable product mix from optical transceiver, LEO and server revenue. TSMT expects its gross margin to improve to 15-17% in 1H27 and over 20% in 2H27 on the solid optical transceiver order outlook.
Strong revenue and margin outlook is expected to be driven mainly by the optical transceiver segment. TSMT mentioned several revenue drivers for 2027-28; among them, optical transceiver surface mounting technology (SMT) assembly is the most significant one. TSMT is a major global supplier for 800G and 1.6T products. A US-based client has noted that the 1.6T delivery schedule was ahead of its previous expectation (from 4Q26 to 3Q26). The company has thus won an additional US-based tierone client (expected to have a larger contribution than the first optical client from 3Q27) and a China-based client over the past few months. TSMT is also in talks with a new US-based tier-one optical transceiver client. According to TSMT, optical transceiver revenue will likely account for 510% of total revenue in 1Q27, 10-15% in 2Q27 and 15-20% in 3Q27; for 2028, the company aims for 30-40%. Given the pure outsourcing (ie, includes no buying and selling of material) nature of the optical transceiver business, the segment brings upside potential to the gross margin level, per management. Aside from the optical transceiver segment, the company also sees strong revenue momentum in 2027-2028 from the DRAM module (2027 revenue up 30+% YoY), auto, robotic, LEO and server segments. TSMT says it has been expanding its global capacity and adjusting its equipment to fit different usages, eg, transforming from TFT-LCD to optical transceiver.
Valuation: The stock is currently trading at PERs of 24.8x/13.8x, based on Bloomberg's 2026E/27E EPS forecasts.
Rating No
Helen Chien (886) 2 8758 6254 helen.chien@daiwacm-cathay.com.tw
Neil Teng, CFA (886) 2 8758 6256 neil.teng@daiwacm-cathay.com.tw
Share price performance
| 12-month range | 91.40-316.50 |
|---|---|
| Market cap (USDbn) | 2.50 |
| 3m avg daily turnover (USDm) | 73.74 |
Source: FactSet, Daiwa forecasts
TSMT: financial summary
| (TWDm) | 2024 - 1Q24 | 2024 - 2Q24 | 2024 - 3Q24 | 4Q24 | 1Q25 | 2Q25 | 2025 - 3Q25 | 2025 - 4Q25 | 2025 - 2026 1Q26 | 2025 - 2Q26 | 2025 - 2024 | 2025 | 6M26 |
|---|---|---|---|---|---|---|---|---|---|---|---|---|---|
| Net sales | 10,929 | 11,502 | 11,009 | 11,848 | 12,414 | 12,588 | 12,788 | 12,087 | 12,555 | 13,231 | 45,288 | 49,877 | 25,786 |
| Gross profit | 1,294 | 1,601 | 1,424 | 1,733 | 1,658 | 1,528 | 1,621 | 1,579 | 1,419 | 1,560 | 6,052 | 6,386 | 2,980 |
| Operating profit | 608 | 794 | 646 | 961 | 939 | 840 | 943 | 782 | 724 | 818 | 3,009 | 3,505 | 1,542 |
| Pre-tax profit | 897 | 1,012 | 678 | 1,028 | 1,042 | 597 | 919 | 953 | 799 | 905 | 3,614 | 3,512 | 1,704 |
| Net profit | 681 | 859 | 662 | 704 | 842 | 480 | 696 | 728 | 627 | 800 | 2,906 | 2,746 | 1,427 |
| EPS (TWD) | 2.33 | 2.94 | 2.27 | 2.41 | 2.88 | 1.64 | 2.38 | 2.49 | 2.17 | 2.77 | 9.94 | 9.39 | 4.94 |
| Margins (%) | |||||||||||||
| Gross margin | 11.8% | 13.9% | 12.9% | 14.6% | 13.4% | 12.1% | 12.7% | 13.1% | 11.3% | 11.8% | 13.4% | 12.8% | 11.6% |
| Operating margin | 5.6% | 6.9% | 5.9% | 8.1% | 7.6% | 6.7% | 7.4% | 6.5% | 5.8% | 6.2% | 6.6% | 7.0% | 6.0% |
| Pre-tax margin | 8.2% | 8.8% | 6.2% | 8.7% | 8.4% | 4.7% | 7.2% | 7.9% | 6.4% | 6.8% | 8.0% | 7.0% | 6.6% |
| Net margin | 6.2% | 7.5% | 6.0% | 5.9% | 6.8% | 3.8% | 5.4% | 6.0% | 5.0% | 6.0% | 6.4% | 5.5% | 5.5% |
| YoY (%) | |||||||||||||
| Net sales | 16.1% | -5.6% | -13.6% | -2.5% | 13.6% | 9.4% | 16.2% | 2.0% | 1.1% | 5.1% | -2.6% | 10.1% | |
| Gross profit | 46.1% | 16.0% | -14.6% | 29.1% | 28.1% | -4.5% | 13.8% | -8.9% | -14.4% | 2.1% | 14.7% | 5.5% | |
| Operating profit | 136.3% | 16.4% | -32.7% | 63.1% | 54.5% | 5.7% | 45.9% | -18.6% | -22.9% | -2.6% | 20.9% | 16.5% | |
| Pre-tax profit | 192.4% | 20.3% | -43.3% | 38.3% | 16.2% | -41.0% | 35.5% | -7.2% | -23.3% | 51.5% | 17.1% | -2.8% | |
| Net profit | 139.3% | 35.9% | -27.5% | 3.9% | 23.6% | -44.1% | 5.1% | 3.5% | -25.5% | 66.6% | 15.9% | -5.5% | |
| QoQ (%) | |||||||||||||
| Net sales | -10.1% | 5.2% | -4.3% | 7.6% | 4.8% | 1.4% | 1.6% | -5.5% | 3.9% | 5.4% | |||
| Gross profit | -3.6% | 23.7% | -11.0% | 21.7% | -4.3% | -7.8% | 6.1% | -2.6% | -10.1% | 9.9% | |||
| Operating profit | 3.1% | 30.7% | -18.7% | 48.7% | -2.3% | -10.6% | 12.3% | -17.0% | -7.5% | 13.0% | |||
| Pre-tax profit | 20.6% | 12.8% | -33.0% | 51.6% | 1.4% | -42.7% | 53.8% | 3.8% | -16.2% | 13.3% | |||
| Net profit | 0.6% | 26.1% | -22.9% | 6.2% | 19.6% | -43.0% | 45.0% | 4.7% | -13.9% | 27.5% |
Source: Company
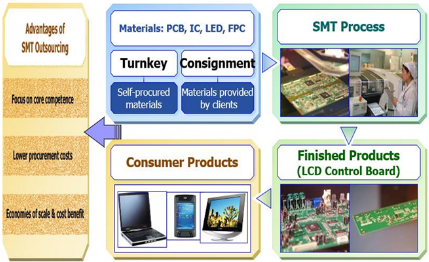
TSMT: EMS business model for SMT outsourcing
TSMT: QFII holding %
Source: Company
TSMT: monthly revenue
Source: Company
TSMT: 1-year-forward PER
Source: Company
Source: Bloomberg
圖片清單(已驗證 2026-10-28)
| 檔名 | size | 分類 | 親眼所見內容 |
|---|---|---|---|
| 報告_Daiwa_台表科6278_20261027_001.png | 20KB | 文字卡(股價走勢小圖,<40KB 未細讀) | Share price performance 折線圖 |
| 報告_Daiwa_台表科6278_20261027_002.png | 165KB | 真資料圖(商業模式圖;原文圖說錯位,所見為 EMS/SMT 委外模式) | 「Advantages of SMT Outsourcing」(專注核心能力、降低採購成本、規模經濟);材料 PCB/IC/LED/FPC 分 Turnkey(自採材料)與 Consignment(客戶提供材料)兩路,經 SMT Process 製成 Finished Products(LCD Control Board),應用於消費性產品(筆電、手機、螢幕) |
| 報告_Daiwa_台表科6278_20261027_003.png | 27KB | 文字卡(QFII 持股比例走勢,<40KB) | QFII holding %,2019-10 約 33% 降至 2021 約 14-15%,2023 起回升至 20% 上下,2026-10 末端急升至約 30% |
| 報告_Daiwa_台表科6278_20261027_004.png | 43KB | 真資料圖(月營收圖,財務類不嵌 lib) | 月營收長條(TWD m,2019-09 至 2026-09)與 YoY 折線,2026 年單月約 4,000-4,700 |
| 報告_Daiwa_台表科6278_20261027_005.png | 36KB | 文字卡(1-year-forward PER,<40KB) | 1-year-forward PER 走勢圖 |