PDF 原檔:報告_Citi_聯發科2454_20260731_original.pdf
圖片清單(已驗證 2026-08-03)
| 檔名 | size | 分類 | 親眼所見內容 |
|---|---|---|---|
260731_citi_mtk_002.png |
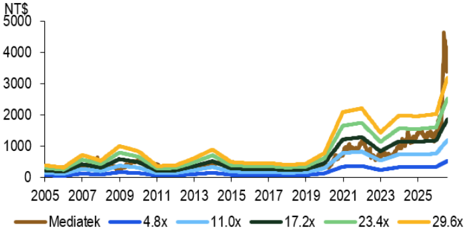
46KB | 真資料圖 | Forward P/E band 走勢圖:Mediatek 股價(棕線)疊 4.8x/11.0x/17.2x/23.4x/29.6x 五條本益比帶,橫軸 2005-2026 |
260731_citi_mtk_003.png |
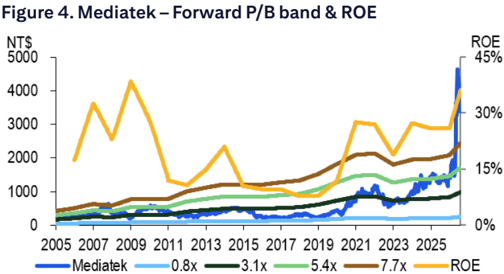
69KB | 真資料圖 | Forward P/B band & ROE 走勢圖:股價疊 0.8x/3.1x/5.4x/7.7x 四條 P/B 帶,右軸另繪 ROE% 橘線,橫軸 2005-2026 |
260731_citi_mtk_004.png |
101KB | 真資料圖 | Bull/Base/Bear 三情境目標價圖:Bull NT$7,000(+97%)/Base NT$6,800(+91%)/Bear NT$3,500(-1.5%),股價走勢至 2026-07-31 收盤 NT$3,555 |
260731_citi_mtk_005.png |
144KB | 真資料圖 | Citi 評等與目標價歷史表(含走勢圖),列出 2023-09 至 2026-07 共 18 筆評等/目標價變動紀錄(日期、評等、目標價、收盤價) |
260731_citi_mtk_006.png |
122KB | 真資料圖 | Citi Short-Term View/Catalyst Watch 歷史紀錄圖(含走勢圖與 10 筆 Add/Remove CW/STV 紀錄表) |
260731_citi_mtk_001.png(19.6KB)低於 40KB 門檻未 Read,預設非資料圖,免列。
原始內容
(RIC: 2454.IW, BB: 2454 11)
TWD
4,500
4,000
3,500
3,000
2,500
2,000
1,500
1,000
500
31 Jul 2026 10:08:41 ET │ 17 pages
Sep
Dec
Mar
Jun
Mediatek (2454.TW)
Raising AI ASIC revenue for 2027
CITI'S TAKE
MediaTek's 2Q26 result was better than market expectation with stable GM/OPM at 46.2% and 15%. The key highlight remained on AI, where MediaTek sees growing demand from both cloud AI infrastructure and Agentic AI at the edge. Production of its first AI ASIC is on track for 4Q26, with company expecting its 2026 AI data center revenue to exceed US$2bn. Management expects AI data center revenue to continue scaling substantially in 2027, supported by stronger customer demand. Reflecting this confidence, the company raised its 2027 AI ASIC TAM to US$80bn and increased its target market share to 15-20% from 10-15%, implying US$1216bn revenue (vs our estimate of US$18bn) reinforcing AI ASIC as one of MediaTek's most important long-term growth drivers. Maintain Buy.
Sustainable and scalable AI revenue growth -Mediatek ' s first AI accelerator remains on track for production in 4Q26, while the second-generation continues progressing smoothly toward high-volume production in 2028 alongside improving advanced packaging yields and supply chain readiness. Management highlighted that it is now engaged with several additional data center ASIC customers, demonstrating a broader pipeline beyond its initial project. It emphasized that execution excellence, close collaboration with customers and supply chain partners, and technology leadership remain its primary competitive advantages. Mediatek is seeing both 2027 and 2028 demand remain strong. It also expects the first- and second-generation ASIC programs to contribute simultaneously in 2028, supporting another meaningful step-up in long-term AI growth.
Building complete AI silicon platform -Beyond custom ASIC design, MediaTek continues expanding into a comprehensive AI silicon platform provider. Rather than supplying individual IP blocks, MediaTek increasingly provides pre-validated subsystem solutions combining SerDes, packaging, memory and connectivity, positioning itself as a strategic partner capable of supporting hyperscalers from chip architecture through complete system implementation. Development of 448G SerDes remains on schedule, with proven silicon expected next year, while investments continue across CPO, optical interconnects, customed memory technologies and 3.5D packaging solutions.
Cloud+Edge AI to support long term growth; reiterate Buy -We believe Mediatek is well-positioned in both edge and cloud AI and expect AI accelerator ASIC to see multiple growth in the next 2-3 years. Our TP is raised to NT$6,800.
Earnings Summary
| Year to 31Dec | Net Profit (NT$M) | DilutedEPS (NT$) | EPSgrowth (%) | P/E (x) | P/B (x) | ROE (%) | Yield (%) |
|---|---|---|---|---|---|---|---|
| 2024A | 106,387 | 66.94 | 38 | 53.1 | 14.4 | 27.8 | 1.5 |
| 2025A | 105,319 | 66.17 | -1.2 | 53.7 | 14.2 | 26.4 | 1.5 |
| 2026E | 109,100 | 68.53 | 3.6 | 51.9 | 13.4 | 26.4 | 1.5 |
| 2027E | 213,113 | 133.87 | 95.3 | 26.6 | 10.4 | 43.8 | 1.5 |
| 2028E | 414,512 | 260.38 | 94.5 | 13.7 | 7.2 | 61.9 | 3 |
Source: Powered by dataCentral
See Appendix A-1 for Analyst Certification, Important Disclosures and Research Analyst Affiliations.
n Buy
Short-Term View: Upside
Price (31 Jul 26 13:30)
NT$3,555.00
Target price
NT$6,800.00↑
from NT$6,055.00
Expected share price
return
91.3%
Expected dividend yield
1.5%
Expected total return
92.8%
Market Cap
NT$5,701,848M US$175,967M
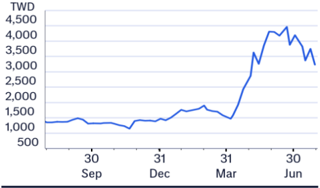
Price Performance (RIC: 2454.TW, BB: 2454 TT)
Laura (Chia Yi) Chen AC
+886-2-8726-9090 laura.cy.chen@citi.com
Jack Chen +886-2-8726-9091 jack1.chen@citi.com
Nicholas Lai +886-2-8726-9093 nicholas.lai@citi.com
| 2454.TW: Fiscalyearend31-Dec | Price: NT$3,555.00; TP: NT$6,800.00; Market Cap: NT$5,701,848m; Recomm:Buy | Price: NT$3,555.00; TP: NT$6,800.00; Market Cap: NT$5,701,848m; Recomm:Buy | Price: NT$3,555.00; TP: NT$6,800.00; Market Cap: NT$5,701,848m; Recomm:Buy | Price: NT$3,555.00; TP: NT$6,800.00; Market Cap: NT$5,701,848m; Recomm:Buy | Price: NT$3,555.00; TP: NT$6,800.00; Market Cap: NT$5,701,848m; Recomm:Buy | Price: NT$3,555.00; TP: NT$6,800.00; Market Cap: NT$5,701,848m; Recomm:Buy | Price: NT$3,555.00; TP: NT$6,800.00; Market Cap: NT$5,701,848m; Recomm:Buy | Price: NT$3,555.00; TP: NT$6,800.00; Market Cap: NT$5,701,848m; Recomm:Buy | Price: NT$3,555.00; TP: NT$6,800.00; Market Cap: NT$5,701,848m; Recomm:Buy | Price: NT$3,555.00; TP: NT$6,800.00; Market Cap: NT$5,701,848m; Recomm:Buy | Price: NT$3,555.00; TP: NT$6,800.00; Market Cap: NT$5,701,848m; Recomm:Buy |
|---|---|---|---|---|---|---|---|---|---|---|---|
| Profit&Loss(NT$m) | 2024 | 2025 | 2026E | 2027E | 2028E | Valuation ratios | 2024 | 2025 | 2026E | 2027E | 2028E |
| Sales revenue | 530,586 | 595,966 | 645,080 | 1,271,082 | 2,600,337 | PE(x) | 53.1 | 53.7 | 51.9 | 26.6 | 13.7 |
| Cost of sales | -267,200 | -312,886 | -347,024 | -694,337 | -1,453,918 | PB(x) | 14.4 | 14.2 | 13.4 | 10.4 | 7.2 |
| Gross profit | 263,386 | 283,080 | 298,055 | 576,745 | 1,146,420 | EV/EBITDA(x) | 52.3 | 51.3 | 51.3 | 23.8 | 11.1 |
| Gross Margin (%) | 49.6 | 47.5 | 46.2 | 45.4 | 44.1 | FCFyield (%) | 2.0 | 2.3 | 0.5 | 5.4 | 8.9 |
| EBITDA(Adj) | 102,794 | 103,926 | 104,170 | 220,629 | 447,325 | Dividend yield (%) | 1.5 | 1.5 | 1.5 | 1.5 | 3.0 |
| EBITDAMargin(Adj) (%) | 19.4 | 17.4 | 16.1 | 17.4 | 17.2 | Payout ratio (%) | 82 | 81 | 78 | 41 | 41 |
| Depreciation | -382 | -456 | -645 | -1,290 | -2,701 | ROE(%) | 27.8 | 26.4 | 26.4 | 43.8 | 61.9 |
| Amortisation | 0 | 0 | 0 | 0 | 0 | Cashflow(NT$m) | 2024 | 2025 | 2026E | 2027E | 2028E |
| EBIT (Adj) | 102,412 | 103,470 | 103,525 | 219,338 | 444,624 | EBITDA | 102,794 | 103,926 | 104,170 | 220,629 | 447,325 |
| EBIT Margin (Adj) (%) | 19.3 | 17.4 | 16.0 | 17.3 | 17.1 | Working capital | 11,974 | 26,049 | -76,697 | 91,261 | 88,781 |
| Net interest | 10,687 | 10,222 | 7,760 | 7,760 | 7,760 | Other | 4,729 | 2,648 | 6,499 | -5,312 | -29,202 |
| Associates | 2,968 | 1,401 | 6,959 | 14,663 | 15,717 | Operating cashflow | 119,496 | 132,623 | 33,972 | 306,577 | 506,905 |
| Non-Op/Except/Other Adj | 3,451 | 9,795 | 6,109 | 1,466 | 4,000 | Capex | -4,008 | -3,966 | -2,953 | -3,495 | -4,787 |
| Pre-tax profit | 119,519 | 124,888 | 124,352 | 243,228 | 472,100 | Net acq/disposals | 20,898 | 2,965 | 0 | 0 | 0 |
| Tax | -12,378 | -18,770 | -14,328 | -29,201 | -56,678 | Other | -19,965 | 1,059 | -35,139 | -14,663 | -15,717 |
| Extraord./Min.Int./Pref.div. | -754 | -798 | -924 | -914 | -910 | Investing cashflow | -3,074 | 57 | -38,092 | -18,158 | -20,503 |
| Reported net profit | 106,387 | 105,319 | 109,100 | 213,113 | 414,512 | Dividends paid | -87,551 | -86,070 | -85,309 | -88,371 | -172,621 |
| Net Margin (%) | 20.1 | 17.7 | 16.9 | 16.8 | 15.9 | Financing cashflow | -78,122 | -101,086 | -82,983 | -85,643 | -169,448 |
| CoreNPAT | 106,387 | 105,319 | 109,100 | 213,113 | 414,512 | Net change in cash | 38,300 | 31,594 | -87,103 | 202,777 | 316,954 |
| Per share data | 2024 | 2025 | 2026E | 2027E | 2028E | Free cashflow to s/holders | 115,488 | 128,656 | 31,019 | 303,083 | 502,118 |
| Reported EPS($) | 66.94 | 66.17 | 68.53 | 133.87 | 260.38 | ||||||
| Core EPS($) | 66.94 | 66.17 | 68.53 | 133.87 | 260.38 | ||||||
| DPS($) | 54.66 | 53.66 | 53.19 | 55.10 | 107.63 | ||||||
| CFPS($) | 75.19 | 83.32 | 21.34 | 192.58 | 318.42 | ||||||
| FCFPS($) | 72.67 | 80.83 | 19.48 | 190.38 | 315.41 | ||||||
| BVPS($) | 247.63 | 249.76 | 264.60 | 342.37 | 493.18 | ||||||
| Wtdavgordshares(m) | 1,589 | 1,592 | 1,592 | 1,592 | 1,592 | ||||||
| Wtdavgdiluted shares (m) | 1,589 | 1,592 | 1,592 | 1,592 | 1,592 | ||||||
| Growthrates | 2024 | 2025 | 2026E | 2027E | 2028E | ||||||
| Sales revenue (%) | 22.4 | 12.3 | 8.2 | 97.0 | 104.6 | ||||||
| EBIT (Adj) (%) | 42.6 | 1.0 | 0.1 | 111.9 | 102.7 | ||||||
| CoreNPAT(%) | 38.2 | -1.0 | 3.6 | 95.3 | 94.5 | ||||||
| CoreEPS(%) | 38.0 | -1.2 | 3.6 | 95.3 | 94.5 | ||||||
| BalanceSheet(NT$m) | 2024 | 2025 | 2026E | 2027E | 2028E | ||||||
| Cash&cashequiv. | 203,696 | 235,290 | 148,187 | 350,964 | 667,918 | ||||||
| Accounts receivables | 44,713 | 62,121 | 76,151 | 190,759 | 303,522 | ||||||
| Inventory | 58,414 | 67,235 | 112,971 | 281,441 | 448,849 | ||||||
| Net fixed &other tangibles | 176,872 | 177,417 | 179,726 | 181,930 | 184,016 | ||||||
| assets | |||||||||||
| Financial &other | 214,172 | 201,722 | 244,271 | 319,467 | 394,742 | ||||||
| Total assets Accounts | 697,868 40,777 | 743,785 48,710 | 761,305 | 1,324,561 | 1,999,046 | ||||||
| payable | 43,872 | 109,297 | 174,310 | ||||||||
| Short-term debt | 8,919 | 4,481 6,795 | 4,663 | 4,852 | 5,049 | ||||||
| Long-term debt | 2,681 | 6,795 | 6,795 | 6,795 | |||||||
| Provisions &other liab | 240,435 | 274,604 | 272,988 | 645,888 | 1,013,273 | ||||||
| Total liabilities | 292,812 | 334,590 | 328,319 | 766,833 | 1,199,428 | ||||||
| Minority interests | 8,428 | 8,594 | 8,594 | 8,594 | |||||||
| 432,986 | 8,594 | ||||||||||
| Total equity | 405,055 | 409,195 -224,014 | 557,728 | 799,619 | |||||||
| Net debt (Adj) | -192,095 | -136,729 | -339,316 | -656,073 | |||||||
| Net debt to equity (Adj) (%) | -47.4 | -54.7 | |||||||||
| For definitions of the items in this | please click here. | -31.6 | -60.8 | -82.0 |
Figure 1. Mediatek - 2026 results overview
2Q26
70,308
22,868
24,335
15.29
46.2%
15.0%
16.0%
1Q26
(NT$mn)
Revenue
Gross Profit
Operating Profit
Net Profit
EPS (NTS)
Margins (%)
Gross Margin
Operating margin
Net margin
69,055
22,891
24,154
15.17
46.3%
15.3%
16.2%
2%
2%
0%
1%
1%
- 0.1 ppt
-0.3 ppt
- 0.2 ppt
2Q26
Citi
143,591
66,644
22,848
25,369
15.94
46.4%
15.9%
17.7%
Diff.
6%
5%
0%
-4%
-4%
- 0.2 ppt
-0.9 ppt
-1.7 ppt
2Q26
Cons
146,685
67,710
21,917
22,429
14.11
46.2%
14.9%
15.3%
C 2026 Citigrouo Inc. No redistribution without Citigrouo's written permission.
Diff.
4%
4%
4%
8%
Citi
Prior Est.
150,023
70,488
26,681
29,067
Cons
Prior Est.
152,032
70,046
23,246
23,936
AI ASIC momentum set to accelerate
47.0%
46.1%
MediaTek delivered 2Q26 revenue of NT$152.2bn, reaching the high end of its guidance, supported by continued strength in Smart Edge Platforms despite softer smartphone demand. GM was 46.2%, in line with expectations. The key highlight remained AI, where MediaTek sees growing demand from both cloud AI infrastructure and Agentic AI at the edge. Production of its first AI accelerator remains on schedule for 4Q26, with company expecting its 2026 AI data center revenue to exceed US$2bn. Looking ahead, management expects AI data center revenue to continue scaling substantially in 2027, supported by stronger customer demand. Reflecting this confidence, the company raised its 2027 AI ASIC SAM to US$80bn and increased its target market share to 15-20% from 10-15%, reinforcing AI ASIC as one of MediaTek's most important long-term growth drivers.
Figure 1. Mediatek - 2Q26 results overview
© 2026 Citigroup Inc. No redistribution without Citigroup's written permission.
Source: Company Reports, Citi Research, Bloomberg
While smartphone demand remains pressured by rising component costs and cautious consumer spending, MediaTek continues to see long-term opportunities from Agentic AI devices. Its next-generation 2nm flagship smartphone SoC, launched in 3Q26, is expected to deliver significantly stronger AI computing capability with improved power efficiency and cost structure, supporting future premium smartphone share gains. Meanwhile, Smart Edge Platforms grew 26% YoY in 2Q26, driven by continued market share gains across connectivity, computing, automotive and advanced computing products. Management also highlighted its collaboration with Nvidia on RTX AI PCs as an important validation of its capabilities in high-performance CPU, connectivity and system integration. Looking ahead, the company expects its Smart Edge Platform revenue to grow by mid-to-high single digits QoQ in 3Q26, largely offsetting weakness in mobile phones and supporting overall revenue growth. For overall 3Q26 outlook, Mediatek is now looking for 0-5% QoQ sales growth with GM maintained at 46% and opex at 31% at the mid-point.
Reiterate Buy and TP raised to NT$6,800 -We maintain our estimates of US$2.2bn/18bn/40bn for Mediatek's AI ASIC revenue in 2026/2027/2028 anticipating its shipment to reach 500k/4m/4m with substantial ASP upside with its next generation ramp up in 2028. We raise our earnings projection by 0.6%/12%/15% for 2026/2027/2028 reflecting both edge AI and cloud AI's promising growth. Based on unchanged 35x 2027/2028 average EPS as we expect Mediatek to transform into an AI semiconductor company, our new TP is now set at NT$6,800 (rounded).
3Q26
Guidance flat to +5% QoQ
Figure 3. Mediatek - Forward P/E band
NTS
5000
4000
3000
2000
1000
2005 2007 2009 2011 2013 2015 2017 2019 2021 2023 2025
Mediatek -
-4.8x
-11.0x •
—17.2x
-23.4x
@ 2026 Citioroun Inc. No redistribution without Citigroun's written nermission
Figure 4. Mediatek - Forward P/D band & Rot
NTS
5000
4000
3000
2000
1000
Figure 2. Mediatek - Estimates Revisions
| 2026E | 2026E | 2026E | 2027E | 2027E | 2027E | 2028E | 2028E | 2028E | |
|---|---|---|---|---|---|---|---|---|---|
| (NT$mn) | New | Old | Chg. | New | Old | Chg. | New | Old | Chg. |
| Sales | 645,080 | 616,651 | 4.6% | 1,271,082 | 1,083,075 | 17.4% | 2,600,337 | 2,110,784 | 23.2% |
| YoYgrowth | 8% | 3% | 97% | 76% | 105% | 95% | |||
| Gross profit | 298,055 | 284,934 | 4.6% | 576,745 | 492,443 | 17.1% | 1,146,420 | 943,367 | 21.5% |
| Opex | 194,530 | 185,062 | 5.1% | 357,406 | 304,633 | 17.3% | 701,796 | 568,994 | 23.3% |
| Operating profit | 103,525 | 99,872 | 3.7% | 219,338 | 187,810 | 16.8% | 444,624 | 374,373 | 18.8% |
| Pre-tax profit | 124,352 | 121,102 | 2.7% | 243,228 | 211,699 | 14.9% | 472,100 | 399,316 | 18.2% |
| Net income | 109,100 | 108,435 | 0.6% | 213,113 | 190,184 | 12.1% | 414,512 | 359,452 | 15.3% |
| EPS(NT$) | 68.53 | 68.11 | 0.6% | 133.87 | 119.47 | 12.1% | 260.38 | 225.79 | 15.3% |
| Gross margin | 46.2% | 46.2% | -0.0 ppt | 45.4% | 45.5% | -0.1 ppt | 44.1% | 44.7% | -0.6 ppt |
| Opexratio | 30.2% | 30.0% | +0.1 ppt | 28.1% | 28.1% | -0.0 ppt | 27.0% | 27.0% | +0.0ppt |
| Operating margin | 16.0% | 16.2% | -0.1 ppt | 17.3% | 17.3% | -0.1 ppt | 17.1% | 17.7% | -0.6 ppt |
| Net margin | 16.9% | 17.6% | -0.7 ppt | 16.8% | 17.6% | -0.8 ppt | 15.9% | 17.0% | -1.1 ppt |
© 2026 Citigroup Inc. No redistribution without Citigroup's written permission.
Source: Citi Research
Figure 3. Mediatek - Forward P/E band
© 2026 Citigroup Inc. No redistribution without Citigroup's written permission.
Source: Citi Research, company data
30%
15%
0%
© 2026 Citigroup Inc. No redistribution without Citigroup's written permission.
Source: Citi Research, company data
Figure 5. Mediatek - Forecast Summary
NISmn
Net sales
Gross profit
OPEX
Operating profit
Total Non-OP
Pre-tax profit
Income tax
Net profit
Margins (%)
EPS (NT$)
Gross profit
OPEX to Sales Ratio
Operating profit
Pre-tax profit
Net profit
Y/Y(%)
Net sales
Gross profit
OPEX
Operating profit
Pre-tax profit
Q/Q(%)
Net profit
Net sales
Gross profit
Operating profit
Pre-tax profit
Net profit
1Q25
30,053
4,500
34,553
5,024
29,325
18.43
4Q25
150,188
69,281
47,431
21,850
5,298
27,147
4,074
22,925
1026
149,151
69,055
46,164
22,891
4,128
27,019
2,643
24,154
3025
142,097
66,112
43,924
22,188
7,772
29,960
4,509
25,221
17.50
14.40
15.17
15.84
Figure 5. Mediatek - Forecast Summary
4Q27E
461,192
211,393
129,595
81,798
6,096
87,894
10,552
77,116
48.44
45.8
2025
595,966
283,080
179,610
103,470
21,418
124,888
18,770
105,319
66.17
47.5
2026E
645,080
298,055
194,530
103,525
20,827
124,352
14,328
68.53
109,100
46.2
2028E
2027E
1,271,082 2,600,337
576.745
357,406
219,338
23,889
243,228
29,201
213,113"
133.87
45.4
444,624
27,477
472,100
56,678
414,512
260.38
44.1
4Q26E
184,107
83,837
54,312
29,526
5,844
35,370
4,246
30,909
19.42
45.5
1Q27E
208,403
93,450
59,395
34,055
5,854
39,909
4,791
34,887
21.91
44.8
2027E
254,635
112,398
71,298
41,101
5,930
47,031
5,646
41,151
25.85
44.1
2026
152,183
70,308
47,440
22,868
5,094
27,962
3,357
24,335
15.29
46.2
3026E
159,639
74,855
46,615
28,241
5,761
34,001
4,082
29,702
18.66
46.9
| 29.6 | 28.5 30.9 | 31.6 | 31.0 | 31.2 | 29.2 | 29.5 | 28.5 28.0 | 28.0 | 28.1 | 30.1 | 30.2 | 28.1 | 27.0 | |
|---|---|---|---|---|---|---|---|---|---|---|---|---|---|---|
| 19.5 | 19.6 15.6 | 14.5 | 15.3 | 15.0 | 17.7 | 16.0 | 16.3 | 16.1 | 18.0 | 17.7 | 17.4 | 16.0 | 17.3 | 17.1 |
| 22.1 | 21.1 22.5 | 18.1 | 18.1 | 18.4 | 21.3 | 19.2 | 19.2 | 18.5 | 19.7 | 19.1 | 21.0 | 19.3 | 19.1 | 18.2 |
| 18.5 | 19.1 17.7 | 15.3 | 16.2 | 16.0 | 18.6 | 16.8 | 16.7 | 16.2 | 17.3 | 16.7 | 17.7 | 16.9 | 16.8 | 15.9 |
| 18.1 | 14.9 7.8 | 8.8 | (2.7) | 1.2 | 12.3 | 22.6 | 39.7 | 67.3 | 117.3 | 150.5 | 12.3 | 8.2 | 97.0 | 104.6 |
| 18.9 | 5.6 2.7 | 3.4 | (6.4) | (4.8) | 13.2 | 21.0 | 35.3 | 59.9 | 113.1 | 152.1 | 7.5 | 5.3 | 93.5 | 98.8 |
| 19.7 | 16.0 8.5 | 4.0 | 5.5 | 6.6 | 6.1 | 14.5 | 28.7 | 50.3 108.3 | 138.6 | 11.6 | 8.3 | 83.7 | 96.4 | |
| 17.7 | (6.6) (T.0) | 2.0 | (23.8) | (22.2) | 27.3 | 35.1 | 48.8 | 79.7 | 120.9 | 177.0 | 1.0 | 0.1 | 111.9 | 102.7 |
| 13.8 | (3.1) (7.0) 5.3 | 3.6 | (21.8) | (15.8) | 13.5 | 30.3 | 47.7 | 68.2 | 101.1 | 148.5 | 4.5 | (0.4) | 95.6 | 94.1 |
| 8.3 | (0.5) | (3.6) | (17.6) | (12.6) | 17.8 | 34.8 | 44.4 | 69.1 | 101.9 | 149.5 | (1.0) | 3.6 | 95.3 | 94.5 |
| (1.9) | t1.1 | 5.7 | (0.7) | 15.3 | 22.2 | 36.2 | 33.0 | |||||||
| (5.5) | 13.2 | |||||||||||||
| 0.1 (2.2) | 10.2 (10.5) (24.5) | 4.8 | (0.3) | 1.8 | 12.0 | 11.5 | 20.3 | 41.9 | 32.5 | |||||
| 40.4 | (1.5) | 15.3 | 20.7 | 51.8 | 31.1 | |||||||||
| (3.8) | 31.8 (9.8) | (9.4) | (0.5) | 4.0 | 12.8 | 17.8 | 45.4 | 28.5 | ||||||
| (5.0) | (9.4) | (9.1) | 5.4 | 22.1 | 4.1 | 12.9 | 18.0 | 45.7 | 28.6 | |||||
| M 2026 Citiornun Ine No redistrihution without Citioroun's written nermission |
© 2026 Citigroup Inc. No redistribution without Citigroup's written permission.
Source: Citi Research, company data
2Q25
44,499
29,379
3,849
33,228
5,163
27,848
3Q27E
346,853
159,503
97,119
62,385
6,008
68.393
8,211
59,958
37.66
46.0
Adding Upside 90-Day Short-Term View on Mediatek (2454.TW)
Direction:
Upside
Duration:
Within 90 Days
Category:
Thematic driven
We expect Mediatek's positive guidance on AI ASIC sales outlook to support its share price performance in the coming months.
NT$
7,002
5,835
4,668
3,501
2,334
1,167
0
Jul 25
4 197% Upside
NT$6,800.00
4 91% Upside
Bull/Bear: Mediatek (2454.TW)
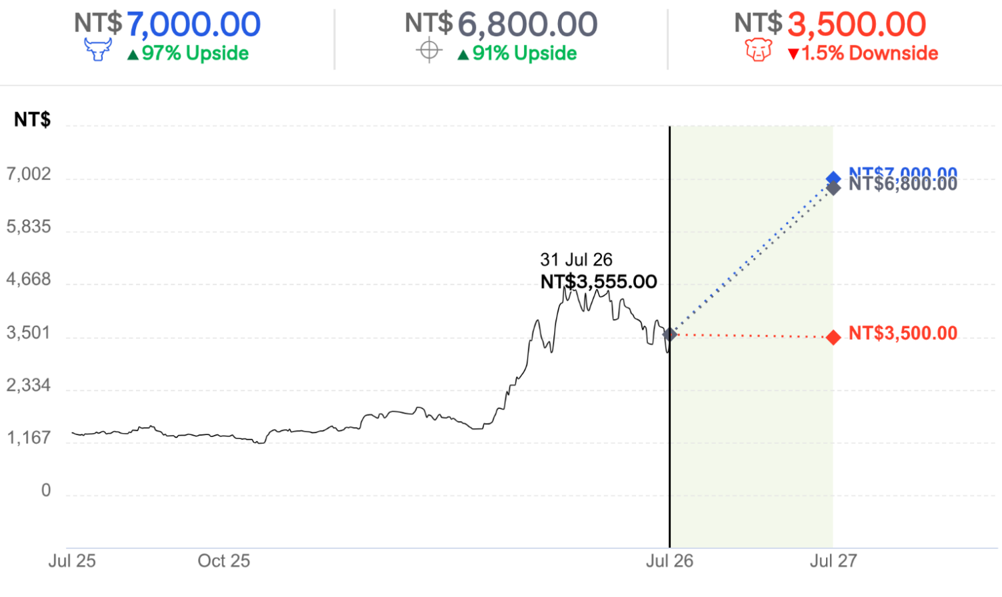
• Bull case TP is based on its peak cycle valuation of 37x PER to 2027/28E EPS
BASE Assumptions
- 2027/28E GM of >45%
• 2027/28E OPM of >16%
- BEAR Assumptions
• Lower than Al ASIC development
- Worse than expected margins declines
• Bear case TP is based on 18x PER (the mid-point of its historical valuation) to 2027/28E EPS
NT$ 3,500.00
v1.5% Downside
Mediatek
Company description
MediaTek (MTK) is a fabless IC company that designs SoC for smartphone, smart TV, and digital media devices. It also develops chips for connectivity, networking, smart home gadgets, and automotive sectors. It was founded in 1997, is listed on the Taiwan Stock Exchange, and is headquartered in Taiwan. It has sales and research subsidiaries in mainland China, Singapore, India, the US, Japan, Korea, Denmark, and England. It primarily sells its products in China and other emerging-market countries.
Investment strategy
We rate MediaTek shares as Buy. We expect Mediatek to ride on 5G migration in emerging markets and market share gain of its high-end Dimensity series in China market as well. In particular, we see strong growth potential from its AI ASIC, NTN-satellite business in the long term. We believe solid fundamentals and strong operating leverage will support Mediatek's margins outlook.
Valuation
Our NT$6,800 target price (rounded) for MediaTek is based on 35x P/E to 2027/2028 EPS, which is 1.5-std above its five-year average forward P/E given the promising outlook from its AI ASIC business starting from 2H26. We believe our target PE is also justified by Mediatek's global and regional peers' trading at an average of 36x PER. AI ASIC development with CSPs should provide more upside from 2027 onwards. We also see Mediatek well prepared for 6G and 6G+NTN Satellite communication. Despite lukewarm smartphone overall deamand, we expect Mediatek to benefit from 5G migration in emerging markets and its Dimensity series should also gain shares in flagship models. Non-smartphone business is also seeing stabilizing TV and IoT demand with Mediatek outgrowing the overall market on its better technology in WiFi 7 and connectivity.
Risks
Key downside risks that could prevent the shares from reaching our target price include: 1) weaker-than-expected growth from AI ASIC business; 2) more severe competition in the smartphone segment; 3) slower overall demand related to macroeconomic risks, especially for smartphone demand; and 4) further price hikes from foundries.
Mediatek (2454.TW)
Analyst: Laura (Chia Yi) Chen
TWD
4,000
2,000
If you are visually impaired and would like to speak to a Citi representative regarding the details of the graphics in this document, please call USA 1-888-500-5008 (TTY: 711), from outside the US +1-210-677-3788 J FM AM DJ FM DJ FM
Date
Appendix A-1
E 06-Nov-23 16:50:42
1
*1,030.00
882.00
1
[ 30-Apr-25 10:15:39
1,230.00