PDF 原檔:報告_Citi_玉晶光3406_20261027_original.pdf
原始內容
Prepared for [讀者資訊已遮蔽] citi
27 Oct 2026 07:23:02 ET │ 16 pages
Genius Electronic Optical (3406.TW)
Upside on EBO as a long-term catalyst
CITI'S TAKE
Genius reported its 3Q26 earnings of NT$1,092m, down 23% YoY, up 59% QoQ, below our estimate and consensus. Despite 3Q26 shortfall, we believe market now more focuses on its new business in EBO. We've highlighted in our previous report on Genius' development on optical ferrule solution (see our recent report). Following 3M's announcement of investment in Genius on EBO business cooperation, 3M reiterated an EBO total addressable market of approximately US$2 billion in 2028 during its latest earnings. Alongside Microsoft's deployment, 3M also announced that its Amazon ramp in late 2027. As the key partner for 3M, we believe EBO optical solution will become the key catalyst for Genius in the next few years.
Smartphone business unexciting but steady - Genius' preliminary 3Q26 earnings were weaker than ours and Street's estimate as we see potential negative F/X impact on RMB appreciation and GM decline on new project ramp. While Genius' peer, Largan, has indicated a muted outlook for the smartphone industry as the peak production ramp for newly launched models has passed, we expect Genius' revenue to decline seasonally in 4Q26. However, another wave of base-model smartphone launches in 1Q27 should help support demand during what is typically its seasonally slower period at the start of next year. Given its steady market share gain, we expect a stable GM ahead.
EBO business may contribute 8-10% revenue in 2027, more upside ahead - EBO technology uses lens arrays to expand and collimate light between optical fibers, enabling transmission across a contactless interface. Thanks to Genius' experience in camera lens and early business engagement with 3M, the company is working closely with 3M to expand these business opportunities. Compared with conventional physical-contact connectors, EBO reduces sensitivity to dust, cleaning requirements and connector wear, while enabling faster installation and higher connection density. We expect a great opportunity for Genius to extend its precision-optics expertise into infrastructure where reliability and deployment efficiency directly affect customer economics.
Reiterate Buy and raise TP to NT$1,380 - While Genius is also navigating the opportunities in CPO and PMLA for FAU, we believe it takes time and the EBO contribution will provide more substantial upside for the next two years. Given better visibility from its cooperation with 3M, we lift our TP by ~32% to NT$1,380 (higher PER of 33x of 2027/28 EPS projection vs 25x PER previously).
Earnings Summary
| Year to 31 Dec | Net Profit (NT$M) | Diluted EPS (NT$) | EPS growth (%) | P/E (x) | P/B (x) | ROE (%) | Yield (%) |
|---|---|---|---|---|---|---|---|
| 2024A | 4,323 | 38.35 | 40.7 | 31.6 | 5.5 | 18.8 | 1.5 |
| 2025A | 3,702 | 32.84 | -14.4 | 36.8 | 5.1 | 14.4 | 1.3 |
| 2026E | 3,750 | 33.26 | 1.3 | 36.4 | 4.6 | 13.5 | 1.3 |
| 2027E | 4,299 | 38.13 | 14.6 | 31.7 | 4.6 | 14.7 | 1.5 |
| 2028E | 5,261 | 46.67 | 22.4 | 25.9 | 4.2 | 17.0 | 1.8 |
Source: Powered by dataCentral
See Appendix A-1 for Analyst Certification, Important Disclosures and Research Analyst Affiliations.
n Buy
Short-Term View: Upside, expires 26-NOV-26
Price (27 Oct 26 13:30)
NT$1,210.00
Target price NT$1,380.00↑
from NT$1,050.00
Expected share price
return
14.0%
Expected dividend yield
1.3%
Expected total return
15.4%
Market Cap NT$136,419M US$4,186M
Price Performance
(RIC: 3406.TW, BB: 3406 TT)
Laura (Chia Yi) Chen AC
+886-2-8726-9090 laura.cy.chen@citi.com
Jack Chen
+886-2-8726-9091
jack1.chen@citi.com
Nicholas Lai
+886-2-8726-9093
nicholas.lai@citi.com Prepared for [讀者資訊已遮蔽] Prepared for [讀者資訊已遮蔽]
| Profit & Loss (NT$m) | 3406.TW: Fiscal year end 31-Dec - 2024 | 2025 | 2026E | 2027E | 2028E | Valuation ratios | Price: NT$1,210.00; TP: NT$1,380.00; Market Cap: NT$136,419m; Recomm: Buy - 2024 | Price: NT$1,210.00; TP: NT$1,380.00; Market Cap: NT$136,419m; Recomm: Buy - 2025 | Price: NT$1,210.00; TP: NT$1,380.00; Market Cap: NT$136,419m; Recomm: Buy - 2026E | Price: NT$1,210.00; TP: NT$1,380.00; Market Cap: NT$136,419m; Recomm: Buy - 2027E | Price: NT$1,210.00; TP: NT$1,380.00; Market Cap: NT$136,419m; Recomm: Buy - 2028E |
|---|---|---|---|---|---|---|---|---|---|---|---|
| Sales revenue | 23,187 | 24,989 | 26,467 | 27,500 | 32,848 | PE (x) | 31.6 | 36.8 | 36.4 | 31.7 | 25.9 |
| Cost of sales | -15,190 | -16,864 | -17,790 | -18,358 | -21,737 | PB (x) | 5.5 | 5.1 | 4.6 | 4.6 | 4.2 |
| Gross profit | 7,997 | 8,125 | 8,677 | 9,143 | 11,111 | EV/EBITDA (x) | 15.7 | 15.3 | 14.1 | 13.7 | 11.9 |
| Gross Margin (%) | 34.5 | 32.5 | 32.8 | 33.2 | 33.8 | FCF yield (%) | 4.3 | 3.1 | 7.8 | 4.5 | 4.4 |
| EBITDA (Adj) | 8,370 | 8,320 | 8,628 | 8,445 | 9,530 | Dividend yield (%) | 1.5 | 1.3 | 1.3 | 1.5 | 1.8 |
| EBITDA Margin (Adj) (%) | 36.1 | 33.3 | 32.6 | 30.7 | 29.0 | Payout ratio (%) | 47 | 47 | 47 | 47 | 47 |
| Depreciation | -3,699 | -3,547 | -3,576 | -3,024 | -2,804 | ROE (%) | 18.8 | 14.4 | 13.5 | 14.7 | 17.0 |
| Amortisation | 0 | 0 | 0 | 0 | 0 | Cashflow (NT$m) | 2024 | 2025 | 2026E | 2027E | 2028E |
| EBIT (Adj) | 4,671 | 4,773 | 5,052 | 5,421 | 6,726 | EBITDA | 8,370 | 8,320 | 8,628 | 8,445 | 9,530 |
| EBIT Margin (Adj) (%) | 20.1 | 19.1 | 19.1 | 19.7 | 20.5 | Working capital | 1,158 | -1,214 | 5,369 | 702 | 40 |
| Net interest | 304 | 298 | 302 | 276 | 276 | Other | -334 | -1,065 | -1,294 | -1,122 | -1,465 |
| Associates | 4 | 2 | 0 | 0 | 0 | Operating cashflow | 9,195 | 6,040 | 12,704 | 8,025 | 8,106 |
| Non-Op/Except/Other Adj | 945 | -83 | -401 | 100 | 100 | Capex | -3,283 | -1,811 | -2,120 | -1,888 | -2,135 |
| Pre-tax profit | 5,925 | 4,990 | 4,954 | 5,797 | 7,102 | Net acq/disposals | -96 | 109 | -16 | 0 | 0 |
| Tax | -1,587 | -1,282 | -1,195 | -1,498 | -1,841 | Other | 499 | 142 | -125 | 0 | 0 |
| Extraord./Min.Int./Pref.div. | -14 | -6 | -8 | 0 | 0 Investing cashflow | -2,880 | -1,560 | -2,261 | -1,888 | -2,135 | |
| Reported net profit | 4,323 | 3,702 | 3,750 | 4,299 | 5,261 | Dividends paid | -1,340 | -2,010 | -1,721 | -1,744 | -1,999 |
| Net Margin (%) | 18.6 | 14.8 | 14.2 | 15.6 | 16.0 | Financing cashflow | -3,856 | -4,859 | -1,195 | -4,245 | -1,999 |
| Core NPAT | 4,323 | 3,702 | 3,750 | 4,299 | 5,261 | Net change in cash | 2,459 | -379 | 9,248 | 1,892 | 3,972 |
| Per share data | 2024 | 2025 | 2026E | 2027E | 2028E | Free cashflow to s/holders | 5,912 | 4,229 | 10,583 | 6,137 | 5,971 |
| Reported EPS ($) | 38.35 | 32.84 | 33.26 | 38.13 | 46.67 | ||||||
| Core EPS ($) | 38.35 | 32.84 | 33.26 | 38.13 | 46.67 | ||||||
| DPS ($) | 18.00 | 15.42 | 15.62 | 17.90 | 21.91 | ||||||
| CFPS ($) | 81.55 | 53.57 | 112.68 | 71.18 | 71.90 | ||||||
| FCFPS | 52.96 | ||||||||||
| ($) | 52.43 | 37.51 | 93.87 | 54.43 | |||||||
| BVPS ($) Wtd avg ord shares (m) | 222.01 113 | 237.40 113 | 261.80 113 | 262.28 113 | 291.49 113 | ||||||
| Wtd avg diluted shares (m) | 113 | 113 | 113 | 113 | 113 | ||||||
| Growth rates | 2024 | 2025 | 2026E | 2027E | 2028E | ||||||
| Sales revenue (%) | 7.0 | 7.8 | 5.9 | 3.9 | 19.4 | ||||||
| EBIT (Adj) (%) | 13.1 | 2.2 | 5.8 | 7.3 | 24.1 | ||||||
| Core NPAT (%) | 40.7 | -14.4 | 1.3 | 14.6 | 22.4 | ||||||
| Core EPS (%) | 40.7 | -14.4 | 1.3 | 14.6 | 22.4 | ||||||
| Balance Sheet (NT$m) | 2024 | 2025 | 2026E | 2027E | 2028E | ||||||
| Cash & cash equiv. | 11,173 | 10,795 | 20,042 | 21,934 | 25,906 | ||||||
| Accounts receivables | 3,981 | 5,640 | 5,241 | 6,758 | 6,770 | ||||||
| Inventory | 2,379 | 2,115 | 2,021 | 2,606 | 2,610 | ||||||
| Net fixed & other tangibles | 20,727 | 18,991 | 17,536 | 16,400 | 15,730 | ||||||
| Goodwill & intangibles | 0 | 0 | 0 | 0 | 0 | ||||||
| Financial & other assets | 4,774 | 6,099 | 3,753 | 3,852 | 3,853 | ||||||
| Total assets | 43,035 | 43,641 | 48,594 | 51,549 | 54,869 | ||||||
| Accounts payable | 1,367 | 2,631 | 2,725 | 3,659 | 3,701 | ||||||
| Short-term debt | 3,494 | 1,508 | 1,846 | 1,846 | 1,846 | ||||||
| Long-term debt | 3,365 | 2,759 | 2,192 | 2,192 | 2,192 | ||||||
| Provisions & other liab | 10,044 | 10,259 | 12,619 | 14,587 | 14,603 | ||||||
| 18,271 | 17,157 | 19,382 | 22,284 | 22,341 | |||||||
| Total liabilities | 24,791 | 26,510 | 32,550 | ||||||||
| Shareholders' equity Minority interests | -27 | -27 | 29,234 -23 | 29,288 -23 | -23 | ||||||
| Total equity | 24,765 | 26,484 | 29,212 | 29,266 | 32,528 | ||||||
| Net debt (Adj) | -4,314 | -6,528 | -16,005 | -17,896 | -21,868 | ||||||
| Net debt to equity (Adj) (%) | -17.4 | ||||||||||
| For definitions of the items in this table, | please click here. | -24.6 | -54.8 | -61.2 | -67.2 |
Figure 1. 3M - EBO product demo
EBO: Solving AI Data Centers' Connectivity Bottlenecks
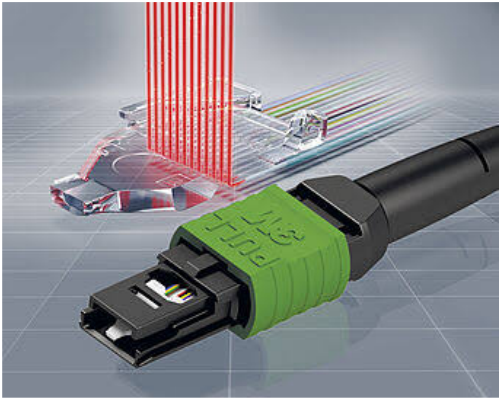
Expanded Beam Optical (EBO) technology uses lens arrays to expand and collimate light between optical fibers, enabling transmission across a contactless interface. Compared with conventional physical-contact connectors, EBO reduces sensitivity to dust, cleaning requirements and connector wear, while enabling faster installation and higher connection density. These benefits become increasingly valuable as AI clusters require more fiber connections in difficult-to-access locations, including optical backplanes. For Genius, this creates an opportunity to extend its precision-optics expertise into infrastructure where reliability and deployment efficiency directly affect customer economics.
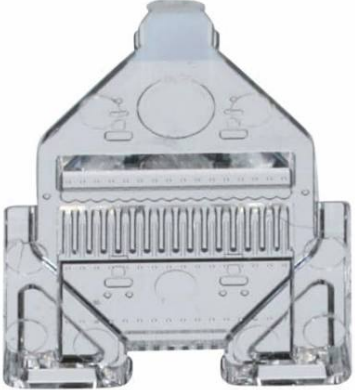
Figure 2. 3M - EBO product demo
© 2026 Citigroup Inc. No redistribution without Citigroup's written permission.
Source: Citi Research, 3M
© 2026 Citigroup Inc. No redistribution without Citigroup's written permission. Source: Citi Research, 3M
Technology Requirements and Genius's Manufacturing Advantage
EBO relaxes some connector-interface tolerances, but manufacturing its optical structures still requires precise lens geometry, consistent fiber-to-lens positioning, dimensional stability and stringent optical-loss control. The competitive challenge is reproducing that performance at high volumes with attractive yields. Genius' established precision-optics manufacturing capabilities and production scale therefore complement 3M's proprietary ferrule technology, materials expertise and customer relationships. Their collaboration supports commercialization and capacity expansion, while 3M's planned approximately 4.7% equity investment strengthens strategic alignment. In our view, this provides Genius with a credible route into optical connectivity, given its smartphone-lens expertise translates into qualified, reliable production.
Prepared for [讀者資訊已遮蔽]
Implications for Genius: Strategic Diversification, with Earnings Following the Ramp
The partnership positions Genius as a manufacturing participant in 3M's EBO expansion, offering a potential growth engine beyond consumer-device optics. Our interpretation is that technology qualification, production yields and capacity readiness will matter most initially, with stronger revenue potential as deployments accelerate from 2027. We estimate the revenue contribution to reach about 8%/28% in 2027/2028 assuming around 30m/140m units based on 3M's addressable market estimate.
Muted smartphone outlook well anticipated, more optical upside in AI
Genius' near-term momentum is still highly relying on smartphone order flow. Its peer, Largan, has indicated a muted outlook for the smartphone industry as the peak production ramp for newly launched models has passed; we expect Genius' revenue to decline seasonally in 4Q26. However, another wave of base-model smartphone launches in 1Q27 should help support demand during what is typically its seasonally slower period at the start of next year. Given its steady market share gain, we expect a stable GM ahead. While Genius is also navigating the opportunities in CPO and PMLA for FAU, we believe it takes time and the EBO contribution will provide more substantial upside for the next two years. We slightly lower our earnings projection for 2026/2027 but lift 2028 estimate by 6%, given better visibility for its cooperation with 3M. We raise our TP to NT$1,380 from NT$1,050 previously (higher PER of 33x of our 2027/28 EPS projection vs 25x previously). 33x PER is above the high end of its 5-year historical range as we believe the high growth optical opportunity in AI arena and 3M's strategic cooperation should further reinforce Genius' position in capturing the expanding optical connector markets, leading to better growth and re-rating potential for Genius.
Figure 3. Genius - Estimates Revisions
| (NT$mn) | 2026E - New | 2026E - Old | 2026E - Chg. | 2027E - New | 2027E - Old | 2027E - Chg. | 2028E - New | 2028E - Old | 2028E - Chg. |
|---|---|---|---|---|---|---|---|---|---|
| Sales | 26,467 | 24,673 | 7% | 27,500 25,972 | 27,500 25,972 | 6% | 32,848 | 28,687 | 15% |
| Gross profit | 8,677 | 8,433 | 3% | 9,143 | 9,124 | 0% | 11,111 | 10,164 | 9% |
| Opex | (3,625) | (3,499) | 4% | (3,722) | (3,547) | 5% | (4,385) | (3,841) | 14% |
| Operating profit | 5,052 | 4,933 | 2% | 5,421 | 5,577 | -3% | 6,726 | 6,323 | 6% |
| Pre-tax profit | 4,954 | 5,196 | -5% | 5,797 | 5,953 | -3% | 7,102 | 6,699 | 6% |
| Net income | 3,750 | 3,931 | -5% | 4,299 | 4,407 | -2% | 5,261 | 4,960 | 6% |
| EPS (NT$) | 33.3 | 34.9 | -5% | 38.1 | 39.1 | -2% | 46.7 | 44.0 | 6% |
| Gross margin | 32.8% | 34.2% | -1.4 ppts | 33.2% | 35.1% | -1.9 ppts | 33.8% | 35.4% | -1.6 ppts |
| Opex ratio | -13.7% | -14.2%+0.5 | ppts | -13.5% | -13.7% | +0.1 ppts | -13.4% | -13.4% | +0.0 ppts |
| Operating margin | 19.1% | 20.0% | -0.9 ppts | 19.7% | 21.5% | -1.8 ppts | 20.5% | 22.0% | -1.6 ppts |
| Net margin | 14.2% | 15.9% | -1.8 ppts | 15.6% | 17.0% | -1.3 ppts | 16.0% | 17.3% | -1.3 ppts |
© 2026 Citigroup Inc. No redistribution without Citigroup's written permission.
Source: Citi Research Prepared for [讀者資訊已遮蔽]
© 2026 Citigroup Inc. No redistribution without Citigroup's written permission.
Source: Citi Research, Company data
Figure 6. Genius - Forecast summary
| NT$mn | 1Q25 | 2Q25 | 3Q25 | 4Q25 | 1Q26 | 2Q26 | 3Q26E | 4Q26E | 1Q27E | 2Q27E | 3Q27E | 4Q27E | 2025 | 2026E | 2027E | 2028E |
|---|---|---|---|---|---|---|---|---|---|---|---|---|---|---|---|---|
| Net sales | 5,321 | 4,776 | 7,740 | 7,152 | 6,141 | 5,682 | 7,812 | 6,832 | 6,193 | 5,466 | 7,032 | 8,809 | 24,989 | 26,467 | 27,500 | 32,848 |
| Gross profit OPEX | 1,646 749 | 1,388 | 2,641 827 | 2,449 983 | 2,061 860 | 1,884 925 | 2,523 945 | 2,209 895 | 2,013 851 | 1,852 879 | 2,273 868 | 3,005 1,123 | 8,125 3,352 | 8,677 3,625 | 9,143 3,722 | 11,111 4,385 |
| 792 596 | 1,814 | 1,466 | 1,201 | 960 | 1,578 | 1,314 | 1,162 | 973 | 1,405 | 1,881 | 4,773 | 5,052 | 5,421 | 6,726 | ||
| Operating profit Total Non-OP | 897 | (304) | 119 | 135 | 39 | (142) | (103) | 108 | 145 | 45 | 143 | 43 | 217 | (86) | 376 | 376 |
| Pre-tax profit | 267 1,164 | 292 | 1,933 | 1,602 | 1,239 | 818 | 1,475 | 1,422 | 1,307 | 1,018 | 1,548 | 1,924 | 4,990 | 4,954 | 5,797 | 7,102 |
| Income tax | 294 | 51 | 516 | 348 | 383 | 341 | 324 | 275 | 418 | 481 | 1,282 | 1,195 | 1,498 | 1,841 | ||
| Net profit | 872 | 240 | 1,414 | 422 1,176 | 891 | 124 686 | 1,092 | 1,081 | 983 | 743 | 1,130 | 1,443 | 3,702 | 3,750 | 4,299 | 5,261 |
| EPS | 7.7 | 2.1 | 12.5 | 10.4 | 7.9 | 6.1 | 9.7 | 9.6 | 8.7 | 6.6 | 10.0 | 12.8 | 32.8 | 33.3 | 38.1 | 46.7 |
| Margins (%) | ||||||||||||||||
| Gross profit | 30.9 | 29.1 | 34.1 | 34.3 | 33.6 | 33.2 | 32.3 | 32.3 | 32.5 | 33.9 | 32.3 | 34.1 | 32.5 | 32.8 | 33.2 | 33.8 |
| OPEX to Sales Ratid | 14.1 | 16.6 | 10.7 | 13.7 | 14.0 | 16.3 | 12.1 | 13.1 | 13.7 | 16.1 | 12.4 | 12.8 | 13.4 | 13.7 | 13.5 | 13.4 |
| Operating profit | 16.8 | 12.5 | 23.4 | 20.5 | 19.6 | 16.9 | 20.2 | 19.2 | 18.8 | 17.8 | 20.0 | 21.4 | 19.1 | 19.1 | 19.7 | 20.5 |
| Total Non-OP | 5.0 | (6.4) | 1.5 | 1.9 | 0.6 | (2.5) | (1.3) | 1.6 | 2.3 | 0.8 | 2.0 | 0.5 | 0.9 | (0.4) | 1.4 | 1.1 |
| Pre-tax profit | 21.9 | 6.1 | 25.0 | 22.4 | 20.2 | 14.4 | 18.9 | 20.8 | 21.1 | 18.6 | 22.0 | 21.8 | 20.0 | 18.7 | 21.1 | 21.6 |
| Net profit | 16.4 | 5.0 | 18.3 | 16.4 | 14.5 | 12.1 | 14.0 | 15.8 | 15.9 | 13.6 | 16.1 | 16.4 | 14.8 | 14.2 | 15.6 | 16.0 |
| Y/Y (%) | ||||||||||||||||
| Net sales | 1.6 | (4.2) | 3.3 | 30.7 | 15.4 | 19.0 | 0.9 | (4.5) | 0.9 | (3.8) | (10.0) | 28.9 | 7.8 | 5.9 | 3.9 | 19.4 |
| Gross profit | (12.0) | (24.8) | (5.9) | 66.2 | 25.2 | 35.7 | (4.5) | (9.8) | (2.3) | (1.7) | (9.9) | 36.0 | 1.6 | 6.8 | 5.4 | 21.5 |
| Operatingprofit | (20.1) | (43.5) | (8.5) | 186.6 | 33.9 | 61.0 | (13.0) | (10.4) | (3.2) | 1.4 | (11.0) | 43.2 | 2.2 | 5.8 | 7.3 | 24.1 |
| Pre-tax profit | (23.0) | (78.7) | 1.6 | 40.8 | 6.5 | 179.8 | (23.7) | (11.2) | 5.4 | 24.5 | 5.0 | 35.3 | (15.8) | (0.7) | 17.0 | 22.5 |
| Net profit | (19,.8) | (76.0) | 2.6 | 37.0 | 2.1 | 185.9 | (22.7) | (8.1) | 10.3 | 8.3 | 3.4 | 33.5 | (14.4) | 1.3 | 14.6 | 22.4 |
| Q/Q(%) | ||||||||||||||||
| Net sales | (2.7) | (10.2) | 62.1 | (7.6) | (14.1) | (7.5) | 37.5 | (12.5) | (9.4) | (11.7) | 28.7 | 25.3 | ||||
| Gross profit | 11.7 | (15.7) | 90.2 | (ε°2) | (15.9) | (8.6) | 33.9 | (12.4) | (8.9) | (8.0) | 22.7 | 32.2 | ||||
| Operatingprofit | 75.2 | (33.5) | 204.2 | (19.1) | (18.1) | (20.1) | 64.4 | (16.7) | (11.6) | (16.2) | 44.4 | 33.9 | ||||
| Pre-tax profit | 2.3 | (74.9) | 561.5 | (17.1) | (22.6) | (34.0) | 80.4 | (3.6) | (8.1) | (22.1) | 52.0 | 24.3 | ||||
| Net profit | 1.6 | (72.5) | 489.0 | (16.8) | (24.2) | (23.0) | 59.2 | (1.0) | (9.1) | (24.4) | 52.0 | 27.7 |
Source: Citi Research
© 2026 Citigroup Inc. No redistribution without Citigroup's written permission. Source: Citi Research, Company data Prepared for [讀者資訊已遮蔽]
Short-Term View on Genius Electronic Optical (3406.TW)
Direction:
Duration:
Upside
Within 90 Days (expires 26 Nov 2026)
Date Added:
27 Aug 2026
Category:
Thematic driven
We expect Genius' positive development in new optical connector business to support the share price performance in the coming months.
Prepared for [讀者資訊已遮蔽]
Bull/Bear: Genius Electronic Optical (3406.TW)
Spread 58pp
Current Price and expected returns (upside/downside) as of 27 Oct 2026
BULLAssumptions
- Less fierce competition and more favorable product mix
- Stronger than expected growth potential in new business
BASE Assumptions
- GM of >33% in 2027-28E
BEAR Assumptions
- More fierce competition and less favorable product mix
- Weaker than expected progress in new business
Prepared for [讀者資訊已遮蔽]
Genius Electronic Optical
Company description
Genius is a leading lens provider. It was established in 1989 and listed on TWSE in 2005. Its revenue increased from NT$4.5bn in 2010 to NT$23.2bn in 2024. The revenue breakdown for Genius in 2023 was 73% smartphone lens and 27% others.
Investment strategy
We have a Buy rating on Genius. We expect Genius to see resilient sales momentum driven by stable lens sales in iPhone business. Moreover, we see its new development in EBO business to provide strong upside potential in the longer term.
Valuation
Our target price for Genius of NT$1,380 is based on 33x 2027/28 EPS. We are using 2027/28 as the valuation base year as we believe the new business in optical connector will be a new catalyst starting from next year. 33x PER is above the high end of its 5-year historical range as we believe the high growth optical opportunity in AI arena will lead better growth and re-rating and 3M's strategic cooperation further reinforces Genius' position in capturing the expanding optical connector markets. Genius used to trade based on smartphone product cycle and the growth has been stagnant. With the new optical connector opportunity, we view it should be resuming strong growth ahead.
Risks
Key downside risks that could mean the stock fails to achieve our target price include: lower-than-expected smartphone sell-through; lower iPhone share allocation; slower-than-expected spec migration for the lens industry; and slower than expected prorgess in new optical business.
If you are visually impaired and would like to speak to a Citi representative regarding the details of the graphics in this document, please call USA 1-888-500-5008 (TTY: 711), from outside the US +1-210-677-3788
Appendix A-1
圖片清單(已驗證 2026-10-28)
| 檔名 | size | 分類 | 親眼所見內容 |
|---|---|---|---|
| 報告_Citi_玉晶光3406_20261027_001.png | 16KB | 文字卡(股價走勢小圖,<40KB 略) | 3406 價格表現折線圖,未細讀 |
| 報告_Citi_玉晶光3406_20261027_002.png | 108KB | 真資料圖(產品圖) | Figure 1「3M - EBO product demo」:透明塑膠光學元件實體照,上方有凸起卡榫,中段為一排細密齒狀溝槽/透鏡陣列,下半有對位孔與兩側底座 |
| 報告_Citi_玉晶光3406_20261027_003.png | 202KB | 真資料圖(產品圖) | Figure 2「3M - EBO product demo」:綠色 3M MT 光纖連接器接頭與黑色線纜,後方透明塑膠元件上方多道紅色光束垂直射入、另有彩色光纖由側邊延伸 |
| 報告_Citi_玉晶光3406_20261027_004.png | 129KB | 真資料圖(財務/估值圖,不嵌 lib) | Figure 4 Genius Forward P/E band(6.5x/10.4x/14.3x/18.2x,2010–2026,近期股價遠高於 18.2x 上緣);Figure 5 Forward P/B band(2.0x–5.0x)與 ROE 折線 |
| 報告_Citi_玉晶光3406_20261027_005.png | 95KB | 真資料圖(Bull/Bear,不嵌 lib) | 2026-10-27 股價 NT$1,210;Bull NT$1,500(+24%)、Base NT$1,380(+14%)、Bear NT$800(-34%);附一年股價走勢 |
| 報告_Citi_玉晶光3406_20261027_006.png | 191KB | 真資料圖(評等沿革,不嵌 lib;原文未內嵌,位於 Appendix) | Genius 評等/目標價沿革:2023-11-24 TP 345(評等 3)起,歷次調整至 2026-03-12 評等 3、TP 405(股價 420.5)、2026-08-27 評等 1(Buy)、TP 1,050(股價 834);下圖 Short-Term View:2025-12-09 Add STV Downside、2026-01-08 Remove、2026-08-27 Add Upside 90 天 |