PDF 原檔:報告_Citi_台積電_20260703_original.pdf
圖片清單(已驗證 2026-07-06)
ingest 時建立的「眼見為憑」圖片索引,是 lib/ 嵌圖的唯一真相來源;嵌入時只從這裡挑分類為「真資料圖」的,不照 trimmed 引用順序猜。
| 檔名 | size | 分類 | 親眼所見內容 |
|---|---|---|---|
2026-07-03 260703_citi_TSMC_001.png |
17KB | 裝飾·logo·banner | <40KB,未讀(預設 logo / 封面) |
2026-07-03 260703_citi_TSMC_002.png |
22KB | 裝飾·logo·banner | <40KB,未讀(預設 logo / 封面) |
2026-07-03 260703_citi_TSMC_003.png |
19KB | 裝飾·logo·banner | <40KB,未讀(預設 logo / 封面) |
2026-07-03 260703_citi_TSMC_004.png |
26KB | 裝飾·logo·banner | <40KB,未讀(預設 logo / 封面) |
2026-07-03 260703_citi_TSMC_005.png |
46KB | 真資料圖 | capex 趨勢柱狀圖(US$mn)+ 資本密集度折線(%),2021–2028E,2026E 55bn→2027E 75bn→2028E 80bn |
2026-07-03 260703_citi_TSMC_006.png |
95KB | 真資料圖 | 台灣 12 吋廠與先進封裝廠列表(Fab 12/14A/14B/15A/15B/18A/18B/20/22/25/26 + AP1-AP8),含地點、製程重心、擴張備注 |
2026-07-03 260703_citi_TSMC_007.png |
54KB | 真資料圖 | 海外廠列表(Fab21 Arizona、AP10 Arizona、TSMC Nanjing、JSMC Japan、ESMC Germany),含製程重心與量產時程 |
2026-07-03 260703_citi_TSMC_008.png |
147KB | 真資料圖 | Forward P/E band(圖8,2010–2026,11.4x–18.6x)與 Forward P/B band+ROE(圖9,2010–2026,2.7x–4.6x)雙圖 |
2026-07-03 260703_citi_TSMC_009.png |
63KB | 真資料圖 | Bull/Bear/Base 情境圖:2025-07→2027 股價走勢+三情境目標(Bull NT$4,000、Base NT$3,800、Bear NT$2,200)、現價 NT$2,445 |
2026-07-03 260703_citi_TSMC_010.png |
146KB | 真資料圖 | TSMC(2330.TW) Ratings and Target Price History(Laura Chen),2023–2026;含每次調整日期、評等、目標價、收盤價 |
2026-07-03 260703_citi_TSMC_011.png |
120KB | 真資料圖 | TSMC(2330.TW) Short-Term View/Catalyst Watch Research(Laura Chen),2024–2026;含各次 CW/STV 加入與移除日期 |
分類只有三類:
真資料圖/裝飾·logo·banner/文字卡。<40KB 未 Read 者免列(預設 logo)。
原始內容
(RIC: 2330.1W, BB: 2330 11)
TWD
2,500
2,250
2,000
1,750
1,500
1,250
1,000
Prepared for Kevin Lu
03 Jul 2026 11:05:54 ET │ 20 pages
Sep
Dec
Mar
Jun
TSMC (2330.TW)
Scaling growth through technology, packaging and capacity
CITI'S TAKE
TSMC will host 2Q26 analyst meeting on July 16. We think there is a higher likelihood for TSMC to further lift its revenue growth target for 2026 and long-term revenue CAGR given sustained leading-edge demand and improving visibility in the longer term . GM should continue to be resilient thanks to high UTR and efficiency despite rising depreciation and N2 dilution. We see demand extending well beyond GPUs, custom ASICs, TPUs, networking silicon and optical interconnects, and upside from CPU. These all supports broad-based utilization across advanced nodes. We also see wafer pricing trending up into next year on the back of strong N2 and N3 demand. We believe TSMC remains a primary beneficiary of AI semiconductor content growth regardless of customer mix.
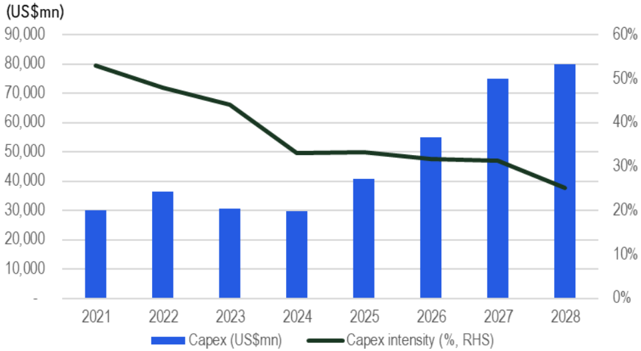
Capacity expansion to continue in both advanced node and packaging -Compared to other leading foundry peers, TSMC's largest advantage is not solely process technology but manufacturing scale. Our estimates suggest combined A14, N2/A16 and N3 capacity could approach c350-400k wpm by the end of 2028. The company also maintains priority access to EUV tools, even without high-NA EUV adoption, allowing faster capacity expansion while preserving industry-leading yields. This scale advantage should continue supporting wafer pricing, customer stickiness and GM sustainability despite increasing foundry competition. We lift our capex estimate for 2027/2028 to US$75-80bn (from US$68bn and US$75bn respectively) while maintaining our 2026 capex unchanged at US$55bn.
CoPoS to follow CoWoS and SoIC in 2029 onward -We also update advanced packaging capacity in this note; however, using CoWoS capacity growth alone to estimate its customer share gains or AI accelerator shipment is becoming increasingly misleading. As package architecture shifts from conventional 2.5D integration toward heterogeneous 3D stacking, the packaging content, manufacturing cycle time and material intensity per product are diverging rapidly. Looking further ahead, glass core and CoPoS represent the next potential packaging evolution by enabling larger package sizes, improved dimensional stability and finer routing density, potentially supporting future AI accelerators beyond today's organic substrates. We view glass as complementary for CoWoS, with hybrid bonding, SoIC and advanced interconnect likely remaining the key differentiators in next few years.
Reiterate Buy with TP NT$3,800 -We lift our TP of TSMC to NT$3,800 (25x of our 2027 EPS). AI infrastructure investment remains as its key multi-year growth driver.
Earnings Summary
| Year to 31Dec | Net Profit (NT$M) | DilutedEPS (NT$) | EPSgrowth (%) | P/E (x) | P/B (x) | ROE (%) | Yield (%) |
|---|---|---|---|---|---|---|---|
| 2024A | 1,173,268 | 45.24 | 39.9 | 54 | 14.8 | 30.3 | 0.6 |
| 2025A | 1,717,883 | 66.24 | 46.4 | 36.9 | 11.7 | 35.4 | 0.7 |
| 2026E | 2,752,835 | 106.15 | 60.2 | 23 | 8.5 | 42.8 | 1.1 |
| 2027E | 3,855,921 | 148.69 | 40.1 | 16.4 | 6.3 | 44 | 2 |
| 2028E | 5,145,557 | 198.42 | 33.4 | 12.3 | 4.7 | 43.5 | 2.6 |
Source: Powered by dataCentral
See Appendix A-1 for Analyst Certification, Important Disclosures and Research Analyst Affiliations.
n Buy
Catalyst Watch: Upside
Price (03 Jul 26 13:30)
NT$2,445.00
Target price
NT$3,800.00↑
from NT$2,875.00
Expected share price
return
55.4%
Expected dividend yield
2.0%
Expected total return
57.4%
Market Cap
NT$63,404,645M US$2,001,472M
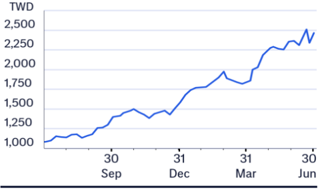
Price Performance (RIC: 2330.TW, BB: 2330 TT)
Laura (Chia Yi) Chen AC
+886-2-8726-9090 laura.cy.chen@citi.com
Jack Chen +886-2-8726-9091 jack1.chen@citi.com
Nicholas Lai +886-2-8726-9093 nicholas.lai@citi.com
Prepared for Kevin Lu
| 2330.TW: Fiscalyearend31-Dec | Price: NT$2,445.00; TP: NT$3,800.00; MarketCap:NT$63,404,645m; Recomm:Buy | Price: NT$2,445.00; TP: NT$3,800.00; MarketCap:NT$63,404,645m; Recomm:Buy | Price: NT$2,445.00; TP: NT$3,800.00; MarketCap:NT$63,404,645m; Recomm:Buy | Price: NT$2,445.00; TP: NT$3,800.00; MarketCap:NT$63,404,645m; Recomm:Buy | Price: NT$2,445.00; TP: NT$3,800.00; MarketCap:NT$63,404,645m; Recomm:Buy | Price: NT$2,445.00; TP: NT$3,800.00; MarketCap:NT$63,404,645m; Recomm:Buy | Price: NT$2,445.00; TP: NT$3,800.00; MarketCap:NT$63,404,645m; Recomm:Buy | Price: NT$2,445.00; TP: NT$3,800.00; MarketCap:NT$63,404,645m; Recomm:Buy | Price: NT$2,445.00; TP: NT$3,800.00; MarketCap:NT$63,404,645m; Recomm:Buy | Price: NT$2,445.00; TP: NT$3,800.00; MarketCap:NT$63,404,645m; Recomm:Buy | Price: NT$2,445.00; TP: NT$3,800.00; MarketCap:NT$63,404,645m; Recomm:Buy |
|---|---|---|---|---|---|---|---|---|---|---|---|
| Profit&Loss(NT$m) | 2024 | 2025 | 2026E | 2027E | 2028E | Valuation ratios | 2024 | 2025 | 2026E | 2027E | 2028E |
| Sales revenue | 2,894,308 | 3,809,054 | 5,494,192 | 7,599,082 | 10,069,949 | PE(x) | 54.0 | 36.9 | 23.0 | 16.4 | 12.3 |
| Cost of sales | -1,269,954 | -1,527,760 | -1,804,479 | -2,462,467 | -3,236,423 | PB(x) | 14.8 | 11.7 | 8.5 | 6.3 | 4.7 |
| Gross profit | 1,624,354 | 2,281,294 | 3,689,713 | 5,136,615 | 6,833,525 | EV/EBITDA(x) | 31.4 | 23.5 | 14.7 | 10.5 | 7.8 |
| Gross Margin (%) | 56.1 | 59.9 | 67.2 | 67.6 | 67.9 | FCFyield (%) | 1.5 | 1.8 | 2.3 | 4.2 | 6.5 |
| EBITDA(Adj) | 1,984,850 | 2,624,188 | 4,157,645 | 5,683,889 | 7,488,567 | Dividend yield (%) | 0.6 | 0.7 | 1.1 | 2.0 | 2.6 |
| EBITDAMargin(Adj) (%) | 68.6 | 68.9 | 75.7 | 74.8 | 74.4 | Payout ratio (%) | 31 | 27 | 26 | 32 | 32 |
| Depreciation | -662,797 | -688,096 | -946,363 | -1,213,023 | -1,538,087 | ROE(%) | 30.3 | 35.4 | 42.8 | 44.0 | 43.5 |
| Amortisation | 0 | 0 | 0 | 0 | 0 | Cashflow(NT$m) | 2024 | 2025 | 2026E | 2027E | 2028E |
| EBIT (Adj) | 1,322,053 | 1,936,092 | 3,211,282 | 4,470,866 | 5,950,480 | EBITDA | 1,984,850 | 2,624,188 | 4,157,645 | 5,683,889 | 7,488,567 |
| EBIT Margin (Adj) (%) | 45.7 | 50.8 | 58.4 | 58.8 | 59.1 | Working capital | 68,257 | 27,877 | -483,716 | -42,228 | -70,702 |
| Net interest | 67,781 | 86,206 | 100,491 | 172,894 | 248,749 | Other | -147,949 | -215,723 | -458,447 | -614,945 | -804,922 |
| Associates | 828 | 2,546 | 2,000 | 2,000 | 2,000 | Operating cashflow | 1,905,157 | 2,436,342 | 3,215,482 | 5,026,717 | 6,612,942 |
| Non-Op/Except/Other Adj | 15,176 | 16,819 | 26,370 | 37,995 | 50,350 | Capex | -956,007 | -1,272,411 | -1,725,763 | -2,360,000 | -2,520,000 |
| Pre-tax profit | 1,405,839 | 2,041,663 | 3,340,143 | 4,683,755 | 6,251,579 | Net acq/disposals | 74,369 | 122,881 | 140,206 | 291,308 | -241,263 |
| Tax | -233,407 | -326,266 | -588,404 | -830,340 | -1,109,365 | Other | 0 | 0 | 0 | 0 | 0 |
| Extraord./Min.Int./Pref.div. | 836 | 2,486 | 1,096 | 2,506 | 3,344 | Investing cashflow | -881,638 | -1,149,530 | -1,585,557 | -2,068,692 | -2,761,263 |
| Reported net profit | 1,173,268 | 1,717,883 | 2,752,835 | 3,855,921 | 5,145,557 | Dividends paid | -363,055 | -466,779 | -716,556 | -1,243,429 | -1,645,148 |
| Net Margin (%) | 40.5 | 45.1 | 50.1 | 50.7 | 51.1 | Financing cashflow | -313,242 | -590,737 | -667,343 | -1,197,793 | -1,581,415 |
| CoreNPAT | 1,173,268 | 1,717,883 | 2,752,835 | 3,855,921 | 5,145,557 | Net change in cash | 627,147 | 615,273 | 871,653 | 1,669,303 | 2,179,335 |
| Per share data | 2024 | 2025 | 2026E | 2027E | 2028E | Free cashflow to s/holders | 949,151 | 1,163,931 | 1,489,719 | 2,666,717 | 4,092,942 |
| Reported EPS($) | 45.24 | 66.24 | 106.15 | 148.69 | 198.42 | ||||||
| Core EPS($) | 45.24 | 66.24 | 106.15 | 148.69 | 198.42 | ||||||
| DPS($) | 14.00 | 18.00 | 27.63 | 47.95 | 63.44 | ||||||
| CFPS($) | 73.46 | 93.95 | 123.99 | 193.83 | 255.00 | ||||||
| FCFPS($) | 36.60 | 44.88 | 57.44 | 102.83 | 157.83 | ||||||
| BVPS($) | 165.37 | 208.98 | 287.50 | 388.24 | 523.22 | ||||||
| Wtdavgordshares(m) | 25,934 | 25,933 | 25,933 | 25,933 | 25,933 | ||||||
| Wtdavgdiluted shares (m) | 25,934 | 25,933 | 25,933 | 25,933 | 25,933 | ||||||
| Growthrates | 2024 | 2025 | 2026E | 2027E | 2028E | ||||||
| Sales revenue (%) | 33.9 | 31.6 | 44.2 | 38.3 | 32.5 | ||||||
| EBIT (Adj) (%) | 43.5 | 46.4 | 65.9 | 39.2 | 33.1 | ||||||
| CoreNPAT(%) | 39.9 | 46.4 | 60.2 | 40.1 | 33.4 | ||||||
| CoreEPS(%) | 39.9 | 46.4 | 60.2 | 40.1 | 33.4 | ||||||
| BalanceSheet(NT$m) | 2024 | 2025 | 2026E | 2027E | 2028E | ||||||
| Cash&cashequiv. | 2,127,627 | 2,767,856 | 3,532,182 | 5,047,303 | 7,006,606 | ||||||
| Accounts receivables | 272,088 | 281,791 | 639,020 | 751,185 | 1,016,476 | ||||||
| Inventory | 287,869 | 288,109 | 470,131 | 550,801 | 742,793 | ||||||
| Net fixed &other tangibles | 3,235,771 | 3,691,841 | 4,524,195 | 5,618,469 | 7,145,262 | ||||||
| Goodwill &intangibles assets | 0 | 0 | 0 | 0 | 0 | ||||||
| Financial &other | 769,374 | 903,426 | 1,194,037 | 1,332,488 | 1,654,489 | ||||||
| Total assets | 6,692,729 | 7,933,024 | 10,359,565 | 13,300,245 | 17,565,626 | ||||||
| Accounts payable | 74,227 | 84,330 | 113,456 | 126,485 | 187,670 | ||||||
| Short-term debt | 59,858 | 136,926 | 183,947 | 224,571 | 281,616 | ||||||
| Long-term debt | 958,429 | 896,062 | 896,062 | 896,062 | 896,062 | ||||||
| Provisions &other liab | 1,275,849 | 1,354,911 | 1,667,931 | 1,939,959 | 2,583,356 | ||||||
| Total liabilities | 2,368,362 | 2,472,229 | 2,861,395 | 3,187,077 | 3,948,705 | ||||||
| Shareholders' equity interests | 4,288,545 | 5,419,596 | 7,455,875 | 10,068,367 | 13,568,777 | ||||||
| Minority | 35,031 | 41,199 | 42,295 | 44,801 | 48,145 | ||||||
| Total equity | 4,323,576 | 5,460,795 | 7,498,170 | 10,113,168 | 13,616,921 | ||||||
| Net debt (Adj) | -1,109,340 | -1,734,869 | -2,452,173 | -3,926,670 | -5,828,927 | ||||||
| Net debt to equity (Adj) (%) | -25.7 | -31.8 | -32.7 | -38.8 | -42.8 | ||||||
| For definitions of the items in this | table, please click here. |
Prepared for Kevin Lu
Technology Leadership Extends Beyond Process Nodes into Advanced Packaging
Compared to other leading foundry peers, TSMC's largest advantage is not solely process technology but manufacturing scale. Our estimates suggest combined A14, N2/A16 and N3 capacity could approach approximately c350-400k wafers per month by the end of 2028. The company also maintains priority access to EUV tools, even without high-NA EUV adoption, allowing faster capacity expansion while preserving industry-leading yields. This scale advantage should continue supporting wafer pricing, customer stickiness and gross margin expansion despite increasing foundry competition.
While competitors continue narrowing the transistor density gap, putting more capex and aggressive on advanced packaging. TSMC's competitive advantage increasingly comes from its integrated platform combining leading-edge logic with advanced packaging. TSMC's advanced packaging including CoWoS platform, SoIC and COUPE has become the industry's de facto standard for AI accelerators due to its superior HBM integration, manufacturing maturity and ecosystem support. Intel's EMIB remains an attractive architecture for certain chiplet applications by reducing silicon interposer size and lowering packaging cost, but it has yet to demonstrate comparable scalability for large AI systems requiring extremely high memory bandwidth (see our previous report of TSMC (2330.TW) Competitive Landscape Holding Steady). Looking further ahead, glass core and CoPoS represent the next potential packaging evolution by enabling larger package sizes, improved dimensional stability and finer routing density, potentially supporting future AI accelerators beyond today's organic substrates. We view glass as complementary for CoWoS, with hybrid bonding, SoIC and advanced interconnect technologies likely remaining the key differentiators over the next several years.
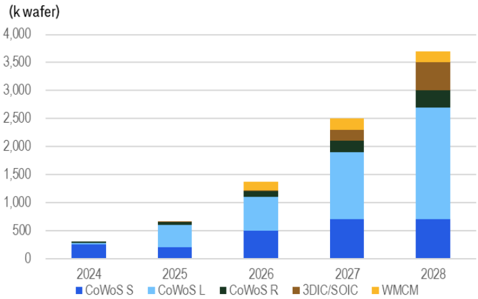
We expect TSMC to continue aggressive investment across CoWoS and SoIC under its 3DFabric roadmap; in 1Q26, we expected CoWoS capacity reaching roughly 200k wafers/month by 2027 while SoIC expanding toward 70-80k wafers/month in 2028. We now also expect TSMC may start CoPoS production in 2029/2030 with initial capacity plan at 40-50kwpm. Importantly, packaging demand is broadening beyond AI GPUs into AI ASICs, CPUs and high-speed networking processors, suggesting advanced packaging will remain one of TSMC's fastestgrowing businesses. We also expect future packaging innovation-including glass core, chip-to-wafer hybrid bonding and larger multi-reticle integration-to further strengthen TSMC's technology leadership.
Figure s. lome - advanced node capacity expansion torecast
(k wafer)
4,000
3,500
4,500
4,000
3,500
3,000
2,500
2,000
3,000
2,500
1,500
2,000
1,000
500
1,500
1,000
500
© 2026 Citigroun Inc. No redistribution without Citigroup's written permission..
C 2026 Citigroun Inc. No redistribution without Citigroun's written permission.
customer
(k wafer)
1,500
1,250
1,000
750
Figure 1. TSMC -advanced packaging capacity forecast
250
© 2026 Citigroup Inc. No redistribution without Citigroup's written permission. Source: Citi Research
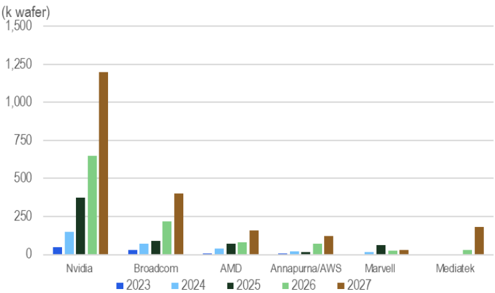
Figure 2. TSMC -advanced packaging allocation by customer
Nvidia
© 2026 Citigroun Inc. No redistribution without Citigroup's written permission..
2028
© 2026 Citigroup Inc. No redistribution without Citigroup's written permission. Source: Citi Research
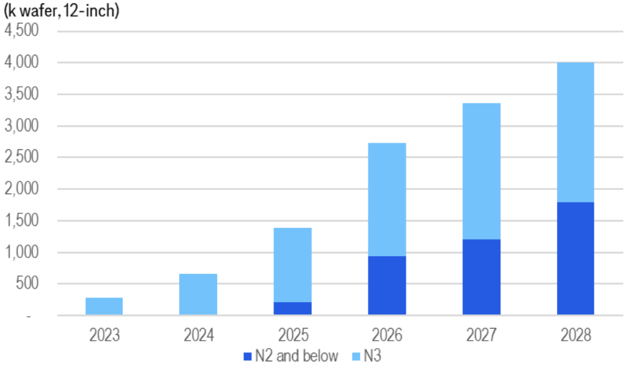
Figure 3. TSMC - advanced node capacity expansion forecast
© 2026 Citigroup Inc. No redistribution without Citigroup's written permission.
Source: Citi Research
Advanced packaging getting more complex; the CoWoS capacity myth.
The rapid adoption of advanced 3D integration and applications are making CoWoS capacity a much less relevant proxy for investor to project GPU/ASIC shipment growth than it was in previous AI GPU cycles. Products such as AMD's MI455, which stacks six logic dies using SoIC, and next-generation platforms such as Feynman introduce significantly higher packaging complexity, making the conversion between wafer starts, SoIC output and effective CoWoS capacity increasingly difficult. In other words, one 'unit' of CoWoS capacity no longer represents the same amount of compute, silicon area, or packaging content across different products.
Prepared for Kevin Lu
2024
Figure 4. 15Me - capex trend and capex intensity
(US$mn)
90,000
80,000đ
70,000
60,000
50,000
40,000
30,000
20,000
10,000
2021
2022
2023
2024
2025
• Capex (US$mn)
C 2026 Citioroun Inc. No redistribution without Citioroun' s written nermission I
Prepared for Kevin Lu
60%
50%
40%
At the same time, investors are overlooking another important bottleneck: CoWoS expansion is no longer determined solely by TSMC's packaging capacity. The ecosystem is becoming increasingly constrained by upstream ABF substrate availability, particularly as larger package sizes, higher layer counts and more complex substrate designs accompany advanced 3D architectures . As a result, incremental CoWoS capacity additions do not necessarily translate into proportional shipment growth for every customer.
2026
2027
2028
Therefore, using CoWoS capacity growth alone to estimate customer share gains or AI accelerator shipment growth is becoming increasingly misleading. As package architecture shifts from conventional 2.5D integration toward heterogeneous 3D stacking, the packaging content, manufacturing cycle time and material intensity per product are diverging rapidly. Future customer growth should be evaluated based on package architecture, SoIC content, substrate consumption and overall packaging complexity, rather than relying on a simple CoWoS capacity multiplier.
Capacity Expansion Supports a Multi-Year Growth Cycle
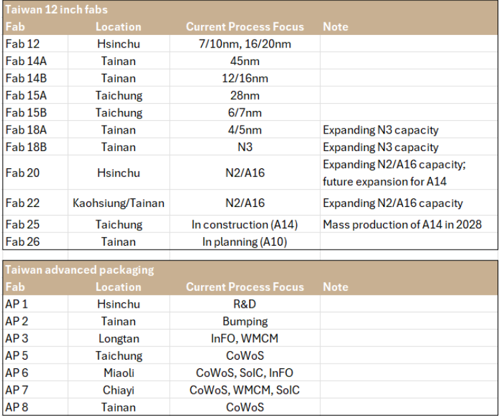
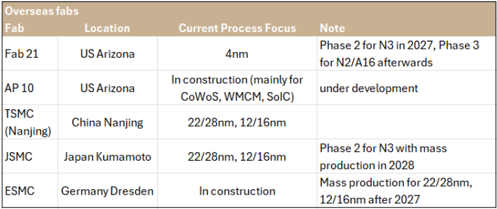
TSMC continues accelerating global capacity expansion across Taiwan, Arizona and Japan while reallocating existing fabs from N5 to N3 and from N3 toward N2 to reflect changing customer demand. We expect N3 capacity is expected to reach 170k wafers/month during 2026 and surpass 200k by 2028, while N2/A16 capacity could grow from approximately 80kwpm to 150kwpm in 2028. And A14 will start contribution firstly in 2028 with initial capacity at 50kwpm by our estimate. This aggressive expansion is supported by rising capex, which we expect projects could approach US$75-80bn annually in 2027-2028, following around US$55-56bn in 2026. We believe this capacity roadmap not only accommodates accelerating AI demand but also reinforces TSMC's pricing power and long-term technology leadership across both foundry and advanced packaging.
Figure 4. TSMC - capex trend and capex intensity
© 2026 Citigroup Inc. No redistribution without Citigroup's written permission. Source: Citi Research
packaging tracilities
Taiwan 12 inch fabs
Fab
Fab 12
Fab 14A
Fab 14B
Fab 15A
Fab 15B
Fab 18A
Fab 18B
Fab 20
Fab 22
Fab 25
Fab 26
Taiwan advanced packaging
Fab
AP 1
AP 2
AP 3
AP 5
AP 6
AP 7
AP 8
@ 2026 Citioroun Ine No redistribution without Citioroun's written nermission
Tainan
Tainan
Taichung
Taichung
Tainan
Tainan
7/10nm, 16/20nm
45nm
12/16nm
28nm
6/7nm
4/5nm
N3
Note
Expanding N3 capacity
Expanding N3 capacity packaging facilities
Overseas fabs
Fab
Fab 21
Figure 5. TSMC - Taiwan 12 inch fabs and advanced packaging facilities Expanding N2/A16 capacity
Location
US Arizona
Current Process Focus
4nm
Phase 2 for N3 in 2027, Phase 3
for N2/A16 afterwards
Figure 6. TSMC - overseas 12 inch fabs and advanced packaging facilities
China Nanjing
Japan Kumamoto
Germany Dresden
22/28nm, 12/16nm
22/28nm, 12/16nm
In construction
Phase 2 for N3 with mass production in 2028
Mass production for 22/28nm,
12/16nm after 2027
M 2026 Citioroun Ine No redistribution without Citioroun's written nermission
© 2026 Citigroup Inc. No redistribution without Citigroup's written permission.
Source: Citi Research
© 2026 Citigroup Inc. No redistribution without Citigroup's written permission.
Source: Citi Research
Reiterate Buy with NT NT$3,800
On the back of solid visibility in the longer term, we raise our 2027/2028 earnings estimates by 13%/21% and lift our TP of TSMC to NT$3,800 (25x of our 2027 EPS estimate, with unchanged PER but move to 2027). AI infrastructure investment remains the key driver behind TSMC's multi-year growth outlook. We think there is a higher likelihood for TSMC to further lift its revenue growth target for 2026 and long-term revenue CAGR given sustained leading-edge demand and improving visibility in the longer term. GM should continue to be resilient thanks to high UTR and efficiency despite rising depreciation and N2 dilution. We see demand extending well beyond GPUs, custom ASICs, TPUs, networking silicon and optical interconnects, and upside from CPU. These all supports broad-based utilization across advanced nodes. We also see wafer pricing trending up into next year on the back of strong N2 and N3 demand.
TSMC
Prepared for Kevin Lu
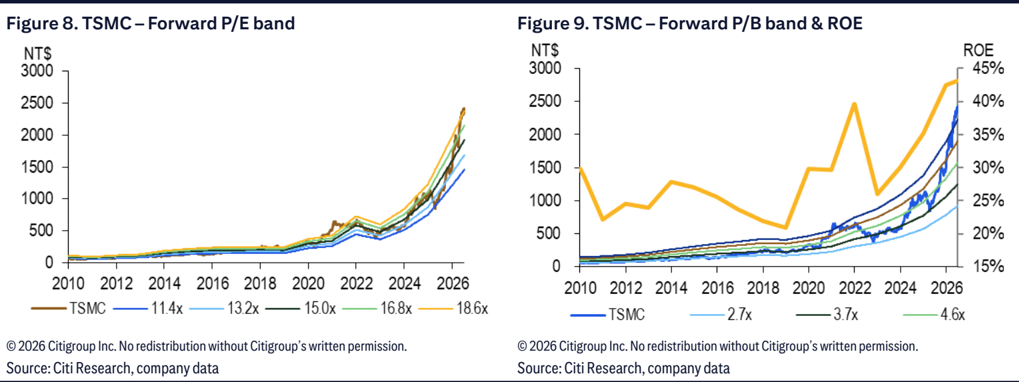
Figure o. loMe - Forward P/E band
NT$
3000
2500
2000
1500
1000 -
500 -
0
+
2010
2012
- TSMC -
2014
— 11.4x
2016 2018
2020
2022
13.2x — 15.0x
2024
16.8x
@ 2026 Citioroun Ine No redistribution without Citioroun' s written nermission
Prepared for Kevin Lu
Figure y. IsMe - Forward P/D band & RUt
NT$
3000
2500
2000
1500
1000
Figure 7. TSMC - Estimates Revisions
| 2026E | 2026E | 2026E | 2027E | 2027E | 2027E | 2028E | 2028E | 2028E | |
|---|---|---|---|---|---|---|---|---|---|
| (NT$mn) | New | Old | Chg. | New | Old | Chg. | New | Old | Chg. |
| Sales | 5,494,192 | 5,253,452 | 4.6% | 7,599,082 | 7,071,349 | 7.5%10,069,949 | 8,762,189 | 14.9% | |
| YoYgrowth | 44.2% | 37.9% | 38.3% | 34.6% | 32.5% | 23.9% | |||
| Gross profit | 3,689,713 | 3,442,282 | 7.2% | 5,136,615 | 4,566,254 | 12.5% | 6,833,525 | 5,686,467 | 20.2% |
| Opex | 478,431 | 457,375 | 4.6% | 665,749 | 619,541 | 7.5% | 883,046 | 768,263 | 14.9% |
| Operating profit | 3,211,282 | 2,984,907 | 7.6% | 4,470,866 | 3,946,713 | 13.3% | 5,950,480 | 4,918,205 | 21.0% |
| Pre-tax profit | 3,340,143 | 3,111,959 | 7.3% | 4,683,755 | 4,144,285 | 13.0% | 6,251,579 | 5,179,068 | 20.7% |
| Net income | 2,752,835 | 2,563,456 | 7.4% | 3,855,921 | 3,410,850 | 13.0% | 5,145,557 | 4,263,281 | 20.7% |
| EPS(NT$) | 106.15 | 98.85 | 7.4% | 148.69 | 131.52 | 13.0% | 198.42 | 164.39 | 20.7% |
| Gross margin | 67.2% | 65.5% | +1.6 ppt | 67.6% | 64.6% | +3.0 ppt | 67.9% | 64.9% | +3.0 ppt |
| Opexratio | 8.7% | 8.7% | +0.0ppt | 8.8% | 8.8% | -0.0 ppt | 8.8% | 8.8% | +0.0ppt |
| Operating margin | 58.4% | 56.8% | +1.6 ppt | 58.8% | 55.8% | +3.0 ppt | 59.1% | 56.1% | +3.0 ppt |
| Net margin | 50.1% | 48.8% | +1.3 ppt | 50.7% | 48.2% | +2.5 ppt | 51.1% | 48.7% | +2.4 ppt |
© 2026 Citigroup Inc. No redistribution without Citigroup's written permission.
Source: Citi Research
ROE
45%
35%
30%
25%
20%
Figure 10. 15MC - Forecast Summary
2025
20
933.8
-386.4
547.4
-84.5
-23.2
-61.3
463.4
Unit: NT$bn
Revenue
COGS
Gross Profit
Operating Expense
SG&A expenses
R&D expenses
EBIT
Net Interest Income
-85.2
493.4
-28.6
407.1
19.8
20.3
30
989.9
-401.4
588.5
-87.8
-24.0
-63.7
21.3
500.7
Figure 10. TSMC - Forecast Summary
Pre Tax Profit
Tax Expense/(Credit)
Net Profit
EPS (NT$)
Margins (%)
Gross Margin
Operating Margin
Net Margin
Sequential Growth (%)
Revenue
Gross Profit
EBIT
Net Profit
EPS
Prepared for Kevin Lu
2027
2QE
1,878.8
-628.1
1,250.7
-165.3
-52.6
-112.7
1,085.4
30E
1,943.0
-608.7
1,334.3
-172.9
-52.5
-120.5
1,161.4
45.2
10.2
4QE
1,958.4
-629.7
1,328.7
-176.3
-49.0
-127.3
1,152.4
49.9
10.3
1Q
1,134.1
-382.8
751.3
-94.0
-26.2
-67.8
659.0
23.8
5.1
2026
20E
1,239.6
-407.5
832.2
-111.6
-34.7
-76.9
720.6
22.9
6.7
3QE
1,454.4
-473.8
980.6
-132.9
-39.3
-93.7
847.7
25.3
7.8
4QE
1,666.0
-540.4
1,125.7
-141.6
-41.7
-100.0
984.0
28.5
8.8
10E
1,818.8
-595.9
1,222.9
- 151.2
-42.1
-109.1
1,071.7
36.4
9.6
2025
3,809.1
-1,527.8
2,281.3
-345.2
-99.2
-246.4
1,936.1
86.2
19.4
2026E
5,494.2
-1,804.5
3,689.7
-478.4
-141.9
-338.2
3,211.3
100.5
28.4
2027E
7,599.1
-2,462.5
5,136.6
-665.7
-196.1
-469.6
4,470.9
172.9
40.0
2028E
6,833.5
-883.0
-260.3
-622.8
5,950.5
248.7
52.3
| 687.8 115.0 750.2 150.0 | 687.8 115.0 750.2 150.0 | 687.8 115.0 750.2 150.0 | 687.8 115.0 750.2 150.0 | 1,021.4 173.6 1,117.6 190.0 | 1,021.4 173.6 1,117.6 190.0 | 1,021.4 173.6 1,117.6 190.0 | 1,021.4 173.6 1,117.6 190.0 | 1,212.6 206.1 2,041.7 -326.3 | 1,212.6 206.1 2,041.7 -326.3 | 1,212.6 206.1 2,041.7 -326.3 | 1,212.6 206.1 2,041.7 -326.3 | 1,216.8 206.9 3,340.1 -588.4 4,683.8 -830.3 | 1,216.8 206.9 3,340.1 -588.4 4,683.8 -830.3 | 1,216.8 206.9 3,340.1 -588.4 4,683.8 -830.3 | 1,216.8 206.9 3,340.1 -588.4 4,683.8 -830.3 | |
|---|---|---|---|---|---|---|---|---|---|---|---|---|---|---|---|---|
| 70.2 361.6 | 95.5 398.3 | 73.6 452.3 | 572.5 | 600.6 | 149.7 731.5 | 848.3 928.2 | 1,010.6 | 1,007.1 | 1,717.9 | 2,752.8 | 3,855.9 | 6,251.6 -1,109.4 5,145.6 | ||||
| 13.94 | 15.36 | 17.44 | 22.08 | 23.16 | 28.21 | 32.71 | 35.79 | 35.09 | 38.97 | 38.84 | 66.24 | 106.15 | 148.69 | 198.42 | ||
| 58.8 | 58.6 | 59.5 | 62.3 | 66.2 | 67.1 | 67.4 | 67.6 | 67.2 | 66.6 | 68.7 | 67.8 | 59.9 | 67.2 | 67.6 | 67.9 | |
| 48.5 | 49.6 | 50.6 | 54.0 | 58.1 | 58.1 | 58.3 | 59.1 | 58.9 | 57.8 | 59.8 | 58.8 | 50.8 | 58.4 | 58.8 | 59.1 | |
| 43.1 | 42.7 | 45.7 | 48.3 | 50.5 | 48.4 | 50.3 | 50.9 | 51.0 | 48.4 | 52.0 | 51.4 | 45.1 | 50.1 | 50.7 | 51.1 | |
| -3 | 11 | 6 | 6 | 8 | 9 | 17 | 15 | 3 | 3 | 32 | 44 | 38 | 33 | |||
| -4 | 11 | 11 | 11 | 18 | 15 | 2 | 7 | 40 | 62 | 39 | 33 | |||||
| -4 | 14 | 8 | 13 | 18 | 16 | 1 | 7 | -1 | 46 | 66 | 39 | 33 | ||||
| -4 | 10 | 14 | 12 | 13 | 5 | 22 | 16 | -2 | 11 | 46 | 60 | 40 | 33 | |||
| -4 | 10 | 14 | 12 | 13 | 22 | 16 | -2 | 11 | 0 | 46 | 60 | 40 | 33 | |||
| @ 2026 Citioroun Inc No redistribution without Citioroun's written nermission. |
© 2026 Citigroup Inc. No redistribution without Citigroup's written permission.
Source: Citi Research, company data
-56.5
4Q
Prepared for Kevin Lu
Adding Upside 30-Day Catalyst Watch on TSMC (2330.TW)
Direction:
Upside
Duration:
Within 30 Days Earnings
Catalyst:
TSMC will host 2Q26 analyst meeting on July 16. We open a 30-day upside catalyst watch as we expect the company to further lift its revenue growth target for 2026 and long term revenue CAGR given sustained leading-edge demand and improving visibility in the longer term.
NT$
4,002
3,335
2,668
2,001
1,334
667
Jul 25
° Higher-than-expected utilization
• Bull case TP to be based on its upcycle valuation of 27x PER
NT$ 2,200.00
• 10% Downside
4 64% Upside
NT$ 3,800.00
• 55% Upside
Bull/Bear: TSMC (2330.TW)
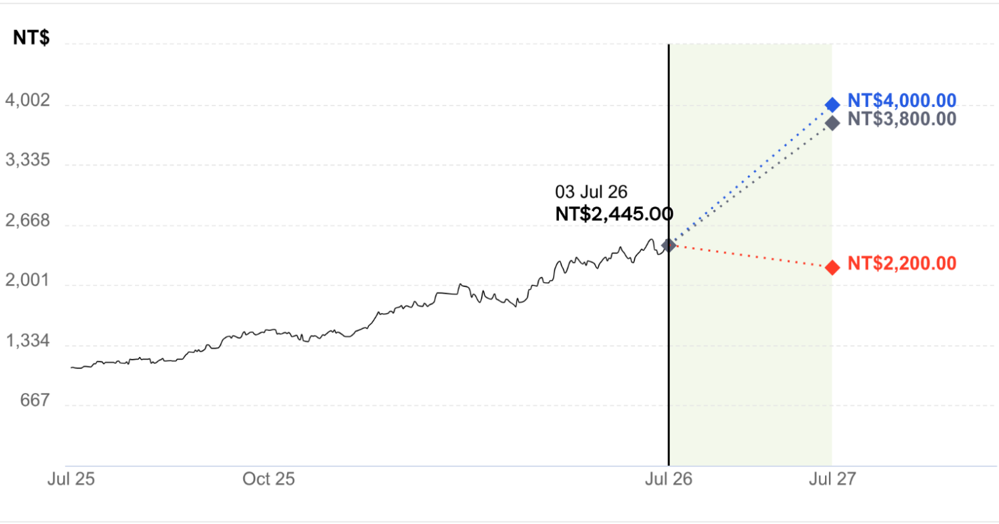
BASE Assumptions
- Solid sales CAGR of >35% in 2025-2028E
- GPM to be maintained above 60% level
- BEAR Assumptions
• Weaker-than-expected HPC demand globally
- Worse-than-expected margin contraction
• Bear case TP to be based on its valuation of 15x PER
Prepared for Kevin Lu
Prepared for Kevin Lu
TSMC
Company description
TSMC is the founder and leader of the dedicated IC foundry segment. The company has built its reputation by offering advanced and "more-thanMoore" wafer production processes and unparalleled manufacturing efficiency. From its inception in 1987, TSMC has consistently offered the foundry segment's leading technologies and TSMC-compatible design services.
Investment strategy
We rate TSMC shares as Buy. We expect TSMC to deliver sales growth of >35% in recent years thanks to strong growth from HPC/AI as well as stable demand growth from smartphone, IoT, and automotive on tech migration and a shortened replacment cycle. CPU outsourcing to TSMC offers further growth upside potential. A rising cash dividend should also support the share price. While TSMC has been increasing capex meaningfully since 2009, its cost structure is maintained through continuous product mix improvements, efficiency enhancements, and cost reductions.
Valuation
Our target price for TSMC shares of NT$3,800 is based on 25x the average of our 2027E EPS, higher than its three-year average forward PER, versus global peers' average of 15-23x. We believe our PER target is justified by TSMC's leading position in advanced process node and robust AI demand growth outlook. Given its continuing leadership in the semiconductor foundry industry, we believe TSMC's stable order visibility and earnings outlook make it less vulnerable than peers to a potential global economic downturn. Our target price equates to 2026E/27E P/E of 36x/25x and 2026E/27E P/B of 13x/10x.
Risks
Key downside risks that could impede the shares from achieving our target price include: 1) weakness in the global semiconductor market; 2) largerthan-expected margin contractions due to depreciation cost hikes and strong NTD; 3) competitors entering the foundry business; 4) longer-than-expected digestion of inventory in the supply chain; and 5) a slowdown in demand either from a global economic downturn or a global trade disruption triggered by tariffs.
Analyst: Laura (Chia Yi) Chen
Prepared for Kevin Lu
TWD
2,000
1,000
If you are visually impaired and would like to speak to a Citi representative regarding the details of the graphics in this document, please call USA 1-888-500-5008 (TTY: 711), from outside the US +1-210-677-3788 JF M AM JJ A SON DIFMAM/JAS
Date
Appendix A-1
3718-Jan-2410:40:18
*740.00
588.00
1/
1009-Apr-25 07:55:10
*950.00
819.00