PDF 原檔:報告_Citi_京元電2449_20260807_original.pdf
圖片清單(已驗證 2026-08-10)
| 檔名 | size | 分類 | 親眼所見內容 |
|---|---|---|---|
報告_Citi_京元電2449_20260807_002.png |
160KB | 真資料圖 | Figure 3(左)KYEC Forward P/E band 走勢圖(Jan-12~Aug-26,0.4x-28.0x 倍數帶);Figure 4(右)Forward P/B band & ROE(右軸),同期間 |
報告_Citi_京元電2449_20260807_003.png |
106KB | 真資料圖 | Bull/Bear 情境圖:股價走勢疊加三個目標價點位 NT$400(Bull +65%)/NT$342(Base TP +41%)/NT$220(Bear -9.1%),標示 07 Aug 26 收盤 NT$242 |
報告_Citi_京元電2449_20260807_004.png |
219KB | 真資料圖 | 上圖:評等與目標價沿革(Ratings and Target Price History,2024-10~2026-08,8 次變動標記,最新 2026-07-29 TP NT$381、Buy);下圖:Short-Term View/Catalyst Watch 標記(CW/STV)與股價走勢 |
_001.png(30KB)<40KB 未逐張驗證,預設 logo/裝飾,未列入。
原始內容
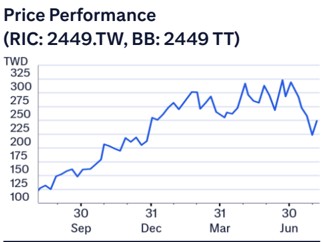
(RIC: 2449.1W, BB: 2449 11)
TWD
325
300
275
250
225
175
150
125
100
07 Aug 2026 10:43:23 ET │ 14 pages
Sep
Dec
Mar
Jun
King Yuan Electronics Co (2449.TW)
Awaiting stronger momentum in 4Q26
CITI'S TAKE
KYEC's 2Q26 earnings were NT$2.49bn (up 9% QoQ and 15% YoY). While its 2Q26 GM of 39.5% was largely inline with expectation, due to higher opex on new capacity ramping up preparation, OPEX came in higher than estimated. Looking forward, we expect HSD QoQ growth in 3Q26 and stronger momentum in 4Q26 on the back of both GPU and TPU new product ramp. Maintaining Buy but lowering our TP to NT$342.
3Q26E revenue slightly below; more upside potential into 4Q26 -Given the tightness in the upstream, including foundry, memory and advanced packaging, KYEC's new projects ramping up for GPU and TPU would be more backend loaded in 4Q26. We therefore see 3Q26 sequential revenue growth at HSD vs previous expectation of c15%. Nevertheless, the company remains bullish on AI demand into next year and anticipates strong upside for both FT and more importantly, wafer sorting. KYEC also sees structural GM upward trend into next year with its new projects ramping, including GPU, CPUs, Google TPU/CPU; in particular for CPUs, it could be several times 2026 levels.
Upside from wafer sorting into next year -AI products have longer test times, advanced-node complexity and relatively stable production profiles compared with volatile smartphone cycles, supporting structurally higher profitability. Management expects 2027 gross margin to remain above 40%, even with rising labor and depreciation costs. Another major upside into next year is expanding wafer sort/testing other than FT. This represents a stable, recurring testing workload and potentially meaningful incremental earnings leverage.
Capex target unchanged; lower TP but maintain Buy -KYEC maintains its NT$50bn 2026 capex budget, roughly 50% allocated to facilities/cleanrooms and 50% to production and customer-specific test equipment. For overseas expansion, Singapore will remain relatively small and customer-specific, while the U.S. site is targeted to complete infrastructure around end-2027 before meaningful customer ramp thereafter. New opportunities such as CPO/NPO remain largely in R&D rather than near-term mass production; therefore, 2027 growth should remain driven by existing GPU, CPUs, ASIC, wafer-test and burn-in opportunities. We lower our earnings projections by 7%/10%/10% considering longer capacity ramping up process, yet we maintain Buy with a TP of NT$342, still based on a DCF methodology and implying 25x our 2027 EPS estimate.
Earnings Summary
| Year to 31Dec | Net Profit (NT$M) | DilutedEPS (NT$) | EPSgrowth (%) | P/E (x) | P/B (x) | ROE (%) | Yield (%) |
|---|---|---|---|---|---|---|---|
| 2024A | 7,779 | 6.04 | 33.5 | 40.1 | 6.8 | 18.9 | 1.3 |
| 2025A | 11,016 | 8.53 | 41.4 | 28.4 | 5.9 | 23.5 | 1.7 |
| 2026E | 10,812 | 8.38 | -1.8 | 28.9 | 4.8 | 19.4 | 0.4 |
| 2027E | 17,724 | 13.74 | 63.9 | 17.6 | 3.7 | 25.3 | 1.8 |
| 2028E | 26,039 | 20.19 | 46.9 | 12 | 2.8 | 28.3 | 3.6 |
Source: Powered by dataCentral
See Appendix A-1 for Analyst Certification, Important Disclosures and Research Analyst Affiliations.
n Buy
Price (07 Aug 26 13:30)
NT$242.00
Target price
NT$342.00↓
from NT$381.00
Expected share price return
41.3%
Expected dividend yield
0.4%
Expected total return
41.7%
Market Cap
NT$310,700M
US$9,634M
Laura (Chia Yi) Chen AC
+886-2-8726-9090
laura.cy.chen@citi.com
Jack Chen +886-2-8726-9091 jack1.chen@citi.com
Nicholas Lai +886-2-8726-9093 nicholas.lai@citi.com
| 2449.TW: Fiscalyearend31-Dec | Price: NT$242.00; TP: NT$342.00; MarketCap:NT$310,700m; Recomm:Buy | Price: NT$242.00; TP: NT$342.00; MarketCap:NT$310,700m; Recomm:Buy | Price: NT$242.00; TP: NT$342.00; MarketCap:NT$310,700m; Recomm:Buy | Price: NT$242.00; TP: NT$342.00; MarketCap:NT$310,700m; Recomm:Buy | Price: NT$242.00; TP: NT$342.00; MarketCap:NT$310,700m; Recomm:Buy | ||||||
|---|---|---|---|---|---|---|---|---|---|---|---|
| Profit&Loss(NT$m) | 2024 | 2025 | 2026E | 2027E | 2028E | Valuation ratios | 2024 | 2025 | 2026E | 2027E | 2028E |
| Sales revenue | 26,856 | 34,934 | 48,327 | 75,783 | 108,361 | PE(x) | 40.1 | 28.4 | 28.9 | 17.6 | 12.0 |
| Cost of sales | -17,512 | -22,411 | -29,154 | -45,228 | -63,992 | PB(x) | 6.8 | 5.9 | 4.8 | 3.7 | 2.8 |
| Gross profit | 9,344 | 12,522 | 19,173 | 30,555 | 44,369 | EV/EBITDA(x) | 26.3 | 19.9 | 14.3 | 9.0 | 6.2 |
| Gross Margin (%) | 34.8 | 35.8 | 39.7 | 40.3 | 40.9 | FCFyield (%) | -3.4 | 3.5 | -8.1 | -6.2 | -1.3 |
| EBITDA(Adj) | 12,037 | 15,867 | 22,901 | 38,781 | 57,899 | Dividend yield (%) | 1.3 | 1.7 | 0.4 | 1.8 | 3.6 |
| EBITDAMargin(Adj) (%) | 44.8 | 45.4 | 47.4 | 51.2 | 53.4 | Payout ratio (%) | 53 | 47 | 12 | 32 | 43 |
| Depreciation | -5,865 | -6,864 | -9,744 | -16,834 | -25,461 | ROE(%) | 18.9 | 23.5 | 19.4 | 25.3 | 28.3 |
| Amortisation | 0 | 0 | 0 | 0 | 0 | Cashflow(NT$m) | 2024 | 2025 | 2026E | 2027E | 2028E |
| EBIT (Adj) | 6,172 | 9,003 | 13,157 | 21,947 | 32,438 | EBITDA | 12,037 | 15,867 | 22,901 | 38,781 | 57,899 |
| EBIT Margin (Adj) (%) | 23.0 | 25.8 | 27.2 | 29.0 | 29.9 | Working capital | 1,439 | -1,172 | -5,539 | -7,210 | -9,710 |
| Net interest | -362 | 188 | 98 | 98 | 98 | Other | -9,191 | 28,516 | 5,141 | 6,628 | 8,141 |
| Associates | 142 | 620 | 124 | 124 | 124 | Operating cashflow | 4,286 | 43,211 | 22,503 | 38,199 | 56,330 |
| Non-Op/Except/Other Adj | 20 | 819 | 281 | 216 | 216 | Capex | -14,857 | -32,355 | -47,884 | -57,400 | -60,270 |
| Pre-tax profit | 5,972 | 10,629 | 13,661 | 22,385 | 32,876 | Net acq/disposals | 279 | -2,080 | 480 | 0 | 0 |
| Tax | -1,211 | -2,624 | -2,841 | -4,645 | -6,821 | Other | 0 | 0 | 0 | 0 | 0 |
| Extraord./Min.Int./Pref.div. | 3,019 | 3,011 | -8 | -16 | -16 | Investing cashflow | -14,578 | -34,436 | -47,404 | -57,400 | -60,270 |
| Reported net profit | 7,779 | 11,016 | 10,812 | 17,724 | 26,039 | Dividends paid | -3,913 | -4,891 | -1,223 | -5,406 | -10,635 |
| Net Margin (%) | 29.0 | 31.5 | 22.4 | 23.4 | 24.0 | Financing cashflow | -1,915 | 7,450 | 16,877 | 16,619 | 13,494 |
| CoreNPAT | 7,779 | 11,016 | 10,812 | 17,724 | 26,039 | Net change in cash | -12,206 | 16,226 | -8,024 | -2,582 | 9,554 |
| Per share data | 2024 | 2025 | 2026E | 2027E | 2028E | Free cashflow to s/holders | -10,571 | 10,856 | -25,381 | -19,201 | -3,940 |
| Reported EPS($) | 6.04 | 8.53 | 8.38 | 13.74 | 20.19 | ||||||
| Core EPS($) | 6.04 | 8.53 | 8.38 | 13.74 | 20.19 | ||||||
| DPS($) | 3.20 | 4.00 | 1.00 | 4.42 | 8.70 | ||||||
| CFPS($) | 3.33 | 33.47 | 17.45 | 29.61 | 43.67 | ||||||
| FCFPS($) | -8.20 | 8.41 | -19.68 | -14.89 | -3.05 | ||||||
| BVPS($) | 35.41 | 41.24 | 50.08 | 64.58 | 85.88 | ||||||
| Wtdavgordshares(m) | 1,284 | 1,284 | 1,284 | 1,284 | 1,284 | ||||||
| Wtdavgdiluted shares (m) | 1,289 | 1,291 | 1,290 | 1,290 | 1,290 | ||||||
| Growthrates | 2024 | 2025 | 2026E | 2027E | 2028E | ||||||
| Sales revenue (%) | -18.7 | 30.1 | 38.3 | 56.8 | 43.0 | ||||||
| EBIT (Adj) (%) | -16.2 | 45.9 | 46.2 | 66.8 | 47.8 | ||||||
| CoreNPAT(%) | 33.2 | 41.6 | -1.9 | 63.9 | 46.9 | ||||||
| CoreEPS(%) | 33.5 | 41.4 | -1.8 | 63.9 | 46.9 | ||||||
| BalanceSheet(NT$m) | 2024 | 2025 | 2026E | 2027E | 2028E | ||||||
| Cash&cashequiv. | 10,329 | 17,964 | 9,924 | 7,342 | 16,896 | ||||||
| Accounts receivables | 6,032 | 7,203 | 12,742 | 19,953 | 29,662 | ||||||
| Inventory | 848 | 1,159 | 1,955 | 2,973 | 4,320 | ||||||
| Net fixed &other tangibles Goodwill &intangibles | 35,271 1,053 | 61,034 2,809 | 97,751 2,809 | 136,690 2,809 | 169,038 2,809 | ||||||
| assets | 33,178 | ||||||||||
| Financial &other | 11,010 | 15,929 | 21,797 | 29,699 | |||||||
| Total assets Accounts | 86,711 942 | 101,178 909 | 141,110 | 191,563 | 252,424 3,814 | ||||||
| payable | 1,641 | 2,576 | |||||||||
| Long-term debt | 20,581 | 62,971 | 76,465 | ||||||||
| 30,275 | 46,352 | 46,218 | 66,292 | ||||||||
| Provisions &other liab | 20,476 41,999 | 19,556 50,740 | 31,060 | ||||||||
| Total liabilities | 79,853 | 112,565 | 147,371 | ||||||||
| Minority interests | 1,415 | 8 | 16 | 32 | |||||||
| Total equity | 44,711 | 50,438 | 61,257 | 78,998 | 48 105,053 | ||||||
| 10,251 | 12,311 | 37,228 | 56,429 | 60,369 | |||||||
| Net debt (Adj) | |||||||||||
| Net debt to equity (Adj) (%) | 22.9 | 24.4 | |||||||||
| For definitions of the items in this table, | please click here. | 60.8 | 71.4 | 57.5 |
Figure 1. KYEC - 2026 results overview
2Q26
4,400
39.5%
2,828
25.4%
2,492
1.93
1Q26
(NT$mn)
Revenue
Gross profit
Gross margin
Op. profit
OP margin
Net income
EPS (NTS)
4,051
39.7%
2,772
27.2%
2,286
1.77
9%
-0.3ppt
2%
-1.8 ppt
9%
9%
2Q25
2,972
35.5%
2,176
26.0%
2,175
1.68
Y/Y
33%
48%
+4.0 ppt
30%
- 0.6 ppt
15%
15%
@ 2026 Citionun Inc No redistribution without Citigroun's written nermission
2026
Citi
11,424
4,456
39.0%
3,142
27.5%
2,657
2.16
Diff.
-2%
-1%
+0.5 ppt
-10%
-2.1 ppt
-6%
-11%
Diff.
-1%
+0.0 ppt
-12%
-3.1 ppt
-6%
2.08
-7%
Figure 1. KYEC - 2Q26 results overview
© 2026 Citigroup Inc. No redistribution without Citigroup's written permission.
Source: Citi Research, Bloomberg, Company Reports
Lower TP but maintain Buy -We lower our earnings projections by 7%/10%/10% considering longer capacity ramping up process, yet we maintain Buy with a TP of NT$342, still based on a DCF methodology and implying 25x our 2027 EPS estimate.
Figure 2. KYEC - Estimates Revisions
| 2026E | 2026E | 2026E | 2027E | 2027E | 2027E | 2028E | 2028E | 2028E | |
|---|---|---|---|---|---|---|---|---|---|
| (NT$mn) | New | Old | Chg. | New | Old | Chg. | New | Old | Chg. |
| Sales | 48,327 | 51,231 | -6% | 75,783 | 81,518 | -7% | 108,361 | 118,639 | -9% |
| YoYgrowth | 38% | 47% | 57% | 59% | 43% | 46% | |||
| Gross profit | 19,173 | 20,210 | -5% | 30,555 | 32,635 | -6% | 44,369 | 48,237 | -8% |
| Opex | -6,016 | -5,932 | 1% | -8,608 | -8,272 | 4% | -11,931 | -12,166 | -2% |
| Operating profit | 13,157 | 14,278 | -8% | 21,947 | 24,362 | -10% | 32,438 | 36,071 | -10% |
| Pre-tax profit | 13,661 | 14,643 | -7% | 22,385 | 24,800 | -10% | 32,876 | 36,509 | -10% |
| Net income | 10,812 | 11,607 | -7% | 17,724 | 19,671 | -10% | 26,039 | 28,990 | -10% |
| EPS(NT$) | 8.38 | 9.00 | -7% | 13.74 | 15.25 | -10% | 20.19 | 22.47 | -10% |
| Gross margin | 39.7% | 39.4% | +0.2 ppt | 40.3% | 40.0% | +0.3 ppt | 40.9% | 40.7% | +0.3 ppt |
| Opexratio | -12.4% | -11.6% | -0.9 ppt | -11.4% | -10.1% | -1.2 ppt | -11.0% | -10.3% | -0.8 ppt |
| Operating margin | 27.2% | 27.9% | -0.6 ppt | 29.0% | 29.9% | -0.9 ppt | 29.9% | 30.4% | -0.5 ppt |
| Net margin | 22.4% | 22.7% | -0.3 ppt | 23.4% | 24.1% | -0.7 ppt | 24.0% | 24.4% | -0.4 ppt |
© 2026 Citigroup Inc. No redistribution without Citigroup's written permission.
Source: Citi Research
2Q26
Cons.
11,231
4,431
39.5%
3,201
28.5%
2,659
Figure 3. KYEC- Forward P/E band
Figure S. KyEC- Forecast summary
KYEC
NTS
350
Revenue
300
COGS
Depreciation costs
Gross Profit
250
Operating Expense
SG&A expenses
200
R&D expenses
EBIT
150
Net Interest Income
100
Net Other Income
Pre-Tax Profit
50
Tax
Net Profit
EPS (NTS)
Margins (%)
Gross Margin
Operating Margin
Net Margin
© 2026 Citigroup Inc. No redistribution without Citigroup's written permission.
Sequential Growth (%)
Revenue
Gross Profit
EBIT
Net Profit
EPS
© 2026 Citigroun Inc. No redistribution without Citjgroup's written permission.
2025
-1,621
2,972
-795
-583
-212
2,176
-1,506
2,450
-928
-685
-243
1,523
-1,995
3,753
-942
-684
-258
2,812
-1,742
3,347
-855
-637
-218
2,492
2026
2Q
11,142
-6,742
-2,272
4,400
-1,572
-1,160
-412
2,828
1Q
10,192
-6,141
-2,267
4,051
-1,279
-973
-306
2,772
Figure 4. KYEC- Forward P/B band & ROE
NIS
2027
3QE
350
12,102
-7,353
-2,416
4,749
-1,452
-1,089
-363
3,297
4QE
14,892
-8,919
300
-2,789
250
200
5,973
-1,713
-1,191
150
100
25%
2028E
-25,461
44,369
-11.931
15%
-8,516
-3.416
32,438
10%
-521
4,261
1QE
15,778
-9,415
-3,752
6,364
-1,736
-1,262
-473
4,628
3QE
19,680
-11,816
-4,279
7,863
-2,263
-1,673
-590
5,600
4QE
22,933
-13,597
-4,721
9,336
-2,523
-1,835-
-688
6,813
2025
34,934
-22,411
-6,864
12,522
-3,520
-2,590
-930
9,003
2026E
48,327
-29,154
-9,744
19,173
-6,016
-4.413
-1,602
13,157
2027E
75,783
-45,228
-16,834
30,555
-8,608
-6,335
-2.274
21,947
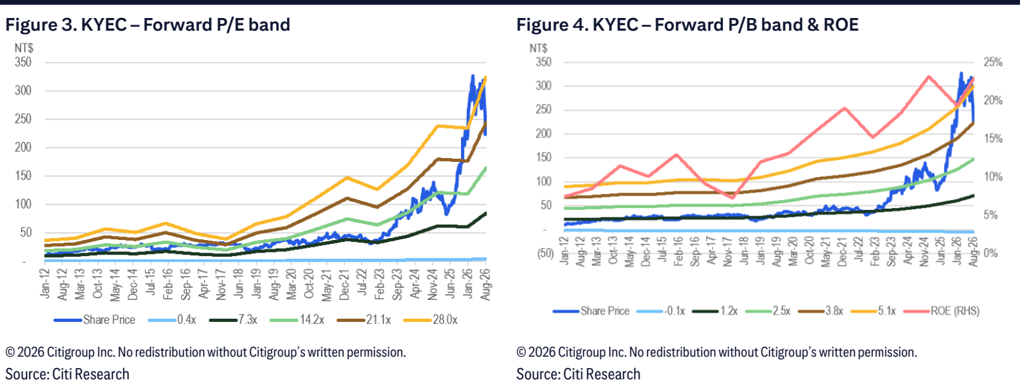
Figure 5. KYEC - Forecast summary
© 2026 Citigroup Inc. No redistribution without Citigroup's written permission.
Source: Citi Research
2QE
— Share Price
NT$
402
335
268
201
134
67
Aug 25
4 65% Upside
NT$ 342.00
A 41% Upside
NT$ 220.00
· 9.1% Downside
Bull/Bear: King Yuan Electronics Co (2449.TW)
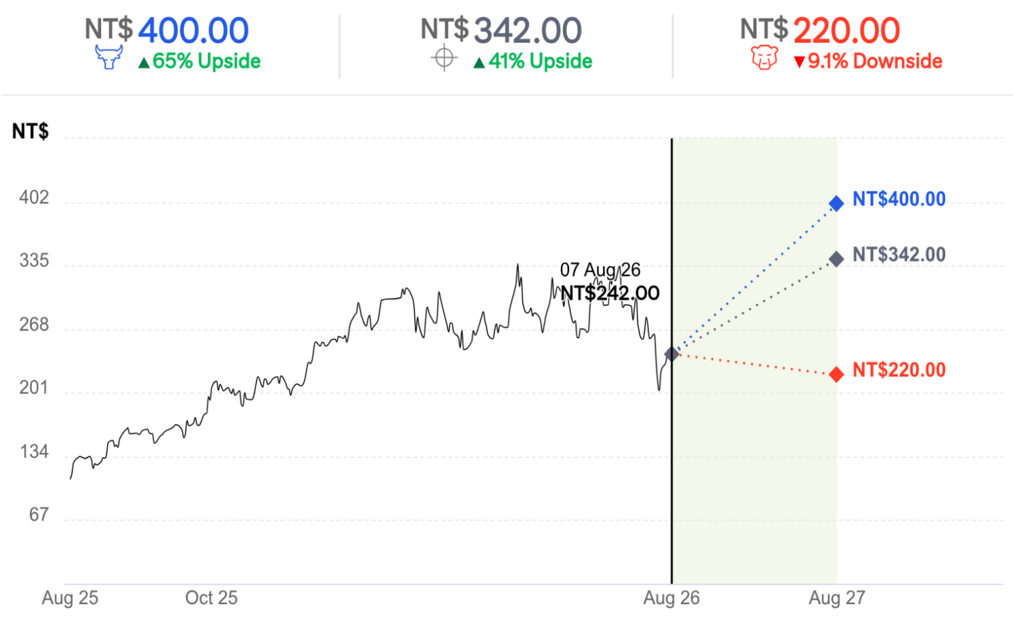
BASE Assumptions
• Smooth products transition schedule for Al GPU and ASIC
- Ongoing GM expansion from 2024's 35% to 40% in 2027-2028E
BEAR Assumptions
• Weaker than expected end-demand for global smartphone/consumer electronic products
- Pricing pressure from increasing competition
King Yuan Electronics Co
Company description
Founded in 1987, King Yuan Electronics Corp. (KYEC) mainly provides testing services for the back-end process of semiconductor production globally. With more than 30 years of industry experience, KYEC has built up firm relationships with several leading global IC design/IDM customers. Its headquarters and production facilities are both located in Taiwan, with sales offices in North America, Japan, and Singapore.
Investment strategy
We rate KYEC as Buy. As a key testing service provider for AI GPU and ASIC products, KYEC is well positioned to benefit from the significant AI growth opportunity in the years to come. Currently, KYEC is the major final testing service provider for its major customer's AI GPU, and we expect KYEC to continue to secure its dominant share in its customer's upcoming AI GPU product lines due to its specialty in burn-in testing, smooth product delivery capability, and its strong business partnership with its customer. We are also positive over the growth outlook of its smartphone business thanks to the integration of AI functionality, leading to a better replacement cycle. We believe KYEC's major customer in smartphone will benefit from an improved product mix, which will result in longer testing times for the flagship SoC.
Valuation
Our target price for KYEC of NT$342 is derived using a DCF methodology. Using Bloomberg data, we apply a risk-free rate of 4%, a risk premium of 5%, and a beta of 1.4x for a 10.8% cost of equity. With 20% corporate tax and a 3.0% interest rate on its debt, our WACC for KYEC is 9.7%. We assume terminal sales growth of 5%. We model its adjusted EBIT margin to gradually improve from 23% in 2024 to c30% in 2035E. At our target price, the shares would trade at 2026/27E P/B of 7x/5x and 2026/27E P/E of 41x/25x, in line with its global peers.
Risks
Key downside risks that could prevent KYEC shares from reaching our target price include: 1) weaker-than-expected end-demand for global smartphone/consumer electronic products; 2) slower ramp for AI-related products; 3) slower-than-expected demand recovery in the automotive and base station sector; and 4) pricing pressure on increasing competition.
Analyst: Laura (Chia Yi) Chen
TWD
200
If you are visually impaired and would like to speak to a Citi representative regarding the details of the graphics in this document, please call USA 1-888-500-5008 (TTY: 711), from outside the US +1-210-677-3788
Date
Appendix A-1
[EJ08-Aug-25 12:54:06
*156.19
127.14
[6 J06-Mar-26 09:43:38