PDF 原檔:報告_BofA_Intel台廠影響_20260724_original.pdf
圖片清單(已驗證 2026-07-27)
本份 2 張圖:001(33KB)對應 Exhibit 2「TSMC 與 Intel 電晶體密度比較」、002(79KB)對應 Exhibit 3「TSMC 總資本支出 vs 每千片產能設備支出」。兩張圖的核心結論已於報告文字中敘明(密度差距在 A16/A12 對 18A-P/14A 可能擴大到約 50%/60%;台積電因轉進先進節點,每 1k WPM 擴產花費為以往的 1-2 倍),未逐張 Read、未嵌入 lib。
原始內容
Semiconductors - Asia-Pacific
Intel read through: Limited competition and supply disruption to TSMC ecosystem
Industry Overview
Front-end capacity further skewed to data center CPUs
We profile the takeaways on Intel ' s server CPU forecast and comment on manufacturing progress (see our US analyst Vivek Arya's note ). Intel is aggressively adding supply from late 3Q26 to meet strong double digits YoY growth for server CPU with business visibility extended into ' 28 (vs. ' 27 prior) by shifting the capacity from its client business.
Lifting capex commitment in '26-27 for strong tool pull in
To accelerate its front-end capacity expansion on Intel 3 and 18A for its CPU strength and advanced packaging readiness amid growing customer financial commitment, its capex is raised to US$20bn+ for 2026 (vs. ~US$18bn prior) and would grow significantly higher YoY in ' 27, with tool spending mix higher to +40% YoY in ' 26 (vs. +25% YoY prior). It is locking in tool purchase orders and securing memory/substrate supply.
Front/back-end technology roadmap advancement on track
Intel ' s 18A node saw meaningful output for its Panther Lake and Wildcat Lake client CPUs in 2Q26 with yield improvement ahead of expectations and should see Clearwater Forecast server CPUs ramp. In addition, its derivative 18A-P began risk production in 2Q26 while its 14A PDK 0.9 is on track to be ready for its customers in October and set to risk ramp in 2H27 and mass production in 2028. On the back-end packaging roadmap, the technology achieved targeted yield and reliability metrics and it is seeing a growing order backlog for its EMIB-T technology suitable for advanced AI chipsets.
Implications for the Asia manufacturing supply chain
Intel ' s progress on capacity and technology ramp is consistent with our view of limited competition risk. We estimate its capex hike of US$2-3bn+ if all on equipment buys will allow it to expand 5-7k WPM front-end capacity at max with ~US$400mn/k WPM capex required, lifting its Intel 3 and 18A total capacity to 60k WPM prioritized to its own CPUs (vs. TSMC ' s 400k WPM scale for comparable nodes). On EMIB-T progress, our supply chain feedback suggests Intel faces both yield issues on substrate and the process flow and need to improve the yield to 98%+ by 1H27 to be a qualified CoWoS alternative.
Stocks: prefer TSMC, ASE, Chroma, All Ring
While the market sentiment is muted due to deleveraging and concern on AI investment sustainability, the outlook from the companies across hyperscalers and supply chain reported so far is even more positive on the demand and the related spending outlook. Continued EPS upgrades, combined with undemanding valuations, support a preference for semiconductor names with higher earnings quality (TSMC, ASE, MediaTek) and equipment suppliers (Chroma, All Ring), where share prices have lagged despite ongoing expansion by their foundry and OSAT partners.
This research report provides general information only. No part of this report may be used or reproduced or quoted in any manner whatsoever in Taiwan by the press or other persons without the express written consent of BofA Securities.
>> Employed by a non-US affiliate of BofAS and is not registered/qualified as a research analyst under the FINRA rules.
Refer to "Other Important Disclosures" for information on certain BofA Securities entities that take responsibility for the information herein in particular jurisdictions.
BofA Securities does and seeks to do business with issuers covered in its research reports. As a result, investors should be aware that the firm may have a conflict of interest that could affect the objectivity of this report. Investors should consider this report as only a single factor in making their investment decision. Refer to important disclosures on page 7 to 9. Analyst Certification on page 5. Price
24 July 2026
Equity Asia-Pacific Semiconductors
Haas Liu >> Research Analyst Merrill Lynch (Taiwan) +886 2 2376 3727 haas.liu@bofa.com
Mike Yang >> Research Analyst Merrill Lynch (Taiwan) +886 2 2376 3729 mike.c.yang@bofa.com
Cathy Hsu >> Research Analyst Merrill Lynch (Taiwan) +886 2 2376 3726 cathy.hsu3@bofa.com
CPU: Central Processing Unit
PDK: Process Design Kit
EMIB: Embedded Multi-die Interconnect Bridge
WPM: Wafer per month
CoWoS: Chip-on-Wafer-on-Substrate
OSAT: Outsourced Semiconductor Assembly and Test
Focus charts
Exhibit 1: TSMC/ Intel/Samsung's technology roadmap
TSMC targets to roll out a new node for HPC with biennial cadence, supporting major leaps in performance
| Company | End Market / Segment | 2023 | 2024 | 2025 | 2026 | 2027 | 2028 | 2029 |
|---|---|---|---|---|---|---|---|---|
| TSMC | Data Center | N4P & N4X | N3X & N2 | N2P & A16 | N2X | A12 | ||
| TSMC | High-end consumer/mobile | N3 | N3E | N3P & N2 | N2P | N2U & A14 | A13 | |
| TSMC | Automotive | N5A | N3A | |||||
| TSMC | Mainstream | N4P | N4C | N3C | N2U | |||
| Intel Foundry | Data center and high-end client | 3 | 3 | 3 & 18A | 18A-P | 14A & 14A-E | ||
| Intel Foundry | Mature | 16 | 16-E | Intel/UMC 12 | ||||
| Samsung Foundry | Data Center | SF4P | SF4X | SF2X | SF2Z | |||
| Samsung Foundry | High-end consumer/mobile | SF4P | SF3 | SF2 | SF2P | SF2P+ | SF1.4 | |
| Samsung Foundry | Automotive | SF5A | SF4A | SF2A | ||||
| Samsung Foundry | Mainstream | SF4U |
Source:
BofA Global Research
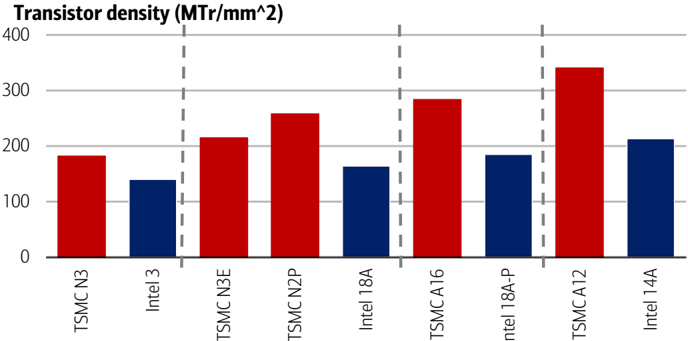
Exhibit 2: TSMC & Intel's transistor density comparison
Transistor density gap could be even widened to ~50%/~60% for TSMC's upcoming A16/A12 nodes when comparing with Intel 18A-P/14A
Source: BofA Global Research
BofA GLOBAL RESEARCH
BofA GLOBAL RESEARCH
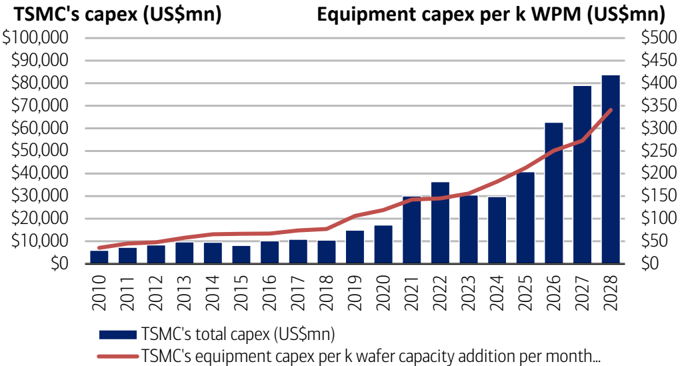
Exhibit 3: TSMC's total Capex vs. equipment spending per k WPM capacity addition
TSMC spend 1-2x more on 1k WPM expansion due to its shift to advanced nodes in recent years
Source: Company Data, BofA Global Research estimates
Exhibit 4: Stocks mentioned
Prices and ratings for stocks mentioned in the report
| BofA Ticker | Bloomberg ticker | Company name | Price | Rating |
|---|---|---|---|---|
| XNQNF | 6187 TT | All Ring | NT$ 1025 | C-1-7 |
| ASX | ASX US | ASE -ADR | US$ 39.46 | C-1-7 |
| XSRIF | 3711 TT | ASE Technology | NT$ 618 | C-1-7 |
| CRMJF | 2360 TT | Chroma ATE | NT$ 2095 | C-1-7 |
| MDTKF | 2454 TT | MediaTek | NT$ 3780 | C-1-7 |
| TSM | TSM US | Taiwan Semi Mfg Co | US$ 415.58 | B-1-7 |
| TSMWF | 2330 TT | Taiwan Semi Mfg Co | NT$ 2355 | B-1-7 |
Source: BofA Global Research
Price objective basis & risk
All Ring (XNQNF)
Our PO of NT$1,500 is based on 36x 2027 P/E, positioned at the upper half of its historical trading range of 8-41x. We believe P/E based valuation is appropriate given All Ring's robust top-line visibility, stable profitability profile, and structural earnings improvement on decent exposure to AI-driven advanced packaging upcycle. The valuation multiple is underpinned by
- 1) 34%/42% CAGR in sales and earnings over 2026-28E and 2) sustained ROE in the 3040% range
Downside risks are:
- 1) slowdown in advanced packaging capacity expansion and 2) mis-execution on equipment development
ASE Technology Holding (XSRIF / ASX)
We value ASE Technology Holding at NT$750 per share (US$48 for ADR), based on 20x 2H27-1H28E P/E, above its historical range of 5-26x, in view of its solidified industry position in AI era. We use P/E ratio to value ASE as the company has been able to maintain healthy profitability through the cycles in the past 20 years due to consolidating industry landscape supporting a more benign supply/demand and keeping pricing and margins less cyclical.
BofA GLOBAL RESEARCH
BofA GLOBAL RESEARCH
Downside risks to our PO are 1) share loss and/or ASP erosion owing to Chinese players' cannibalization and/or ASE's worsening execution, 2) weakening end demand due to uncontrollable matters, such as macro halt and/or geopolitical tensions, 3) regulatory issues that could hinder ASE from generating synergies and benefit its competitors.
Chroma ATE (CRMJF)
Our price objective of NT$3,050 on Chroma is based on 38x 2027E P/E, which is at the top of the company's historical trading range of 12-39x. In our view, the valuation multiple is underpinned by
1) +70% earnings CAGR in 2025-27E supported by +75% sales CAGR growth and GMs/OpMs expanding, 2) ROE expansion to around 35% in 2025-27E, 3) net cash of around NT$21/share, and 4) free cash flow generation of around NT$15/share per annum across 2025-27E.
Downside risks to our price objective are:
- 1) weaker market demand, especially the cloud AI investment moderation, leading to slower infrastructure builds especially in China and dragging the company's revenue growth for its power testing equipment business and operating leverage 2) a more conservative investment cycle from the hyperscalers on further data center deployment due to growing capex could dampen the demand for GPU and ASIC, negatively impacting the testing equipment demand for related chipsets.
- 3) failure to execute on the customized equipment requested by its customers or delay of technology roadmap could lead to an order shift to its competitors.
MediaTek (MDTKF)
Our PO of NT$5,100 is based on 23x 2H27-1H28 P/E. as we are constructive on its broadening ASIC pipeline to drive earnings upgrade cycle and re-rating as it locks in more supply.
Upside risks to our PO are: (1) better than expected smartphone demand, especially in China, (2) a better pricing in mobile communication segment thanks to alleviated competition and rising exposure to high-end/flagship market, and (3) an even more superior investment return on non-op side to uplift its net cash position. (4) Unexpected collaboration with global technology leaders leads to higher than expected margins/profits
Downside risks to our PO are: (1) weaker-than-expected end-market situation in consumer-related smartphone/TV space, (2) macro challenges including inflation/policyrelated pressures, (3) rising competition from existing players and/or newcomers in smartphone/TV SoC (system on chip) space, and (4) ASP/margin pressure caused by each or all of the above and/or rising foundry costs. (4) Bidding process for Meta Inference ASIC is slower than expected.
Taiwan Semiconductor Manufacturing Co. (TSMWF / TSM)
Our PO for TSMC is NT$3,100 per share (US$590 per ADR), based on 20x 2027E P/E. TSMC's valuation has traded in the range of 10-26x PE from 2017. 20x is in the mid to high end of the historical range, above the average P/E of 18x. We think a PE above the average is justified given TSMC's enhanced industry position and mid-40% 5-year CAGR in AI should underpin a rerating
Downside risks to our price objective are: (1) greater-than-expected slowdown in global smartphone/consumer electronics demand, (2) Intel's potential insourcing strategy and ambitions in foundry service, (3) execution risks on advanced nodes, and (4) higher than expected tariffs.