PDF 原檔:260624_全球伺服器_gs_global-server_original.pdf
原始內容
Global Server: Raising both AI and General servers; better mix and higher memory costs drive CSP spending
We raise our global servers TAM to re fl ect the ramp-up of AI server racks, and higher memory costs driving CSP spending. We refresh our forecasts for (1) AI server racks (NVL72-equivalent), (2) AI servers (8-GPU equivalent), (3) General servers, (4) AI servers implied GPU vs. ASIC, and (5) leading US and China cloud capex. We expect AI server rack (NVL72-equivalent) shipment (incl. Nvidia and AMD) to reach 55k/ 105k/ 163k in 2026-28E, increasing by 16% / 20% in 2027 / 28E, re fl ecting our positive view on AI server racks, which carry more intense design and stronger GPU interconnection. On ASIC AI servers, we expect growing ASIC adoption, with ASICs accounting for 50%/ 52%/ 55% of AI chips in 2026-28E (vs. our previous estimates of 43% / 50% / 55% in 2026-28E). Our global AI server volume forecast implies demand for AI chips at 19m/ 27m/ 32m in 2026-28E, which increases from our last update due to our revised outlook on AI server racks (NVL72-equivalent) and AI servers (8-GPU equivalent) across ASIC and GPU base. We forecast a positive demand trend for GPU and ASIC platforms, and new AI servers based on new networking architectures from 2027 which we expect will further enhance the advancement in computing performance. We expect the continuing AI infrastructure cycle to support growth through 2028E.
AI servers: Buy Wiwynn / Wistron (ODM), Hon Hai / FII (ODM), LandMark (Silicon photonics), VPEC (Silicon photonics), AVC / Fositek (liquid cooling), Auras (liquid cooling), King Slide (rail kits), Chenbro (chassis), EMC (CCL), GCE (PCB), Eoptolink (Optical connections), TSMC (foundry; on CL), MPI (probe cards), WinWay (sockets), Aspeed (fabless), and Hon Precision (FT handler).
Allen Chang
+852-2978-2930 | allen.k.chang@gs.com Goldman Sachs (Asia) L.L.C.
Verena Jeng
+852-2978-1681 | verena.jeng@gs.com Goldman Sachs (Asia) L.L.C.
James Schneider, Ph.D.
+1(212)357-2929 | jim.schneider@gs.com Goldman Sachs & Co. LLC
Michael Ng, CFA
+1(212)902-8618 | michael.ng@gs.com Goldman Sachs & Co. LLC
Katherine Murphy
+1(212)902-1151 | katherine.a.murphy@gs.com Goldman Sachs & Co. LLC
Ronald Keung, CFA
+852-2978-0856 | ronald.keung@gs.com Goldman Sachs (Asia) L.L.C.
Giuni Lee
+82(2)3788-1177 | giuni.lee@gs.com Goldman Sachs (Asia) L.L.C., Seoul Branch
Anmol Makkar
+1(212)357-1366 | anmol.makkar@gs.com Goldman Sachs & Co. LLC
Daiki Takayama
+81(3)4587-9870 | daiki.takayama@gs.com Goldman Sachs Japan Co., Ltd.
Ting Song
+852-2978-6466 | ting.song@gs.com Goldman Sachs (Asia) L.L.C.
Yifan Hu
+852-2978-0996 | yifan.hu@gs.com Goldman Sachs (Asia) L.L.C.
Zorayda Montemayor
+1(212)357-6403 | zorayda.montemayor@gs.com Goldman Sachs & Co. LLC
Evelyn Yu
+886(2)2730-4187 | evelyn.yu@gs.com Goldman Sachs (Asia) L.L.C., Taipei Branch
Ryan Huang, CFA
+886(2)2730-4084 | ryan.huang@gs.com Goldman Sachs (Asia) L.L.C., Taipei Branch
Goldman Sachs does and seeks to do business with companies covered in its research reports. As a result, investors should be aware that the fi rm may have a con fl ict of interest that could a ff ect the objectivity of this report. Investors should consider this report as only a single factor in making their investment decision. For Reg AC certi fi cation and other important disclosures, see the Disclosure Appendix, or go to ed as research e92c7a75ab8b4efbba794e6b187208c8
Exhibit 1: AI servers implied GPU vs. ASIC volume
| 2025 | 2026E | 2027E | 2028E | |
|---|---|---|---|---|
| NEW | ||||
| AI server shipment (k units) | ||||
| Rack-level (NVL72) | 19 | 55 | 105 | 163 |
| 8-GPU | 1,178 | 1,858 | 2,403 | 2,558 |
| Implied AI chips | 10,800 | 18,847 | 26,750 | 32,214 |
| YoY | 75% | 42% | 20% | |
| GPU | 6,670 | 9,510 | 12,963 | 14,566 |
| ASIC | 4,130 | 9,337 | 13,787 | 17,649 |
| Mix | ||||
| GPU | 62% | 50% | 48% | 45% |
| ASIC | 38% | 50% | 52% | 55% |
| OLD | ||||
| AI server shipment (k units) | ||||
| Rack-level (NVL72) | 19 | 55 | 90 | 136 |
| 8-GPU | 1,163 | 1,576 | 1,935 | 2,296 |
| Implied AI chips | 10,682 | 16,590 | 21,963 | 28,164 |
| YoY | 55% | 32% | 28% | |
| GPU | 6,670 | 9,447 | 11,050 | 12,576 |
| ASIC | 4,012 | 7,143 | 10,913 | 15,587 |
| Mix | ||||
| GPU | 62% | 57% | 50% | 45% |
| ASIC | 38% | 43% | 50% | 55% |
| CHG | ||||
| AI server shipment (k units) | ||||
| Rack-level (NVL72) | 0% | 0% | 16% | 20% |
| 8-GPU | 1% | 18% | 24% | 11% |
| Implied AI chips | 1% | 14% | 22% | 14% |
| GPU | 0% | 1% | 17% | 16% |
| ASIC | 3% | 31% | 26% | 13% |
Source: Goldman Sachs Global Investment Research
Related reports:
| Global Tech: PCs, smartphones, servers: Quantifying market opportunities (launching Global TAMs on Oct 3, 2023) |
|---|
| Global Tech: Server TAM: Introducing rack-level AI server forecasts (Oct 29, 2024) |
| Global Tech: Server TAMupdates: AI server shipment timeframe recalibrating (Feb 9, 2025) |
| Global Tech: Server TAMupdates: Revising down AI Training Server outlook (Mar 24, 2025) |
| Global Tech: ASIC AI server TAMintroduced; Server TAMupdate and baseboard-based AI servers raised (June 28, 2025) |
| Global Server: 2027E estimates introduced; Raising baseboard-based AI servers with rising ASIC penetration (Sep 27, 2025) |
| Global Server: ASIC servers expanding; AI full racks see diversifying chip platform (Jan 4, 2026) |
| Global Server: Higher mix of rack-level AI servers; Introducing 2028 forecasts (Apr 17, 2026) |
Exhibit 2: Global servers value TAM revisions
| 2026E | 2027E | 2028E | |
|---|---|---|---|
| By product | |||
| NEW | |||
| Global server revenues (US$m) | 604,117 | 849,860 | 1,102,109 |
| General servers | 189,132 | 221,573 | 245,210 |
| AI server racks (NVL72) | 166,673 | 336,140 | 561,402 |
| AI servers (8-GPU) | 248,312 | 292,147 | 295,497 |
| YoY | 74% | 41% | 30% |
| General servers | 28% | 17% | 11% |
| AI server racks (NVL72) | 209% | 102% | 67% |
| AI servers (8-GPU) | 70% | 18% | 1% |
| OLD | |||
| YoY | 45% | 27% | 29% |
| General servers | 15% | 6% | 6% |
| AI server racks (NVL72) | 202% | 74% | 61% |
| AI servers (8-GPU) | 30% | 14% | 16% |
| By vendors | |||
| CHG | |||
| Dell | 26% | 50% | 55% |
| HP | 17% | 29% | 29% |
| Inspur | 12% | 16% | 19% |
| SMCI | -5% | -8% | -13% |
| Lenovo | 10% | 49% | 62% |
| H3C / UNIS | 24% | 38% | 49% |
| Gigabyte | 25% | 40% | 46% |
| Hon Hai | 0% | 16% | 15% |
| Quanta | 17% | 21% | 15% |
| Wiwynn | 0% | 21% | 9% |
Source: Goldman Sachs Global Investment Research
e92c7a75ab8b4efbba794e6b187208c8
Servers: AI server racks +190%/+89%/+56% YoY in 2026-28E; General server volume +14%/ +6%/ +6% YoY in 2026-28E
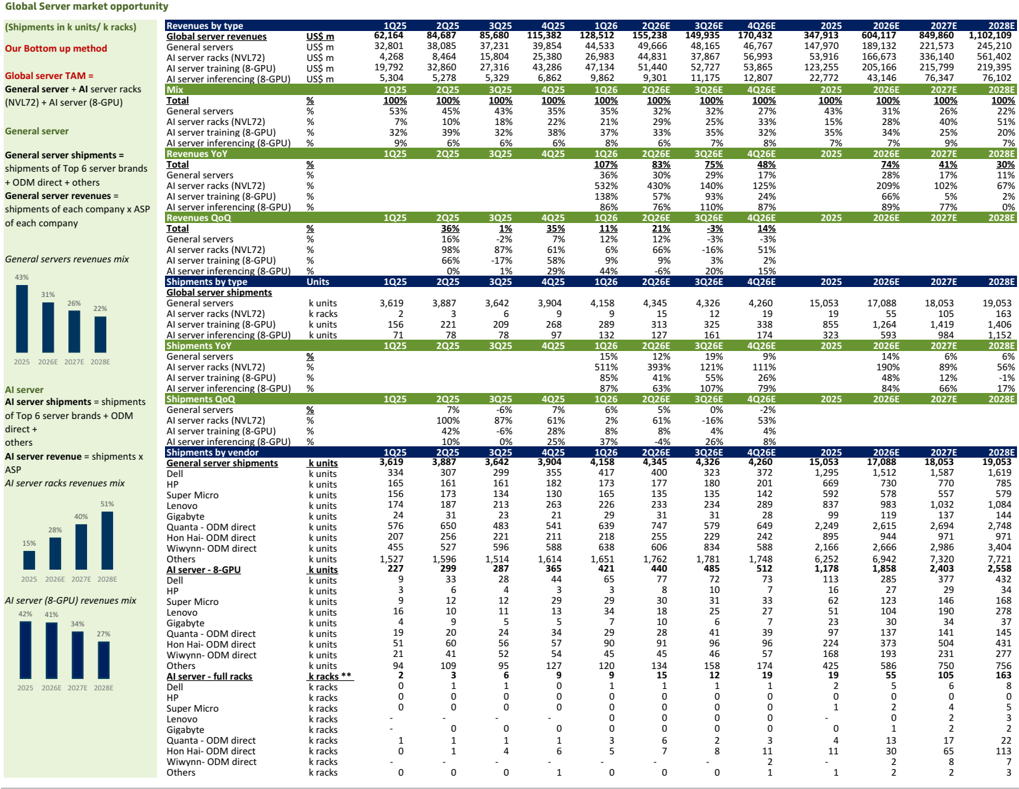
| Global Server market opportunity | Global Server market opportunity | Global Server market opportunity | Global Server market opportunity | Global Server market opportunity | Global Server market opportunity | Global Server market opportunity | Global Server market opportunity | Global Server market opportunity | Global Server market opportunity | Global Server market opportunity | Global Server market opportunity | Global Server market opportunity | Global Server market opportunity | Global Server market opportunity | Global Server market opportunity |
|---|---|---|---|---|---|---|---|---|---|---|---|---|---|---|---|
| (Shipments in k units/ k racks) | Revenues by type | 1Q25 | 2Q25 | 3Q25 | 4Q25 | 1Q26 | 2Q26E 155,238 | 3Q26E | 4Q26E | 2025 | 2026E | 2027E | 2028E | 2028E | |
| Global server revenues | US$m US$m | 62,164 | 84,687 | 85,680 | 115,382 | 128,512 | 49,666 | 149,935 | 170,432 | 347,913 | 604,117 | 849,860 | 1,102,109 245,210 | 1,102,109 245,210 | |
| Our Bottom up method | General servers AI server racks (NVL72) | US$m | 32,801 4,268 | 38,085 8,464 | 37,231 15,804 | 39,854 25,380 | 44,533 26,983 | 44,831 | 48,165 37,867 | 46,767 56,993 | 147,970 53,916 | 189,132 166,673 | 221,573 336,140 | 561,402 | 561,402 |
| Global server TAM = | AI server training (8-GPU) | US$m | 19,792 5,304 | 32,860 5,278 | 27,316 5,329 | 43,286 6,862 | 47,134 | 51,440 | 52,727 | 53,865 12,807 | 123,255 22,772 | 205,166 43,146 | 215,799 76,347 | 219,395 76,102 | 219,395 76,102 |
| General server + AI server racks | AI server inferencing (8-GPU) Mix | US$m | 1Q25 | 2Q25 | 3Q25 | 4Q25 | 9,862 1Q26 | 9,301 2Q26E | 11,175 3Q26E | 4Q26E | 2025 | 2026E | 2027E | 2028E | 2028E |
| (NVL72) + AI server (8-GPU) | Total | % | 100% | 100% | 100% | 100% | 100% | 100% | 100% | 100% | 100% | 100% | 100% | 100% | 100% |
| General servers | % | 53% | 45% | 43% | 35% | 35% | 32% | 32% | 27% | 43% | 31% | 26% | 22% | 22% | |
| General server | AI server racks (NVL72) AI server training (8-GPU) | % % | 7% 32% | 10% 39% | 18% 32% | 22% 38% | 21% 37% | 29% 33% | 25% 35% | 33% 32% | 15% 35% | 28% 34% | 40% 25% | 51% 20% | 51% 20% |
| AI server inferencing (8-GPU) | 9% | 6% | 8% | 6% | 7% | 8% | 7% | 7% | 9% | ||||||
| General server shipments = | Revenues YoY | % | 6% | 6% | 4Q26E | 2025 | 2026E | 2027E | 7% 2028E | 7% 2028E | |||||
| 1Q25 | 2Q25 | 3Q25 | 4Q25 | 1Q26 | 2Q26E | 3Q26E | 48% | 74% | 41% | 30% | 30% | ||||
| shipments of Top 6 server brands | Total | % | 107% 36% | 83% 30% | 75% 29% | 17% | 28% | 17% | 11% | 11% | |||||
| +ODM direct + others | General servers AI server racks (NVL72) | % % | 532% | 430% | 140% | 125% | 209% | 102% | 67% | 67% | |||||
| General server revenues = | AI server training (8-GPU) | % | 138% | 57% | 93% | 24% | 66% | 5% | 2% | 2% | |||||
| shipments of each company x ASP | AI server inferencing (8-GPU) | % | 1Q25 | 2Q25 | 3Q25 | 4Q25 | 86% 1Q26 | 76% 2Q26E | 110% | 87% | 2025 | 89% 2026E | 77% 2027E | 0% 2028E | |
| of each company | Revenues QoQ Total | % | 3Q26E -3% | 4Q26E 14% | |||||||||||
| General servers | 36% | 1% | 35% | 11% | 21% | -3% | |||||||||
| General servers revenues mix | % | 16% | -2% | 7% | 12% | 12% | -3% | 51% | |||||||
| AI server racks (NVL72) | % | 98% | 87% -17% | 61% 58% | 6% | 66% | -16% | 2% | |||||||
| 43% | AI server training (8-GPU) | % | 66% 0% | 1% | 29% | 9% | 9% | 3% | 15% | ||||||
| 31% | AI server inferencing (8-GPU) Shipments by type Global server shipments | % Units | 1Q25 | 2Q25 | 3Q25 | 4Q25 | 44% 1Q26 | -6% 2Q26E | 20% 3Q26E | 4Q26E | 2025 | 2026E | 2027E 18,053 | 19,053 | 19,053 |
| 26% 22% | General servers AI server racks (NVL72) | k units k racks | 3,619 2 | 3,887 3 | 3,642 6 | 3,904 9 | 4,158 9 | 4,345 15 | 4,326 12 | 4,260 19 | 15,053 19 | 17,088 55 | 105 | 163 | 163 |
| AI server training (8-GPU) | k units | 156 | 221 | 209 | 268 | 289 | 313 | 325 | 338 | 855 323 | 1,264 | 1,419 984 | 1,406 | 1,406 | |
| AI server inferencing (8-GPU) | k units | 71 | 78 | 78 | 97 | 132 | 127 | 161 | 174 | 593 | 2027E | 1,152 | 1,152 | ||
| Shipments YoY General servers | 1Q25 | 2Q25 | 3Q25 | 4Q25 | 1Q26 | 2Q26E | 3Q26E | 4Q26E | 2025 | 2026E | 6% | 2028E 6% | 2028E 6% | ||
| 2025 2026E 2027E 2028E | AI server racks (NVL72) | % | 15% 511% | 12% 393% | 19% 121% | 9% 111% | 14% 190% 48% | 89% 12% | 56% | ||||||
| AI server | AI server training (8-GPU) AI server inferencing (8-GPU) | % % % | 1Q25 | 2Q25 | 3Q25 | 4Q25 | 85% 87% 1Q26 | 41% 63% 2Q26E | 55% 107% 3Q26E | 26% 79% 4Q26E | 2025 | 84% 2026E | 66% 2027E | -1% 17% 2028E | |
| AI server shipments = shipments of Top 6 server brands+ODM direct + | Shipments QoQ General servers AI server racks (NVL72) AI server training (8-GPU) | % % | 7% | -6% 87% | 7% | 6% | 5% 61% | 0% -16% | -2% | ||||||
| others | AI server inferencing | % | 100% | 61% | 2% | 53% | |||||||||
| AI server revenue | Shipments by vendor | -6% | 8% | 4% | 4% | ||||||||||
| = shipments x | (8-GPU) General server shipments | % | 1Q25 3,619 | 42% 10% 2Q25 3,887 | 0% 3Q25 3,642 | 28% 25% 4Q25 3,904 | 8% 37% 1Q26 4,158 | -4% 2Q26E 4,345 | 26% 3Q26E 4,326 | 8% 4Q26E 4,260 | 2025 15,053 | 2026E 17,088 | 2027E 18,053 | 2028E 19,053 | 2028E 19,053 |
| AI server racks revenues mix ASP | Dell HP | k units k units k units | 334 165 | 307 161 | 299 | 355 | 417 173 | 400 | 323 | 372 | 1,295 | 1,512 | 1,587 | 1,619 | 1,619 |
| Super Micro | k | 173 | 161 | 182 | 177 135 | 180 | 201 | 669 | 730 | 770 | 785 | 785 | |||
| 40% 51% | Lenovo | units k units | 156 174 | 134 | 130 | 165 | 233 | 135 234 | 142 | 592 | 578 | 557 | 579 | 579 | |
| 28% | Gigabyte | k units | 24 | 187 31 | 213 23 | 263 21 | 226 29 | 31 | 31 | 289 28 | 837 99 | 983 | 1,032 137 | 1,084 144 | 1,084 144 |
| 15% | Quanta -ODM direct Hon Hai-ODM direct | k units | 576 207 | 650 | 483 | 541 | 639 | 747 255 | 579 | 649 | 2,249 | 119 2,615 | 2,694 | 2,748 971 | 2,748 971 |
| k units | 221 596 | 211 | 218 | 229 | 242 | 895 | 944 | 971 | |||||||
| Wiwynn- ODMdirect Others | k units | 455 | 256 527 | 588 1,614 | 638 | 606 1,762 | 834 | 588 | 2,166 | 2,666 | 2,986 | 3,404 | 3,404 | ||
| 2025 2026E 2027E 2028E | AI server - 8-GPU | k units k units | 1,527 227 | 1,596 299 | 1,514 287 | 365 | 1,651 421 | 440 | 1,781 485 | 1,748 512 | 6,252 1,178 | 6,942 1,858 | 7,320 2,403 | 7,721 2,558 | 7,721 2,558 |
| server (8-GPU) revenues | Dell HP | k units k units | 9 3 | 33 6 | 28 4 | 44 3 | 65 | 77 | 72 10 | 73 | 113 16 | 285 27 | 377 29 | 432 34 | 432 34 |
| AI 42% 41% 34% | Super Micro | 9 | 12 | 29 | 3 29 | 8 30 | 7 | 146 | 168 | 168 | |||||
| mix 27% | Lenovo Gigabyte | k units | 12 | 13 | 34 | 18 | 31 | 33 | 62 51 | 123 104 | |||||
| Quanta -ODM direct | k units k units | 16 4 | 10 | 11 5 | 5 | 7 | 10 28 | 25 | 27 | 23 97 | 30 | 190 34 | 278 37 | ||
| Hon Hai-ODM direct | k units | 19 51 | 9 20 | 24 | 34 57 | 29 | 91 | 6 41 | 7 39 | 141 | 145 | 145 | |||
| Wiwynn- ODMdirect | k units k units | 21 | 60 | 56 52 | 54 | 90 45 | 45 | 96 46 | 96 57 | 224 168 | 137 373 193 | 504 231 | 431 277 | 431 277 | |
| 2025 2026E 2027E 2028E | Others AI server - full racks | k units | 94 | 41 109 3 | 95 6 | 127 9 | 120 | 134 | 158 | 174 | 425 19 | 586 55 | 750 | ||
| Dell | k racks | 2 | 1 | 9 | 15 | 12 | 19 | 2 | 105 | 756 163 | 756 163 | ||||
| k racks | 0 | 0 | 1 | 1 | 1 | 1 0 | 0 | 8 0 | 8 0 | ||||||
| HP Super Micro | ** k racks | 0 | 0 0 | 1 0 0 | 0 | 0 | 0 | 0 | 0 | 5 0 | 6 0 4 | ||||
| Lenovo Gigabyte | k racks | 0 - | - | - | 0 - | 0 0 | 0 0 | 0 0 | 0 | - | 1 | 2 0 | |||
| Quanta -ODM direct | k racks k racks | - | 0 | 0 | 0 | 0 | 2 | 5 3 2 | 5 3 2 | ||||||
| Hon Hai-ODM direct | 1 | 0 2 | 3 | 0 4 | |||||||||||
| Wiwynn-ODM direct | k racks k racks | 1 0 | 0 1 4 | 6 | 3 | 0 6 7 | 8 | 11 | 1 13 30 | 22 | 22 | ||||
| 1 | 5 | 2 | |||||||||||||
| Others | k racks | 1 - | - | - | - | - | - | 2 | 11 - | 17 65 8 | 113 7 | 113 7 | |||
| k racks | - 0 | 1 | 0 | 0 | 0 | 1 | 2 2 | 2 | 3 | 3 | |||||
| 0 | 0 | ||||||||||||||
| 1 |
Source: Company data, Goldman Sachs Global Investment Research
Server TAM estimate revisions
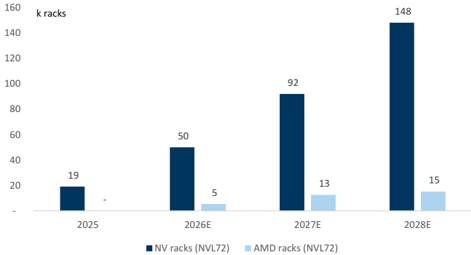
AI server racks: We raise our forecast for AI server racks powered by NVIDIA to 92k / 148k in 2027 / 28E, with our estimates being raised by 19% / 22% in 2027 / 28E, while keeping AI server racks powered by AMD largely unchanged at 5k / 13k / 15k in 2026-28E. With continuous speci fi cation upgrade, we expect the dollar content per AI server rack will continue to grow. Overall, we expect the AI server rack global value TAM to grow at 118% CAGR in 2025-28E to US$561bn, or 51% of the global server value TAM by 2028E. By vendor, we continue to expect global leading CSPs to be the major customers, with leading ODM direct players as the major suppliers. We expect Hon Hai / FII to maintain the leading market position among ODMs and with continuous speci fi cation upgrade driving its global market share from 55% in 2026E to 69% by 2028E.
e92c7a75ab8b4efbba794e6b187208c8
Exhibit 3: AI server racks global shipment by chipset platforms
Source: Goldman Sachs Global Investment Research
Exhibit 4: AI server rack shipment by ODM / OEMs
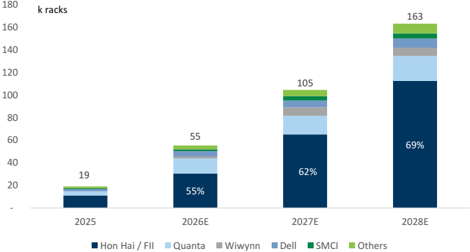
% in the chart indicates Hon Hai / FII global market share in AI server racks
Source: Goldman Sachs Global Investment Research
AI servers: We raise AI server (8-GPU) equivalent shipment by 18% / 24% / 11% in 2026-28E to 1.9m / 2.4m / 2.6m in 2026-28E, mainly driven by rising ASIC-based AI server demand. The custom-design provides ASIC-based AI servers optimized for AI computation with better e ffi ciency, such as lower latency, or memory savings via reduced expensive read/write cycles. We continue to see new generation ASICs launched by global leading CSPs, supporting AI server growth: we expect the AI servers (8-GPU) global value TAM to grow at 26% CAGR in 2025-28E to US$295bn, or 27% of global server value TAM by 2028E.
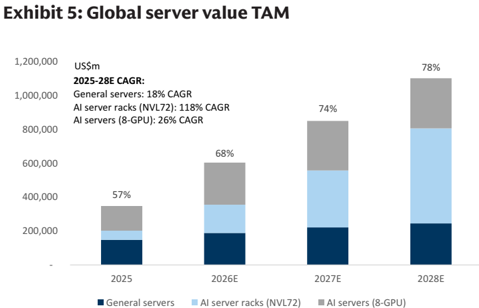
% in chart indicates AI server (8-GPU and NVL72) revenues mix
Source: Goldman Sachs Global Investment Research
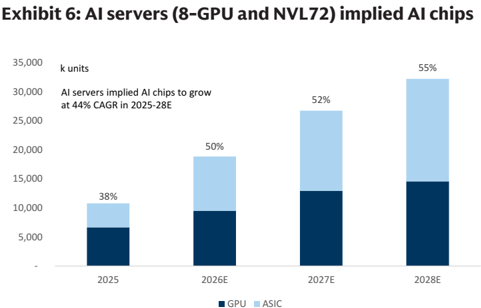
% in chart indicates ASIC shipment contribution to total AI chips
Source: Goldman Sachs Global Investment Research
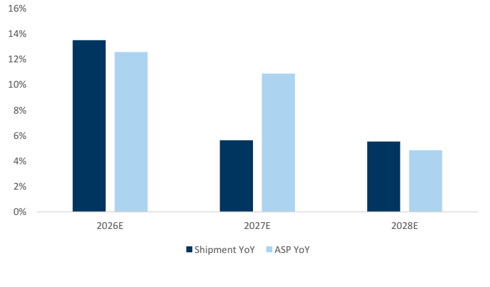
General servers: We raise general server revenue growth from +15% / +6% / +6% YoY in 2026-28E to +28% / +17% / +11% YoY in 2026-28E driven by high memory costs and ongoing speci fi cation upgrade driving AI workloads. Intel launches Intel Xeon 6+ processors in Computex 2026 (link) to facilitate Agentic AI: CPU servers are served as the control plane, driving system-level performance and e ffi ciency under rising agentic AI workloads, while supporting data movement and sustained inferencing. We expect general servers' global value TAM to grow at 18% CAGR in 2025-28E to US$245bn, or 22% of global server value TAM by 2028E.
e92c7a75ab8b4efbba794e6b187208c8
Exhibit 7: General server shipment vs. ASP YoY in 2026-28E
Source: Goldman Sachs Global Investment Research
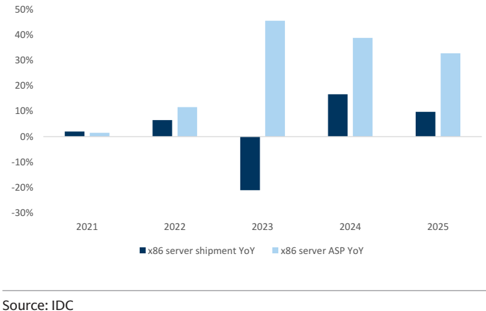
Exhibit 8: x86 server shipment vs. ASP YoY in 2021-25A
Source: IDC
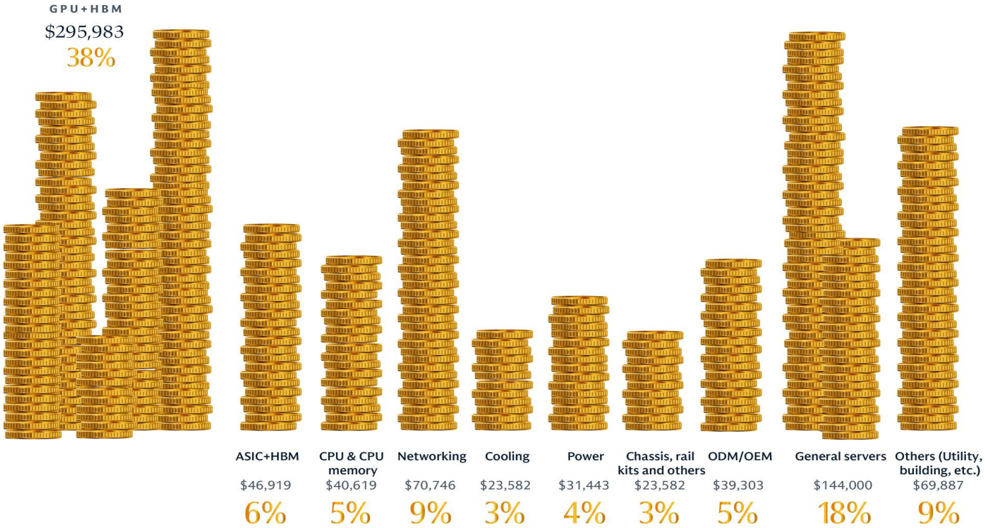
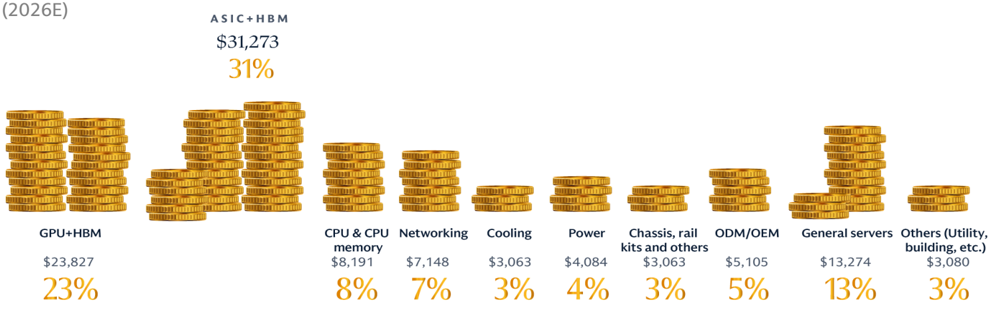
CSP capex: Regarding customer spending, our US internet team forecasts that leading US cloud service providers (CSPs) in aggregate will grow their capex budgets by 76%/ 35%/ 8% YoY in 2026-28E, with our estimates being raised by 8% / 27% / 25% in 2026-28E to US$1,145bn by 2028E. Within the China internet space, we expect leading Chinese cloud platforms to grow capex by 80%/ 20%/ 18% YoY in 2026-28E, with our estimates being raised by 37% / 44% / 55% in 2026-28E. The strong increase in CSP capex re fl ects the high memory costs and growing demand on AI workloads. In terms of capex structure, we estimate chipsets (GPU, ASIC, CPU) remains the major contributors, along with memory (HBM), and followed by networking and other components (e.g. cooling, power, chassis, rail kits, etc.). Compared to global CSPs, we estimate China CSP spending on chipsets would be more diversi fi ed across GPU and ASICs considering various local fabless suppliers and customers' varying demand on AI scenarios / tasks. Read more: Microsoft, Amazon, Meta, Alphabet, Oracle, Baba, Tencent, Baidu.
Exhibit 9: US CSP Capex trend
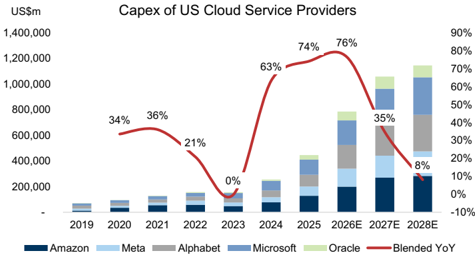
Data include Microsoft, Amazon, Meta, Alphabet and Oracle. For Microsoft, we use capex incl. fi nancial lease. In FY24, 50% of the capex of Microsoft was spent on land and 50% on AI/Cloud.
Source: Company data, Goldman Sachs Global Investment Research
Exhibit 10: China CSP capex trend
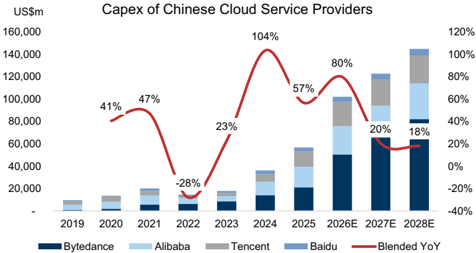
Data include Bytedance, Tencent, Alibaba, Baidu. We calculate Bytedance (private) relevant operating metrics by analyzing the industry and companies that our China Internet team cover, and then extrapolating them to Bytedance.
Source: Company data, Goldman Sachs Global Investment Research
e92c7a75ab8b4efbba794e6b187208c8
(2026E)
GPU + HBM
38%
ASIC+ HBM
$31,273
BITERDAR BEED BEI
31%
Exhibit 11: CSP capex structure
Global CSP Capex US$786.1bn
DITTODA COOD ACCE
GPU+HBM
$23,827
23%
(2026E)
EEL RELEEE
FEEEEEEEE
EEEEEEE
DITTOBOTE COOD ECLI
BUITTODOTE ERED NECE
INTERD
ПОВОЛ СОБО ДОЦі СО 0CO)
DIRED OBIE CEDO ACCE
DDAT CDDO СОСООТЕ СОДОКОТ
DITTODOTE COOD ECCI
General servers Others (Utility,
DITTODOTE CEDD ECCO
Chassis, rail
BUTTODO CERO COCU
DI DODORE CEDO COL
UDITODOTE CONDIRET
ODM/OEM
CPU & CPU Networking
NODAT СЕГО ПО
Cooling
China CSP Capex US$102.1bn
Source: Goldman Sachs Global Investment Research
TODD
Power
BITTOD
e92c7a75ab8b4efbba794e6b187208c8
PCs: -10% / +2%/ +3% YoY in 2026E-28E
Global PCs market opportunity
| (Shipments in munits) | Shipments by product | 1Q25 2Q25 3Q25 4Q25 1Q26E 2Q26E 3Q26E 4Q26E 2023 2024 2025 2026E 2027E 2028E | ||||||||||||||||
|---|---|---|---|---|---|---|---|---|---|---|---|---|---|---|---|---|---|---|
| Global PCs shipments (m units) | 64 268 | 69 | 76 | 76 62 | 59 | 68 | 69 19 | 260 | 264 | 285 | 257 261 69 | 67 | ||||||
| Desktops Notebooks | 18 67 45 194 | 18 49 | 20 | 53 | 21 16 54 44 | 15 42 | 19 47 | 48 | 72 181 | 70 186 | 76 200 | 181 | 187 | |||||
| Our Bottom up method | Workstations | 2 8 | 2 | 2 | 2 | 2 2 | 2 | 2 | 7 | 8 | 8 | 7 | 7 | |||||
| Global PCs shipments = | YoY | 6% 3% | 7% | 9% | 10% | -3% | -15% | -10% | -10% | -14% | 1% | 8% | -10% | 2% | ||||
| Desktops | 4% 0% | 7% | 14% | 13% | -8% | -15% | -9% | -9% | -16% | -4% | 10% | -10% -10% | -2% | |||||
| sum of shipments by brands | Notebooks | 7% 4% | 7% | 7% | 9% -1% | -15% | -11% | -11% | -13% | 3% 11% | 8% 2% | 3% 3% | ||||||
| Global PCs revenues = | Workstations | 13% 3% 100% | 5% | 4% 100% | -11% 100% | -6% 100% | -14% | -8% | -8% 100% | -9% 100% | 100% | 100% | -9% 100% 100% | |||||
| Desktops ASP x shipments + | Mix | 100% 25% | 100% | 27% | 100% | 100% 27% | 27% | 28% | 26% | 27% | 27% | 26% | ||||||
| Notebooks ASP x shipments + Workstations ASP x shipments | Desktops Notebooks 3% | 27% 70% 72% 3% 3% | 26% 71% | 71% | 27% 71% | 26% 71% 3% | 26% 71% 3% | 70% 3% | 70% | 70% 3% | 71% | 70% | 70% 3% | 71% 3% | 3% | |||
| Workstations Revenues by product | 1Q25 2028E | 3% 2Q25 | 3Q25 | 3% 4Q25 | 1Q26E | 2Q26E | 3Q26E | 3% 4Q26E | 2023 222,164 | 2024 237,235 | 2025 | 2026E | 3% 2027E | |||||
| Global PCs revenues (US$ m) Desktops | 58,452 55,852 | 63,666 12,827 | 71,813 14,491 | 73,313 14,338 | 58,976 11,836 | 58,984 11,829 | 70,222 14,422 | 71,663 14,270 | 49,894 | 49,329 | 267,244 53,992 | 259,846 52,358 | 272,663 286,173 52,749 | |||||
| PCs shipments by region (2025) | Notebooks | 12,335 42,070 17,816 | 46,638 | 52,877 4,445 | 54,983 3,992 | 43,179 3,962 | 43,239 3,916 | 51,356 4,444 | 53,402 3,991 | 157,767 | 172,151 | 196,568 | 191,176 | 202,721 212,504 17,193 | ||||
| Workstations YoY | 4,046 | 4,201 | 12% | -7% | -2% | 14,503 | 15,755 | 16,684 | 16,312 | 5% | ||||||||
| Asia/Pacific | 5% | 14% | 12% | 1% | -2% | -16% | 7% | 13% | -3% | |||||||||
| (ex. Japan) Rest of World | Shipments by vendor | 12% 2028E | 2Q25 | 3Q25 | 4Q25 | 1Q26E 62 | 2Q26E 59 | 3Q26E | 4Q26E | 2023 | 2024 | 2025 | 2026E | 2027E | ||||
| 15% 20% | Global PCs shipments (m units) Lenovo 15 | 1Q25 64 69 268 67 | 69 17 | 76 | 76 19 | 18 | 15 | 68 13 19 | 18 | 260 59 | 264 | 285 | 257 65 | 261 66 | 62 | 70 | ||
| China 15% Western Europe | HP Dell Apple 6 | 13 50 10 8 37 7 7 28 | 14 10 6 | 9 7 | 14 | 15 11 7 | 13 9 6 | 11 11 9 6 | 12 9 | 54 37 22 | 36 23 | 39 26 | 48 35 26 27 | 47 36 | 51 | 55 | ||
| Japan 7% USA 18% | ASUS | 4 19 7 | 5 | 6 2 | 5 2 | 4 4 2 2 | 5 2 | 4 2 | 17 8 | 18 8 1 | 20 8 | 17 7 | 18 | |||||
| 25% | Samsung Microsoft | 2 0 1 | 2 0 | 0 | 0 | 0 0 | 0 | 0 | 2 | 1 | 1 | 7 1 | ||||||
| LG | 0 1 | 0 | 0 | 0 | 0 0 | 0 | 0 | 1 | 1 1 | 1 | 1 | 1 | ||||||
| PCs shipments growth by | Xiaomi | 0 1 | 0 | 0 | 0 0 | 1 | 1 | 1 | ||||||||||
| region | Others | 14 58 | 14 | 18 | (0) 12 | 13 | 0 | (0) | 1 60 | 63 | 64 | 56 | 57 | |||||
| 6% 3% | 7% | 9% | 18 10% -3% | 15 | 16 | -14% | 1% | 8% | -10% | 2% 100% | ||||||||
| Asia/Pacific (ex. Japan) YoY | YoY market share 24% | 100% 100% 27% 25% | 100% 25% | 100% | 100% | 100% | -15% 100% | -10% 100% 23% 28% | -10% 100% | 100% 23% | 100% 23% | 100% 24% | 100% 25% 19% | 25% 18% 14% | ||||
| 7% | Global Lenovo | 20% 19% 15% 14% | 20% 14% | 12% | 26% 18% | 24% 24% 20% 21% | 19% 15% | 16% 12% | 18% 13% | 21% 14% | 19% 14% | 19% 14% | 14% 10% | 10% | ||||
| 2% 3% | HP Dell Apple | 9% 10% 7% | 9% | 9% 8% | 14% 15% 9% 10% | 11% 7% 7% | 10% | 10% | 8% | 9% 7% | 9% 7% 3% | 7% 3% | 7% | |||||
| -6% -10% | ASUS | 6% 3% 3% | 7% | 3% 0% | 6% 2% | 3% | 7% 3% | 6% 3% | 6% | 1% | 3% 1% | |||||||
| 2024 2025 2026E 2027E 2028E | Samsung Microsoft | 1% 1% | 3% 0% | 3% 1% | 0% | 1% | 3% 1% | 3% | 0% | |||||||||
| US YoY | LG | 0% | 0% | 0% | 0% 0% | 1% 1% 0% | 0% | 1% 0% | 0% | 0% 0% | ||||||||
| Xiaomi | 0% 0% 0% | 0% | 0% | 0% | 0% | 0% | 0% | |||||||||||
| 3% 3% 3% 3% | Others | 22% 21% | 0% | 0% | 0% 0% | 0% 23% | 0% 23% | 0% 24% | 0% 23% | 22% | 22% | |||||||
| ASP | 23% 24% 20% 22% 23% 1Q25 2Q25 3Q25 4Q25 1Q26E 2Q26E 3Q26E 4Q26E 2023 2024 2025 2026E 2028E 915 924 951 960 953 1,008 1,036 1,045 854 900 939 1,012 1,066 6% 7% 3% 2% 4% 9% 9% 9% -2% 5% 4% 8% | 2027E 1,044 | ||||||||||||||||
| Global PC ASP (US$) YoY | ||||||||||||||||||
| -11% | AI PCs AI PC shipment (m units) | 22% | ||||||||||||||||
| 3% 2% 1Q25 2Q25 3Q25 4Q25 1Q26E 2Q26E 3Q26E 4Q26E 2023 2024 2025 2026E 2027E 2028E | ||||||||||||||||||
| 2024 2025 2026E 2027E | 18 22 29 35 33 33 41 43 52 103 150 | |||||||||||||||||
| 187 219 | ||||||||||||||||||
| 23% 99% | ||||||||||||||||||
| 2028E | ||||||||||||||||||
| 81% 57% 61% 88% 53% 42% 17% 60% | 46% 24% | |||||||||||||||||
| YoY Penetration AI PC revenues (US$ m) | 28% 32% 38% 45% 54% 57% 62% 81% 20,341 25,573 30,226 38,071 33,506 37,576 44,611 48,030 61% 42% 45% 65% 47% 26% 17% 35% 40% 42% 52% 57% 64% | 48% | 59% 72% 163,724 205,718 43% 26% | 239,818 | 63,383 | 20% | 114,211 | 36% 80% | ||||||||||
| YoY Penetration Gaming PCs | 64% 67% 84% 1Q25 2Q25 3Q25 4Q25 1Q26E 2Q26E 7 7 8 8 6 6 | 63% 75% | 27% | 43% | ||||||||||||||
| China YoY 4% 2% | Gaming PC shipment (m units) | 8% 14% 12% 9% -6% -21% 10% 11% 11% 10% 10% 10% | ||||||||||||||||
| -3% | 3Q26E 4Q26E 2023 2024 2025 2026E 2027E 2028E 7 7 28 31 26 28 31 -15% -13% 11% -14% 8% 9% 11% 10% 10% 11% 10% 11% 12% 56,591 | |||||||||||||||||
| 3% | YoY | |||||||||||||||||
| -10% 2024 2025 2026E 2027E 2028E | Penetration Gaming PC revenues (US$ m) | 10,436 | 11,855 | 13,401 | 12,505 | 10,435 | 12,587 | 11,898 | 40,502 | 48,197 19% | 45,284 | 51,031 | ||||||
| YoY Penetration | 17% 11% 18% 20% | 24% 19% | 19% 19% | 17% | 10,364 0% | -13% -6% | -5% 17% | 18% | -6% | 13% 19% 2027E | ||||||||
| 1Q25 2028E | 2Q25 | 3Q25 | 17% | 18% 1Q26E | 18% 2Q26E | 4Q26E | 2023 | 2025 277 | 2026E 250 | 17% 2024 | ||||||||
| Western Europe YoY | Shipments by markets | 261 | 67 | 74 36 | 4Q25 74 35 | 60 57 | 18% 3Q26E 66 | 67 | 256 118 137 | 17% 111 | 254 | |||||||
| Global PCs shipments (m units) Consumer PCs | 62 27 117 | 29 38 | 38 | 24 39 37 | 26 31 | 31 35 | 31 36 | 253 118 | 127 150 | 138 -10% | 140 2% | |||||||
| 4% 10% 1% 1% | Commercial PCs YoY | 35 144 6% 3% 3% | 7% 9% | 9% | 10% -3% | -15% | -10% -12% | -10% -12% | 135 -14% | -12% | 114 3% | 1% 0% | 8% | |||||
| -7% | Consumer PCs Commercial PCs Mix | 4% 8% 3% 100% 100% 45% | 6% 100% 44% | 10% 100% | 8% 13% | 7% -12% 4% 100% | -12% -17% 100% 100% | -8% -8% 100% 100% 45% 46% | -13% 100% | 7% 9% 100% 46% 54% 2025 43 42 20 68 49 | -8% 1% 100% 100% 45% 55% 2026E | -15% 47% 53% | 2% 100% 46% 54% | |||||
| 2024 2025 2026E 2027E 2028E | Consumer PCs Commercial PCs Shipments by region | 43% 57% 55% 1Q25 2028E | 56% 2Q25 | 48% 52% 3Q25 13 | 47% 53% 4Q25 | 10 | 39% 61% 55% 1Q26E 2Q26E 9 | 47% 53% 54% 3Q26E 4Q26E 12 9 10 11 | 2023 42 | 2024 40 | 45% 55% 2027E 39 | 40 14 | ||||||
| Asia/Pacific (ex. Japan) China Japan | 9 40 9 40 5 5 5 19 | 10 10 | 5 | 11 5 | 12 6 | 8 4 | 9 8 4 | 41 12 | 38 38 39 19 19 |
Shipments by markets do not include workstations.
Source: Company data, Goldman Sachs Global Investment Research e92c7a75ab8b4efbba794e6b187208c8
Smartphones: Shipments -10% / +3%/ +1% YoY in 2026-28E
Global Smartphone market opportunity
| (Shipments in munits) | Shipments by vendor | 1Q25 | 2Q25 | 3Q25 | 4Q25 | 1Q26 | 2Q26E | 3Q26E | 4Q26E | 2023 | 2024 | 2025 | 2026E | 2027E | 2028E | 2028E | 2028E | 2028E | 2028E | 2028E |
|---|---|---|---|---|---|---|---|---|---|---|---|---|---|---|---|---|---|---|---|---|
| (Revenues in mUSD) | Global shipments Apple | 303 | 297 | 326 60 | 338 85 | 294 61 | 269 53 | 284 57 | 293 76 | 1,164 234 | 1,237 233 | 1,264 | 1,140 246 | 1,170 257 | 262 | 262 | 262 | 262 | 262 | 262 |
| Samsung | 59 61 42 | 48 58 39 | 61 39 | 61 35 | 62 34 | 59 34 | 59 34 | 55 33 | 226 146 168 | 224 | 252 242 | 235 | 233 | 240 | 240 | 135 | 155 | 136 | 140 | |
| Our Bottom up method | Xiaomi Transsion | 21 | 25 | 29 | 23 | 21 | 19 | 22 | 17 | 95 | 107 | 78 50 | 97 48 | 102 | 102 | 102 | 102 | 102 | 102 | |
| Global smartphone | Lenovo ZTE | 13 2 | 14 2 | 16 2 | 16 2 | 14 2 | 11 2 | 12 2 | 13 2 | 47 6 9 | 56 7 | 9 | 9 | 48 9 | 48 9 | 48 9 | 48 9 | 48 9 | 48 9 | |
| shipments = sum of shipment | Sony | 0 | 0 | 0 | 0 | 0 | 0 | 0 | 0 | 2 | 1 | 1 0 | 1 | 1 | 1 | 1 | 1 | 1 | 1 | 1 |
| by brand | HTC Asus | 0.0 0.1 | 0.0 | 0.0 | 0.0 | 0.0 0.1 | 0.0 0.1 | 0.0 0.1 | 0.0 0.1 | 0 0 | 0 0 | 0 0 | 0 0 | 0 | 0 | 0 | 0 | 0 | 0 | |
| Others | 104 | 0.0 110 | 0.0 119 | 0.0 115 | 99 | 91 | 99 | 96 | 0 409 | 440 | 385 | 388 | 0 380 | 0 380 | 0 380 | 448 | 0 380 | 0 380 | ||
| Global smartphone | Shipments YoY | 1Q25 | 2Q25 | 3Q25 | 4Q25 | 1Q26 | 2Q26E | 3Q26E | 4Q26E | 2023 | 2024 | 2026E -10% | 2027E | 2028E | 2028E | 2028E | 2028E | 2028E | 2028E | |
| revenues = sum of revenues | Global | 1% | 2% | 4% | 3% | -3% 3% | -9% 9% | -13% -5% | -13% -11% | -3% 4% | 6% -1% | -2% | 3% 5% | 1% 2% | 1% 2% | 1% 2% | 1% 2% | 1% 2% | 1% 2% | |
| by brand | Apple Samsung | 12% 2% | 6% 7% | 4% 7% | 9% 18% | 2% | 1% -13% | -4% | -10% | -14% | -1% | 8% 8% | -3% | -1% 0% | 3% | 3% | 3% | 3% | 3% | 3% |
| Global smartphone | Xiaomi | 3% -26% | -8% -2% | -8% | -18% | -19% -1% | -25% | -13% -25% | -5% -25% | -5% 31% | 16% 13% | -13% -20% | 24% | 3% | 3% | 3% | 3% | 3% | 3% | |
| revenues = shipments x ASP | Transsion Lenovo | 2% | 2% | 13% 5% | -16% 12% | 6% | -21% | -23% | -21% | 4% | 20% | -8% 5% 27% | -15% | -4% | 5% 0% | 5% 0% | 5% 0% | 5% 0% | 5% 0% | 5% 0% |
| ZTE | 46% | 51% | 14% | 8% | -1% | -1% | -1% | -1% | 3% | 28% | -1% | -1% | -1% | -1% | -1% | -1% | -1% | -1% | ||
| Sony HTC | -42% 69% | -22% -6% | -66% | -15% -44% | -21% -62% | -21% 42% | -21% 141% | -21% 128% | -38% 27% | -32% -45% | -38% -13% | -21% 33% | -5% 7% | 0% -5% | 0% -5% | 0% -5% | 0% -5% | 0% -5% | 0% -5% | |
| Smartphone shipments by | Asus | -30% | -45% | -50% -51% | -75% | -36% | 9% | 116% | 199% | -33% | -18% | -48% | 26% | 1% | 0% | 0% | 0% | 0% | 0% | 0% |
| brands (2024) | Others | 0% | 1% | 4% | 2% | -4% | -17% | -17% | -16% | -7% | 8% | 2% 2025 | -14% | 1% | -2% | -2% | -2% | -2% | -2% | -2% |
| Others | Shipments market share | 1Q25 | 2Q25 | 3Q25 | 4Q25 | 1Q26 | 2Q26E | 3Q26E | 4Q26E | 2023 | 2024 | 2026E 22% | 2027E | 2028E 22% | 2028E 22% | 2028E 22% | 2028E 22% | 2028E 22% | 2028E 22% | |
| Apple 35% | Apple Samsung | 20% 20% | 16% | 18% 19% | 25% | 21% | 20% 22% | 20% 21% | 26% 19% | 20% 19% | 19% 18% | 20% 19% | 21% | 22% | 20% | 20% | 20% | 20% | 20% | 20% |
| 19% | Xiaomi | 14% | 20% 13% | 12% | 18% 10% | 21% 12% | 13% | 12% | 11% | 13% | 14% | 12% | 20% | 12% | 12% | 12% | 12% | 12% | 12% | |
| Samsung | Transsion | 7% | 8% | 9% 5% | 7% | 7% | 7% | 8% | 6% | 8% 4% | 9% 5% | 7% | 12% 8% | 9% 4% | 9% 4% | 9% 4% | 9% 4% | 9% 4% | 9% 4% | |
| 18% | Lenovo | 5% | 5% | 5% | 4% | 4% | 4% | 12% 8% | 4% | |||||||||||
| ZTE | 4% 1% | 1% | 1% | 1% | 1% 0% | 1% | 1% | 1% | 0% | 1% | 5% 1% | 4% 1% | 1% | 1% 0% | 1% 0% | 1% 0% | 1% 0% | 1% 0% | 1% 0% | |
| Xiaomi 14% Transsion 9% Lenovo 4% | Sony HTC | 0% 0% | 0% 0% | 0% 0% | 0% 0% 0% | 0% | 0% 0% | 0% 0% | 0% 0% | 0% 0% 0% | 0% | 0% 0% | 0% 0% | 0% 0% | 0% | 0% | 0% | 0% | 0% | 0% |
| Asus Others | 0% 34% | 0% 37% | 0% 36% | 34% | 0% 34% | 0% 34% | 0% 35% | 0% 33% | 0% 35% | 0% 36% | 0% | 0% | 0% 32% | 0% 32% | 0% 32% | 0% 32% | 33% | 0% 32% | ||
| Developed markets YoY | Shipments by price band | 1Q25 | 2Q25 | 3Q25 | 4Q25 34% | 1Q26 30% | 2Q26E 26% | 3Q26E | 4Q26E | 2023 28% | 2024 27% | 2026E | 34% | 2027E 32% | 2028E 34% | 2028E 34% | 2028E 34% | 2028E 34% | 2028E 34% | 2028E 34% |
| 1% | Premium (Above US$600) Mid-end (US$200-600) US$200) | 29% 30% | 24% 33% 44% | 28% 29% 43% | 27% 39% | 31% 39% | 30% | 32% 23% | 40% 19% 41% | 31% 42% | 29% 44% | 32% 26% 42% | 26% 41% | 24% 42% | 24% 42% | 24% 42% | 24% 42% | 24% 42% | 24% 42% | |
| -7% -2% -1% -4% | Entry level (Below Revenus by vendor Global revenues | 42% 1Q25 135,893 | 2Q25 121,581 | 3Q25 143,664 61,539 | 4Q25 174,953 98,704 | 1Q26 152,364 | 44% 2Q26E 130,682 60,617 | 45% 3Q26E 145,390 69,001 | 4Q26E 167,304 97,452 | 2023 520,767 244,908 | 2024 537,641 245,107 | 2026E 595,740 296,379 | 606,273 303,875 | 309,704 109,984 | 309,704 109,984 | 309,704 109,984 | 309,704 109,984 | 309,704 109,984 | 309,704 109,984 | |
| 2023 2024 2025 2026E 2027E | Apple Samsung Xiaomi | 59,982 28,658 9,399 | 49,179 24,514 8,730 | 29,064 9,413 | 23,470 9,080 | 69,310 31,309 8,545 | 26,328 9,285 | 28,039 10,172 | 22,080 9,760 | 102,181 32,183 | 97,604 | 107,757 37,763 10,546 | 104,557 38,951 13,757 | 41,422 | 41,422 | 41,422 | 41,422 | 41,422 | 41,422 | |
| US YoY | Transsion | 2,424 | 2,946 | 3,417 | 2,629 | 2,848 | 2,712 | 2,816 | 2,170 | 11,493 | 36,477 12,615 | 13,307 | ||||||||
| 0% | Lenovo | 3,187 | 3,469 | 3,725 | 4,193 | 3,108 | 3,088 | 3,318 | 11,608 | 13,661 | 13,430 | 15,403 | 15,403 | 15,403 | 15,403 | 15,403 | 15,403 | |||
| 0% | ZTE | 358 | 377 | 410 | 3,916 313 97 | 367 | 400 | 341 107 | 1,089 1,219 | 1,110 893 | 1,422 | 1,387 | 14,433 1,367 | 14,433 1,367 | 14,433 1,367 | 14,433 1,367 | 14,433 1,367 | 14,433 1,367 | ||
| -2% | Sony | 116 4 | 265 4 | 107 | 349 128 | 221 6 | 89 | 5 | 1,494 617 | 513 17 | 502 17 | 517 | 517 | 517 | 517 | 517 | 517 | |||
| HTC Asus | 40 | 2 | 2 | 1 | 42 | 51 | 16 | 16 | 16 | 16 | 16 | 16 | ||||||||
| -5% | 69 | 20 | 18 | 42 | 5 42 | 16 | ||||||||||||||
| -7% 2023 2024 2025 2026E | Others Revenues by price | 27 317 | 283 | 13 148 136,101 | 176 | 170 | 161 128,381 | 161 128,381 | 161 128,381 | 161 128,381 | 161 128,381 | 161 128,381 | ||||||||
| China YoY 2027E | band Premium (Above US$600) | 31,696 1Q25 67% | 32,058 2Q25 60% | 35,967 3Q25 66% | 36,379 4Q25 71% | 35,983 1Q26 | 27,996 2Q26E | 31,737 3Q26E | 32,020 4Q26E 78% | 115,741 2023 65% | 129,876 2024 65% | 127,737 2026E | 67% | 129,749 2027E 71% | 2028E 76% 14% | 2028E 76% 14% | 2028E 76% 14% | 2028E 76% 14% | 2028E 76% 14% | 2028E 76% 14% |
| 6% 0% 0% | Mid-end (US$200-600) Entry level (Below US$200) Shipments by region | 21% 12% | 27% 13% 2Q25 | 22% 12% 3Q25 | 20% 9% 4Q25 | 63% 28% 10% 1Q26 | 59% 30% 11% 2Q26E | 69% 21% 11% 3Q26E | 14% 9% 4Q26E | 22% 12% 2023 | 22% 13% 2024 | 22% 11% 2025 1,264 | 23% 10% 2026E | 19% 10% 2027E 1,170 | 10% 2028E | 10% 2028E | 10% 2028E | 10% 2028E | 10% 2028E | 10% 2028E |
| 0% - | Global shipments Developed markets | 1Q25 303 62 | 297 56 | 326 67 | 338 82 | 294 60 | 269 54 | 284 64 | 293 78 39 | 1,164 276 | 1,237 270 | 268 128 | 1,140 256 | 257 122 | 1,182 259 122 | 1,182 259 122 | 1,182 259 122 | 1,182 259 122 | 1,182 259 122 | 1,182 259 122 |
| -5% -10% | USA Western Europe | 30 | 25 23 125 | 33 | 41 | 28 23 115 | 23 22 | 31 | 28 121 | 131 | 128 102 512 | 122 96 462 | 97 | 98 472 | 98 472 | 98 472 | 98 472 | 98 472 | 98 472 | |
| BRICs India | 24 124 33 | 38 | 24 135 | 29 135 | 28 | 107 32 | 23 119 | 35 | 106 479 146 | 151 | 100 518 156 | 136 | 142 | 142 | 142 | 142 | 142 | 142 | ||
| China Rest of emerging markets | 72 116 | 69 117 | 48 68 124 | 38 76 | 69 | 59 | 41 62 | 66 | 271 | 286 | 285 | 256 | 470 142 257 | 258 | 258 | 258 | 258 | 258 | 258 | |
| BRICs YoY | Shipments YoY Global | 1Q25 | 2Q25 | 3Q25 | 121 4Q25 | 120 1Q26 | 109 2Q26E | 101 3Q26E | 93 4Q26E -13% | 409 2023 -3% | 456 2024 6% | 478 2025 2% | 422 2026E | 443 2027E 3% | 451 2028E 1% | 451 2028E 1% | 451 2028E 1% | 451 2028E 1% | 451 2028E 1% | 451 2028E 1% |
| 7% 1% | Developed markets USA | 1% -4% | 2% -2% | 4% 1% 2% | 3% 1% | -3% -4% | -9% -4% | -13% -4% -5% | -5% -5% | -7% | -10% -4% | 1% 0% | 1% 0% | 1% 0% | 1% 0% | 1% 0% | 1% 0% | |||
| 2% | Western Europe BRICs | -3% -5% | -1% -3% | -1% | 2% -1% | -5% -4% | -5% -4% | -4% | -4% | -7% | -2% -2% -3% | -1% 0% -2% | -5% -4% | 1% 0% 1% | 1% | 1% | 1% | 1% | 1% | 1% |
| -4% -11% | India | 0% -5% | 1% 8% | 3% | 1% 3% | -7% -15% | -14% | -12% | -10% -8% | -6% -4% | 7% | 1% 3% | 2% 4% 0% | |||||||
| 2023 2024 2025 2026E | China | 3% | -4% | 6% 0% | -1% | -4% | -15% -10% | -13% -23% | 1% | 4% 6% | 0% | -11% -13% -10% | 0% 0% 0% | 0% 0% 0% | 0% 0% 0% | 0% 0% 0% | 0% 0% 0% | 0% 0% 0% | ||
| Rest of emerging | 3% | 6% | 3% | -15% -14% -7% | -19% | -5% 0% | 11% | 5% | 5% | 2% | 2% | 2% | 2% | |||||||
| 2027E | markets Shipments market share | 4% | 6% | 3Q26E | 4Q26E | 2023 | 2025 | -12% | ||||||||||||
| 1Q25 100% | 2Q25 100% | 3Q25 100% | 4Q25 100% 24% | 1Q26 100% 20% 10% | 2Q26E 100% 20% | 100% | 100% | 100% | 2024 100% 22% | 2026E 100% 22% 11% | 2027E 100% 22% 10% | 2028E 100% 22% 10% | 2028E 100% 22% 10% | 2028E 100% 22% 10% | 2028E 100% 22% 10% | 2028E 100% 22% 10% | 2028E 100% 22% 10% | 2028E 100% 22% 10% | ||
| Rest of emerging mkt YoY 11% | Global Developed markets USA | 21% 10% | 19% 8% | 21% 10% | 12% | 23% 11% | 27% 13% 9% | 24% 11% 9% | 10% | 100% 21% 10% | 8% | 8% | 8% | 8% | 8% | 8% | 8% | |||
| 5% | Western Europe BRICs | 8% 41% | 8% 42% | 7% 41% | 9% 40% | 8% 39% | 9% 8% 40% | 8% 42% | 41% | 41% | 8% 41% | 8% 40% | ||||||||
| India China | 11% | 13% | 15% | 11% | 9% | 12% 22% | 14% 22% | 12% | 12% | 12% | 8% 41% 12% 23% | 40% 12% | 40% 12% | 40% 12% | ||||||
| 0% 5% | Rest of markets | 24% | 23% | 21% 38% | 22% | 23% | 36% | 23% 32% | 23% 35% | 23% 37% | 41% 12% 22% 37% | 12% 22% 38% | 22% 38% | 22% 38% | 22% 38% | 22% 38% | 22% 38% | |||
| -12% 2023 2024 2025 2026E | emerging Foldable phones | 38% 1Q25 4.2 | 39% 2Q25 3.3 | 3Q25 8.0 | 36% 4Q25 4.7 | 41% 1Q26 3.8 | 40% 2Q26E 5.9 | 3Q26E 14.1 | 4Q26E 16.9 | 2023 18.2 | 2024 18.7 | 38% 2025 20.2 | 2026E 40.6 | 2027E 69.1 | 2028E 80.4 | |||||
| 2027E | Shipment Penetration rate | 1.4% | 1.1% | 2.4% | 1.4% | 1.3% | 2.2% | 5.0% | 5.8% | 1.6% 0.3 | 1.5% 0.8 | 3.6% | 5.9% 0.8 | 6.8% 1.1 | 6.8% 1.1 | 6.8% 1.1 | 6.8% 1.1 | 6.8% 1.1 | 6.8% 1.1 | 6.8% 1.1 |
| Xiaomi Transsion | 0.1 0.0 | 0.1 0.0 | 0.1 0.0 | 0.1 0.0 | 0.1 0.0 | 0.1 0.2 | 0.2 0.2 | 0.1 0.2 | 0.1 0.2 | 1.6% 0.5 0.1 | 0.6 0.6 | 1.5 | 1.7 | 1.7 | 1.7 | 1.7 | ||||
| Lenovo Samsung | 0.8 0.5 | 0.6 | 0.5 | 1.0 | 5.7 8.3 34.4 | 10.3 | 10.3 | 10.3 | 10.3 | 10.3 | 10.3 | 10.3 | 10.3 | 10.3 | ||||||
| Apple | - | 0.4 - | 0.6 4.8 | 0.7 1.4 - | 0.8 - | 1.2 0.6 | 0.8 1.8 | 1.2 10.0 - | 2.7 6.4 - | 2.7 7.0 - | 3.6 7.2 14.1 14.7 | 10.0 37.2 | 10.0 37.2 | 10.0 37.2 | 10.0 37.2 | 10.0 37.2 | 10.0 37.2 | 10.0 37.2 | ||
| Others | 2.8 | 2.2 | - 2.5 | 2.5 | 2.3 | - 3.8 | 4.0 4.6 4.0 | 9.5 4.5 | 6.5 8.7 | 18.4 | 10.0 | 20.0 |
Source: Company data, Goldman Sachs Global Investment Research
e92c7a75ab8b4efbba794e6b187208c8
圖片清單(已驗證 2026-07-02)
回補驗證:僅涵蓋已被 lib 頁嵌入的圖片,非全量驗證。
| 檔名 | size | 分類 | 親眼所見內容 |
|---|---|---|---|
260624_全球伺服器_gs_global-server_002.png |
12KB | 真資料圖 | 長條圖標示「k racks」,橫軸 2025/2026E/2027E/2028E,深藍為 NV racks (NVL72) 數值 19/50/92/148,淺藍為 AMD racks (NVL72) 數值(2025 無標示)/5/13/15 |