PDF 原檔:260619_2356_英業達_gs_inventec_original.pdf
原始內容
19 June 2026 | 11:15PM HKT
Inventec (2356.TW): Monthly revenues preview: Servers business in expansion; Neutral
Inventec's May revenue was up 35% YoY, or 30% above our estimate, which management attributes to the strong end demand for both AI and general servers on the global AI trend. We model sequential revenue declines for Jun-Aug, considering the PC consumption pull-in in 1H26 and rack-level AI server entering model transition. Nevertheless, our estimate still shows YoY growth for Inventec's Jun-Aug revenues, supported by its AI server capacity ramp up in US (e.g. L10 / L11 assembly). Overall, we expect 2Q / 3Q26E revenues to grow at 31% / 10% YoY. Maintain Neutral.
Verena Jeng
+852-2978-1681 | verena.jeng@gs.com Goldman Sachs (Asia) L.L.C.
Allen Chang
+852-2978-2930 | allen.k.chang@gs.com Goldman Sachs (Asia) L.L.C.
Yifan Hu
+852-2978-0996 | yifan.hu@gs.com Goldman Sachs (Asia) L.L.C.
e92c7a75ab8b4efbba794e6b187208c8
Exhibit 1: Inventec monthly revenue preview
| Apr-26 | May-26 | Jun-26 (E) | Jul-26 (E) | Aug-26 (E) | Sep-26 (E) | 2Q26E | 3Q26E | |
|---|---|---|---|---|---|---|---|---|
| Rev (NT$m) | 84,787 | 82,808 | 77,003 | 68,533 | 62,365 | 63,552 | 244,598 | 194,450 |
| YoY | 37% | 35% | 22% | 26% | 2% | 5% | 31% | 10% |
| MoM/QoQ | -3% | -2% | -7% | -11% | -9% | 2% | 22% | -21% |
| GS (NT$m) | 63,046 | 63,676 | ||||||
| Actual vs. GS | 34% | 30% |
Source: Company data, Goldman Sachs Global Investment Research
Earnings revision: Inventec's 1Q26 net income was higher than our estimate, mainly on the higher than expected revenues and lower than expected opex ratio, which we attribute to the company's strong server business growth and PC consumption pull-in amid the rising memory cost. After factoring in Inventec's 1Q26 result and the May revenue data, we raise our 2026-28E net income by 8% / 14% / 12%, mainly on higher revenues and GMs. We raise our 2026-28E revenues mainly on (1) higher general server ASP estimate, given the product mix upgrades towards models with stronger performance, (2) higher PC ASP on product mix upgrade and rising raw material costs. Our 2026-28E GMs are slightly revised up, mainly on higher contribution from PC and general servers, which carries higher GM than other product lines. Our 2026-28E opex ratios are largely unchanged.
Exhibit 2: Earnings revision
| 2026E | 2026E | 2026E | 2027E | 2027E | 2027E | 2028E | 2028E | 2028E | |
|---|---|---|---|---|---|---|---|---|---|
| NTm | Old | New | Chg | Old | New | Chg | Old | New | Chg |
| Revenue | 778,571 | 820,072 | 5% | 829,047 | 913,119 | 10% | 866,014 | 956,324 | 10% |
| GP | 42,075 | 44,975 | 7% | 46,121 | 51,615 | 12% | 48,518 | 54,218 | 12% |
| OP | 15,064 | 16,681 | 11% | 18,016 | 20,843 | 16% | 20,026 | 22,659 | 13% |
| Net income | 10,477 | 11,358 | 8% | 12,975 | 14,744 | 14% | 14,515 | 16,247 | 12% |
| Margins | |||||||||
| GM | 5.4% | 5.5% | 5.6% | 5.7% | 5.6% | 5.7% | |||
| OPM | 1.9% | 2.0% | 2.2% | 2.3% | 2.3% | 2.4% | |||
| NM | 1.3% | 1.4% | 1.6% | 1.6% | 1.7% | 1.7% |
Source: Goldman Sachs Global Investment Research
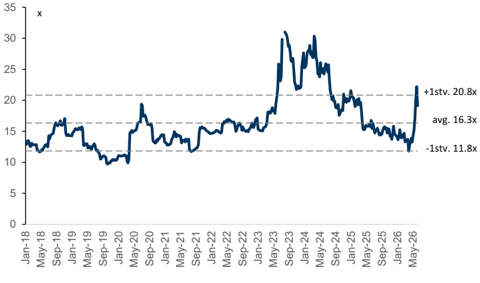
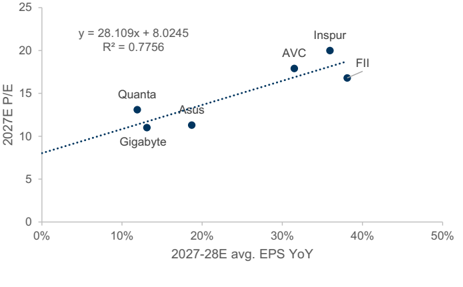
Valuation: We continue to use near-term P/E to derive our 12M TP, and our target P/E is updated to 13.6x 2027E P/E (vs. 13.4x previously), which is derived from PC/server peers' correlation between forward year trading P/E and earnings growth. With our updated target P/E and earnings estimates, our 12M TP is raised to NT$56 (vs. NT$49 previously). Maintain Neutral.
Exhibit 3: Inventec 12M forward P/E ratio
Source: Company data, Goldman Sachs Global Investment Research
Exhibit 4: Inventec: Correlation of earnings growth and P/E of its local and global peers
Source: Company data, Goldman Sachs Global Investment Research
e92c7a75ab8b4efbba794e6b187208c8
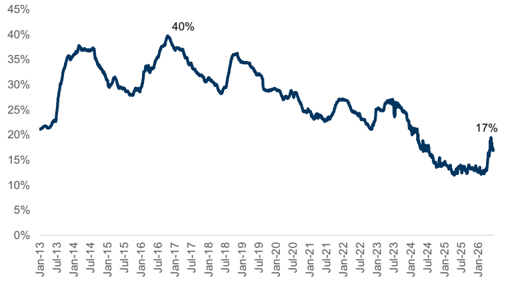
Exhibit 5: Inventec's QFII
Source: TEJ
Exhibit 6: Inventec P&L summary
| (NT$ m) | 1Q25 | 2Q25 | 3Q25 | 4Q25 | 1Q26 | 2Q26E | 3Q26E | 4Q26E | 2024 | 2025 | 2026E | 2027E | 2028E |
|---|---|---|---|---|---|---|---|---|---|---|---|---|---|
| Revenue | 157,034 | 186,577 | 176,286 | 171,293 | 200,311 | 244,598 | 194,450 | 180,714 | 646,262 | 691,190 | 820,072 | 913,119 | 956,324 |
| Gross profit | 9,413 | 9,503 | 8,876 | 8,923 | 10,177 | 14,001 | 10,925 | 9,873 | 33,337 | 36,715 | 44,975 | 51,615 | 54,218 |
| Operating income | 3,473 | 3,635 | 3,067 | 2,538 | 3,615 | 4,461 | 4,605 | 4,000 | 11,817 | 12,713 | 16,681 | 20,843 | 22,659 |
| Net income | 1,703 | 2,190 | 2,729 | 2,073 | 2,428 | 3,070 | 3,183 | 2,677 | 7,267 | 8,696 | 11,358 | 14,744 | 16,247 |
| EPS, diluted (NTD) | 0.47 | 0.61 | 0.76 | 0.57 | 0.67 | 0.85 | 0.88 | 0.74 | 2.02 | 2.41 | 3.15 | 4.08 | 4.50 |
| Margins / ratio | |||||||||||||
| Gross margin | 6.0% | 5.1% | 5.0% | 5.2% | 5.1% | 5.7% | 5.6% | 5.5% | 5.2% | 5.3% | 5.5% | 5.7% | 5.7% |
| Opex ratio | -3.8% | -3.1% | -3.3% | -3.7% | -3.3% | -3.9% | -3.3% | -3.3% | -3.3% | -3.5% | -3.5% | -3.4% | -3.3% |
| Operating margin | 2.2% | 1.9% | 1.7% | 1.5% | 1.8% | 1.8% | 2.4% | 2.2% | 1.8% | 1.8% | 2.0% | 2.3% | 2.4% |
| Net margin | 1.1% | 1.2% | 1.5% | 1.2% | 1.2% | 1.3% | 1.6% | 1.5% | 1.1% | 1.3% | 1.4% | 1.6% | 1.7% |
| QoQ | |||||||||||||
| Revenue | -21% | 19% | -6% | -3% | 17% | 22% | -21% | -7% | |||||
| Gross profit | -7% | 1% | -7% | 1% | 14% | 38% | -22% | -10% | |||||
| Operating income | -11% | 5% | -16% | -17% | 42% | 23% | 3% | -13% | |||||
| Net income | -28% | 29% | 25% | -24% | 17% | 26% | 4% | -16% | |||||
| EPS, diluted | -28% | 29% | 25% | -24% | 17% | 26% | 4% | -16% | |||||
| YoY | |||||||||||||
| Revenue | 20% | 21% | 8% | -13% | 28% | 31% | 10% | 5% | 26% | 7% | 19% | 11% | 5% |
| Gross profit | 37% | 23% | 3% | -11% | 8% | 47% | 23% | 11% | 27% | 10% | 22% | 15% | 5% |
| Operating income | 62% | 40% | -3% | -35% | 4% | 23% | 50% | 58% | 58% | 8% | 31% | 25% | 9% |
| Net income | 56% | 21% | 37% | -13% | 43% | 40% | 17% | 29% | 14% | 20% | 31% | 30% | 10% |
| EPS, diluted | 56% | 21% | 36% | -12% | 42% | 40% | 16% | 29% | 14% | 20% | 30% | 30% | 10% |
Source: Company data, Goldman Sachs Global Investment Research
Price Target Risks and Methodology - Inventec
We are Neutral rated on Inventec with a 12-month target price of NT$56.0. Our TP is based on 13.6x 2027E P/E, which is derived from PC/server peers' EPS growth vs. P/E multiple correlation. We see EPS growth as a major factor for the stock's performance.
Key upside/downside risks: 1) stronger-/weaker-than-expected PC market recovery, 2) faster-/slower-than-expected AI server ramp-up, and 3) stronger-/weaker-than-expected demand on general servers.
e92c7a75ab8b4efbba794e6b187208c8
2356.TW
12m Price Target:
NT$56.00
Neutral
Market
c
ap: NT$244.4b
n
/ $7.7b
n
En
terpr
is
e
v
a
lu
e:
NT$2
6
4.
5
b
n
/ $
8
.4b
n
3m AD T V : NT$ 3 . 5 b n / $ 11 2.2 mn Ta iw a n
G reater Chin a Te chnology M &A R a n k: 3
L ea s e s incl . in n et d ebt & EV?
: N o
GS Forecast
| 12/25 | 12/26E | 12/27E | 12/28E | |
|---|---|---|---|---|
| Revenue (NT$m n ) N e w | 6 9 1 , 1 90.3 | 82 0,0 72 .0 | 9 1 3, 11 9.0 | 9 56 ,3 2 4.0 |
| Revenue (NT$ mn) Old | 691,190.3 | 778,570.5 | 829,046.9 | 866,014.3 |
| EBITD A (NT$ mn) | 17,216.1 | 20,884.0 | 25,625.5 | 27,996.8 |
| E PS(NT$) N e w | 2 .4 2 | 3. 17 | 4. 11 | 4. 5 3 |
| EPS (NT$) Old | 2.42 | 2.92 | 3.62 | 4.05 |
| P/E (X) | 18.1 | 21.4 | 16.5 | 14.9 |
| P/B (X) | 2.1 | 3.1 | 3.0 | 2.9 |
| Dividend yield (%) | 4.5 | 3.8 | 5.0 | 5.5 |
| CROCI (%) | 10.6 | 17.3 | 19.9 | 20.3 |
| 3 /26 | 6/26E | 9 /26E | 12/26E | |
| EPS (NT$) | 0.68 | 0.86 | 0.89 | 0.75 |
Source: Company data, Goldman Sachs Research estimates, FactSet. Price as of 18 Jun 2026 close.
Price:
NT$67.70
Downside: 17.3%
e92c7a75ab8b4efbba794e6b187208c8