PDF 原檔:260529_3653_健策_daiwa_Jentech_original.pdf
原始內容
Jentech Precision Industrial (3653 TT)
Target price:
TWD6,770.00 (from TWD7,000.00)
Share price (29 May):
TWD3,545.00
|
Up/downside: +91.0%
Solid spec upgrade story on rising TDP trend
- Bright 2Q26 outlook despite change in some specs
- Intact ASP outlook for Rubin
- Reaffirming our Buy (1) call; trimming 12M TP to TWD6,770
What's new: We met with Jentech management today (29 May) for an update on its business and product development. We reaffirm our Buy (1) call (see our memo 1Q26 results roughly in line on 12 May 2026).
What's the impact: Better-than-feared 2Q26 revenue outlook. Despite some spec change on the Rubin project due to some assembly issues, there was no harm to the heat spreader spec upgrade trend in the mid-tolong term on rising TDP trend. We expect Jentech's revenue to rise MoM during the course of 2Q26 and thus forecast its 2Q26 revenue of TWD7.1bn (+34.3% QoQ), vs. the Bloomberg consensus of TWD6.3bn (+19.1% QoQ). We expect its gross margin to rise QoQ during the course of 2026, given rising revenue contribution from Rubin, Rubin Ultra and CPO. In 2028, we expect rising revenue contribution from ASICs.
Rubin heat spreader spec not confirmed yet. The spec is not confirmed yet, but we saw some rush orders recently for the one-piece lid, and thus expect a higher ASP outlook. We also expect to see higher ASP outlook for the next GPU generation, with either removeable dual lid or MCL.
Leading position in heat spreader segment; bright revenue outlook for lead frame and some progress for its socket and cold plates. We believe Jentech will maintain its leading position in the high-end heat spreader segment for the next GPU generation. The shorter GPU generation should raise the entry barrier for competitors. For its lead frame business, we forecast revenue to grow 30% YoY in 2026 due to share gains. For its socket business, Jentech is processing product approvals and we expect some progress for its socket and ILM. As the company is a cold plate vender for Rubin, this should strengthen Jentech's relationship with ODMs, bringing some revenue upside potential in 2H26 with more liquid cooling components, which would also help its MCL development.
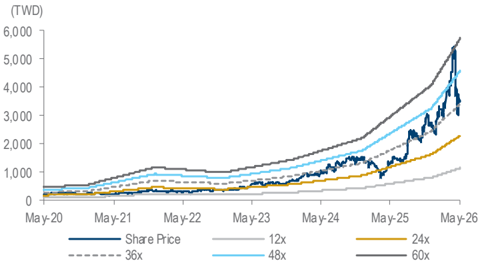
What we recommend: We reiterate our Buy (1) call but trim our 12M TP to TWD6,770 (from TWD7,000), still based on a target PER of 73x (vs. its past-3-year PER range of 17-61x) applied to our 1-year forward EPS forecast (3Q26-2Q27E). We believe our target valuation is fair, given Jentech's strong earnings visibility and leading position in chip-level thermal solutions, which we believe warrant a re-rating. Downside risks: weaker-than-expected global AI server demand; slower-than-expected thermal spec upgrades.
How we differ: Our 2026-28E EPS are 8-17% above the Bloomberg consensus, likely as we are more aggressive in our revenue and grossmargin assumptions.
29 May 2026
Daiwa
5
3
→
2
1
Buy
Helen Chien
Helen Chien
(886) 2 8758 6254
helen.chien@daiwacm-cathay.com.tw
Neil Teng (886) 2 8758 6256 neil.teng@daiwacm-cathay.com.tw
Forecast revisions (%)
| Year to 31 Dec | 26E | 27E | 28E |
|---|---|---|---|
| Revenue change | - | - | - |
| Net profit change | (1.5) | 0.1 | (0.3) |
| Core EPS (FD) change | (2.5) | (0.9) | (1.3) |
Source: Daiwa forecasts
Share price performance
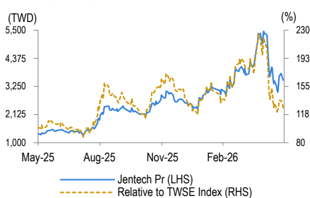
| 12-month range | 1,300.00-5,445.00 |
|---|---|
| Market cap (USDbn) | 16.56 |
| 3m avg daily turnover (USDm) | 189.06 |
| Shares outstanding (m) | 147 |
| Major shareholder | Chao family (40.0%) |
Financial summary (TWD)
| Year to 31 Dec | 26E | 27E | 28E |
|---|---|---|---|
| Revenue (m) | 32,662 | 57,082 | 80,811 |
| Operating profit (m) | 12,281 | 24,317 | 36,365 |
| Net profit (m) | 9,969 | 19,601 | 29,252 |
| Core EPS (fully-diluted) | 67.877 | 133.459 | 199.169 |
| EPS change (%) | 87.8 | 96.6 | 49.2 |
| Daiwa vs Cons. EPS (%) | 16.8 | 7.5 | 9.7 |
| PER (x) | 52.2 | 26.6 | 17.8 |
| Dividend yield (%) | 1.2 | 2.3 | 3.4 |
| DPS | 40.8 | 80.2 | 119.6 |
| PBR (x) | 17.1 | 11.8 | 8.4 |
| EV/EBITDA (x) | 39.0 | 20.1 | 13.3 |
| ROE (%) | 37.4 | 52.6 | 55.4 |
Source: FactSet, Daiwa forecasts
Jentech: revenue and earnings forecasts revisions
| 2026E | 2026E | 2026E | 2027E | 2027E | 2027E | 2028E | 2028E | 2028E | |
|---|---|---|---|---|---|---|---|---|---|
| (TWDm) | New | Previous | Change | New | Previous | Change | New | Previous | Change |
| Revenue | 32,662 | 32,662 | 0.0% | 57,082 | 57,082 | 0.0% | 80,811 | 80,811 | 0.0% |
| Gross profit | 14,698 | 15,024 | -2.2% | 27,399 | 27,399 | 0.0% | 40,406 | 40,406 | 0.0% |
| Gross margin | 45.0% | 46.0% | -1pp | 48.0% | 48.0% | 0pp | 50.0% | 50.0% | 0pp |
| Operating profit | 12,281 | 12,444 | -1.3% | 24,317 | 24,203 | 0.5% | 36,365 | 36,365 | 0.0% |
| Operating margin | 37.6% | 38.1% | -0.5pp | 42.6% | 42.4% | 0.2pp | 45.0% | 45.0% | 0pp |
| Net profit | 9,969 | 10,123 | -1.5% | 19,601 | 19,574 | 0.1% | 29,252 | 29,332 | -0.3% |
| Net margin | 30.5% | 31.0% | -0.5pp | 34.3% | 34.3% | 0pp | 36.2% | 36.3% | -0.1pp |
| Fully Diluted EPS (TWD) | 67.88 | 69.61 | -2.5% | 133.46 | 134.60 | -0.9% | 199.17 | 201.71 | -1.3% |
Source: Daiwa forecasts
Jentech: quarterly and annual P&L
| 2026E | 2026E | 2026E | 2027E | 2026E | 2027E 2028E | ||||||
|---|---|---|---|---|---|---|---|---|---|---|---|
| (TWDm) | 1Q26 | 2Q26E | 3Q26E | 4Q26E | 1Q27E | 2Q27E | 3Q27E | 4Q27E | |||
| Revenue | 5,305 | 7,123 | 8,945 | 11,289 | 10,410 | 12,156 | 15,253 | 19,263 | 32,662 | 57,082 | 80,811 |
| Gross profit | 2,217 | 3,205 | 4,070 | 5,206 | 4,685 | 5,592 | 7,321 | 9,802 | 14,698 | 27,399 | 40,406 |
| Operating profit | 1,697 | 2,621 | 3,444 | 4,519 | 3,987 | 4,875 | 6,543 | 8,912 | 12,281 | 24,317 | 36,365 |
| Pre-tax profit | 1,776 | 2,651 | 3,473 | 4,549 | 4,017 | 4,905 | 6,573 | 8,942 | 12,448 | 24,437 | 36,465 |
| Net profit | 1,398 | 2,121 | 2,782 | 3,669 | 3,219 | 3,932 | 5,273 | 7,177 | 9,969 | 19,601 | 29,252 |
| Basic EPS (TWD) | 9.53 | 14.45 | 18.96 | 25.00 | 21.94 | 26.80 | 35.94 | 48.92 | 67.95 | 133.60 | 199.38 |
| Margin | |||||||||||
| Gross margin | 41.8% | 45.0% | 45.5% | 46.1% | 45.0% | 46.0% | 48.0% | 50.9% | 45.0% | 48.0% | 50.0% |
| Operating margin | 32.0% | 36.8% | 38.5% | 40.0% | 38.3% | 40.1% | 42.9% | 46.3% | 37.6% | 42.6% | 45.0% |
| Pre-tax margin | 33.5% | 37.2% | 38.8% | 40.3% | 38.6% | 40.3% | 43.1% | 46.4% | 38.1% | 42.8% | 45.1% |
| Net margin | 26.4% | 29.8% | 31.1% | 32.5% | 30.9% | 32.3% | 34.6% | 37.3% | 30.5% | 34.3% | 36.2% |
| YoY | |||||||||||
| Revenue | 11.6% | 37.5% | 76.4% | 114.1% | 96.2% | 70.7% | 70.5% | 70.6% | 61.1% | 74.8% | 41.6% |
| Gross profit | 3.8% | 49.1% | 106.0% | 139.4% | 111.3% | 74.4% | 79.9% | 88.3% | 74.3% | 86.4% | 47.5% |
| Operating profit | 1.8% | 54.2% | 132.0% | 174.2% | 135.0% | 86.0% | 90.0% | 97.2% | 89.0% | 98.0% | 49.5% |
| Pre-tax profit | 2.0% | 99.8% | 101.6% | 150.4% | 126.2% | 85.0% | 89.3% | 96.6% | 88.4% | 96.3% | 49.2% |
| Net profit | 2.0% | 89.1% | 105.1% | 156.7% | 130.2% | 85.4% | 89.6% | 95.6% | 88.9% | 96.6% | 49.2% |
| QoQ | |||||||||||
| Revenue | 0.6% | 34.3% | 25.6% | 26.2% | -7.8% | 16.8% | 25.5% | 26.3% | |||
| Gross profit | 1.9% | 44.6% | 27.0% | 27.9% | -10.0% | 19.4% | 30.9% | 33.9% | |||
| Operating profit | 2.9% | 54.5% | 31.4% | 31.2% | -11.8% | 22.3% | 34.2% | 36.2% | |||
| Pre-tax profit | -2.3% | 49.3% | 31.0% | 31.0% | -11.7% | 22.1% | 34.0% | 36.0% | |||
| Net profit | -2.2% | 51.7% | 31.2% | 31.9% | -12.3% | 22.2% | 34.1% | 36.1% |
Source: Company, Daiwa forecasts
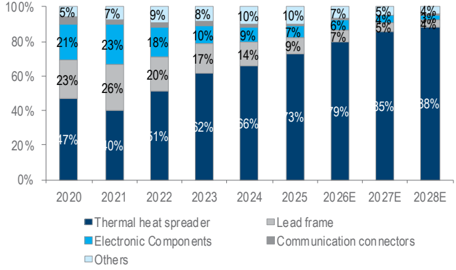
Jentech: product mix
Source: Company, Daiwa forecasts
Jentech Precision Industrial (3653 TT): 29 May 2026
Jentech: 1-year forward PER
Source: Bloomberg, Daiwa forecasts
Daiwa
Financial summary
Key assumptions
| Year to 31 Dec | 2021 | 2022 | 2023 | 2024 | 2025 | 2026E | 2027E | 2028E |
|---|---|---|---|---|---|---|---|---|
| Thermal heat spreader revenue growth (%) | 10.4 | 73.8 | 21.2 | 25.7 | 58.2 | 75.1 | 88.1 | 46.4 |
| Lead frame revenue growth (%) | 51 | 2.3 | (13.1) | (5.8) | (4.1) | 30.6 | 26.6 | 0 |
| Electronic Components revenue growth (%) | 41.4 | 4.7 | (43.5) | 3.5 | 15.9 | 25 | 21.6 | 21.6 |
Profit and loss (TWDm)
| Year to 31 Dec | 2021 | 2022 | 2023 | 2024 | 2025 | 2026E | 2027E | 2028E |
|---|---|---|---|---|---|---|---|---|
| Thermal heat spreader | 3,533 | 6,139 | 7,444 | 9,358 | 14,804 | 25,923 | 48,767 | 71,370 |
| Lead frame | 2,326 | 2,380 | 2,068 | 1,948 | 1,868 | 2,439 | 3,088 | 3,088 |
| Other Revenue | 2,942 | 3,513 | 2,551 | 2,972 | 3,604 | 4,300 | 5,226 | 6,352 |
| Total Revenue | 8,801 | 12,032 | 12,063 | 14,278 | 20,276 | 32,662 | 57,082 | 80,811 |
| Other income | 0 | 0 | 0 | 0 | 0 | 0 | 0 | 0 |
| COGS | (6,043) | (7,706) | (8,020) | (8,913) | (11,842) | (17,964) | (29,682) | (40,406) |
| SG&A | (658) | (838) | (838) | (969) | (1,196) | (1,437) | (1,941) | (2,424) |
| Other op.expenses | (390) | (454) | (527) | (598) | (740) | (980) | (1,142) | (1,616) |
| Operating profit | 1,710 | 3,034 | 2,677 | 3,799 | 6,498 | 12,281 | 24,317 | 36,365 |
| Net-interest inc./(exp.) | (25) | (16) | 83 | 83 | 54 | 83 | 70 | 50 |
| Assoc/forex/extraord./others | (93) | 351 | 25 | 364 | 54 | 85 | 50 | 50 |
| Pre-tax profit | 1,592 | 3,369 | 2,786 | 4,245 | 6,607 | 12,448 | 24,437 | 36,465 |
| Tax | (354) | (712) | (534) | (830) | (1,297) | (2,443) | (4,796) | (7,156) |
| Min. int./pref. div./others | (42) | (42) | 46 | 13 | (33) | (36) | (40) | (57) |
| Net profit (reported) | 1,196 | 2,614 | 2,298 | 3,428 | 5,277 | 9,969 | 19,601 | 29,252 |
| Net profit (adjusted) | 1,196 | 2,614 | 2,298 | 3,428 | 5,277 | 9,969 | 19,601 | 29,252 |
| EPS (reported)(TWD) | 9.884 | 19.536 | 16.594 | 24.149 | 36.753 | 67.948 | 133.599 | 199.378 |
| EPS (adjusted)(TWD) | 9.884 | 19.536 | 16.594 | 24.149 | 36.753 | 67.948 | 133.599 | 199.378 |
| EPS (adjusted fully-diluted)(TWD) | 9.407 | 18.643 | 16.280 | 24.074 | 36.140 | 67.877 | 133.459 | 199.169 |
| DPS (TWD) | 6.000 | 11.660 | 9.850 | 14.500 | 22.000 | 40.769 | 80.159 | 119.627 |
| EBIT | 1,710 | 3,034 | 2,677 | 3,799 | 6,498 | 12,281 | 24,317 | 36,365 |
| EBITDA | 2,047 | 3,855 | 3,238 | 4,759 | 7,201 | 13,069 | 25,093 | 37,225 |
Cash flow (TWDm)
| Year to 31 Dec | 2021 | 2022 | 2023 | 2024 | 2025 | 2026E | 2027E | 2028E |
|---|---|---|---|---|---|---|---|---|
| Profit before tax | 1,592 | 3,369 | 2,786 | 4,245 | 6,607 | 12,448 | 24,437 | 36,465 |
| Depreciation and amortisation | 430 | 469 | 536 | 597 | 648 | 703 | 726 | 810 |
| Tax paid | (230) | (313) | (848) | (563) | (887) | (2,443) | (4,796) | (7,156) |
| Change in working capital | (952) | (840) | 662 | (1,211) | (1,348) | (4,606) | (8,307) | (8,437) |
| Other operational CF items | 65 | 110 | (78) | (177) | (246) | (83) | (70) | (50) |
| Cash flow from operations | 905 | 2,795 | 3,057 | 2,891 | 4,774 | 6,020 | 11,991 | 21,632 |
| Capex | (684) | (805) | (453) | (613) | (1,173) | (1,200) | (1,200) | (1,500) |
| Net (acquisitions)/disposals | (653) | (21) | 270 | 179 | 146 | 131 | 131 | 131 |
| Other investing CF items | (15) | (279) | (103) | (2,129) | 13 | 0 | 0 | 0 |
| Cash flow from investing | (1,352) | (1,105) | (287) | (2,563) | (1,014) | (1,069) | (1,069) | (1,369) |
| Change in debt | 770 | (246) | (222) | (744) | 5,197 | 0 | 0 | 0 |
| Net share issues/(repurchases) | 0 | 0 | 0 | 0 | 0 | 0 | 0 | 0 |
| Dividends paid | (733) | (785) | (1,662) | (1,436) | (2,072) | (3,187) | (5,981) | (11,761) |
| Other financing CF items | (14) | (19) | (33) | (35) | (48) | 0 | 0 | 0 |
| Cash flow from financing | 22 | (1,050) | (1,917) | (2,215) | 3,077 | (3,187) | (5,981) | (11,761) |
| Forex effect/others | 0 | 0 | 0 | 0 | 0 | 0 | 0 | 0 |
| Change in cash | (425) | 640 | 853 | (1,887) | 6,837 | 1,763 | 4,940 | 8,502 |
| Free cash flow | 221 | 1,897 | 2,597 | 2,371 | 3,791 | 4,820 | 10,791 | 20,132 |
Source: FactSet, Daiwa forecasts
Jentech Precision Industrial (3653 TT): 29 May 2026
Daiwa
Financial summary continued …
Balance sheet (TWDm)
| Year to 31 Dec | 2021 | 2022 | 2023 | 2024 | 2025 | 2026E | 2027E | 2028E |
|---|---|---|---|---|---|---|---|---|
| Cash & short-term investment | 2,648 | 3,317 | 4,156 | 2,267 | 9,134 | 10,897 | 15,837 | 24,339 |
| Inventory | 3,359 | 3,596 | 2,481 | 3,062 | 3,810 | 6,013 | 9,573 | 13,152 |
| Accounts receivable | 2,373 | 2,730 | 2,713 | 4,115 | 5,538 | 9,005 | 15,489 | 22,104 |
| Other current assets | 70 | 43 | 62 | 51 | 85 | 85 | 85 | 85 |
| Total current assets | 8,450 | 9,686 | 9,411 | 9,495 | 18,567 | 26,000 | 40,984 | 59,680 |
| Fixed assets | 4,436 | 4,675 | 4,833 | 4,852 | 8,073 | 8,570 | 9,044 | 9,733 |
| Goodwill & intangibles | 12 | 10 | 13 | 12 | 14 | 14 | 14 | 14 |
| Other non-current assets | 623 | 1,407 | 1,588 | 4,104 | 1,315 | 1,315 | 1,315 | 1,315 |
| Total assets | 13,521 | 15,777 | 15,846 | 18,462 | 27,969 | 35,899 | 51,357 | 70,742 |
| Short-term debt | 773 | 1,743 | 397 | 0 | 0 | 0 | 0 | 0 |
| Accounts payable | 1,882 | 2,176 | 2,052 | 2,790 | 3,521 | 4,641 | 6,433 | 8,245 |
| Other current liabilities | 224 | 619 | 335 | 630 | 932 | 99 | 99 | 99 |
| Total current liabilities | 2,878 | 4,537 | 2,785 | 3,420 | 4,453 | 4,740 | 6,532 | 8,344 |
| Long-term debt | 437 | 432 | 348 | 5 | 5 | 5 | 5 | 5 |
| Other non-current liabilities | 2,194 | 350 | 375 | 379 | 445 | 445 | 445 | 445 |
| Total liabilities | 5,509 | 5,319 | 3,507 | 3,804 | 4,904 | 5,190 | 6,983 | 8,795 |
| Share capital | 1,223 | 1,368 | 1,408 | 1,429 | 1,467 | 1,467 | 1,467 | 1,467 |
| Reserves/R.E./others | 5,854 | 8,152 | 10,070 | 13,037 | 21,370 | 28,978 | 42,603 | 60,120 |
| Shareholders' equity | 7,078 | 9,520 | 11,478 | 14,466 | 22,837 | 30,445 | 44,070 | 61,587 |
| Minority interests | 934 | 938 | 860 | 192 | 227 | 264 | 304 | 361 |
| Total equity & liabilities | 13,521 | 15,777 | 15,846 | 18,462 | 27,969 | 35,899 | 51,357 | 70,742 |
| EV | 519,602 | 519,902 | 517,556 | 518,036 | 511,205 | 509,478 | 504,578 | 496,133 |
| Net debt/(cash) | (1,438) | (1,143) | (3,411) | (2,262) | (9,129) | (10,892) | (15,832) | (24,334) |
| BVPS (TWD) | 58.480 | 71.142 | 82.877 | 101.919 | 159.052 | 207.512 | 300.379 | 419.771 |
Key ratios (%)
| Year to 31 Dec | 2021 | 2022 | 2023 | 2024 | 2025 | 2026E | 2027E | 2028E |
|---|---|---|---|---|---|---|---|---|
| Sales (YoY) | 28.6 | 36.7 | 0.3 | 18.4 | 42.0 | 61.1 | 74.8 | 41.6 |
| EBITDA (YoY) | 30.6 | 88.3 | (16.0) | 47.0 | 51.3 | 81.5 | 92.0 | 48.4 |
| Operating profit (YoY) | 52.8 | 77.4 | (11.8) | 41.9 | 71.1 | 89.0 | 98.0 | 49.5 |
| Net profit (YoY) | 19.6 | 118.6 | (12.1) | 49.2 | 54.0 | 88.9 | 96.6 | 49.2 |
| Core EPS (fully-diluted) (YoY) | 14.3 | 98.2 | (12.7) | 47.9 | 50.1 | 87.8 | 96.6 | 49.2 |
| Gross-profit margin | 31.3 | 36.0 | 33.5 | 37.6 | 41.6 | 45.0 | 48.0 | 50.0 |
| EBITDA margin | 23.3 | 32.0 | 26.8 | 33.3 | 35.5 | 40.0 | 44.0 | 46.1 |
| Operating-profit margin | 19.4 | 25.2 | 22.2 | 26.6 | 32.0 | 37.6 | 42.6 | 45.0 |
| Net profit margin | 13.6 | 21.7 | 19.1 | 24.0 | 26.0 | 30.5 | 34.3 | 36.2 |
| ROAE | 17.7 | 31.5 | 21.9 | 26.4 | 28.3 | 37.4 | 52.6 | 55.4 |
| ROAA | 9.6 | 17.8 | 14.5 | 20.0 | 22.7 | 31.2 | 44.9 | 47.9 |
| ROCE | 20.1 | 27.8 | 20.8 | 27.4 | 34.4 | 45.7 | 64.8 | 68.4 |
| ROIC | 23.6 | 30.1 | 23.7 | 28.7 | 39.7 | 58.5 | 80.8 | 88.4 |
| Net debt to equity | n.a. | n.a. | n.a. | n.a. | n.a. | n.a. | n.a. | n.a. |
| Effective tax rate | 22.2 | 21.1 | 19.2 | 19.6 | 19.6 | 19.6 | 19.6 | 19.6 |
| Accounts receivable (days) | 87.2 | 77.4 | 82.4 | 87.3 | 86.9 | 81.3 | 78.3 | 84.9 |
| Current ratio (x) | 2.9 | 2.1 | 3.4 | 2.8 | 4.2 | 5.5 | 6.3 | 7.2 |
| Net interest cover (x) | 67.9 | 183.9 | n.a. | n.a. | n.a. | n.a. | n.a. | n.a. |
| Net dividend payout | 60.7 | 59.7 | 59.4 | 60.0 | 59.9 | 60.0 | 60.0 | 60.0 |
| Free cash flow yield | 0.0 | 0.4 | 0.5 | 0.5 | 0.7 | 0.9 | 2.1 | 3.9 |
Source: FactSet, Daiwa forecasts
Company profile
Established in 1987, Jentech Precision Industrial is a leading global thermal-solutions and precisionmetal components maker that serves leading semiconductor and server vendors. As of 2025, its revenue comprised thermal heat spreaders (73%), lead frames (9%), electronic components (7%), communication connectors (1%) and others (10%).
Jentech Precision Industrial (3653 TT): 29 May 2026
Daiwa
ESG analysis
ESG risks
| Risks | Risks | Management | Analyst comments |
|---|---|---|---|
| Executive/board quality | 1 | The CEO and chairperson of Jentech is the same individual, Mr. Zhao Zongxin. We note that Mr. Zhao has extensive long-term experience in senior management within the company and across its subsidiaries, which is a positive sign from an executive perspective. | |
| G | Capital management | 1 | Between 2021-25, Jentech has maintained a dividend payout ratio of around 60%, which we consider reasonable for balancing shareholder returns with reinvestment needs. This consistent approach reflects prudent capital management discipline and a stable financial policy. |
| Related party & transaction | 1 | The company engages in transactions with subsidiaries primarily for normal operational purposes, such as purchase of materials and components. The proportion of these costs to overall COGS remains low, and no irregular or non-transparent transactions were identified. | |
| E | Supply chain management | 1 | Jentech has a structured procurement process, including supplier evaluation, signature of procurement contracts, and requirements for compliance with environmental and safety regulations. The company also diversifies sourcing channels (major suppliers from Taiwan, Japan, Europe, Korea, USA) and maintains stable supply relationships, with clear communication protocols for prompt response to supplier issues. This reflects strong supply chain transparency and robust quality control measures. |
| E | Data security | 1 | The company has established an information security team, conducts annual internal control audits, and implements procedures such as asset inventory, network security monitoring, virus prevention systems, firewall management, and access rights control. Backup systems and disaster recovery mechanisms are in place, allowing the company to restore information system operations and minimize damage during major incidents or equipment failures. |
Note: Management score represents a company's ability to manage/benefit from certain ESG topics. The scores range from 1 to 3, with 1 being the strongest.
Update Date: 29 May 2026 Source: Daiwa, Company
Jentech Precision Industrial (3653 TT): 29 May 2026
Daiwa
圖片清單(已驗證 2026-07-02)
回補驗證:僅涵蓋已被 lib 頁嵌入的圖片,非全量驗證。
| 檔名 | size | 分類 | 親眼所見內容 |
|---|---|---|---|
260529_3653_健策_daiwa_Jentech_002.png |
48KB | 真資料圖 | 產品組合占比堆疊長條圖,橫軸 2020 至 2028E,圖例 Thermal heat spreader(深藍)/Lead frame(灰)/Electronic Components(淺藍)/Communication connectors(灰)/Others(淺灰),Thermal heat spreader 占比標示由 47%(2020)逐年升至 88%(2028E) |