報告_GS_金居8358_20260519
PDF 原檔:報告_GS_金居8358_20260519_original.pdf
原始內容
Co-Tech Development Corp. (8358.TWO)
A new era for PCB copper foil industry with much stronger ASP/pro fi tability and less competition; Initiate at Buy with TP of NT$900
8358.TWO
12m Pri c e Target:
NT$
9
00.00
Pri c e:
NT$42 9 .00
Upside:
10 9 .8%
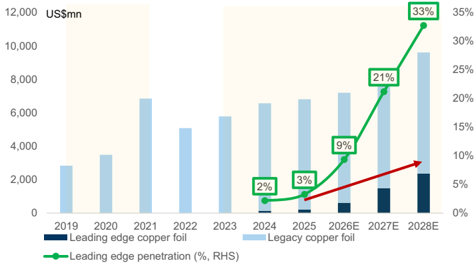
High-end copper foil TAM is on the rise, and we expect it to reach US$2.4bn in 2028E (122% 2025-28E CAGR; Exhibit 9), thanks to
mass adoption from 2H26 (most mainstream AI server projects will start adopting HVLP4 from 2H26; high-end copper foil, HVLP3 and above, will account for 9/21/33% of the overall PCB copper foil TAM in 2026/27/28E), due to requirements to improve AI server connectivity quality/speed. Moreover, in terms of the high-end copper foil industry supply demand outlook, we believe the shortage ratio for HVLP3+ industry will be at ~25-40% in 2026-28 (Exhibit 7), suggesting a much better industry UTR and pricing environment in the coming years.
As the key 2nd quali fi ed supplier of high-end AI copper foil, we forecast Co-Tech’s earnings to grow by 10x in 2028 vs 2025
(120% 2025-28E CAGR), driven by a 1x increase in capacity and 1x higher ASP. HVLP 3+ ASP is 2x+ higher than HTE copper foil. Although HTE/RTF copper foil contributed ~50% of the company’s revenue in the past 4 years, HVLP 3+ has much better pro fi tability with GM generally at 40-60%+ vs. HTE at 0-10%. Moreover, even though Mitsui Kinzoku (5706.T; Buy; covered by Atsushi Ikeda) will be the primary source for all AI projects, we believe Co-Tech’s HVLP 3+ capacity will run at ~100% UTR, given the ~25-40% industry capacity shortage ratio. Considering Co-Tech’s proactive pricing strategy, we believe it will start raising its process fee from 2H26, and we expect the pricing hike ratio to be at least 3-5% per quarter from 2Q26.
Valuation : Initiate Co-Tech at Buy with a 12m TP of NT$900 (110% upside), based on 22x 2028E EPS (discounted back to 2027 at a CoE of 11%), which is +1SD above the company’s average upcycle valuation in the past 10-years. Risks: (1) Earlier than expected CPO adoption in computing ICs, (2) Slower than expected yield rate improvement speed, and (3) Much faster than expected capacity growth from HVLP peers, thereby limiting pricing power.
BUY
Chao Wang
+886(2)2730-4195 | kuan-chao.wang@gs.com Goldman Sachs (Asia) L.L.C., Taipei Branch
Allen Chang
+852-2978-2930 | allen.k.chang@gs.com Goldman Sachs (Asia) L.L.C.
Al Wang
+886(2)2730-4081 | al.wang@gs.com Goldman Sachs (Asia) L.L.C., Taipei Branch
Key Data _____________________________________
Market cap: NT3.4bn
Enterprise value: NT3.4bn
3m ADTV: NT219.9mn
Taiwan
Taiwan Electronic Components
M&A Rank: 3
Leases incl. in net debt & EV?: Yes
| GS Forecast | 12/25 | __________________________________ 12/26E | 12/27E | 12/28E |
|---|---|---|---|---|
| Revenue (NT$ mn) | 7,879 . 9 | 11,195 . 8 | 20,689 . 9 | 30,886 . 9 |
| EBITDA (NT$ mn) | 1,537 . 7 | 3,299 . 1 | 8,245 . 4 | 13,789 . 3 |
| EPS (NT$) | 4 . 21 | 10 . 19 | 25 . 89 | 44 . 77 |
| P/E (X) | 30 . 2 | 42 . 1 | 16 . 6 | 9 . 6 |
| P/B (X) | 4 . 3 | 12 . 2 | 8 . 8 | 5 . 9 |
| Dividend yield (%) | 1 . 6 | 1 . 1 | 2 . 9 | 5 . 0 |
| N debt/EBITDA (ex lease,X) | 0 . 2 | (0 . 3) | (0 . 3) | (0 . 5) |
| CROCI (%) | 9 . 0 | 18 . 2 | 42 . 4 | 65 . 2 |
| F C F yield (%) | (0 . 4) | 1 . 6 | 2 . 7 | 6 . 8 |
| 3/26 | 6/26E | 9/26E | 12/26E | |
| EPS (NT$) | 2 . 06 | 2 . 30 | 2 . 76 | 3 . 08 |
Source: Company data, Goldman Sachs Research estimates. See disclosures for details.
Goldman Sachs does and seeks to do business with companies covered in its research reports. As a result, investors should be aware that the fi rm may have a con fl ict of interest that could a ff ect the objectivity of this report. Investors should consider this report as only a single factor in making their investment decision. For Reg AC certi fi cation and other important disclosures, see the Disclosure Appendix, or go to www.gs.com/research/hedge.html. Analysts employed by non-US a ffi liates are not registered/quali fi ed as research analysts with FINRA in the U.S.
1d80e8d785834964a67126ca5626940f
Co-Tech Development Corp. (8358.TWO)
Rating since May 19, 2026
Ratios & Valuation __________________________________________
| 12/25 | 12/26E | 12/27E | 12/28E | |
|---|---|---|---|---|
| P/E (X) | 30.2 | 42.1 | 16.6 | 9.6 |
| P/B (X) | 4.3 | 12.2 | 8.8 | 5.9 |
| FCF yield (%) | (0.4) | 1.6 | 2.7 | 6.8 |
| EV/EBITDAR (X) | 21.0 | 32.5 | 12.8 | 7.3 |
| EV/EBITDA (excl. leases) (X) | 21.0 | 32.5 | 12.8 | 7.3 |
| CROCI (%) | 9.0 | 18.2 | 42.4 | 65.2 |
| ROE (%) | 15.1 | 31.4 | 61.8 | 74.1 |
| Net debt/equity (%) | 3.3 | (10.4) | (21.3) | (37.7) |
| Net debt/equity (excl. leases) (%) | 3.3 | (10.4) | (21.3) | (37.7) |
| Interest co v er (X) | 53.1 | — | — | — |
| Days in v entory outst , sales | 38.4 | 31.7 | 22.6 | 21.9 |
| Recei v able days | 96.2 | 85.9 | 72.0 | 78.4 |
| Days p ayable outstandin g | 16.6 | 16.9 | 16.7 | 17.7 |
| DuPont ROE (%) | 14.1 | 29.0 | 53.2 | 62.0 |
| Turno v er (X) | 0.8 | 1.0 | 1.2 | 1.2 |
| L e v era g e (X) | 1.3 | 1.3 | 1.4 | 1.4 |
| G ross cas h in v ested (ex cas h ) (NT $ ) | 14 , 465.1 | 14 , 736.0 | 16 , 576.7 | 18 , 364.2 |
| A v era g e ca p ital e mp loyed (NT $ ) | 6 , 866.3 | 7 , 847.9 | 8 , 802.6 | 10 , 504.6 |
| BVP S (NT $ ) | 29.74 | 35.13 | 48.71 | 72.20 |
Growth & Margins (%) ______________________________________
| 12/25 | 12/26E | 12/27E | 12/28E | |
|---|---|---|---|---|
| Total revenue growth | 15 . 5 | 42 . 1 | 84 . 8 | 49 . 3 |
| E BITDA growth | 24 . 1 | 114 . 5 | 149 . 9 | 6 7. 2 |
| E PS growth | 15 . 3 | 142 . 2 | 154 . 0 | 7 2 . 9 |
| DPS growth | 33 . 3 | 142 . 2 | 154 . 0 | 7 2 . 9 |
| E BIT margin | 18 . 4 | 28 . 6 | 39 . 3 | 44 . 3 |
| E BITDA margin | 19 . 5 | 29 . 5 | 39 . 9 | 44 . 6 |
| Net income margin | 13 . 5 | 23 . 0 | 31 . 6 | 36 . 6 |
Price Performance __________________________________________
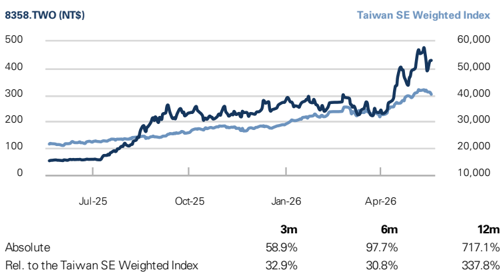
Source: FactSet. Price as of 19 May 2026 close.
Income Statement (NT$ mn) ________________________________
| 12/25 | 12/26E | 12/27E | 12/28E | |
|---|---|---|---|---|
| Tota l r e v e nu e | 7,879.9 | 11,195.8 | 20,689.9 | 30,886.9 |
| Cost of goods sold | (6,165.0) | (7,627.9) | (11,884.7) | (16,210.0) |
| SG&A | (205.4) | (262.3) | (490.3) | (717.9) |
| R&D | (62.2) | (100.9) | (177.1) | (286.4) |
| Other operating inc./(exp.) | — | — | — | — |
| E BITDA | 1 , 5 3 7 . 7 | 3, 2 99. 1 | 8 , 2 4 5 .4 | 1 3, 78 9.3 |
| Depreciation& amortization | (90.4) | (94.4) | (107.7) | (116.7) |
| E BIT | 1 ,44 7 .4 | 3, 2 04. 6 | 8 , 1 3 7 . 7 | 1 3, 672 . 6 |
| Net interest inc./(exp.) | (17.1) | 3.8 | 9.8 | 18.4 |
| Income/(loss) from associates | — | — | — | — |
| Pre-ta xp r ofi t | 1 ,340. 7 | 3, 2 04. 8 | 8 , 1 3 7 . 7 | 1 4,0 72 . 6 |
| Provision for taxes | (278.2) | (634.0) | (1,607.6) | (2,779.1) |
| Minority interest | — | — | — | — |
| Preferred dividends | — | — | — | — |
| N et inc . (p re-e xc e p t ion a ls) | 1 ,0 62 . 5 | 2 , 57 0. 7 | 6 , 5 30. 1 | 11 , 2 93. 5 |
| Post-tax exceptionals | — | — | — | — |
| N et inc . (pos t-e xc e p t ion a ls) | 1 ,0 62 . 5 | 2 , 57 0. 7 | 6 , 5 30. 1 | 11 , 2 93. 5 |
| E P S(b a sic , p re-e xc e p t ) (N T $) | 4. 21 | 1 0. 1 9 | 25 . 8 9 | 44. 77 |
| E P S(dilu te d , p re-e xc e p t ) (N T $) | 4. 21 | 1 0. 1 9 | 25 . 8 9 | 44. 77 |
| E P S(b a sic , pos t-e xc e p t ) (N T $) | 4. 21 | 1 0. 1 9 | 25 . 8 9 | 44. 77 |
| E P S(dilu te d , pos t-e xc e p t ) (N T $) | 4. 21 | 1 0. 1 9 | 25 . 8 9 | 44. 77 |
| DPS (NT$) | 2.00 | 4.84 | 12.30 | 21.28 |
| Div. payout ratio (%) | 47.5 | 47.5 | 47.5 | 47.5 |
| Balance Sheet (NT$ mn) | ____________________________________ | |||
| 12/25 | 12/26E | 12/27E | 12/28E | |
| C a sh& c a sh equiv a lents | 744.6 | 1,917.1 | 3,610.5 | 7,865.4 |
| Accounts receiv a ble | 2,389.4 | 2,882.8 | 5,280.9 | 7,993.1 |
| Inventory | 941.1 | 1,000.8 | 1,564.1 | 2,145.8 |
| Other current a ssets | 77.9 | 77.9 | 77.9 | 77.9 |
| Total c u rrent assets | 4, 15 3.0 | 5 , 878 . 6 | 1 0, 5 33.3 | 18 ,0 82 . 2 |
| Net PP&E | 4,597.6 | 5,084.1 | 5,977.3 | 6,861.5 |
| Net int a ngibles | 5.0 | 4.1 | 3.2 | 2.3 |
| Tot a l investments | 582.5 | 582.5 | 581.5 | 580.5 |
| Other long-term a ssets | 108.0 | 108.0 | 108.0 | 108.0 |
| Total assets | 9,44 6 . 1 | 11 , 657 .3 | 17 , 2 03.3 | 25 , 6 34. 6 |
| Accounts p a y a ble | 280.5 | 426.0 | 663.7 | 905.2 |
| Short-term debt | 993.4 | 993.4 | 993.4 | 993.4 |
| Short-term le a se li a bilities | — | — | — | — |
| Other current li a bilities | 646.8 | 1,363.7 | 3,245.6 | 5,509.5 |
| Total c u rrent liabilities | 1 ,9 2 0. 7 | 2 , 78 3.0 | 4,90 2 . 6 | 7 ,40 8 . 1 |
| Long-term debt | — | — | — | — |
| Long-term le a se li a bilities | — | — | — | — |
| Other long-term li a bilities | 14.5 | 14.5 | 14.5 | 14.5 |
| Total long-term liabilities | 1 4. 5 | 1 4. 5 | 1 4. 5 | 1 4. 5 |
| Total liabilities | 1 ,93 5 . 2 | 2 , 7 9 7 . 5 | 4,9 17 . 1 | 7 ,4 22 . 6 |
| Preferred sh a res | — | — | — | — |
| Tot a l commonequity | 7,510.9 | 8,859.8 | 12,286.2 | 18,212.0 |
| Minority interest | — | — | — | — |
| Total liabilities &eq u ity | 9,44 6 . 1 | 11 , 657 .3 | 17 , 2 03.3 | 25 , 6 34. 6 |
| Net debt, a djusted | 248.7 | (923.7) | (2,617.1) | (6,872.0) |
Cash Flow (NT$ mn) ________________________________________
| Cash Flow (NT$ mn) | 12/25 | 12/26E | 12/27E | 12/28E |
|---|---|---|---|---|
| Net income | 1,062.5 | 2,570.7 | 6,5 3 0.1 | 11,29 3 .5 |
| D&Aadd-back | 90.4 | 94.4 | 107.7 | 116.7 |
| Minority interest add-back | — | — | — | — |
| Net (inc)/dec working capital | (8 3 8. 3 ) | (407.7) | (2,72 3 .6) | ( 3 ,052.5) |
| Other operating cash flow | 47.9 | — | 1.0 | 1.0 |
| Cash flow from operations | 3 62 . 5 | 2 , 257 .4 | 3,9 15 . 2 | 8 ,3 58 . 7 |
| Capital expenditures | (499.7) | (580.0) | (1,000.0) | (1,000.0) |
| Acquisitions | — | — | — | — |
| Divestitures | 2.0 | — | — | — |
| Others | (294.6) | — | — | — |
| Cash flow from investing | ( 7 9 2 . 2 ) | ( 58 0.0) | ( 1 ,000.0) | ( 1 ,000.0) |
| Repayment of lease liabilities | — | — | — | — |
| Dividends paid(common& pref) | (505.0) | (505.0) | (1,221.8) | ( 3 ,10 3 .7) |
| Inc/(dec) in debt | (425.8) | — | — | — |
| Other financing cash flows | 115.0 | 0.0 | 0.0 | 0.0 |
| Cash flow from financing | ( 815 . 8 ) | ( 5 0 5 .0) | ( 1 , 221 . 8 ) | (3, 1 03. 7 ) |
| Total cash flow | ( 1 , 2 4 5 . 6 ) | 1 , 172 .4 | 1 , 6 93.4 | 4, 25 4.9 |
| Free cash flow | (1 3 7.2) | 1,677.4 | 2,915.2 | 7, 3 58.7 |
Source: Company data, Goldman Sachs Research estimates.
1d80e8d785834964a67126ca5626940f
Table of Contents
| Our thesis in six charts | 4 |
|---|---|
| High-end copper foil TAMwill grow by 122% 2025-28E CAGR, with 25-40% supply shortage ratio in 2026-28 | 5 |
| PCB copper foil to see better pricing and margin pro fi le with upgrade to high-end HVLP | 10 |
| Initiate Co-Tech at Buy with 12mTPof NT$900 | 13 |
| Financials | 22 |
| Investment thesis, TP methodology &risks | 27 |
| Disclosure Appendix | 28 |
1d80e8d785834964a67126ca5626940f
co-lechs Ast (Us+/Kg) Vs. GM as of Luzot, assuming lou% yiela
50
70,000
4,000
3,500
40
60,000
3,000
50,000
30
40,000
2,500
2,000
20
30,000
1,500
20,000
1,000
10,000
10
500
0
2025-28E CAGR of 67%
50%
Our thesis in six charts
32%
•
PCB copper foil TAM
150%
70%
60%
120%
50%
90%
40%
30%
5,000
“calet years
6,000
- TWO Co Tech 12M Fwrd PB vs. ROE
20x
17x
4,000
14x
3,000
Exhibit 1: We see solid growth of HVLP3+ copper foil demand (122% 2025-28E CAGR), which could account for 33% of the global PCB CF TAM in 2028 1,000 10% 11x 5x
3%
0
2024
2025
2026
2027E
2028E
HVLP5
HVLP4
2x
HTE/RTF
HVLP1/
HVLP2
HVLP3
Source: Company data, Goldman Sachs Global Investment Research
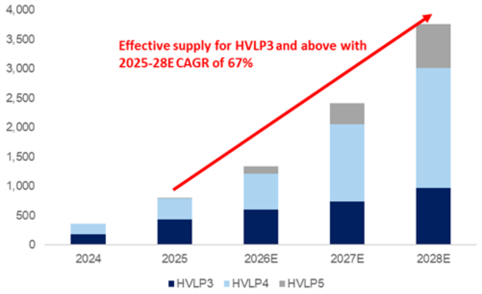
Exhibit 3: We believe the e ff ective supply of HVLP3+ capacity will go up by 67% 2025-28E CAGR tons/month
Source: Company data, Goldman Sachs Global Investment Research
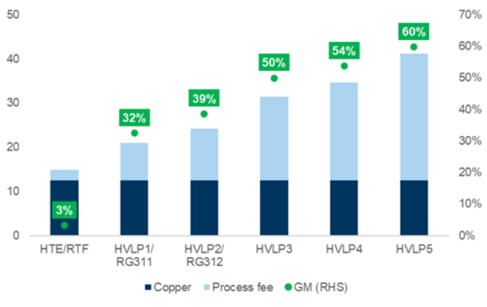
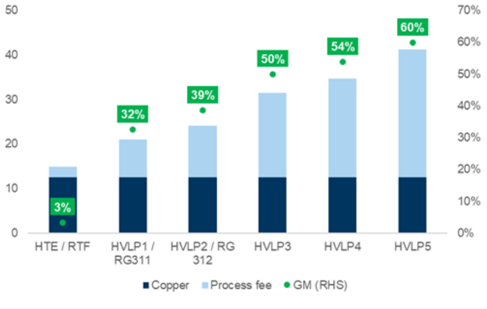
Exhibit 5: Upgrade from HTE/RTF & HVLP 1-2 to HVLP 3-5 suggests a solid ASP and GM upside
Co-Tech’s ASP (US$/kg) vs. GM as of 2026E, assuming 100% yield
Source: Company data, Goldman Sachs Global Investment Research
0%
0%
Undersupply
26%
—PB
Oversupply
3
12m fwrd ROE at 67.7%
Current:
50%
25%
60%
50%
0%
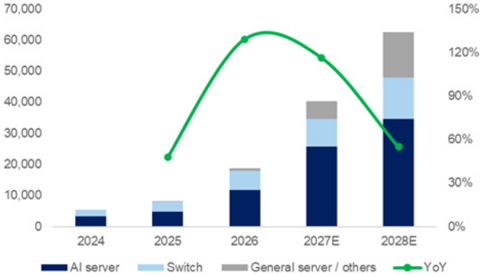
Exhibit 2: High-end CCL shipment will continue to increase, with solid demand from AI server/Switch High-end copper foil demand (tons/year) 40% 20%
10%
Jan-21
Source: Company data, Goldman Sachs Global Investment Research
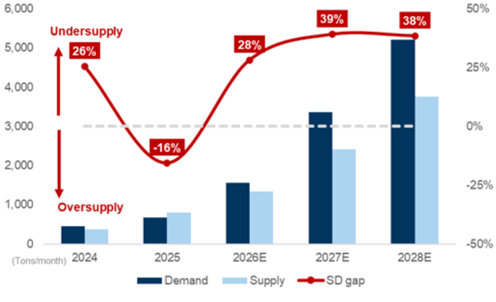
Exhibit 4: Considering the low yield rate of HVLP4+ copper foil, the industry will continue to be undersupplied in the next 2+ years

Source: Company data, Goldman Sachs Global Investment Research
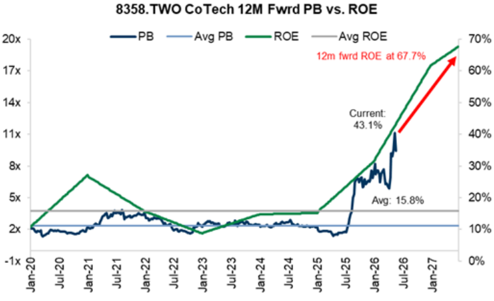
Exhibit 6: We expect Co-Tech’s ROE uptrend will continue in the coming quarters, and drive the PB multiple
Source: Company data, Goldman Sachs Global Investment Research
43.1%
54%
60%
1d80e8d785834964a67126ca5626940f
6,000
5,000
4, 000
3,000
2,000
1,000
Oversupply
(Tons/month) 2024
26%
28%
zuzoL, assuming 10u% yela
50
40
50%
High-end copper foil TAM will grow by 122% 2025-28E CAGR, with 25-40% supply shortage ratio in 2026-28 0% 20 32% 30%
20%
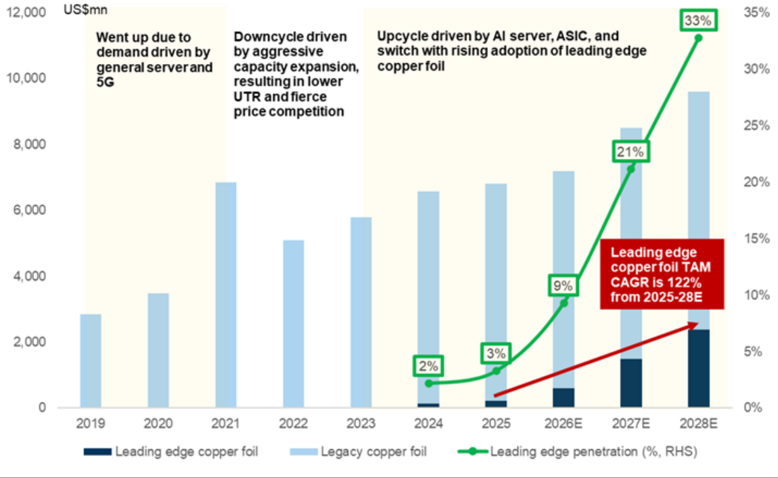
We expect the overall PCB copper foil industry to enter the 2nd round of its upcycle (at least from 2026-28) since 2020. The upcycle this time will be mainly driven by product spec upgrade demand (from HTE/RTF & HVLP1/2 to HVLP3+, and more high-end PCB will replace cables inside the AI server racks) due to the increasing data tra ffi c volume/ data connectivity speed & quality requirement from AI server/datacenters, which should have better demand sustainability at least until 2028.
Our research on the HVLP 3+ industry, which is based on our global teach team’s analysis on AI CCL/PCB (see here), suggests a 122% 2025-28E TAM CAGR for high-end PCB copper foil (HVLP3+ grade). We believe HVLP3+ copper foil will be a major growth driver for the PCB copper foil industry and estimate its TAM will reach US216mn in 2025; Exhibit 9) and account for 9%/21%/33% of the global PCB copper foil TAM.
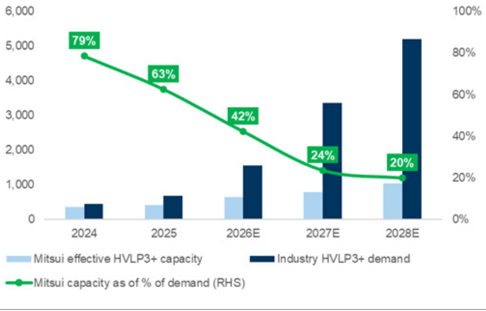
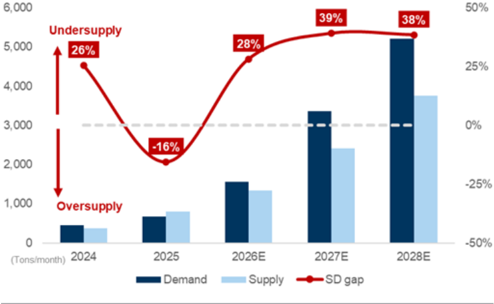
In terms of the S/D outlook, we see the industry’s overall HVLP3+ copper foil capacity to increase from ~1,000 tons/month in 2025 to 4,977 tons/month in 2028, while demand will increase from 679 tons/month in 2025 to 5,206 tons/month in 2028, implying an only 5% undersupply ratio in 2028. However, considering the key suppliers’ average HVLP3+ yield rate is only at 70-80% in the next 3 years, we believe the actual undersupply condition will be more acute, and we forecast a 28%/39%/38% undersupply ratio in 2026/27/28 (Exhibit 7) after factoring in the yield rate loss.
Overall, we see the solid upgrading trend in the PCB copper foil industry happening from 2H26 (mass adoption of HVLP3/4, upgrading from HVLP2/3), suggesting good potential for ASP/GM to rise for key high-end copper foil suppliers (Exhibit 8).
Exhibit 7: Considering the low yield rate of HVLP4+ copper foil, the industry will continue to be undersupplied in the next 2+ years
Source: Company data, Goldman Sachs Global Investment Research
Exhibit 8: Upgrade from HTE/RTF & HVLP 1-2 to HVLP 3-5 suggests a solid ASP and GM upside for high-end copper foil players erent product lines as of
Co-Tech’s ASP (US$/kg) vs. GM for di ff 2026E, assuming 100% yield
Source: Company data, Goldman Sachs Global Investment Research
-16%
2025
• Demand
2026E
• Supply
39%
38%
50%
70%
1d80e8d785834964a67126ca5626940f
FeD copper lon lam
12,000 US$mn demand driven by
10,000
general server and
8,000
6,000
4,000
2,000
2019
2020
2021
- Leading edge copper foil
Downcycle driven capacity expansion,
by aggressive resulting in lower
Upcycle driven by Al server, ASIC, and switch with rising adoption of leading edge
copperfoil
35%
30%
Exhibit 9: We see solid growth for HVLP3+ copper foil demand (122% 2025-28E CAGR), which could account for 33% of the global PCB CF TAM in 2028
PCB copper foil TAM
21%
Source: Company data, Goldman Sachs Global Investment Research
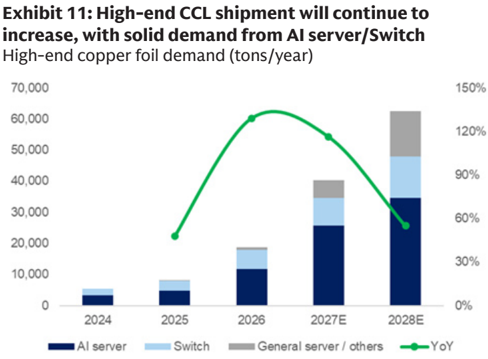
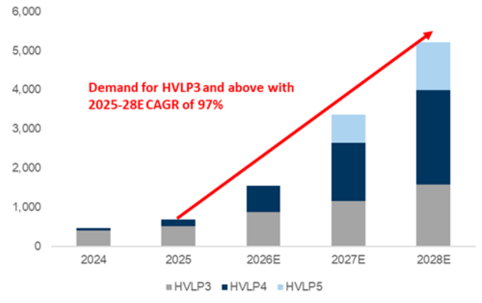
Demand analysis: AI server and switching demand continues to rise, delivering 97% 2025-28E volume demand CAGR for all HVLP3+ copper foil
We believe the overall HVLP3+ demand volume will grow by 97% 2025-28E CAGR, as we see AI server started to adopt HVLP3/4 copper foil from 2024/26 (AI server HVLP3+ volume demand will go up by 6x+ from 2025 to 2028; Exhibit 10) and Ethernet switch CCL/PCB upgrading demand is driving the overall usage of HVLP3+ CCL to grow by +3x from 2025-2028 (400G switch adopted M7 CCL with HVLP3 from 2023, and 800G switch adopted M8 CCL with HVLP 3&4 from 2H24, while we expect 1.6T switch to adopt M9 CCL with HVLP 4&5 from 2H26). Moreover, CCL/PCB for general server / agentic AI will upgrade from M6 to M7 from 2026 which will also lead to more HVLP 3+ copper foil usage, and we believe it will see a ~400% 2025-28E CAGR (Exhibit 11).
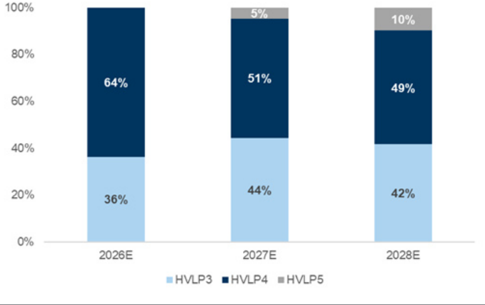
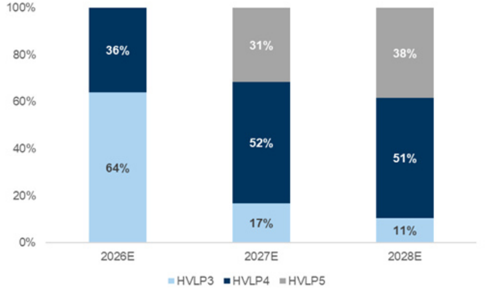
Moreover, even though we expect HVLP3+ copper foil demand volume growth to slowdown from 2027E (from 129% YoY in 2026 to 116%/55% YoY in 2027/28; Exhibit 11); the mix will shift more towards the higher-end products. HVLP3 accounted for 76% of the total high-end copper foil demand in 2025, but we estimate it will soon go down to 57%/35%/30% in 2026/27/28, while we see HVLP4’s penetration rate rising from 24% in 2025 to 43%/44%/46% in 2026/27/28 and HVLP5’s penetration rate to be 21%/23% in 2027/28E (vs. 0% before 2027).
In the near term, based on our industry checks, HVLP4 copper foil (10x higher processing fee vs. HTE copper foil, or 20% higher process fee vs. HVLP3; Exhibit 8) demand will go up by at least 100% HoH to at least 560 tons/month in 2H26, which would surpass the major supplier Mitsui Kinzoku’s capacity of 490 tons/month, implying more suppliers should see much better ASP/GM from a product demand uptrend. We believe Co-Tech will be a key bene fi ciary because it is the second supplier that is currently quali fi ed by customers. In 2H26, we expect not only Trainium 3’s HVLP4 usage to increase by at least 50% HoH (vs. 1H), but also for VR200/HGX R200 and TPU v8 to
2022
33%
1d80e8d785834964a67126ca5626940f
<U40/</|40E
Demana volume by spec (cons/ monun)
6,000
100%
5,000
80%
4,000
60%
3,000
40%
2,000
20%
1,000
0%
36%
31%
Demand for HVLP3 and above with
2025-28E CAGR of 97%
52%
64%
Exhibit 10: HVLP3+ demand volume will grow by 97% 2025-28E CAGR Demand volume by spec (tons/month) 2028E 2028E
HVLP3 •HVLP4 -HVLP5
•HVLP3 HVLP4 = HVLP5
High-end copper lot demand (lons/ yedr)
100%
70,000|
60,000
80%
150%
120%
38%
begin procurement on HVLP4. This should drive HVLP4 penetration in AI applications to above 50%. We expect this strong demand momentum to continue into 1H27 and accelerate further in 2027-28, implying additional ASP/GM upside for key suppliers (see next section for details). 30%
36%
5%
44%
42%
Source: Company data, Goldman Sachs Global Investment Research
Exhibit 13: We expect more HVLP5 will be used in the high-end Ethernet switch market
Source: Company data, Goldman Sachs Global Investment Research
10,000
20%
0%
Source: Company data, Goldman Sachs Global Investment Research
Exhibit 12: We expect HVLP 4+5 will account for 36%/83%/89% of total AI server copper foil usage in 2026/27/28E
Source: Company data, Goldman Sachs Global Investment Research
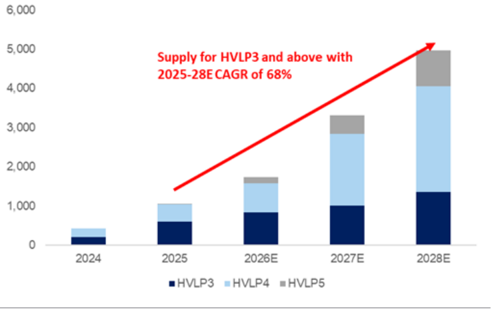
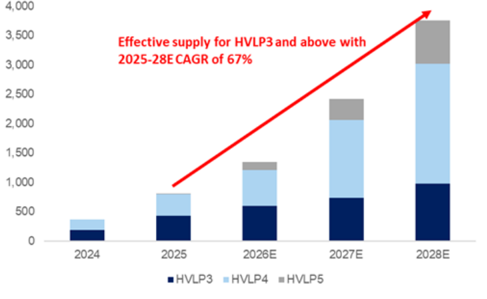
Supply analysis: E ff ective HVLP3+ capacity will go up by 67% 2025-28E CAGR, but it’s not enough to support all high-end customers’ demand, with low yield rates
Based on our industry supply analysis, we see the overall HVLP3+ capacity will go up by 68% 2025-28E CAGR, from 1,057 tons/month in 2025 to 4,977tons/month in 2028. However, considering the yield rate loss and the potential capacity loss when transferring the capacity from one generation to the next (normally 10-20% loss), we believe the industry’s e ff ective capacity will only go up from 803 tons/month to 3,759 tons/month (67% 2025-28E CAGR).
Based on each high-end copper foil supplier’s capacity expansion plans, we believe HVLP3/4/5 capacity will grow by 31%/82%/353% 2025-28E CAGR, while suppliers are now transferring their mid-to-low end capacity to high-end HVLP3+ capacity, and we expect the transformation will continue in the coming years due to long capacity
1d80e8d785834964a67126ca5626940f
6,000
5,000
4,000
3,000
2,000
1,000
Supply for HVLP3 and above with
2025-28E CAGR of 68%
2025-28E CAGR of 67%
expansion lead times. However, going into 2027-28, we could start to see suppliers converting HVLP3 capacity into HVLP4/5 due to the much better ASP/GM as well as customers’ stronger demand for HVLP4/5. We believe the capacity transformation from HVLP3 to HVLP4/5 will lead to a 10-20%+ capacity loss, and lead to continued overall HVLP3+ industry tightness.
Exhibit 14: We believe HVLP3+ industry capacity will go up by 68% 2025-28E CAGR
Industry HVLP3+ capacity trend (tons/month)
Source: Company data, Goldman Sachs Global Investment Research
Exhibit 15: We believe the e ff ective supply (considering yield rate & capacity transformation loss) of HVLP3+ capacity will go up by 67% 2025-28E CAGR tons/month
Source: Company data, Goldman Sachs Global Investment Research
Supply / Demand outlook: Undersupply will be a new normal in the foreseeable future, while Co-Tech could be a key market share gainer considering Mitsui’s relatively conservative capacity expansion plan
As discussed above, we expect demand to grow at a 97% CAGR over 2025-28E, outpacing supply growth of 67-68% over the same period. In absolute terms, demand is projected to reach ~1.6k/3.4k/5.2k tons per month in 2026/27/28, versus industry capacity of ~1.7k/3.3k/5.0k tons per month, implying a modest undersupply of ~2%/5% in 2027/28.
However, adjusting for the typical HVLP3+ industry yield of ~70-80%, we estimate e ff ective capacity at only ~1.3k/2.4k/3.8k tons per month. This implies a signi fi cantly tighter supply-demand balance, with undersupply widening to ~28%/39%/38% in 2026/27/28 (Exhibit 16).
Considering Mitsui’s position as the market leader, our channel checks suggest that customers will prioritize orders with the company before allocating to second suppliers, pending su ffi cient improvement in their product quality. However, due to capacity transformation losses and yield rate di ff erences across di ff erent product grades, Mitsui’s HVLP3+ capacity is expected to reach only 718/870/1140 tons/month in 2026/27/28E, albeit still implying a 35% 2025-28E CAGR. As a result, we believe a second source for HVLP3+ products is necessary, as Mitsui is likely to maintain 100% UTR but still lack su ffi cient capacity to meet total customer demand (Exhibit 17). This supports our positive view on Co-Tech’s HVLP3+ opportunity, who is the second HVLP 4 supplier currently quali fi ed by customers.
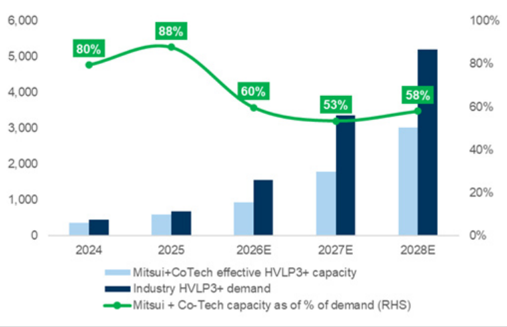
As a result, we do believe both Mitsui and Co-Tech will be working under full utilization with the solid demand outlook, but even then, the two companies would only support 50-60% of industry demand in the next three years (Exhibit 18). Assuming both tons/ month
4,000
3,500
1d80e8d785834964a67126ca5626940f
cons/ monun
6,000
6,000
5,000
5,000
4,000
4, 000
3,000
3,000
2,000
2,000
1,000
1,000
0
26%
Oversupply
50%
100%
80%
tons / month
6,000
5,000
79%
100%
80%
companies work under 100% UTR, market share dynamics will be driven by the pace of capacity expansion and their ability to improve yield rates. In all, we believe the capacity shortage in the HVLP3+ industry should be relatively signi fi cant in the coming years, suggesting a new normal, which in our view, would lead to wide room for suppliers’ to raise pricing. -25% .
2024
2025
2026E
2027E
2028E
Exhibit 17: Mitsui’s HVLP3+ capacity will continue to go up, but not fast enough to catch up with demand, making us more positive on Co-Tech’s market share outlook tons / month
Source: Company data, Goldman Sachs Global Investment Research
0%
0%
Exhibit 16: Our S/D analysis suggests the HVLP3+ industry will see a 28/39/38% undersupply in 2026/27/28
-Mitsui + Co-Tech capacity as of % of demand (RHS)
Source: Company data, Goldman Sachs Global Investment Research
Exhibit 18: Even if we include Mitsui + Co-Tech’s e ff ective capacity, only 50-60% of industry demand in 2026-28 would be met
tons/month
Source: Company data, Goldman Sachs Global Investment Research
-16%
28%
60%
39%
38%
1d80e8d785834964a67126ca5626940f
PCB copper foil to see better pricing and margin pro fi le with upgrade to high-end HVLP
PCB copper foil business model shifting from cost driven to value-driven
The low-end copper foil segment, including HTE and RTF, is primarily a cost-driven model, where pricing is determined by copper costs plus processing fee. As COGS are typically dominated by copper costs (over 80%), pro fi tability in this segment largely depends on whether the processing fee is su ffi cient to cover non-copper costs. This segment is dominated by Chinese suppliers with signi fi cant installed capacity. This market has historically exhibited a tendency for heightened processing fee competition during periods of capacity expansion, a pattern that became evident following the peak in the PCB copper foil market in 2021. Since then, we continue to see persistent price pressure in the low-end copper foil market amid signi fi cant capacity expansion coming online, with some suppliers operating at or below break-even levels.
Co-Tech has been transitioning away from the low-end copper foil market through the development of its RG product line, which was designed to benchmark Mitsui Kinzoku’s HVLP1/2 o ff erings, while maintaining a more competitive price. RG entered MP (mass production) in 2021 and has since gained a dominant share in the general server market (~60% market share in 2025), supported by limited competition due to higher technology barriers. This marks Co-Tech’s transition away from a cost-driven model towards a value-driven one. While pricing still follows a copper cost plus processing fee structure, the processing fee is now increasingly determined by supply demand dynamics rather than a low mark up over copper costs.
We observe that high-end HVLP (HVLP3 and above) has shifted towards a fully value-driven model, as high-end HVLP typically achieves GM of 40%+ (Exhibit 19). While copper costs account for less than 70% of total COGS in high-end HVLP, we expect additional GM expansion driven by the onging improvement in production yields (Exhibit 20). Given the limited number of suppliers with both the necessary technology and MP capability, we expect processing fees to remain determined by supply demand dynamics as supply is likely to be in shortage starting from 2H26 and extending into 2027/28, pricing power is expected to be sustained over the medium term.
1d80e8d785834964a67126ca5626940f
50
40
30
20
10
HVLP1/
RG311
70%
60%
50%
20
Exhibit 19: High-end HVLP typically has GM above 40% Co-Tech’s ASP (US$/kg) vs. GM for di ff erent product lines as of 2026E, assuming 100% yield
20%
10
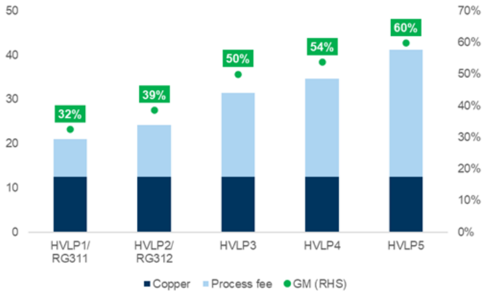
Assume copper price at US$12.5 and yield at 100%
Source: Goldman Sachs Global Investment Research
PCB Copper foil is transitioning to high-end HVLP for AI servers/networking switches to seek better signal integrity
Copper foil is a core material in server PCB/CCL as it forms a conductive layer that carries both high-speed signals and power delivery across the board. As servers move toward higher speed, copper foil plays a critical role in determining signal integrity, thermal stability, and overall performance.
The majority of copper foil used in PCB/CCL, including HTE (high temperature elongation), RTF (reverse treated foil), RG (advanced RTF) and HVLP (hyper very low pro fi le), all started from the core electrodeposition (ED) process, but di ff ers mainly in the degree and type of surface engineering applied after the ED process. After the ED process, a bare copper foil is formed and features two surfaces: a smooth side (drum side) and a rough side (matte side). For HTE copper foil, treatments are conducted on the rough side to improve adhesion for resin bonding in CCL production. In addition to strong adhesion, HTE also demonstrates several characteristics such as better thermal stability, higher elongation, and balanced performance vs. costs. HTE is wildly used in PCB/CCL manufacturing and has historically been the standard material for the mainstream consumer electronics, low-end servers, etc.
The surface pro fi le (surface roughness) of the treated side directly a ff ects signal
loss. While HTE o ff ers strong adhesion at a low cost, its relatively rough surface results in higher signal loss. As PCB signal speed/frequency requirement continues to increase, this has driven the transition toward lower-pro fi le copper foil such as RTF, RG and HVLP. RTF is a type of re fi nement of the ED copper foil, by applying surface treatment (roughening) to the smooth side rather than the rough side, hence the name reverse treatment, RTF reduces the surface roughness on the signal side compared to HTE but with a higher cost. RG is a more advanced type of RTF developed by Co-Tech, which was originally designed to deliver a lower surface pro fi le approaching HVLP1/2 performance but at a lower price, which is mainly used in general servers, networking switches and LEO.
50%
54%
60%
Case yield Or ou%
30
47%
55%
50%
Exhibit 20: GM for HVLP4 to further expand with ongoing yield improvement Co-Tech’s cost (US$/kg) vs. GM for HVLP4 in 2026E with base
case yield of 50%
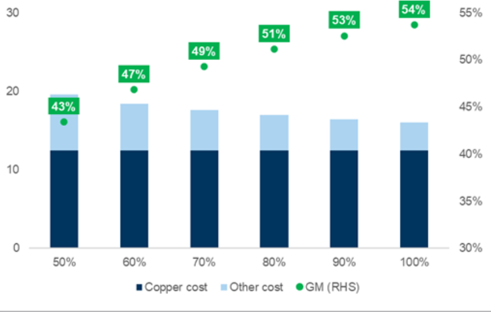
Source: Goldman Sachs Global Investment Research
43%
•
50%
49%
53%
54%
1d80e8d785834964a67126ca5626940f
canal crescopper tonspectatons are lo dus toware lower sullace roug mess (ne)
RTF
RG (advanced RTF)
Untreated side < 8.0um Untreated side < 7.0um Untreated side < 0.3um
Treated side
Exhibit 21: PCB copper foil speci fi cations are migrating toward lower surface roughness (Rz)
Untreated side
Treated side < 5.0um
Source: Company data, Goldman Sachs Global Investment Research
As AI servers/networking switches continue migrating to higher transmission speed and frequency, signal integrity in copper foil for these high-end applications are primarily a ff ected by the skin e ff ect, where current tends to concentrate on the treated surface of copper foil instead of evenly fl owing through most of the copper. As a result, lower copper surface roughness (Rz) becomes more critical to reduce signal loss, and HVLP (hyper very low pro fi le) is the solution to this. Copper foil’s surface roughness typically ranges at <5.0 µ m for RTF, <2.3 µ m for RG, and 0.5-2.0 µ m for HVLP.
As PCB copper foil migrates toward HVLP, technological barriers increase signi fi cantly. There is a practical surface roughness limit of ~1-2 μ m, to achieve roughness below this level (HVLP3 and above) requires nano-scale control of copper grain growth morphology during both the ED and treatment processes. Balancing ultra-low surface roughness with su ffi cient adhesion therefore demands advanced process capabilities and extensive know-how, including nano-structure engineering and sophisticated chemical treatment technologies. As a result, high-end HVLP represents a signi fi cant barrier to entry for new participants.
Low-end HVLP (HVLP1 & 2) are usually used in 100G/400G Switch, high-end general server and low-end AI server. As CCL grades continue to advance and as PCB layer count continues to increase, mainstream CCL grade for the current AI servers/networking switch is transitioning from M7 to M8 in 2026, with HVLP2/3 currently being the mainstream speci fi cation. We expect HVLP4 copper foil to emerge as the mainstream for the most advanced AI servers and networking switch in 2026, primarily driven by next-gen platform demand from both Nvidia and AWS. For Nvidia, we expect VR200’s midplane (with 44 layers) and switch board (with 24 layers) to adopt M9 grade CCL with HVLP4 copper foil (see here), while we also expect AWS Trainium 3 UBB (with 28-30 layers) to see an upgrade to higher grade CCL with HVLP4 copper foil.
CCL grade migration is typically accompanied by corresponding upgrades in copper foil. We see the latest M8/M9 CCL to have high exposure to HVLP4 copper foil, while M10 CCL is unlikely to ramp before mid-2027 targeting for next-gen (N+2) AI servers and 3.2T networking switches. As such, we expect HVLP4 to remain the mainstream high-end copper foil over 2026-28. HVLP5 is still in an early phase with target surface roughness to reach below 0.5 µ m, we expect initial usage will be driven by 3.2T Switch and to see more adoption of HVLP5 starting in 2028.
Treated side < 2.3um
Treated side < 2.0um
1d80e8d785834964a67126ca5626940f
Eanmule eee nuure cupper tonls sammo mportance lor currenle anlu luture gell al sel vers anlu hetwornllo switches
Exmolt 4o. we belleve co-lech shver copper ton revenue will go up trom 970114029 101470140405
2015
M4 CCL
2016
2017
Copperfoil grade: HTE
2018
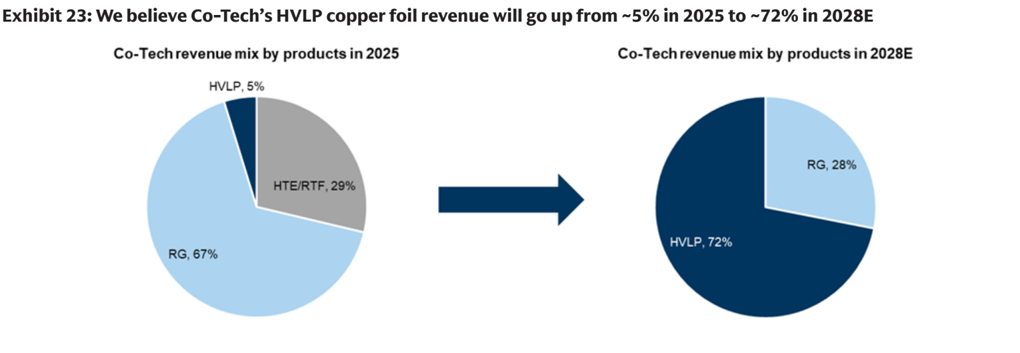
HVLP, 5%
Exhibit 22: HVLP4 copper foil is gaining importance for current and future gen AI servers and networking switches
RG, 28%
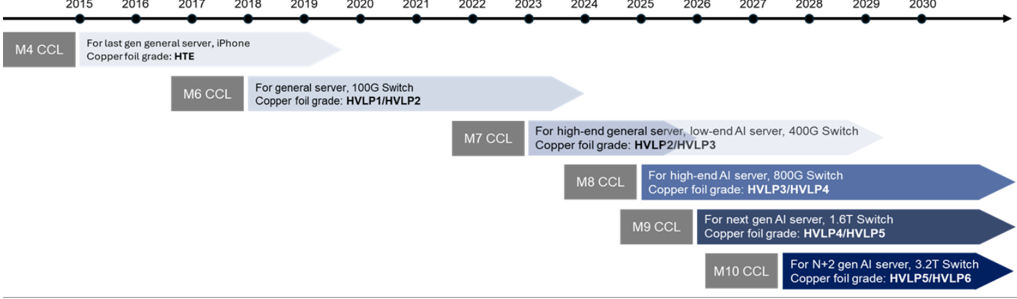
Source: Goldman Sachs Global Investment Research
Initiate Co-Tech at Buy with 12m TP of NT$900
We initiate Co-Tech with a Buy rating, and a 12m TP of NT$900 (110% upside)
We believe Co-Tech will be a key bene fi ciary of the high-end copper foil demand expansion driven by AI servers and networking switches (with demand expected to grow at a 97% 2025-28E CAGR). Accordingly, we forecast its market share in HVLP3+ supply chain to increase from 5% in 2025 to 20/42/53% in 2026/27/28E and for its HVLP3+ to contribute ~77% of 2028E gross pro fi t vs. 8% in 2025, driven primarily by margin expansion (we assume HVLP3+ GM improves to ~51% in 2028E vs. ~40% in 2025). We see potential upside on margins supported by better yield and increased process fees. In our Blue sky scenario, we assume high end HVLP copper foil production yield reaches 68%/75% (vs. base case of 53%/60%) in 2026/27E and sees an additional process fee hike of 40%/53% (base case of 10%/23%) in 2026/27E. We see potential earnings upside of 53%/56% in 2026/27E in our blue sky scenario vs. our base case. We believe Co-Tech will continue to see further yield improvement driven by volume ramp up, and also room for signi fi cant upward processing fee adjustments amid the supply shortage environment.
Source: Company data, Goldman Sachs Global Investment Research
2019
2020
.
2021
•
2022
2023
2024
2025
2026
2027
2028
2029
Co-Tech revenue mix by products in 2028E
2030
1d80e8d785834964a67126ca5626940f
cu-lechs aor (use/ton ve. am for amerent product thes
50
40
30
20
10
3%
HTE/RTF
70%
60%
50%
70%
60%
50%
Exhibit 24: Upgrade from HTE/RTF & HVLP 1-2 to HVLP 3-5 suggests solid ASP and GM upside Co-Tech’s ASP (US$/ton) vs. GM for di ff erent product lines 30%
20%
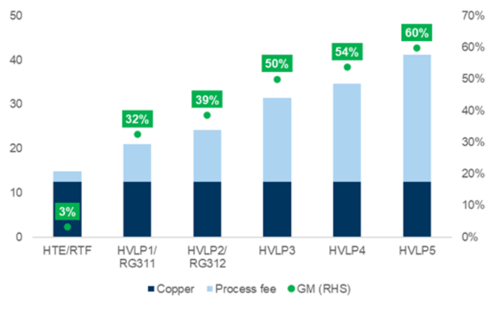
Source: Goldman Sachs Global Investment Research
Key earnings drivers
(1) Proactive pricing strategy during upcycle to support GM expansion
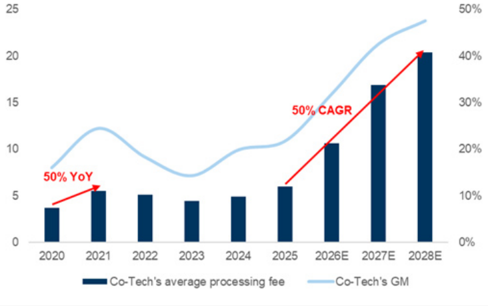
We expect Co-Tech to bene fi t from the undersupplied environment, and we believe the shortage ratio for the HVLP3+ industry will be at ~25-40% in 2026-28. The company has been more proactive with its pricing strategy during shortage periods. During the last upcycle in 2021, Co-Tech’s GM exceeded that of Mitsui Kinzoku’s copper foil business (Co-Tech’s GM expanded 8.4ppt YoY and reached 24.4% in 2021 while Mitsui Kinzoku’s copper foil business’ GM expanded 6.1ppt YoY and reached 23.8% in 2021), supported by a ~50% YoY increase in processing fees at the time. For the current cycle starting from 2025, we expect processing fees to deliver a sustainable 50% CAGR over 202528E , driven by continued pricing adjustments and product mix upgrades (with ~25% of the average processing fee uplift driven by price increase and ~75% driven by product mix shift). We assume 4-13% price adjustment for Co-Tech’s high-end copper foil processing fee over 2026-28 vs. 50% processing fee hike in 2021, suggesting further upside to our assumptions.
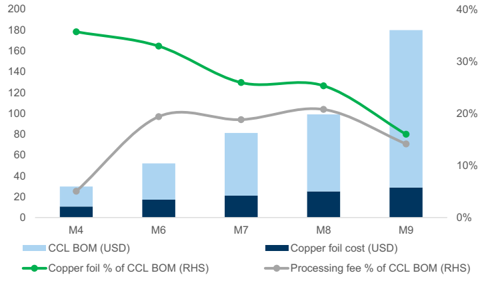
Furthermore, we expect Co-Tech to be in a stronger position to implement price increases, with copper foil processing fees accounting for only 14% of M9 grade CCL BOM vs. 19/19/21% for M6/M7/M8 grade CCL (Exhibit 28), since end customers are less sensitive to a processing fee increase for the latest M9 grade CCL. At the same time, CCL producers now have a stronger ability to fully pass through cost increases to end customers, which further supports upstream suppliers’ pricing power (including copper foil, resin, glass fi ber, etc). In addition, with potential supply tightness in high end HVLP copper foil, we believe the current market environment is more conducive for price increases to be accepted across the supply chain.
50%
54%
60%
GM (LHS)
80%
70%
65%
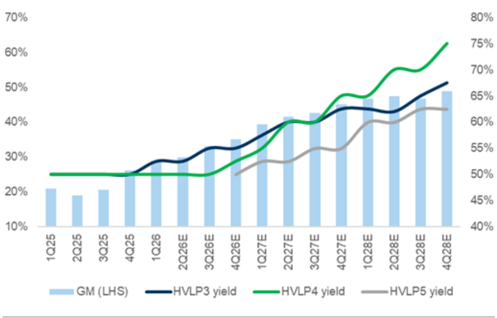
Exhibit 25: We also expect an improvement in production yield to drive GM Co-Tech’s yield for HVLP3+ & GM 55%
50%
Source: Goldman Sachs Global Investment Research
1d80e8d785834964a67126ca5626940f
25
20
15
10
5
•
50%
40%
Exhibit 26: Co-Tech is proactive in its pricing and capacity expansion plan. We expect GM to exceed Mitsui’s in 2027/28E 20%
50% YoY
2020
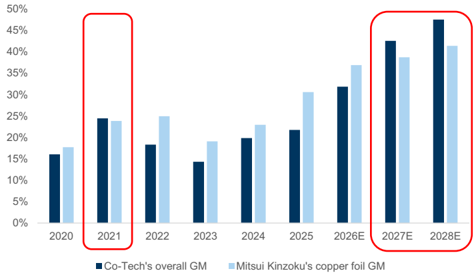
Source: Company data, Goldman Sachs Global Investment Research
Exhibit 28: % of copper processing fees to total CCL BOM is relatively low for decline in M9 CCL, more upside for price hikes
As of 2026E
Source: Goldman Sachs Global Investment Research
Exhibit 27: We expect to see Co-Tech’s avg processing fee increase at a 50% CAGR over 2025-28E
Source: Company data, Goldman Sachs Global Investment Research
Exhibit 29: Copper foil accounts for ~18% of M8 CCL ASP As of 2026E
Source: Goldman Sachs Global Investment Research
(2) Solid HVLP4 demand growth will drive Co-Tech’s revenue and earnings in the LT We estimate the TAM for high-end copper foil value to reach US216mn in 2025 with 122% 2025-28e CAGR) and account for 33% of the total global PCB copper foil market in 2028E, with high-end copper foil ASP 2x+ higher than HTE copper foil and high-end copper foil’s GM is generally 40-60%+ vs. HTE at 0-10%. Moreover, we believe Co-Tech will continue to gain share in the high-end copper foil market, supported by ongoing capacity expansions that allow it to capture demand amid a persistent shortage of supply.
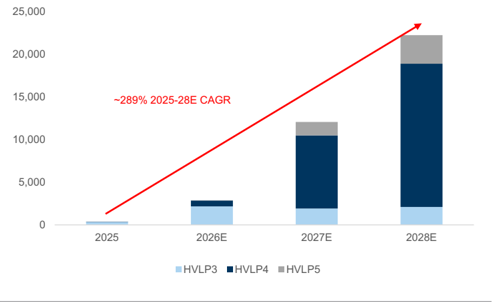
As such, we continue to see Co-Tech’s e ff ort in transitioning from legacy copper foil (including HTE/RTF) products to HVLP copper foil, which should drive Co-Tech’s HVLP revenue to grow at a 289% 2025-28E CAGR and also lead to a better product mix and GM/OPM level in the long term (Exhibit 31). We forecast Co-Tech’s HVLP gross pro fi t to grow at an even higher 2025-28E CAGR of +24x.
1d80e8d785834964a67126ca5626940f
100%
80%
60%
40%
20%
0%
50%
40%
Exhibit 30: We believe Co-Tech’s HVLP revenue will grow at a ~289% 2025-28E CAGR, considering its ongoing expansion and market share gain 20%
Co-Tech’s HVLP revenue (NT$mn)
2020
HTE/RTF
Source: Goldman Sachs Global Investment Research
Exhibit 31: We believe the increasing HVLP copper foil contribution will drive the company’s GM Co-Tech’s product mix and GM
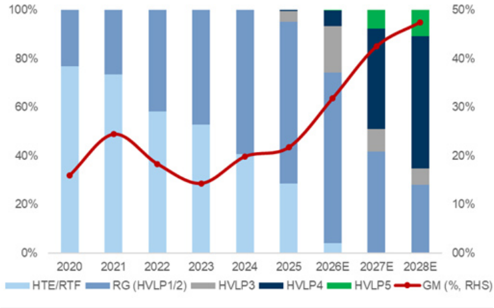
Source: Goldman Sachs Global Investment Research
(3) Expansion comes at a favorable time, enabling market share gains amid shortage environment
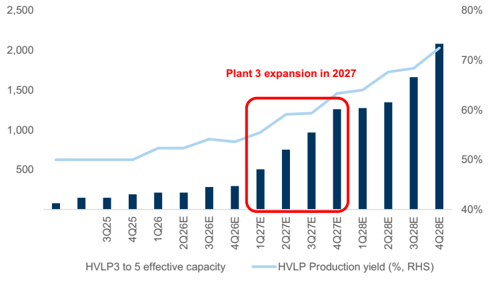
We estimate Co-Tech’s e ff ective capacity (after yield) for high end HVLP to reach ~1,200 tons/month by 2027 end upon completion of Plant 3, vs. management guidance of ~800tons/month. The di ff erence is mainly driven by our yield assumptions (our analysis suggests management’s guidance of ~800tons/month is based on 50-55% yield vs. ~60% per GSe). Management’s guidance only includes HVLP’s e ff ective capacity from Plant 3 whereas our estimates also include HVLP capacity previously converted from HTE/RTF during 2025-26, resulting in an additional ~300tons/month of HVLP e ff ective capacity.
In 2020, Co-Tech announced Plant 3 for RG production which has now been recon fi gured toward HVLP amid accelerating AI server demand. The HVLP capacity is expected to ramp through 2027, aligning well with client demand in a supply shortage environment. Other than Co-Tech, Mitsui Kinzoku targets to further expand HVLP copper foil (including HVLP 1 to 5) capacity (before yield) to 1,200 tons/month by Sept 2028 (from the current ~720 tons/month). However, aside from these players, we do not expect any other major high end copper foil suppliers to expand capacity expansion throughout 2027-28, given the typical 1.5-2 year lead time required for high-end copper foil expansion. Co-Tech’s Plant 3 is expected to be fully ready by end of 2027 and will enable the company to have the necessary capacity to capture market share amid a structurally tight supply environment.
Furthermore, we expect Co-Tech to fl exibly transition between HVLP3 to 5, with ~15% transition loss (a production line with 100 tons of HVLP3 capacity may decline to 85 tons when converting to HVLP4). This should enable the company to dynamically allocate high-end copper foil capacity and respond to shifting customer demand.
1d80e8d785834964a67126ca5626940f
Exhibit 32: Co-Tech’s Plant 3 will expand throughout 2027, with more upside to e ff ective capacity if production yield
improves faster than expected ective capacity (tons/month) for HVLP3+ and
Co-Tech’s e ff overall HVLP3+ yield
Source: Company data, Goldman Sachs Global Investment Research
Exhibit 33: Mitsui Kinzoku’s HVLP copper foil capacity to expand to 1,200tons/month, at a pace slower than Co-Tech
tons/month
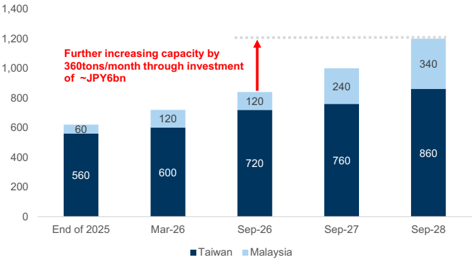
HVLP capacity includes HVLP1 to 5
Source: Company data, Goldman Sachs Global Investment Research
We continue to see improvement in Co-Tech’s cost structure
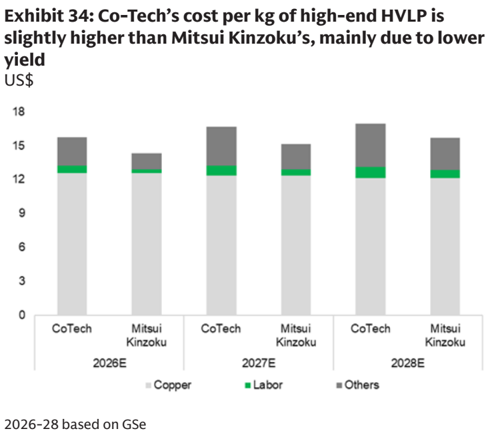
We expect Co-Tech’s overall COGS in 2026 to consist of ~80% copper cost, with the remaining ~20% in other variable costs (including labor, electricity, auxiliary materials, chemicals, etc). As copper input costs are largely the same between Co-Tech and Mitsui Kinzoku, we continue to see Co-Tech’s higher overall variable costs being driven primarily by a yield di ff erence (we assume Co-Tech’s HVLP3+ yield at 50-55% and Mitsui Kinzoku’s to be c.20-30% higher than Co-Tech’s, Exhibit 34).
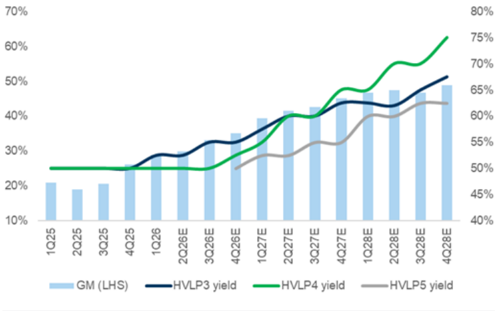
We expect variable costs to decline by 2/13/17% for HVLP3/4/5 respectively between 2026 and 2028, primarily driven by yield improvements (overall HVLP3+ yield rising to ~70% in 2028 from 50-55% in 2026). This improvement in cost e ffi ciency is the key driver behind Co-Tech’s GM expansion, with HVLP3+ GM increasing from 32.7% in 2026E to 47.9% in 2028E.
The jump in yield improvement is consistent with industry practice, as copper foil suppliers typically see a step-up in yield once production volume ramps, supported by process optimization and more stable operating conditions. We therefore expect Co-Tech to bene fi t from the learning curve and deliver meaningful yield improvement for high-end HVLP, from the current 50-55% starting in 2026, with overall yield potentially exceeding 70% over the next 2-3 years, or even sooner, supporting margin expansion as high-end HVLP contribution increases.
1d80e8d785834964a67126ca5626940f
18
15
12
9
6
3
CoTech
2026-28 based on GSe
70%
60%
50%
Source: Company data, Goldman Sachs Global Investment Research
Sensitivity analysis on Co-Tech’s EPS driven by price hike and improved yield
Our base case 2026/27E EPS of NT25.8 are based on a high-end HVLP yield of 53%/60% and a processing fee increase of 10%/23% in 2026/27E. We believe that, alongside yield improvements, rising processing fees will be a key contributor to revenue and earnings expansion for Co-Tech. We conduct sensitivity analysis on Co-Tech based on additional process fee hikes and faster yield improvement, as both are key swing factors for earnings during the current upcycle.
In our Blue sky scenario, we assume high-end HVLP copper foil production yield reaches 68%/75% (additional 15% improvement from base case) in 2026/27E and sees a process fee hike of 40%/53% (an additional 30% increase from base case) in 2026/27E. We see potential earnings upside of 53%/56% in 2026/27E in our Blue sky scenario vs. our base case. We believe Co-Tech will continue to see further yield improvement driven by volume ramp up, while also having additional room for upward processing fee adjustments amid the supply shortage environment.
As a result, even modest changes in yields or fee hikes can lead to an outsized impact on gross margin and EPS, particularly as high-end HVLP carries signi fi cantly higher value-add than conventional copper foil. Sensitivity analysis therefore helps frame the potential earnings upside under di ff erent ramp scenarios, especially as Co-Tech enters a phase of accelerating product mix upgrades and a pricing hike environment.
- GM (LHS)
80%
70%
65%
Exhibit 35: Co-Tech’s yield for HVLP4 is expected to improve the most due to the faster volume ramp up
50%
45%
Source: Company data, Goldman Sachs Global Investment Research
1d80e8d785834964a67126ca5626940f
Iu years is de lox camble so. sensruvily anlalyol un co lecll o cro vaseu unl vatlous prouuctron ylelus anlu price mines
2026E EPS
35x
Process
30x fee hike
25x
2027E EPS
15x
10x
5x
Process fee hike
Ox
- TWO Co Tech 12M Fwrd PE
10%
HVLP production yield
58%
63%
10.2
20%
11.4
10.6
11.9
68%
11.5
12.8
Fis marapre mthe comms years
2026E EPS change
- TWO Co Tech 12M Fwrd PB vs. ROE
20x
0%
— PB|
Process
10%
53%
0%
12%
HVLP production yield
17%
21%
11.0
+2 SD: 27.1x
17x
Exhibit 36: Sensitivity analysis on Co-Tech’s EPS based on various production yields and price hikes fee hike
Current:
26%
39%
60%
50%
53%
| Avg: 16.3> 11x | Avg: 16.3> 11x | Avg: 16.3> 11x | Avg: 16.3> 11x | 43.1% 40% | 43.1% 40% | 43.1% 40% | 43.1% 40% | ||||
|---|---|---|---|---|---|---|---|---|---|---|---|
| HVLP production yield | 2027E EPS change | HVLP production yield | |||||||||
| 60% | 65% | 70% | 75% | 8x | 60% | 65% | 70% | 75% 30% | |||
| 23% | 25.8 | 27.6 -1 SD: 10.9x | 29.4 | 31.2 | 5x | 0% | 0% | 7% | 14% Avg: 15.8% | 21% 20% | |
| 33% | 28.3 | 30.2 -2 SD: 5.5x | 32.2 | 34.2 | Process | 10% | 10% | 17% | 25% | 33% | |
| 43% 53% | 30.7 33.2 | 32.9 35.5 | 35.0 37.9 | 37.2 40.2 | tee hike 2x | 20% 30% | 19% 29% | 28% 38% | 36% 47% | 44% 56% 10% | |
| 28100880089003901390033018 | 0% | 0% | 0% | 0% |
Source: Goldman Sachs Global Investment Research
Valuation: Initiate Co-Tech at Buy with a TP of NT$900 (upside potential 110%)
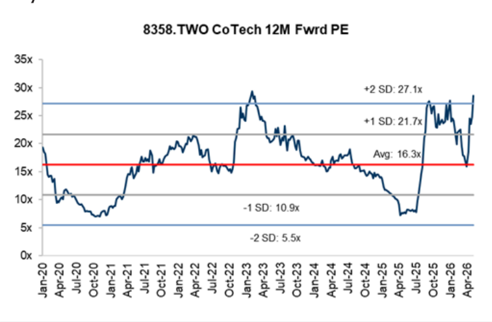
We initiate Co-Tech with a Buy rating and 12-month target price of NT$900, implying 110% potential upside. Our target price is based on 22x 2028E P/E (discounted back to 2027E based on CoE of 11%), which is +1SD above the company’s average upcycle valuation in the past 10+ years (as we believe the industry’s structural upgrading trend will continue to drive a robust earnings outlook; we expect Co-Tech’s earnings to grow by 120% 2025-28E CAGR).
Our TP implied 18.5x 2027E P/B, which is much higher than the company’s average PB multiple of 3.2x in the past; however, the company’s PB/ROE at 22x, is in line with the last upcycle PB/ROE of 20-23x. Moreover, we expect the company’s ROE will increase from 15% in 2025 (which is already at a 3-year high) to 31%/62%/74% in 2026/27/28.
Exhibit 37: Co-Tech’s avg fwd PE multiple in the past 10-years is at 16x
Source: Company data, Goldman Sachs Global Investment Research
Exhibit 38: The solid ROE uptrend suggests a much higher P/B multiple in the coming years
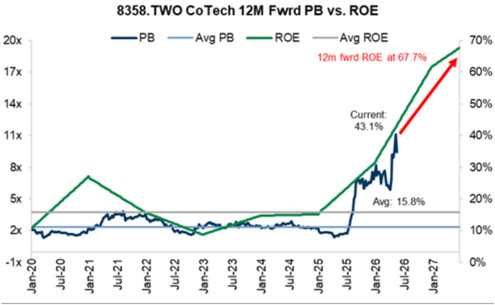
Source: Company data, Goldman Sachs Global Investment Research
12.3
12m fwrd ROE at 67.79
1d80e8d785834964a67126ca5626940f
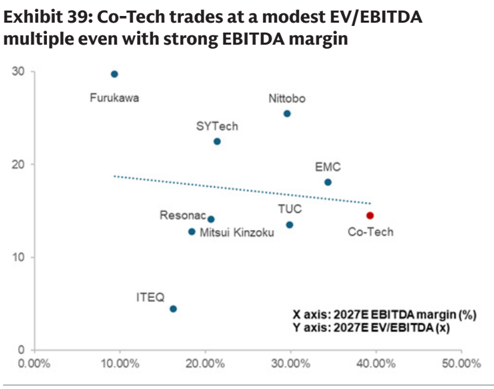
maraple even with strong Collba maron
30
20
10
0.00%
•
SYTech having strong nur
25
20
Source: Company data, Goldman Sachs Global Investment Research
Key risks
(1) Earlier than expected CPO adoption in computing ICs :
If CPO technology progresses ahead of expectations, electrical signal transmission within PCB would be partially or materially replaced by direct optical interconnections at the packaging level. This would reduce the demand for HVLP copper foil, for which current demand is driven by signal integrity requirements. As a result, demand could shift back to more cost-e ffi cient, lower-end RG or RTF copper foil.
- (2) Slower than expected yield rate improvement speed : production yield directly impacts the production costs and e ff ective output. If yield improvement is slower than expected, it could result in higher COGS, slower margin expansion and lower production output, thereby limiting the pace of market share gain.
- (3) Much stronger than expected capacity growth from HVLP peers : The copper foil industry is characterized by pricing pressure during periods of excess capacity, as intensi fi ed competition forces suppliers to reduce prices to sustain UTR. We see limited risk of oversupply in HVLP copper foil, given its high technological barriers to entry, despite its signi fi cantly higher margins.
Scenario analysis - What if CPO adoption happen and impact the TAM growth of high-end copper foil
CPO (co-packaged optics) is an emerging networking architecture that integrates optical transceivers directly within switch ASIC on the same substrate. By moving optical components closer to the switch ASIC, CPO signi fi cantly reduces the length of the high-speed electrical interconnects on traditional PCBs, thereby improving power e ffi ciency, signal integrity, and bandwidth density for next gen AI server/networking switches.
CPO technology could potentially reduce the need for high-end PCB copper foil by shifting high speed signal transmission from electrical routing on PCBs to optical interconnects at the packaging level. PCB will continue to be required for power delivery and lower-speed signal routing, but its role in high speed/high frequency transmission is reduced. As a result, with short electrical traces remaining on PCB, the speci fi cation for
Nittobo
X axis: 2027E ROE (%)
Exhibit 40: Co-Tech trades at a modest 2027E PB despite having strong ROE
Furukawa
_ Nittobo ®
Resonac
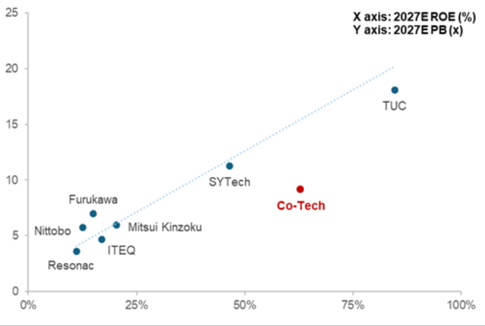
Source: Company data, Goldman Sachs Global Investment Research
1d80e8d785834964a67126ca5626940f
the copper foil within may gradually shift back toward lower-end grades (RTF or RG copper foil) as high speed signal integrity requirement on PCB becomes less critical.
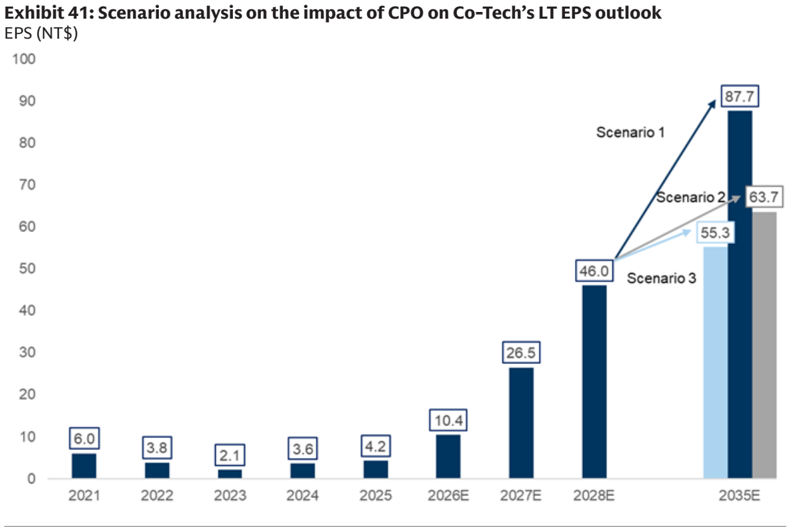
We outline three scenarios for Co-Tech’s 2035E EPS outlook:
Scenario 1: AI server foil TAM growth CAGR decelerates to 6% for 2028-35E , we assume AI server/networking switch continues to apply HVLP copper foil within PCB, and Co-Tech expands its total e ff ective capacity (including RG and HVLP) along with AI server copper foil TAM growth to maintain its stable market share. Copper foil pricing only re fl ects in fl ation (2% each year) throughout 2028-35E with no pricing hike as the AI server copper foil market has matured. We assume overall production yield for HVLP copper foil to have improved to 95% in 2035E (vs. 68% in 2028E), thus leading to overall GM to expand to 55% in 2035E (vs. 51% in 2028E).
This results in 2035E EPS of NT900 (based on 22x 2035E EPS and discounting back to 2027 based on CoE of 11%).
Scenario 2: AI server foil TAM growth remains fl attish from 2028-35E, we assume AI server/networking switch continues to apply HVLP copper foil within its PCB, and no further capacity expansion for Co-Tech beyond 2028E as the AI server copper foil market remains fl attish throughout 2028-35E. Copper foil pricing only rises by 5% in total throughout 2028-35E as pricing re fl ects in fl ation (2% each year) and is largely o ff set by price erosion mainly due to the fl attish AI server copper foil market growth.
This results in 2035E EPS of NT590 (based on 20x 2035E EPS and discounting back to 2027 based on CoE of 11%).
Scenario 3: Development of CPO is mature enough to fully displace demand for HVLP copper foil, and this applies to both AI server and networking switch, while general server still uses HVLP copper foil as it is a cheaper solution than CPO. We assume the overall PCB copper foil TAM growth CAGR decelerates to 6% for 2028-35E, and assume no capacity expansion for Co-Tech beyond 2028E due to the development of CPO having a negative impact on the high-end copper foil market, but assume Co-Tech transitions half of its HVLP capacity back to RG to meet the demand from AI server/switch. Copper foil pricing only re fl ects in fl ation (2% each year).
This results in 2035E EPS of NT460 (based on 18x 2035E EPS and discounting back to 2027 based on CoE of 11%)
1d80e8d785834964a67126ca5626940f
cxmon 44. where we dre vo. Dou consellsus
100
90
Revenue
80
Gross profits
Operating profits
Pre-tax income
70
Net profit
EPS, NTS
60
50
Gross margin (%)
EBIT margin (%)
Net margin (%)
40
30
20
10
0
2026
Consensus
11,408
4,244
3,117
12.33
37.2%
35.2%
27.3%
13.6
2024
2027
Consensus
16,546
Diff (%)
25%
Scenario 1
30,887
14,677
Source: Company data, Goldman Sachs Global Investment Research
Financial analysis - earnings to grow substantially as the company has transitioned product mix to high-end copper foil
Our 2026E net income estimates are 18% below BBG consensus, while our 2027E net income estimates are 35% above. We assume this is due to limited high-end HVLP contribution in 2026, with a full ramp up of high-end HVLP capacity expected in 2027 (resulting in our 2026E revenue estimates 2% below BBG consensus, while our 2027E revenue estimates are 25% above). Our 2026E GM estimate is 5.3ppt lower, while our 2027E GM estimate is 3.5ppt higher than consensus.
Exhibit 42: Where we are vs. BBG consensus
Source: Company data, Goldman Sachs Global Investment Research
(87.7
36%
16.0
3.8
2021
2022
Financials
11,196
3,568
3,205
3,205
2,571
10.19
31.9%
28.6%
23.0%
2.1
2023
Diff (%)
-2%
-16%
GS est.
20,690
8,805
2028
1d80e8d785834964a67126ca5626940f
canal telecorat
NTSmn
Revenue
Gross profit
(NT$mn)
12,000
Operating income
Pretax income
Taxes expense
Net income
EPS, NTS
10,000
Ratio analysis and assumption
As % of sales
8,000
Gross margin
Operating expense ratio
Operating margin
Net margin
6,000 -
QoQ growth (%)
4,000
Revenue
Gross profit
Net income
Operating income
YoY growth (%)
Revenue
2,000
Gross profit
2,571
Operating income
Net income
2026E Net income
20.5%
3.6%
17.0%
12.8%
(0.8%)
8.0%
6.2%
51.6%
10.7%
24.3%
20.2%
13.7%
1Q25
(57)
306
330
(65)
265
1.05
21.0%
3.3%
17.7%
15.3%
1.3%
21.4%
26.4%
35.8%
14.8%
17.0%
18.6%
24.7%
Copperfoil pricing
Economies of expansion
2Q25
1Q26
2Q26E
2,002
378
3Q25
1,986
408
4Q25
2,164
567
3Q26E
2,918
966
1Q27E
3.817
1,505
4Q26E
3.046
1,069
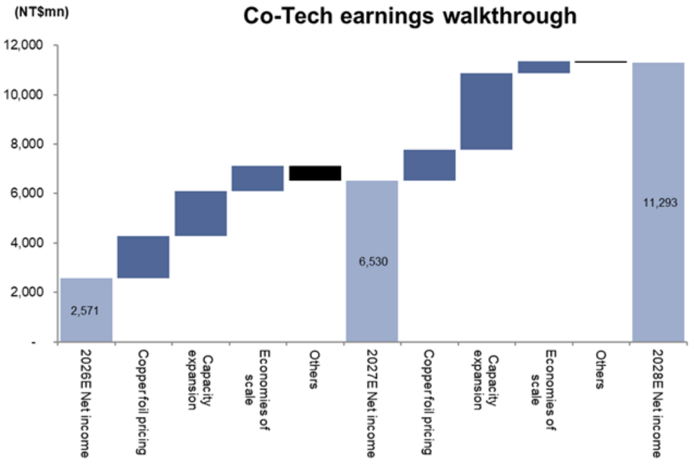
Co-Tech earnings walkthrough
(60)
2.532
727
2,700
806
(78)
317
208
(41).
167
0.66
18.9%
3.0%
15.9%
8.3%
15.9%
4.1%
3.8%
(37.0%)
10.2%
(9.4%)
(12.5%)
(42.7%)
Capacity scale
Exhibit 44: Co-Tech’s P&L
Source: Company data, Goldman Sachs Global Investment Research
Balance sheet
We expect Co-Tech’s net cash to rise considerably in the coming years, and account for 38% of total equity in 2028E vs. 3% in 2025 and reach NT249mn of net debt in 2025) considering the company’s positive free cash fl ow (NT$1.7bn/2.9bn/7.0bn in 2026/27/28E) and the stabilizing cash conversion cycle (stable at 120+ days in 2026-28E).
We model Co-Tech’s ROE to improve to 74.1% in 2028E from 15.1% in 2025, on the back of an expanding net margin (36.6% in 2028E vs. 13.5% in 2025) and higher turnover to asset ratio (1.4x in 2028E vs. 0.9x in 2025).
(71)
337
(79)
487
649
(86)
720
(100)
866
315
488
720
649
Income statement
1.00
(129)
1,376
1,376
(272)
1,104
2Q27E
4.722
1,961
(149)
1,813
1,813
(354)
1,459
3Q27E
5,559
2,364
(179)
2,186
2,186
(429
1,756
866
696
(100)
970
970
(194)
776
2.76
4.38
5.78
6.96
1.49
2.06
2.30
3.08
Exhibit 43: Co-Tech earnings waterfall chart
Others
Source: Goldman Sachs Global Investment Research
4Q27E
6.591
2,975
(212)
2,763
2,763
(553)
2,211
8.76
2024
6.822
1,143
1,149
(227)
922
3.65
2025
7.880
1,447
1,341
(278
1.063
4.21
2026E
11.196
3,205
3,205
(634)
2,571
10.19
2027E
20.690
8,138
8,138
(1,608)
6,530
25.89
2028E
30.887
13,673
14,073
(2,779)
11,293
44.77
1d80e8d785834964a67126ca5626940f
Camble to Dupon allays lot to let
3.5
3.0
2.5
2.0
1.5
1.0
0.5
0.0
2011
2012
2013
2014
2015
- Asset turn
2016
Exhibit 45: Dupont analysis for Co-Tech
2017
• Equity multiple
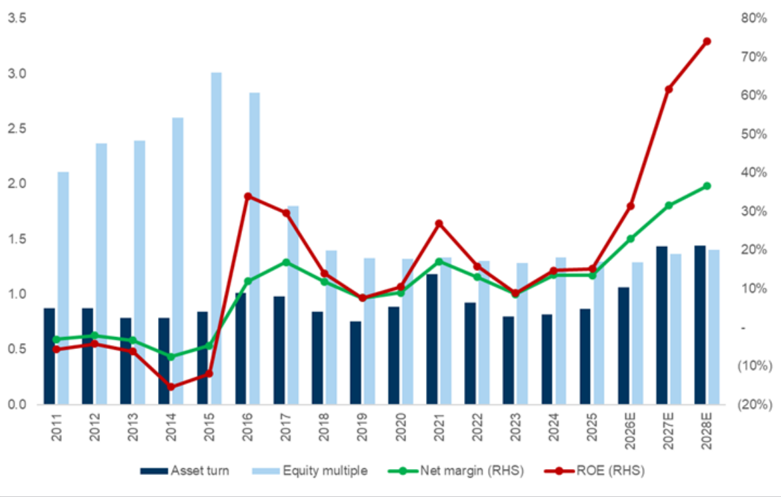
Source: Company data, Goldman Sachs Global Investment Research
80%
70%
60%
1d80e8d785834964a67126ca5626940f
Balance sheets
Marketable securities
Net receivables
Exhibit 46: Co-Tech’s balance sheet (NT$mn)
Current assets
Gross PP&E/Fixed assets
Land & CIP (non depreciable)
Land & CIP as % of Gross PPE
Depreciable gross PP&E/Fixed assets
Less accumulated depreciation
Net PP&E/Fixed assets
Gross intangibles
Accumulated amortization
Net intantigibles
Equity method investments
Investments in securities
Total investments
Other long-term assets
Total assets
Accounts payable
Short-term debt and current portion of long-term debt
Other current liabilities
Current liabilities
Long-term debt
Other long-term liabilities/creditors
Total long-term liabilities
Total liabilities
Common stock (includes par value, capital surplus, and treasury)
Treasury stock
Retained earnings
Other common equity
Total common equity
Minority interest (balance sheet)
Total shareholders funds/equity
Total liabilities and equity
Key ratio
Net debt (cash)
Net debt (cash) as % of equity
Return on equity (%)
Return on asset (%)
Current ratio
Quick ratio
Asset to equity ratio
2021
2,898
6
2,046
770
99
2022
1,648
0
1,689
676
72
2023
1,554
6
1,572
699
51
2024
1,990
1
1,765
715
61
2025
2,389
941
78
2027E
5,281
1,564
2028E
7,993
2,146
78
| 5,820 | 4,086 | 3,880 | 4,533 | 4,153 | 10,533 | 18,082 | |
|---|---|---|---|---|---|---|---|
| 8,764 | 9,580 | 10,564 | 10,872 | 11,397 | |||
| 1,577 | 2,361 | 3,302 | 3,616 | 4,103 | |||
| 18% | 25% | 31% | 33% | 36% | |||
| 7,188 | 7,219 | 7,262 | 7,256 | 7,294 | |||
| (6,428) | (6,546) | (6,672) | (6,752) | (6,799) | |||
| 2,336 2 | 3,034 2 | 3,892 2 | 4,121 2 | 4,598 5 | 5 | 5 | 5 |
| (1) | (2) | (3) | |||||
| 2 | 2 | 2 | 2 | 5 | 4 | 3 | 2 |
| - | |||||||
| 211 | 494 | 133 | |||||
| 8,369 | 7,615 | 7,907 | |||||
| 666 | 430 | 300 | 905 | ||||
| 540 | 515 | 1,057 | 993 | ||||
| 876 | 534 | 510 | 5,510 | ||||
| 2,082 | 1,479 | 1,868 | 7,408 | ||||
| 55 | - | - | |||||
| 62 | 51 | 28 | 14 | 14 | 14 | ||
| 117 | 51 | 55 | 28 | 14 | 14 | 14 | |
| 2,200 | 1,530 | 1,923 | 2,250 | 4,917 | 7,423 | ||
| 2,526 1,897 | 2,526 2,048 | 2,526 2,146 | 2,526 2,199 | 2,526 2,302 | 2,526 2,302 | 2,526 2,302 | 2,526 2,302 |
| 1,747 | 1,510 | 1,312 | 1,806 | 2,396 | 3,745 | 7,171 | 13,097 |
| 0 | (0) | 287 | 287 | 287 | 287 | ||
| 6,169 | 6,085 | 5,983 | 6,531 | 7,511 | 8,860 | 12,286 | 18,212 |
| - | |||||||
| 6,169 8,369 | 6,085 7,615 | 5,983 7,907 | 6,531 8,780 | 7,511 9,446 | 8,860 11,657 | 12,286 17,203 | 18,212 25,635 |
| (2,302) | (1,134) | (497) | (558) | 249 | (924) | (2,617) | (6,872) |
| -37% | -19% 18% | -8% 18% | -9% 15% | 3% 15% | -10% | -21% 62% | -38% |
| 17% | 8% | 11% | 12% | 31% | 74% | ||
| 8% | 8% | 24% | 45% | 53% | |||
| 1.7 1.3 2.1 | 1.9 1.4 | 1.8 1.2 | 2.0 1.7 | 2.2 1.7 | 2.1 1.8 | 2.1 1.8 | 2.4 2.2 |
| 2.3 | 2.3 | 1.3 | 1.3 | 1.3 | 1.4 | 1.4 |
Source: Company data, Goldman Sachs Global Investment Research
Cash fl ow statement
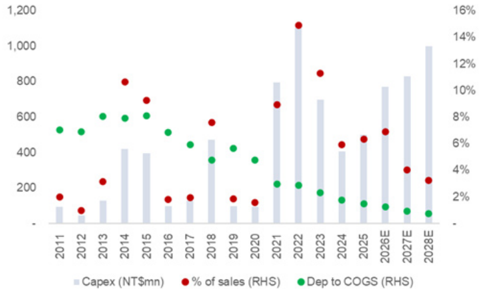
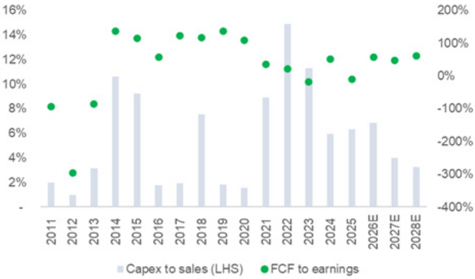
We forecast Co-Tech to generate positive free cash fl ow from 2026-28E, given its much better cash fl ow from operations due to Co-Tech’s expanding market share in the HVLP market, leading to 58/47/62% FCF to earnings ratio in 2026/27/28E. We expect the company’s CAPEX to remain at NT$770-1,000mn in the next few years, given the stable maintenance CAPEX and the company’s investment in new capacity (we expect Co-Tech’s e ff ective capacity will gradually increase to 2,250tons/month in 2027 end from1,500tons/month by end of 2025). We expect Co-Tech to maintain its cash dividend payout ratio at 48% in 2026-2028E, representing a 0.5% 2026E dividend yield.
78
2026E
0
78
1d80e8d785834964a67126ca5626940f
vo. cuel cucorlevel
Cash flow statements
1,200
Net income
Minority interest add-back
1,000
Depreciation and amortization add-back
800
600
400
16%
2021
14%
1,523
12%
16%
2022
14%
967
12%
10%
173
92
(234)
(290)
2011
1,043
(1,104)
0
0
(1,104)
(1,061)
(9)
(120)
(1,190)
Exhibit 47: We believe Co-Tech’s capex will continue to rise, but account for a lower % of total revenue in 2027-28 vs. 2021-2026E level 10% 6% 4% (427) 336
Inventory
Accounts payable
200
L-T Inv. Equitylnc.
L-T Inv. EquityLoss
Cash Div.-LTInvest
Other operating cash flow items
Cash flow from operations
Capital expenditure
(Acquisitions)
Divestitures ther investment cash flow item
ash flow from investin
Dividends paid (common and preferred)
Share repurchase/issue (change In common stock)
Increase/(decrease) in short-term debt
(288)
26
Source: Company data, Goldman Sachs Global Investment Research
Exhibit 49: Co-Tech’s cash fl ow statement (NT$ mn)
Cash flow from financing
Effect of foreign exchange rate changes
Remainders From Merg
Total cash flow
Key ratio
Free Cash flow
FCF to earnings
Capex as % of revenue
Cash flow/share
Cash and equivalents/net asset value (%)
2024
922
96
2023
533
123
200%
2028E
0%
2025
90
2026E
94
2027E
108
117
Exhibit 48: We believe Co-Tech’s FCF to earnings ratio will continue to improve in the coming years (3,052)
(227)
(96)
(16)
82
(24)
-200%
(2,712)
-300%
(582)
(614)
(493)
(60)
(2,398)
(563)
719
260
(426)
Source: Company data, Goldman Sachs Global Investment Research
(461)
(121)
46
(73)
115
(816)
| 0 | (0) - | - | ||||
|---|---|---|---|---|---|---|
| 437 | (1,246) | 982 | 1,862 | |||
| (1,250) | (94) | 4,254 | ||||
| 0 0% | 0 0% | 467 51% | (101) -9% | 1,487 58% | 3,084 47% | 7,037 62% |
| 0% | 0% | 6% | 6% | 7% | 4% | 3% |
| 0 | 0 | 4 | 1 | 9 | 16 | 33 |
| 6% | 5% | 30% | 10% | 19% | 29% | 43% |
Source: Company data, Goldman Sachs Global Investment Reasearch
M&A framework
We see low probability of Co-Tech merging or being acquired by other companies, given
(574)
4%
2012
(505)
(1,222)
(3,104)
1d80e8d785834964a67126ca5626940f
Company
Ticker
Taiwan
Co-Tech 8358.TWO
Rating
Buy
Attractivenss/
Industry growth
EPS
margin CAGR (26 (26-28E)
(26-28E)
ROIC
28E)
Valuation
26E
26E P/E EV/EBITDA
37%
Score
($bn)
SOE?
M&A executable?
shareholder/
Largest mgmt
openness
Regulation
Score weight in
TP
(1) Co-Tech is in a cyclical industry, acquisitions usually happen when target assets are underutilized or in a downcycle, (2) Co-Tech’s 2026E P/E (38.2x) does not screen attractively vs sector peers, and (3) clients prefer independent suppliers thus acquisitions may hurt quali fi cation opportunities. As such, we assign an M&A score of 3 (least likely) to Co-Tech.
110%
Exhibit 50: M&A framework overview: Rank of 3
Source: Company data, Goldman Sachs Global Investment Research, Bloomberg
Investment thesis, TP methodology & risks
Investment Thesis - Co-Tech
Co-Tech is a global leading general server copper foil supplier, with ~60% market share in 2025 per GSe. We expect the company to enjoy solid share gain opportunities in the near term, considering its proactive HVLP capacity expansion plan and strong know-how in the advanced copper foil industry. Also, adoption of HVLP4 copper foil from AI servers and 1.6T networking switches starting in 2H26 should be a key demand driver for Co-Tech, in our view. Additionally, the company’s proactive pricing strategy and ability to improve production yield should drive revenue momentum in the long term.
We are Buy rated as we believe Co-Tech will see better revenue/pro fi tability in the long term given its shift to a more premium product mix along with proactive capacity plans (Plant 3 to be ready by end of 2027) and this should lead to strengthened valuations.
Valuation methodology: Our 12m TP of NT$900 is based on a 22x 2028E P/E (discounted back to 2027E based on CoE of 11%), which is +1SD above the company’s average upcycle valuation in the past 10-years.
Key downside risks: (1) earlier than expected CPO adoption in the computing IC, (2) slower than expected yield rate improvement speed, and (3) much stronger than expected capacity growth from HVLP peers, limiting pricing power
Mkt cap
Mgmt
Score
M&A
1d80e8d785834964a67126ca5626940f