報告_大和_M31_20260506
PDF 原檔:報告_大和_M31_20260506_original.pdf
原始內容
M31 Technology (6643 TT)
Target price:
TWD750.00 (from TWD600.00)
Share price (6 May):
TWD650.00 |
Up/downside: +15.4%
Structural turnaround round the corner
- Downbeat 1Q26 results for still bumpy operations but …
- … strong earnings turnaround still on track to kick off from 2Q26
- Reaffirming our Buy (1) rating with a higher 12M TP of TWD750
What’s new: M31 reported downbeat 1Q26 results for still bumpy quarterly operations due to delayed license projects. That said, we expect the delayed projects to catch up, evidenced by its improved April revenue, which management expects to set a good stage for growing revenue runrates into 2H26. Its goal of royalty outgrowing license revenue and the role it plays in the AI cycle reinforce our positive stance on M31’s strong earnings turnaround from 2Q26, and our Buy (1) rating on the stock.
What’s the impact: Results bumpy and downbeat but … M31 released a 1Q26 net loss of TWD49m, missing our/consensus estimates of TWD53m/TWD35m net profit due to lower revenue on delayed license recognition resulting in insufficient economies of scale to cover the higher opex associated with R&D, despite being partially offset by higher nonoperating gains (table on p.2). Management offered no numeric guidance for 2Q26, yet expects just released April revenue (TWD169m, +40% MoM, +31% YoY) to set a good stage for monthly revenue run-rates into MayJune, aiming for growth to continue into 2H26 with the bottom line turning positive. It further set a ‘cautiously confident’ tone for M31’s 2026 outlook, reaffirming its goal for royalty revenue to outgrow license for a 20% revenue contribution this year, driven by advanced-node (N3-16) ramps for ASP accretion. All these support our view calling for M31 to structurally turn around its earnings growth from 2Q26, despite its bumpy quarterly operations over the past 4 quarters post its transition effect .
… structural turnaround still in sight. Management at today’s call reaffirmed its rich pipeline of license projects accumulated over the years that cover a broad scope of foundation and interface IP from specialty to advanced nodes (N40/28/22 to N5/4/3/2) ready to convert into royalty revenue stream for growth. It further outlined how M31 plays a role in AI by leveraging its IP offerings of SRAM compilers and interfaces (SerDes, PCIe, USB, etc.) for cloud AI, and SRAM compilers, sensors, and interfaces (USB, MIPI, UFS, and display ports) for edge AI. All these reinforce our positive stance on its structural business and AI positioning.
What we recommend: Despite our forecast revisions, we raise our 12M TP for M31 to TWD750 (previous: TWD600), based on a higher 4-quarter PER target of 45x (previous: 40x) to discount its 2026-28E EPS CAGR of 56% with a 0.8x PEG, as we introduce our 2028 forecasts. We reaffirm our Buy (1) rating with key downside risk of any geopolitical overhang (war, FX, tariff) weighing on end-demand and delaying M31’s royalty ramp.
How we differ: Our 2026-27E EPS are 35-47% above the consensus forecasts, likely due to our more positive view on M31’s royalty ramps.
Rick Hsu (886) 2 8758 6261
rick.hsu@daiwacm-cathay.com.tw
Sharon Kao (886) 2 8758 6255 sharon.kao@daiwacm-cathay.com.tw
Forecast revisions (%)
| Year to 31 Dec | 26E | 27E | 28E |
|---|---|---|---|
| Revenue change | (3.1) | 2.4 | n.a. |
| Net profit change | (18.9) | 1.8 | n.a. |
| Core EPS (FD) change | (18.9) | 1.8 | n.a. |
Source: Daiwa forecasts
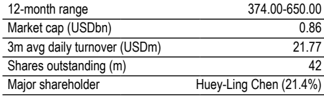
| 12-month range | 374.00-650.00 |
|---|---|
| Market cap (USDbn) | 0.86 |
| 3m avg daily turnover (USDm) | 21.77 |
| Shares outstanding (m) | 42 |
| Major shareholder | Huey-Ling Chen (21.4%) |
Financial summary (TWD)
| Year to 31 Dec | 26E | 27E | 28E |
|---|---|---|---|
| Revenue (m) | 2,283 | 3,157 | 3,803 |
| Operating profit (m) | 480 | 955 | 1,211 |
| Net profit (m) | 435 | 835 | 1,054 |
| Core EPS (fully-diluted) | 10.401 | 19.969 | 25.219 |
| EPS change (%) | 515.9 | 92.0 | 26.3 |
| Daiwa vs Cons. EPS (%) | 34.6 | 46.7 | n.a. |
| PER (x) | 62.5 | 32.6 | 25.8 |
| Dividend yield (%) | 0.2 | 1.5 | 2.3 |
| DPS | 1.2 | 10.0 | 15.0 |
| PBR (x) | 11.9 | 10.1 | 8.7 |
| EV/EBITDA (x) | 47.6 | 25.0 | 19.5 |
| ROE (%) | 20.8 | 33.5 | 36.2 |
Source: FactSet, Daiwa forecasts
M31: quarterly P&L forecasts
| TWDm | 1Q25 | 2Q25 | 3Q25 | 4Q25 | 1Q26 | 2Q26E | 3Q26E | 4Q26E | 2025 | 2026E | 2027E | 2028E |
|---|---|---|---|---|---|---|---|---|---|---|---|---|
| Revenue | 435 | 449 | 355 | 544 | 395 | 528 | 624 | 736 | 1,782 | 2,283 | 3,157 | 3,803 |
| License | 352 | 404 | 277 | 484 | 323 | 434 | 512 | 599 | 1,517 | 1,869 | 2,496 | 2,973 |
| Royalty | 83 | 45 | 78 | 60 | 71 | 94 | 112 | 137 | 265 | 414 | 660 | 830 |
| COGS | 0 | 0 | 0 | 0 | 0 | 0 | 0 | 0 | 0 | 0 | 0 | 0 |
| Gross profit | 435 | 449 | 355 | 544 | 395 | 528 | 624 | 736 | 1,782 | 2,283 | 3,157 | 3,803 |
| Opex | -427 | -410 | -403 | -450 | -461 | -425 | -446 | -471 | -1,689 | -1,803 | -2,201 | -2,592 |
| Operating profit | 8 | 39 | -48 | 95 | -66 | 103 | 178 | 265 | 93 | 480 | 955 | 1,211 |
| Non-op gain (loss) | 15 | -87 | 46 | 26 | 19 | 5 | 6 | 6 | 1 | 36 | 27 | 37 |
| Pretax profit | 23 | -47 | -2 | 120 | -47 | 108 | 184 | 271 | 94 | 516 | 982 | 1,247 |
| Income taxes | -3 | 7 | -6 | -21 | -2 | -15 | -26 | -38 | -23 | -81 | -147 | -193 |
| Net profit | 20 | -41 | -7 | 99 | -49 | 93 | 158 | 233 | 71 | 435 | 835 | 1,054 |
| EPS (TWD, basic) | 0.47 | -0.98 | -0.18 | 2.38 | -1.18 | 2.22 | 3.78 | 5.58 | 1.69 | 10.40 | 19.97 | 25.22 |
| EPS (TWD, fully diluted) | 0.47 | -0.98 | -0.18 | 2.38 | -1.18 | 2.22 | 3.78 | 5.58 | 1.69 | 10.40 | 19.97 | 25.22 |
| Revenue mix | ||||||||||||
| License | 81% | 90% | 78% | 89% | 82% | 82% | 82% | 81% | 85% | 82% | 79% | 78% |
| Royalty | 19% | 10% | 22% | 11% | 18% | 18% | 18% | 19% | 15% | 18% | 21% | 22% |
| Margin | ||||||||||||
| Gross profit | 100% | 100% | 100% | 100% | 100% | 100% | 100% | 100% | 100% | 100% | 100% | 100% |
| Opex | 98% | 91% | 114% | 83% | 117% | 81% | 72% | 64% | 95% | 79% | 70% | 68% |
| Operating profit | 2% | 9% | -14% | 17% | -17% | 20% | 29% | 36% | 5% | 21% | 30% | 32% |
| Net profit | 5% | -9% | -2% | 18% | -12% | 18% | 25% | 32% | 4% | 19% | 26% | 28% |
| Growth (QoQ) | ||||||||||||
| Revenue | 33% | 3% | -21% | 53% | -27% | 34% | 18% | 18% | ||||
| Gross profit | 33% | 3% | -21% | 53% | -27% | 34% | 18% | 18% | ||||
| Operating profit | nm | 413% | -223% | nm | -170% | -256% | 73% | 49% | ||||
| Net profit | nm | -308% | nm | nm | -150% | nm | 70% | 47% | ||||
| EPS (basic) | nm | -308% | nm | nm | -150% | nm | 70% | 47% | ||||
| EPS (FD) | nm | -309% | nm | nm | -150% | nm | 70% | 47% | ||||
| Growth (YoY) | ||||||||||||
| Revenue | 27% | 5% | -7% | 66% | -9% | 18% | 76% | 35% | 20% | 28% | 38% | 20% |
| Gross profit | 27% | 5% | -7% | 66% | -9% | 18% | 76% | 35% | 20% | 28% | 38% | 20% |
| Operating profit | 182% | -63% | -208% | nm | nm | 163% | nm | 180% | 75% | 415% | 99% | 27% |
| Net profit | -54% | -137% | -127% | nm | -351% | nm | nm | 135% | -44% | 516% | 92% | 26% |
| EPS (basic) | -54% | -137% | -127% | nm | -351% | nm | nm | 135% | -45% | 515% | 92% | 26% |
| EPS (FD) | -54% | -137% | -127% | nm | -351% | nm | nm | 135% | -44% | 516% | 92% | 26% |
Source: Company, Daiwa estimates and forecasts
M31: 1Q26 results review and 2Q26 outlook
| 1Q26 | 1Q26 | 1Q26 | Variance | Variance | Growth | Growth | |||
|---|---|---|---|---|---|---|---|---|---|
| TWDm | Actual | Daiwa | Consensus | Daiwa | Consensus | QoQ | YoY | Guidance | Daiwa (previous) |
| Revenue | 395 | 470 | 456 | -16% | -13% | -27% | -9% | na | revenue up 12% QoQ |
| License | 323 | 389 | na | -17% | na | -33% | -8% | ||
| Royalty | 71 | 81 | na | -11% | na | 19% | -13% | ||
| Gross profit | 395 | 470 | 456 | -16% | -13% | -27% | -9% | ||
| Opex | -461 | -413 | -432 | 11% | 7% | 3% | 8% | na | opex up 3% QoQ |
| Operating profit | -66 | 56 | 24 | -218% | -378% | -170% | nm | ||
| Pretax profit | -47 | 61 | 44 | -177% | -208% | -139% | -307% | ||
| Net profit | -49 | 53 | 35 | -193% | -241% | -150% | -351% | ||
| FD EPS (TWD) | -1.18 | 1.26 | 0.84 | -193% | -241% | -150% | -351% | ||
| Margin | |||||||||
| Gross | 100.0% | 100.0% | 100.0% | 0.0% | 0.0% | ||||
| Operating | -16.8% | 12.0% | 5.2% | -28.8% | -22.0% | ||||
| Net | -12.5% | 11.2% | 7.7% | -23.7% | -20.2% |
Source: Company, Daiwa estimates and forecasts
M31: numbers of license project build
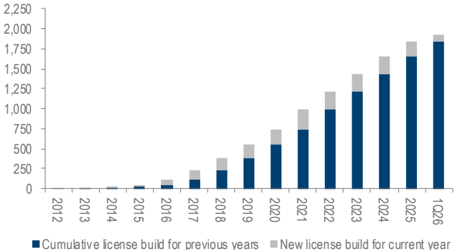
Cumulative license build for previous years
New license build for current year
Source: Company
M31: 4-quarter forward PER bands
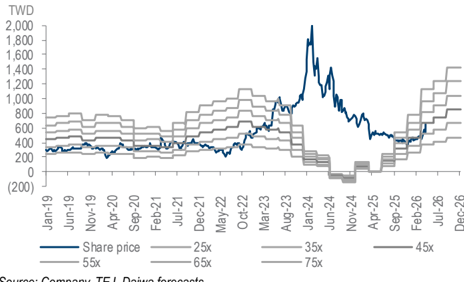
Source: Company, TEJ, Daiwa forecasts
Financial summary
Key assumptions
| Year to 31 Dec | 2021 | 2022 | 2023 | 2024 | 2025 | 2026E | 2027E | 2028E |
|---|---|---|---|---|---|---|---|---|
| Licensing growth (%) | (1.0) | 24.4 | 26.0 | (7.8) | 22.2 | 23.2 | 33.5 | 19.1 |
| Royalty growth (%) | 35.0 | 90.5 | (8.9) | (9.7) | 10.7 | 56 | 59.5 | 25.7 |
Profit and loss (TWDm)
| Year to 31 Dec | 2021 | 2022 | 2023 | 2024 | 2025 | 2026E | 2027E | 2028E |
|---|---|---|---|---|---|---|---|---|
| Licensing | 859 | 1,069 | 1,347 | 1,241 | 1,517 | 1,869 | 2,496 | 2,973 |
| Royalty | 153 | 291 | 265 | 240 | 265 | 414 | 660 | 830 |
| Other Revenue | 0 | 0 | 0 | 0 | 0 | 0 | 0 | 0 |
| Total Revenue | 1,012 | 1,360 | 1,612 | 1,481 | 1,782 | 2,283 | 3,157 | 3,803 |
| Other income | 0 | 0 | 0 | 0 | 0 | 0 | 0 | 0 |
| COGS | 0 | 0 | 0 | 0 | 0 | 0 | 0 | 0 |
| SG&A | (153) | (178) | (225) | (280) | (337) | (379) | (421) | (501) |
| Other op.expenses | (546) | (814) | (940) | (1,148) | (1,352) | (1,425) | (1,781) | (2,091) |
| Operating profit | 313 | 368 | 446 | 53 | 93 | 480 | 955 | 1,211 |
| Net-interest inc./(exp.) | (1) | 10 | 29 | 28 | 18 | 22 | 27 | 37 |
| Assoc/forex/extraord./others | (19) | 65 | 37 | 69 | (17) | 14 | 0 | 0 |
| Pre-tax profit | 294 | 443 | 513 | 150 | 94 | 516 | 982 | 1,247 |
| Tax | (41) | (64) | (78) | (23) | (23) | (81) | (147) | (193) |
| Min. int./pref. div./others | 0 | 0 | 0 | 0 | 0 | 0 | 0 | 0 |
| Net profit (reported) | 253 | 379 | 435 | 127 | 71 | 435 | 835 | 1,054 |
| Net profit (adjusted) | 253 | 379 | 435 | 127 | 71 | 435 | 835 | 1,054 |
| EPS (reported)(TWD) | 6.096 | 9.173 | 10.401 | 3.047 | 1.690 | 10.401 | 19.969 | 25.219 |
| EPS (adjusted)(TWD) | 6.096 | 9.173 | 10.401 | 3.047 | 1.690 | 10.401 | 19.969 | 25.219 |
| EPS (adjusted fully-diluted)(TWD) | 6.096 | 9.032 | 10.401 | 3.036 | 1.689 | 10.401 | 19.969 | 25.219 |
| DPS (TWD) | 8.000 | 4.784 | 6.061 | 6.693 | 2.001 | 1.200 | 10.000 | 15.000 |
| EBIT | 313 | 368 | 446 | 53 | 93 | 480 | 955 | 1,211 |
| EBITDA | 353 | 415 | 496 | 117 | 168 | 553 | 1,044 | 1,315 |
Cash flow (TWDm)
| Year to 31 Dec | 2021 | 2022 | 2023 | 2024 | 2025 | 2026E | 2027E | 2028E |
|---|---|---|---|---|---|---|---|---|
| Profit before tax | 294 | 443 | 513 | 150 | 94 | 516 | 982 | 1,247 |
| Depreciation and amortisation | 40 | 47 | 49 | 63 | 75 | 73 | 89 | 105 |
| Tax paid | (41) | (64) | (78) | (23) | (23) | (81) | (147) | (193) |
| Change in working capital | (65) | (11) | (54) | (100) | (76) | (65) | (201) | (5) |
| Other operational CF items | (4) | 236 | (189) | (43) | (43) | 0 | 0 | 0 |
| Cash flow from operations | 225 | 652 | 241 | 47 | 26 | 443 | 723 | 1,154 |
| Capex | (533) | (31) | (34) | (80) | (48) | (68) | (95) | (114) |
| Net (acquisitions)/disposals | 0 | 0 | 142 | 0 | 0 | 0 | 0 | 0 |
| Other investing CF items | 219 | (154) | 225 | (13) | 94 | (5) | (5) | (5) |
| Cash flow from investing | (314) | (186) | 332 | (93) | 46 | (73) | (100) | (119) |
| Change in debt | 89 | (89) | 0 | 0 | 0 | 0 | 0 | 0 |
| Net share issues/(repurchases) | 0 | 0 | 0 | 0 | 0 | 0 | 0 | 0 |
| Dividends paid | (332) | (198) | (254) | (279) | (84) | (50) | (418) | (627) |
| Other financing CF items | 108 | 56 | (5) | (10) | (15) | 0 | 0 | 0 |
| Cash flow from financing | (134) | (232) | (259) | (289) | (98) | (50) | (418) | (627) |
| Forex effect/others | 3 | 5 | (12) | 15 | (5) | 0 | 0 | 0 |
| Change in cash | (220) | 239 | 302 | (320) | (31) | 319 | 205 | 408 |
| Free cash flow | (308) | 620 | 207 | (34) | (22) | 374 | 628 | 1,040 |
Source: FactSet, Daiwa forecasts
Financial summary continued …
Balance sheet (TWDm)
| Year to 31 Dec | 2021 | 2022 | 2023 | 2024 | 2025 | 2026E | 2027E | 2028E |
|---|---|---|---|---|---|---|---|---|
| Cash & short-term investment | 724 | 1,114 | 1,148 | 682 | 558 | 877 | 1,082 | 1,490 |
| Inventory | 0 | 0 | 0 | 0 | 0 | 0 | 0 | 0 |
| Accounts receivable | 319 | 325 | 374 | 263 | 336 | 416 | 616 | 626 |
| Other current assets | 89 | 220 | 133 | 260 | 346 | 346 | 346 | 346 |
| Total current assets | 1,132 | 1,659 | 1,654 | 1,205 | 1,240 | 1,639 | 2,044 | 2,461 |
| Fixed assets | 683 | 571 | 562 | 592 | 605 | 607 | 619 | 637 |
| Goodwill & intangibles | 8 | 11 | 12 | 18 | 29 | 29 | 26 | 23 |
| Other non-current assets | 114 | 126 | 169 | 345 | 289 | 289 | 289 | 289 |
| Total assets | 1,937 | 2,367 | 2,397 | 2,159 | 2,163 | 2,563 | 2,978 | 3,410 |
| Short-term debt | 0 | 0 | 0 | 0 | 0 | 0 | 0 | 0 |
| Accounts payable | 6 | 2 | 5 | 2 | 2 | 17 | 16 | 21 |
| Other current liabilities | 264 | 503 | 321 | 215 | 247 | 247 | 247 | 247 |
| Total current liabilities | 270 | 505 | 326 | 217 | 249 | 264 | 263 | 268 |
| Long-term debt | 83 | 0 | 0 | 0 | 0 | 0 | 0 | 0 |
| Other non-current liabilities | 0 | 5 | 8 | 23 | 14 | 14 | 14 | 14 |
| Total liabilities | 353 | 510 | 334 | 240 | 263 | 278 | 277 | 282 |
| Share capital | 316 | 317 | 348 | 418 | 418 | 418 | 418 | 418 |
| Reserves/R.E./others | 1,268 | 1,540 | 1,715 | 1,501 | 1,482 | 1,867 | 2,284 | 2,711 |
| Shareholders’ equity | 1,584 | 1,857 | 2,063 | 1,919 | 1,900 | 2,285 | 2,702 | 3,129 |
| Minority interests | 0 | 0 | 0 | 0 | 0 | 0 | 0 | 0 |
| Total equity & liabilities | 1,937 | 2,367 | 2,397 | 2,159 | 2,163 | 2,563 | 2,978 | 3,410 |
| EV | 26,528 | 26,054 | 26,021 | 26,486 | 26,611 | 26,292 | 26,087 | 25,679 |
| Net debt/(cash) | (641) | (1,114) | (1,148) | (682) | (558) | (877) | (1,082) | (1,490) |
| BVPS (TWD) | 38.211 | 44.927 | 49.307 | 46.084 | 45.496 | 54.669 | 64.638 | 74.857 |
Key ratios (%)
| Year to 31 Dec | 2021 | 2022 | 2023 | 2024 | 2025 | 2026E | 2027E | 2028E |
|---|---|---|---|---|---|---|---|---|
| Sales (YoY) | 3.1 | 34.4 | 18.5 | (8.2) | 20.3 | 28.1 | 38.3 | 20.5 |
| EBITDA (YoY) | (23.3) | 17.6 | 19.3 | (76.5) | 43.9 | 229.2 | 88.9 | 26.0 |
| Operating profit (YoY) | (25.2) | 17.6 | 21.3 | (88.1) | 75.0 | 415.0 | 99.1 | 26.7 |
| Net profit (YoY) | (21.6) | 50.1 | 14.7 | (70.8) | (44.4) | 515.9 | 92.0 | 26.3 |
| Core EPS (fully-diluted) (YoY) | (22.3) | 48.2 | 15.2 | (70.8) | (44.4) | 515.9 | 92.0 | 26.3 |
| Gross-profit margin | 100.0 | 100.0 | 100.0 | 100.0 | 100.0 | 100.0 | 100.0 | 100.0 |
| EBITDA margin | 34.9 | 30.5 | 30.7 | 7.9 | 9.4 | 24.2 | 33.1 | 34.6 |
| Operating-profit margin | 30.9 | 27.1 | 27.7 | 3.6 | 5.2 | 21.0 | 30.3 | 31.8 |
| Net profit margin | 25.0 | 27.9 | 27.0 | 8.6 | 4.0 | 19.0 | 26.4 | 27.7 |
| ROAE | 16.3 | 22.0 | 22.2 | 6.4 | 3.7 | 20.8 | 33.5 | 36.2 |
| ROAA | 13.7 | 17.6 | 18.3 | 5.6 | 3.3 | 18.4 | 30.1 | 33.0 |
| ROCE | 19.7 | 20.9 | 22.8 | 2.7 | 4.9 | 22.9 | 38.3 | 41.5 |
| ROIC | 43.0 | 37.4 | 45.7 | 4.2 | 5.4 | n.a. | n.a. | n.a. |
| Net debt to equity | n.a. | n.a. | n.a. | n.a. | n.a. | n.a. | n.a. | n.a. |
| Effective tax rate | 13.9 | 14.4 | 15.2 | 15.6 | 24.8 | 15.7 | 15.0 | 15.5 |
| Accounts receivable (days) | 103.5 | 86.4 | 79.1 | 78.5 | 61.3 | 60.0 | 59.6 | 59.6 |
| Current ratio (x) | 4.2 | 3.3 | 5.1 | 5.5 | 5.0 | 6.2 | 7.8 | 9.2 |
| Net interest cover (x) | 593.7 | n.a. | n.a. | n.a. | n.a. | n.a. | n.a. | n.a. |
| Net dividend payout | 102.9 | 103.1 | 88.3 | 76.6 | 65.8 | 71.1 | 96.1 | 75.1 |
| Free cash flow yield | n.a. | 2.3 | 0.8 | n.a. | n.a. | 1.4 | 2.3 | 3.8 |
Source: FactSet, Daiwa forecasts
Company profile
Founded in 2011, M31 is an independent semiconductor IP provider in Taiwan, offering both foundation IP for specialty technology nodes and functional IP such as high-speed interface and analogue IP.
ESG analysis
ESG risks
| Risks | Risks | Management | Analyst comments |
|---|---|---|---|
| Executive/board quality | 2 | M31’s board of directors (BoD) has 7 members, including 3 independent directors, who represent 43% of total directors, higher than the regulatory requirement of at least 20%. Its Chairman and President are not the same person, but its President is one of the directors. M31 has the Audit Committee, Compensation Committee and Risk Control Committee under the BoD. | |
| G | Capital management | 1 | Although M31 is a young company (founded in 2011 and listed in 2019), its dividend payout ratio has been over the 75% level for the past 5 years. M31 is a semiconductor IP provider without onsite production activities, which would require high capex to do so. As such, we view its high dividend payout ratio to be appropriate. |
| Related party & transaction | 1 | We do not see any meaningful impact from related-party transactions. | |
| S | Supply chain management | 2 | M31’s suppliers are required to comply with the Supplier Management Standards, which was set by M31 in 2013. In addition, M31 has periodical evaluations for its suppliers and onsite audits to ensure the quality and implementation of Corporate Social Responsibility (CSR), as well as Environmental Protection and Safety and Integrity Policies. |
| E | Water & wastewater management | 1 | M31 is a semiconductor IP provider without physical products, and thus no production activity to affect the environment. |
| E | Waste & hazardous materials management | 1 | The company is a semiconductor IP provider without physical products, and thus no production activity to affect the environment. It still adopts some measures to reduce waste from its operations, such as recycling and using electronic files to replace paper documents as much as possible to reduce the use of paper. |
| E | GHG emissions | 1 | M31 is a semiconductor IP provider without physical products, and thus no production activity to affect the environment. |
Note: Management score represents a company’s ability to manage/benefit from certain ESG topics. The scores range from 1 to 3, with 1 being the strongest.
Update Date: 11 Mar 2026
Source: Daiwa, Company