PDF 原檔:260821_6223_旺矽_daiwa_MPI_original.pdf
圖片清單(已驗證 2026-08-24)
| 檔名 | size | 分類 | 親眼所見內容 |
|---|---|---|---|
260821_6223_旺矽_daiwa_MPI_001.png |
28KB | 真資料圖 | 「Share price performance」雙軸折線圖,Aug-25~Aug-26:旺矽股價(左軸 TWD 1,000-7,500)由約 1,300 升至 5-6 月間高點約 7,300 後回落至約 5,600;虛線為相對 TWOTCI 指數表現(右軸 50-360) |
260821_6223_旺矽_daiwa_MPI_002.png |
28KB | 真資料圖 | 長條+折線圖「MPI: revenue and gross margin outlook」,2021-2028E 營收(TWDm,左軸)由約 6,500 升至 61,445,毛利率(右軸)由約 42% 升至約 63% |
260821_6223_旺矽_daiwa_MPI_003.png |
44KB | 真資料圖 | 「MPI: 1-year-forward PER bands」,Aug-23~Aug-26,股價線疊 14x/30x/50x/75x/90x 本益比帶;2026 年 8 月股價約 5,600,落在 50x-75x 帶之間 |
260821_6223_旺矽_daiwa_MPI_004.png |
21KB | 真資料圖 | 「MPI: Bloomberg-consensus earnings revisions」,Sep-25~Aug-26 共識 EPS 走勢:2026E EPS 由約 46 逐階升至約 65;2027E EPS 由約 55 升至約 128,全期只升不降 |
260821_6223_旺矽_daiwa_MPI_005.png |
23KB | 真資料圖 | 折線圖「Global: non-memory probe card supplier ranking」(Techinsights),2021-2025 名次:Technoprobe 穩居第 1、MPI 穩居第 4(全期水平線)、Formfactor 約第 3;Maxone 名次由第 16 降至第 4 附近後轉弱、Winway 由第 20 升至第 5 |
260821_6223_旺矽_daiwa_MPI_006.png |
19KB | 真資料圖 | 堆疊長條圖「Global: non-memory probe card TAM」(USDbn),2022-2026E:總市場由約 2.5bn 降至 2023 年 2.15bn 後回升至 2026E 約 3.4bn,其中非記憶體探針卡 2026E 約 2.15bn |
260821_6223_旺矽_daiwa_MPI_007.png |
21KB | 真資料圖 | 堆疊長條圖「Global: ASIC shipments」(mn units),2024 約 4.3 → 2025 約 5.4 → 2026E 約 8.5 → 2027E 約 19 → 2028E 約 25.5;分色為 Google/Meta/AWS/Microsoft/Open AI,Google 占最大宗(2028E 約 21) |
260821_6223_旺矽_daiwa_MPI_008.png |
43KB | 真資料圖 | 堆疊長條+折線圖「Global: MEMS probe card adoption」(USDm),2022-2030E:市場規模由約 2,600 升至約 5,100,MEMS 滲透率(右軸)自 2023 年約 65% 升至 2030E 約 75%;分類含 MEMS/VPC/Cantilever/Others |
260821_6223_旺矽_daiwa_MPI_009.png |
206KB | 真資料圖 | CPO 測試流程圖(Teradyne):Wafer 段 Insertion 1(PIC 或 PIC+EIC,光探針+電探針)、Insertion 2(PIC and EIC,電探針+光探針);Optical Engine 段 Insertion 3(單顆 OE 置於 interposer 或含光纖連接器封裝,含 connector automation 與 fiber alignment);Packaged Module 段 Insertion 4(Switch 或 XPU 與周邊共封裝光引擎整合)。下方兩條註記:每一 insertion 的元件價值、報廢成本與測試複雜度遞增;在整合進高價 switch/XPU 前先辨識 KGD 與 Known Good Devices(shift test left) |
260821_6223_旺矽_daiwa_MPI_010.png |
32KB | 真資料圖 | 堆疊長條+折線圖「MPI: CPO testing equipment revenue growth」(TWDm),2024-2028E:CPO 測試設備自 2026E 起出現(約 500)、2027E 約 1,900、2028E 約 5,600;CPO 占總營收比重(右軸)2026E 約 1% → 2027E 約 4.8% → 2028E 約 9.2% |
260821_6223_旺矽_daiwa_MPI_011.png |
10KB | 真資料圖 | 堆疊長條圖「MPI: capacity expansion plan」(mn pin/月):2025 約 2.2(MEMS 約 1.0+VPC 約 1.2)、2026E 5.5(MEMS 3.5+VPC 2.0)、2027E 9.0(MEMS 約 6.5+VPC 約 2.5) |
260821_6223_旺矽_daiwa_MPI_012.png |
36KB | 真資料圖 | 「MPI: total revenue trend and forecasts」長條+折線,2023-2028E 營收(TWDm)約 8,100/10,200/13,400/23,300/41,400/61,400;YoY(右軸)2026E 約 74%、2027E 見頂約 78%、2028E 回落至約 48% |
260821_6223_旺矽_daiwa_MPI_013.png |
33KB | 真資料圖 | 「MPI: gross margin」長條(毛利額 TWDm)+折線(毛利率),2022-2028E:毛利額由約 3,400 升至約 39,000;毛利率由約 46% 升至約 63%,2025→2026E 有一段明顯跳升 |
260821_6223_旺矽_daiwa_MPI_014.png |
32KB | 真資料圖 | 「MPI: operating margin trend and forecasts」長條(營業利益 TWDm)+折線(營益率),2022-2028E:營業利益由約 1,250 升至約 28,350;營益率由約 17% 升至約 46% |
260821_6223_旺矽_daiwa_MPI_015.png |
15KB | 真資料圖 | 「MPI: free cash flow」長條圖(TWDm),2022-2028E:2025 為負(約 -1,800)、2026E 接近零、2027E 轉正約 9,300、2028E 約 19,000 |
260821_6223_旺矽_daiwa_MPI_016.png |
31KB | 真資料圖 | 存貨長條(TWDm)+DIO 折線(右軸天數),2021-2028E:存貨由約 2,500 升至約 17,800;DIO 於 2026E 見高約 275 天後回落至 2028E 約 243 天 |
260821_6223_旺矽_daiwa_MPI_017.png |
25KB | 真資料圖 | 股利長條(TWD)+配息率折線,2022-2028E:股利由 7 元升至約 159 元;配息率由約 54% 升至 2024 年後穩定於約 66-67% |
260821_6223_旺矽_daiwa_MPI_018.png |
41KB | 真資料圖 | 「MPI: blended 12-month PER bands」本益比帶圖 |
260821_6223_旺矽_daiwa_MPI_019.png |
34KB | 真資料圖 | 「MPI: blended 12-month PBR bands」,Aug-23~Aug-26,股價線疊 2x/10x/15x/25x/30x 股價淨值比帶;2026 年 8 月股價落在 25x-30x 帶附近 |
260821_6223_旺矽_daiwa_MPI_020.png |
24KB | 真資料圖 | 外資持股比重(%)日線,2026-01-02~2026-08:由約 34-36% 於 4 月中旬單日跳降至約 28%,之後在 28-30% 區間橫盤,8 月底約 28% |
原始內容
Taiwan
MPI Corp (6223 TT)
MPI Corp
Target price:
TWD8,415.00
Share price (20 Aug): TWD5,650.00 | Up/downside: +48.9%
Initiation: mining the AI ASIC & CPO build-out
- Dominating customer ASICs and capturing spillover orders from CPUs
- Price hikes of MEMS probe cards and early-mover advantage in CPO
- Initiating our coverage with a Buy (1) call and 12M TP of TWD8,415
Investment case: We initiate coverage of MPI, a global leader in semiconductor testing interfaces and automated test equipment (ATE), with a Buy (1) rating. We view MPI as a key beneficiary of the AI ASIC trend, given its near-exclusive relationships with major US cloud service providers (CSPs) for custom AI ASICs. It is also capturing orders for server CPUs, as overseas competitors face capacity bottlenecks.
Technology transition to high-ASP MEMS. Advanced nodes (3nm/2nm) and larger package sizes are driving pin counts above 40k+ per assembly. Micro-electro-mechanical system (MEMS) probe cards are priced 20-30% higher vs. vertical probe cards (VPC) and are fast becoming the preferred technology and is substantially expanding revenue per wafer test. We believe MEMS probe cards will become the standard testing interface across almost all ASIC platforms from 2027E, driving MPI's gross margin expansion from 59.7% to 63% over 2026-28E.
Early mover in co-packaged optics (CPO) testing. Leveraging its photonics automation (PA) and advanced semiconductor test (AST) divisions, MPI provides turnkey electro-optical wafer-level testing and automated systems across critical CPO nodes (Insertion 2 and 3). We expect CPO testing equipment shipments and revenue recognition for MPI to commence in 4Q26, contributing 4.8-9.2% of revenue in 2027-28E.
Aggressive capacity expansion and vertical integration. MPI plans to double its monthly VPC/MEMS pin capacity from 5.5m pins (end-2026) to 9.0m pins (end-2027). We believe execution of capacity expansion could outpace management guidance, driven by robust ASIC demand. Besides, the commissioning of its dedicated Hsinchu PCB facility (>50% internal self-sufficiency rate) compresses new product introduction (NPI) lead times and eliminates third-party mark-ups, insulating operating leverage.
Catalysts: 1) Price hikes driven by supply tightness and structurally increased ASPs; 2) better-than-expected capacity expansion; and 3) revenue recognition from CPO testing equipment.
Valuation: Given the structural shift to MEMS probe cards and the potential for CPO testing equipment, we initiate coverage of MPI with a Buy (1) rating and 12-month TP of TWD8,415, based on a target PER of 65x applied to our 4-quarter-forward EPS. Our valuation is supported by our EPS CAGR of 78% over 2026-28E.
Risks: 1) Competitive and pricing pressure; 2) AI/HPC slowdown could delay ramp-up; 3) slower-than-expected CPO commercialisation.
21 August 2026
4
Daiwa
5
3
2
1
Buy
Leon Chen
Leon Chen (886) 2 8758 6247 leon.chen@daiwacm-cathay.com.tw
Stacy Lin (886) 2 8758 6252 stacy.lin@daiwacm-cathay.com.tw
Share price performance
| 12-month range | 1,180.00-7,380.00 |
|---|---|
| Market cap (USDbn) | 17.31 |
| 3m avg daily turnover (USDm) | 201.46 |
| Shares outstanding (m) | 98 |
| Major shareholder | WANG HSI INVESTMENT (8.5%) |
Financial summary (TWD)
| Year to 31 Dec | 26E | 27E | 28E |
|---|---|---|---|
| Revenue (m) | 23,299 | 41,448 | 61,445 |
| Operating profit (m) | 8,583 | 17,274 | 28,350 |
| Net profit (m) | 7,217 | 14,053 | 22,905 |
| Core EPS (fully-diluted) | 73.642 | 143.403 | 233.734 |
| EPS change (%) | 119.9 | 94.7 | 63.0 |
| Daiwa vs Cons. EPS (%) | 12.8 | 9.8 | 1.6 |
| PER (x) | 76.7 | 39.4 | 24.2 |
| Dividend yield (%) | 0.9 | 1.7 | 2.8 |
| DPS | 48.6 | 96.1 | 158.9 |
| PBR (x) | n.a. | 20.1 | 13.5 |
| EV/EBITDA (x) | 57.6 | 29.8 | 18.2 |
| ROE (%) | 44.0 | 61.4 | 66.8 |
Source: FactSet, Daiwa forecasts
Table of contents
| Scaling new heights in the AI ASIC & CPO era .......................................................6 |
|---|
| Dominance in AI accelerators ..............................................................................................6 |
| MEMS upgrade and content expansion...............................................................................7 |
| Early mover advantage in CPO ...........................................................................................8 |
| Capacity expansion to capture the AI megatrend................................................................9 |
| Financial analysis.....................................................................................................10 |
| Revenue growth over 2026-28E ........................................................................................10 |
| Gross margin growth over 2026-28E.................................................................................11 |
| Operating leverage profile..................................................................................................11 |
| Balance sheet and cash flow .............................................................................................11 |
| Valuation and recommendation..............................................................................13 |
| Initiating coverage with a Buy (1) rating.............................................................................13 |
| Risks to our call..................................................................................................................13 |
| Appendix...................................................................................................................14 |
| Company introduction ........................................................................................................14 |
| Shareholder structure ........................................................................................................14 |
| ESG analysis.............................................................................................................15 |
MPI Corp (6223 TT): 21 August 2026
Daiwa
valuation carnings revisions
5
4
Buy
(initiation)
Growth outlook
We forecast MPI's revenue to deliver a 62% CAGR over 2026-28E, driven by strong AI ASIC demand, accelerating adoption of high-pin-count MEMS probe cards, capacity expansion and the commercial ramp-up of CPO testing equipment. We forecast gross margin to expand from 59.7% in 2026E to 63% in 2028E, on structural product mix upgrades, the ramp up in shipments of CPO test systems, and greater vertical integration following in-house PCB capacity expansion.
Valuation
Our 12-month TP of TWD8,415 is based on a target PER of 65x, applied to our 4-quarter-forward EPS. Our valuation is supported by our 78% EPS CAGR over 2026-28E. Although the recent share-price pullback was triggered by management's relatively conservative 2H26 guidance, we view this as an attractive entry window for long-term investors. With more AI/HPC probe card pull-ins and capacity coming online, we see upside to management's guidance by year-end.
Earnings revisions
Bloomberg consensus 2026-27E EPS estimates have gradually trended higher over the past year, likely reflecting stronger earnings visibility from the accelerated expansion of VPC and MEMS capacity and improving order visibility for CPO testing equipment. MPI is currently covered by 14 brokers, indicating broadening investor interest and growing market recognition of its multi-year AI and CPO growth prospects.
3
2
1
MPI Corp (6223 TT): 21 August 2026
How do we justify our view?
Growth outlook
Valuation
Earnings revisions
MPI: revenue and gross margin outlook
Source: Company, Daiwa forecasts
MPI: 1-year-forward PER bands
MPI: Bloomberg-consensus earnings revisions
Source: Bloomberg
Daiwa
Financial summary
Key assumptions
| Year to 31 Dec | 2021 | 2022 | 2023 | 2024 | 2025 | 2026E | 2027E | 2028E |
|---|---|---|---|---|---|---|---|---|
| Server CPU Shipment (m) | 38 | 36 | 23 | 22 | 28 | 36 | 49 | 58 |
| AI GPU/ASIC Shipment (m) | 0 | 0 | 4 | 9 | 12 | 18 | 29 | 33 |
| Smartphone Shipment (m) | 1,655 | 1,437 | 1,381 | 1,439 | 1,429 | 1,249 | 1,235 | 1,303 |
Profit and loss (TWDm)
| Year to 31 Dec | 2021 | 2022 | 2023 | 2024 | 2025 | 2026E | 2027E | 2028E |
|---|---|---|---|---|---|---|---|---|
| Probe Card | 3,620 | 4,130 | 4,125 | 5,900 | 9,050 | 17,077 | 32,685 | 47,137 |
| Equipment | 1,196 | 2,096 | 2,586 | 2,746 | 2,550 | 3,117 | 5,314 | 10,501 |
| Other Revenue | 1,693 | 1,186 | 1,436 | 1,526 | 1,771 | 3,106 | 3,449 | 3,808 |
| Total Revenue | 6,509 | 7,412 | 8,147 | 10,172 | 13,371 | 23,299 | 41,448 | 61,445 |
| Other income | 0 | 0 | 0 | 0 | 0 | 0 | 0 | 0 |
| COGS | (3,765) | (4,006) | (4,250) | (4,611) | (5,943) | (9,391) | (15,979) | (22,715) |
| SG&A | (1,192) | (1,407) | (1,591) | (1,973) | (2,384) | (3,745) | (5,812) | (7,468) |
| Other op.expenses | (745) | (748) | (830) | (1,089) | (1,276) | (1,535) | (2,383) | (2,912) |
| Operating profit | 808 | 1,250 | 1,471 | 2,483 | 3,775 | 8,583 | 17,274 | 28,350 |
| Net-interest inc./(exp.) | (7) | (14) | (26) | (31) | (72) | (126) | (156) | (170) |
| Assoc/forex/extraord./others | 28 | 209 | 137 | 343 | 142 | 556 | 448 | 451 |
| Pre-tax profit | 829 | 1,446 | 1,582 | 2,795 | 3,844 | 9,013 | 17,566 | 28,631 |
| Tax | (133) | (229) | (264) | (490) | (666) | (1,791) | (3,513) | (5,726) |
| Min. int./pref. div./others | (2) | (4) | (7) | (3) | (2) | (5) | 0 | 0 |
| Net profit (reported) | 694 | 1,214 | 1,312 | 2,301 | 3,177 | 7,217 | 14,053 | 22,905 |
| Net profit (adjusted) | 694 | 1,214 | 1,312 | 2,301 | 3,177 | 7,217 | 14,053 | 22,905 |
| EPS (reported)(TWD) | 7.438 | 12.892 | 13.922 | 24.423 | 33.492 | 73.642 | 143.403 | 233.734 |
| EPS (adjusted)(TWD) | 7.438 | 12.892 | 13.922 | 24.423 | 33.492 | 73.642 | 143.403 | 233.734 |
| EPS (adjusted fully-diluted)(TWD) | 7.438 | 12.892 | 13.922 | 24.423 | 33.492 | 73.642 | 143.403 | 233.734 |
| DPS (TWD) | 4.000 | 7.000 | 7.500 | 16.014 | 22.000 | 48.606 | 96.080 | 158.939 |
| EBIT | 808 | 1,250 | 1,471 | 2,483 | 3,775 | 8,583 | 17,274 | 28,350 |
| EBITDA | 1,304 | 1,776 | 2,008 | 3,039 | 4,566 | 9,613 | 18,407 | 29,597 |
Cash flow (TWDm)
| Year to 31 Dec | 2021 | 2022 | 2023 | 2024 | 2025 | 2026E | 2027E | 2028E |
|---|---|---|---|---|---|---|---|---|
| Profit before tax | 829 | 1,446 | 1,582 | 2,795 | 3,844 | 9,013 | 17,566 | 28,631 |
| Depreciation and amortisation | 497 | 525 | 537 | 556 | 792 | 1,030 | 1,133 | 1,247 |
| Tax paid | (133) | (229) | (264) | (490) | (666) | (1,791) | (3,513) | (5,726) |
| Change in working capital | (274) | 51 | (213) | (1,249) | (1,258) | (2,410) | (1,150) | (1,853) |
| Other operational CF items | (277) | (77) | (596) | 485 | (674) | 809 | 0 | 0 |
| Cash flow from operations | 641 | 1,717 | 1,046 | 2,097 | 2,038 | 6,651 | 14,036 | 22,298 |
| Capex | (762) | (291) | (312) | (218) | (3,881) | (6,822) | (4,776) | (3,343) |
| Net (acquisitions)/disposals | 0 | 0 | 0 | 0 | 0 | 0 | 0 | 0 |
| Other investing CF items | (390) | (177) | (957) | (1,125) | (194) | (871) | 296 | 252 |
| Cash flow from investing | (1,152) | (469) | (1,269) | (1,343) | (4,075) | (7,693) | (4,480) | (3,091) |
| Change in debt | (32) | (98) | (455) | 482 | 4,051 | 5,383 | 0 | 0 |
| Net share issues/(repurchases) | 0 | 0 | 0 | 0 | 0 | 0 | 0 | 0 |
| Dividends paid | (416) | (376) | (660) | (707) | (1,508) | (2,156) | (4,763) | (9,415) |
| Other financing CF items | 837 | 291 | 1,549 | 583 | 1,217 | 398 | 0 | 0 |
| Cash flow from financing | 389 | (182) | 434 | 357 | 3,761 | 3,626 | (4,763) | (9,415) |
| Forex effect/others | 0 | (8) | (9) | 14 | 12 | 21 | 31 | 24 |
| Change in cash | (121) | 1,058 | 202 | 1,125 | 1,735 | 2,605 | 4,824 | 9,816 |
| Free cash flow | (121) | 1,426 | 734 | 1,879 | (1,843) | (171) | 9,260 | 18,955 |
Source: FactSet, Daiwa forecasts
MPI Corp (6223 TT): 21 August 2026
Daiwa
Financial summary continued …
Balance sheet (TWDm)
| Year to 31 Dec | 2021 | 2022 | 2023 | 2024 | 2025 | 2026E | 2027E | 2028E |
|---|---|---|---|---|---|---|---|---|
| Cash & short-term investment | 1,324 | 2,382 | 2,579 | 3,695 | 5,437 | 8,050 | 12,874 | 22,689 |
| Inventory | 2,575 | 2,747 | 2,752 | 3,477 | 5,011 | 9,111 | 12,723 | 17,752 |
| Accounts receivable | 1,384 | 1,123 | 1,338 | 2,050 | 2,411 | 4,440 | 6,361 | 9,288 |
| Other current assets | 147 | 155 | 235 | 283 | 458 | 669 | 669 | 669 |
| Total current assets | 5,430 | 6,408 | 6,904 | 9,505 | 13,318 | 22,270 | 32,626 | 50,398 |
| Fixed assets | 4,261 | 4,300 | 5,263 | 6,655 | 9,983 | 17,951 | 21,594 | 23,690 |
| Goodwill & intangibles | 0 | 0 | 0 | 0 | 0 | 0 | 0 | 0 |
| Other non-current assets | 166 | 195 | 273 | 318 | 702 | 914 | 617 | 365 |
| Total assets | 9,857 | 10,903 | 12,440 | 16,479 | 24,003 | 41,135 | 54,838 | 74,453 |
| Short-term debt | 120 | 111 | 170 | 858 | 1,366 | 1,410 | 1,410 | 1,410 |
| Accounts payable | 1,520 | 1,684 | 1,878 | 3,108 | 4,040 | 11,056 | 15,439 | 21,541 |
| Other current liabilities | 898 | 1,000 | 1,057 | 1,707 | 2,163 | 3,161 | 3,161 | 3,161 |
| Total current liabilities | 2,538 | 2,794 | 3,105 | 5,673 | 7,569 | 15,628 | 20,010 | 26,112 |
| Long-term debt | 1,135 | 1,039 | 1,511 | 1,305 | 1,337 | 6,721 | 6,721 | 6,721 |
| Other non-current liabilities | 137 | 176 | 203 | 193 | 518 | 559 | 559 | 559 |
| Total liabilities | 3,810 | 4,009 | 4,819 | 7,172 | 9,424 | 22,908 | 27,290 | 33,392 |
| Share capital | 941 | 942 | 942 | 942 | 980 | 980 | 980 | 980 |
| Reserves/R.E./others | 5,107 | 5,952 | 6,678 | 8,365 | 13,599 | 17,248 | 26,568 | 40,081 |
| Shareholders' equity | 6,048 | 6,894 | 7,620 | 9,307 | 14,579 | 18,227 | 27,547 | 41,061 |
| Minority interests | 0 | 0 | 0 | 0 | 0 | 0 | 0 | 0 |
| Total equity & liabilities | 9,857 | 10,903 | 12,440 | 16,479 | 24,003 | 41,135 | 54,838 | 74,453 |
| EV | 553,602 | 552,439 | 552,774 | 552,139 | 550,938 | 553,753 | 548,930 | 539,114 |
| Net debt/(cash) | (69) | (1,233) | (898) | (1,532) | (2,734) | 82 | (4,742) | (14,558) |
| BVPS (TWD) | 64.187 | 73.070 | 80.807 | 98.723 | 148.790 | 186.029 | 281.150 | 419.070 |
Key ratios (%)
| Year to 31 Dec | 2021 | 2022 | 2023 | 2024 | 2025 | 2026E | 2027E | 2028E |
|---|---|---|---|---|---|---|---|---|
| Sales (YoY) | 9.8 | 13.9 | 9.9 | 24.9 | 31.5 | 74.2 | 77.9 | 48.2 |
| EBITDA (YoY) | (7.4) | 36.1 | 13.1 | 51.4 | 50.3 | 110.5 | 91.5 | 60.8 |
| Operating profit (YoY) | (6.1) | 54.8 | 17.7 | 68.7 | 52.0 | 127.4 | 101.2 | 64.1 |
| Net profit (YoY) | (2.9) | 74.9 | 8.1 | 75.4 | 38.0 | 127.2 | 94.7 | 63.0 |
| Core EPS (fully-diluted) (YoY) | (11.5) | 73.3 | 8.0 | 75.4 | 37.1 | 119.9 | 94.7 | 63.0 |
| Gross-profit margin | 42.1 | 46.0 | 47.8 | 54.7 | 55.6 | 59.7 | 61.4 | 63.0 |
| EBITDA margin | 20.0 | 24.0 | 24.6 | 29.9 | 34.1 | 41.3 | 44.4 | 48.2 |
| Operating-profit margin | 12.4 | 16.9 | 18.1 | 24.4 | 28.2 | 36.8 | 41.7 | 46.1 |
| Net profit margin | 10.7 | 16.4 | 16.1 | 22.6 | 23.8 | 31.0 | 33.9 | 37.3 |
| ROAE | 11.9 | 18.8 | 18.1 | 27.2 | 26.6 | 44.0 | 61.4 | 66.8 |
| ROAA | 7.4 | 11.7 | 11.2 | 15.9 | 15.7 | 22.2 | 29.3 | 35.4 |
| ROCE | 11.7 | 16.3 | 17.0 | 23.9 | 26.3 | 39.3 | 55.7 | 66.8 |
| ROIC | 12.2 | 18.1 | 19.8 | 28.2 | 31.8 | 45.6 | 67.2 | 92.0 |
| Net debt to equity | net cash | net cash | net cash | net cash | net cash | 0.4 | net cash | net cash |
| Effective tax rate | 16.1 | 15.8 | 16.7 | 17.5 | 17.3 | 19.9 | 20.0 | 20.0 |
| Accounts receivable (days) | 71.2 | 61.7 | 55.1 | 60.8 | 60.9 | 53.7 | 47.6 | 46.5 |
| Current ratio (x) | 2.1 | 2.3 | 2.2 | 1.7 | 1.8 | 1.4 | 1.6 | 1.9 |
| Net interest cover (x) | 122.9 | 106.4 | 61.7 | 92.3 | 54.5 | 72.4 | 113.6 | 169.4 |
| Net dividend payout | 53.8 | 54.3 | 53.9 | 65.6 | 65.7 | 66.0 | 67.0 | 68.0 |
| Free cash flow yield | n.a. | 0.3 | 0.1 | 0.3 | n.a. | n.a. | 1.7 | 3.4 |
Source: FactSet, Daiwa forecasts
Company profile
Founded in Hsinchu in 1995, MPI is a leading global probe card supplier offering CPC, VPC and MEMS solutions, alongside photonics, semiconductor and thermal testing equipment. Growth is driven by expanding AI/HPC demand, rising MEMS adoption, capacity expansion, deeper vertical integration and emerging opportunities in CPO testing.
MPI Corp (6223 TT): 21 August 2026
Daiwa
MPI Corp (6223 TT): 21 August 2026
Daiwa
Scaling new heights in the AI ASIC & CPO era
Dominance in AI accelerators
Well positioned to capture growing AI ASIC probe card demand, benefiting from high switching costs and expanding production ramp ups
Founded in 1995, MPI Corporation is a global leader in semiconductor testing interfaces and automated test equipment (ATE). Starting with cantilever probe cards (CPCs), MPI has now transitioned into advanced wafer-level testing. Per management, the probe cards business accounted for 68% of its total revenue in 2025. In addition, MPI is currently the world's No.1 vertical probe card (VPC) supplier, with a 31% global market share in terms of revenue according to Yole Intelligence and maintains near-exclusive supply relations with major US networking clients, per management. We believe this entrenched position directly links MPI to core custom AI ASIC projects across top-tier CSPs.
Global: non-memory probe card supplier ranking
Source: Techinsights
Global: non-memory probe card TAM
Source: Company, Daiwa forecasts
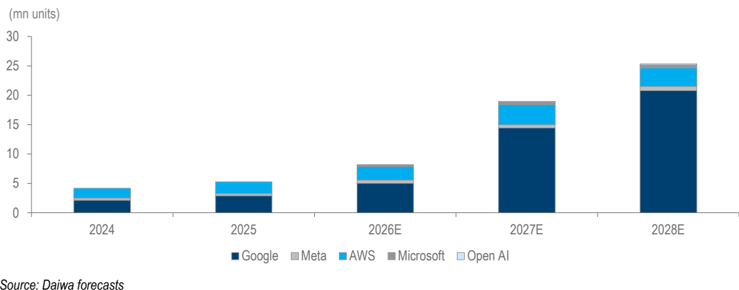
Benefiting from Taiwan's semiconductor manufacturing cluster, we believe MPI has maintained a high market share across these ASIC projects and is progressively becoming the exclusive supplier. As highlighted in our Initiation: paradigm shift accelerated by AI report, the test interface represents a minute fraction - typically less than 1-2% - of total COGS. Even with structural growth driven by ASP expansion, we believe the cost-to-value ratio remains relatively small. This is reinforced by high switching costs, as clients are highly price inelastic when yield insurance is at stake. Therefore, with more ASIC projects being developed and moving into mass production, we expect demand for probe cards is bound to grow and MPI has positioned itself at the centre of the AI megatrend.
Global: ASIC shipments
Source: Daiwa forecasts
The migration towards advanced process nodes and larger AI packages is accelerating MEMS probe card adoption, driving both pin-content and ASP expansion
MPI Corp (6223 TT): 21 August 2026
Daiwa
In addition to its market-leading position in AI ASICs, we note that agentic AI is also driving a massive surge in compute requirements for server CPUs - such as NVIDIA Vera CPU and AMD EPYC - as well as high-performance graphics processors. Given the capacity bottlenecks faced by overseas probe card competitors such as FormFactor and Technoprobe, we believe MPI's local engineering support, rapid turn-around-time (TAT), and significant manufacturing scale have enabled it to capture substantial spillover orders across major global chipmakers and transfer to long-term business.
MEMS upgrade and content expansion
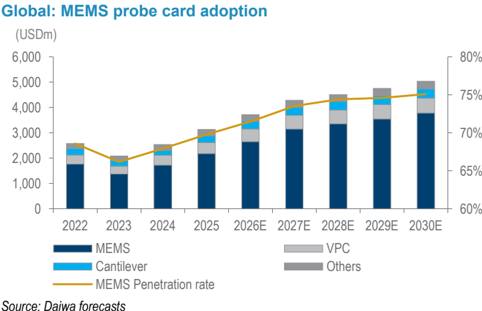
Echoing our Initiation: paradigm shift accelerated by AI , as custom AI accelerator architectures migrate towards 3nm and 2nm leading-edge semiconductor nodes accompanied by significantly larger package dimensions, pin counts are surging from several thousands to over 40k pins per probe card assembly, based on our channel checks. This structural rise in pin density and signal integrity requirements is rapidly driving a transition from traditional cobra needle architectures to ultra-fine-pitch MEMS probe cards. We expect MEMS probe cards to be adopted across nearly all AI GPU and ASIC platforms from 2026.
In addition, MEMS probes command a superior ASP of c.USD13-15 per pin, representing a 20-30% premium vs. conventional VPC needles (USD10-13 per pin), which substantially expands the total dollar content per silicon wafer test, per our channel checks. As testing interface expenditure represents less than 1% of total chip manufacturing costs, we believe hyper-scaler customers prioritise test reliability over price and demonstrate extremely high vendor stickiness once a supplier is qualified.
Leveraging its vertical integration model encompassing probe design, ceramic substrate fabrication and automated assembly, MPI delivers uncompromised contact stability and yield preservation. We believe MPI's technical moat will fuel revenue growth in MEMS and VPC probe cards over our forecast horizon.
Comparison between MEMS and traditional VPC
| MEMS probe card | Traditional VPC | |
|---|---|---|
| Manufacturing | Lithography and microfabrication | Precision machining and mechanical assembly |
| Minimum pitch | 35- 45μm | 80-150μm |
| Pin-count scalability | High; >20k probes | Lower scalability at extreme densities |
| Repairability | Specialised; design-dependent | Easier individual-probe replacement |
| Relative cost | Higher | Lower |
| Key applications | AI/HPC, HBM, advanced packaging | PMIC, automotive, MCU, flip- chip |
Source: Formfactor, Daiwa
CPO testing flow
INSERTION 1
PIC or PIC and EIC
Optical |
Electricall
INSERTION 2
PIC and EIC
Electrical|
Probe
Probe
Probe
MPI's photonics testing expertise & automation capabilities positions it as a key beneficiary of the emerging CPO testing ecosystem
Source: Teradvne
Wafer
Optical Engine
INSERTION 3
Individuated OE on interposer or packaged with fiber connectors
MPI Corp (6223 TT): 21 August 2026
Packaged Module
INSERTION 4
High value Switch or XPU integrated with surrounding co-packaged
Early mover advantage in CPO
As traditional copper interconnects reach their physical limits in bandwidth, latency and thermal dissipation, silicon photonics (SiPh), and co-packaged optics (CPO) have emerged as essential paradigm shifts for next-generation AI data centre networks. However, the commercial deployment of CPO architectures faces severe manufacturing bottlenecks, particularly in optical-electrical alignment precision and highly complex multi-stage testing protocols.
CPO testing flow
Source: Teradyne
Combining decades of technical expertise across its Photonics Automation (PA) and Advanced Semiconductor Test (AST) divisions, MPI stands as one of the few global vendors capable of delivering fully integrated wafer-level electro-optical testing interfaces and automated test systems. MPI is strategically positioned across crucial CPO testing nodes, most notably Insertion 2 - performing double-sided electro-optical wafer-level testing on electro-photonic integrated circuits (EPIC) after hybrid bonding - and Insertion 3, which executes optical engine (OE)-level singulated die and module testing.
As foundry leaders such as TSMC ramp their Compact Universal Photonic Engine (COUPE) architecture and primary CSP CPO projects into qualification and volume production through 2026 and 2027, MPI is uniquely positioned to capture dual revenue streams. We believe testing equipment for Insertion 3 will start ramping up and contributing to revenue from 4Q26. In addition, while testing equipment for Insertion 2 is currently undergoing customer qualification, we expect its commercial adoption to pick up momentum as wafer-level optical integration scales in 2Q27.
Backed by strong ecosystem partnerships with ATE leader Advantest and metrology powerhouse Keysight, we believe MPI is uniquely positioned to capture strong tailwinds. Furthermore, we highlight that MPI's ability to bundle automated optical testing equipment with CPO-dedicated probe cards as a turnkey solution creates a compelling value proposition. We believe this integrated offering establishes a powerful second growth pillar for the company, providing multi-year earnings visibility and supporting a long-term valuation premium. We expect CPO testing equipment to account 4.8% of MPI's total revenue in 2027E and 9.2% in 2028E.
Daiwa
MPI's aggressive capacity expansion and PCB vertical integration support long-term AI ASIC and CPO growth
MPI Corp (6223 TT): 21 August 2026
MPI: CPO testing equipment revenue growth
Source: Company, Daiwa forecasts
Capacity expansion to capture the AI megatrend
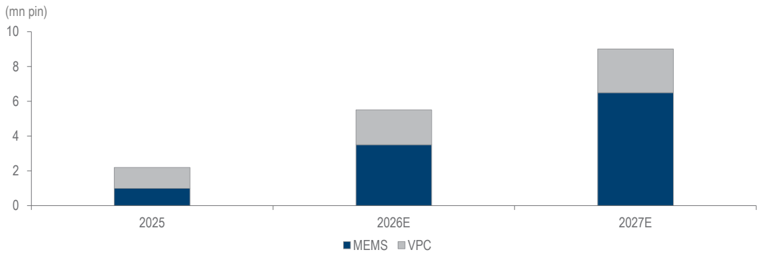
To satisfy booming global demand for AI chip testing, MPI is deploying the largest capex and capacity expansion strategy in its corporate history. Management projects the company's monthly production capacity for VPC and MEMS probe pins to double from 5.5m pins by end-2026 to 9.0m pins by end-2027, underscoring exceptional long-term order visibility and customer commitments. While its headline monthly revenue has yet to return to prior peaks - partly due to revenue-recognition timing lags that keep management's tone conservative - we expect capacity additions to track ahead of official guidance over our forecast horizon, paving the way for the upcoming ASIC ramp cycle. Furthermore, we expect 2028 capacity to outpace 2027 levels, driven by robust demand from AI ASICs and the commercial mass production of CPO.
Furthermore, MPI's newly commissioned, dedicated probe-card PCB facility in Hsinchu targets an internal PCB self-sufficiency rate of over 50%. This vertical integration breakthrough successfully resolves the industry-wide bottleneck in external substrate procurement. By controlling substrate production in-house, MPI can not only dramatically compresses New Product Introduction (NPI) lead times for tier-one clients but also eliminate third-party component margin markups. Consequently, this strategic buildout acts as a primary catalyst insulating operating leverage and driving corporate gross margins towards the landmark 60%+ threshold.
MPI: capacity expansion plan
Source: Company, Daiwa forecasts
Daiwa
We expect AI ASIC ramp ups and the commercialisation of CPO testing equipment to drive MPI's next multiyear growth cycle
MPI Corp (6223 TT): 21 August 2026
Financial analysis
Revenue growth over 2026-28E
Driven by soaring hyperscaler demand for custom AI ASICs and equipment demand for CPO testing, we believe MPI is embarking on a multi-year revenue growth trajectory. We forecast CPC/VPC probe card revenue to increase from TWD9.1bn in 2025 to TWD47.1bn in 2028E. With improved execution on capacity expansion, we believe the original capacity expansion plan could be completed ahead of schedule, potentially before the targeted end2027 completion date. On the other hand, we believe CPO testing equipment will start shipping to clients, recognising revenue in 4Q26 (some may defer to 1Q27). Therefore, we forecast total revenue to increase from TWD13.4bn in 2025 to TWD61.5bn in 2028E, representing 2026-28E top-line CAGR of 62%.
MPI: total revenue trend and forecasts
Source: Company, Daiwa forecasts
MPI: quarterly and annual P&L statements
| 2026E | 2026E | 2026E | 2026E | |||||||||
|---|---|---|---|---|---|---|---|---|---|---|---|---|
| (TWD m) | 1Q | 2Q | 3QE | 4QE | 1QE | 2QE | 3QE | 4QE | 2025 | 2026E | 2027E | 2028E |
| Net sales | 3,933 | 5,233 | 6,100 | 8,033 | 8,961 | 10,008 | 10,971 | 11,508 | 13,371 | 23,299 | 41,448 | 61,445 |
| Gross profit | 2,338 | 3,055 | 3,627 | 4,888 | 5,492 | 6,124 | 6,735 | 7,117 | 7,428 | 13,908 | 25,469 | 38,730 |
| Operating costs | 1,065 | 1,253 | 1,360 | 1,647 | 1,846 | 2,022 | 2,106 | 2,221 | 3,653 | 5,325 | 8,195 | 10,380 |
| Operating profit | 1,273 | 1,802 | 2,267 | 3,241 | 3,646 | 4,103 | 4,629 | 4,896 | 3,775 | 8,583 | 17,274 | 28,350 |
| Pretax profit | 1,525 | 1,906 | 2,306 | 3,276 | 3,698 | 4,154 | 4,728 | 4,986 | 3,844 | 9,013 | 17,566 | 28,631 |
| Net profit | 1,227 | 1,524 | 1,845 | 2,621 | 2,959 | 3,323 | 3,782 | 3,989 | 3,177 | 7,217 | 14,053 | 22,905 |
| EPS (TWD) | 12.53 | 15.55 | 18.82 | 26.74 | 30.19 | 33.91 | 38.60 | 40.71 | 33.49 | 73.65 | 143.40 | 233.73 |
| Operating ratios | ||||||||||||
| Gross margin | 59.4% | 58.4% | 59.5% | 60.9% | 61.3% | 61.2% | 61.4% | 61.8% | 55.6% | 59.7% | 61.4% | 63.0% |
| Operating margin | 32.4% | 34.4% | 37.2% | 40.4% | 40.7% | 41.0% | 42.2% | 42.5% | 28.2% | 36.8% | 41.7% | 46.1% |
| Pre-tax margin | 38.8% | 36.4% | 37.8% | 40.8% | 41.3% | 41.5% | 43.1% | 43.3% | 28.8% | 38.7% | 42.4% | 46.6% |
| Net margin | 31.2% | 29.1% | 30.2% | 32.6% | 33.0% | 33.2% | 34.5% | 34.7% | 23.8% | 31.0% | 33.9% | 37.3% |
| YoY growth | ||||||||||||
| Net revenue | 39% | 59% | 79% | 109% | 128% | 91% | 80% | 43% | 31% | 74% | 78% | 48% |
| Gross profit | 44% | 59% | 99% | 137% | 135% | 100% | 86% | 46% | 34% | 87% | 83% | 52% |
| Operating income | 51% | 67% | 153% | 238% | 186% | 128% | 104% | 51% | 52% | 127% | 101% | 64% |
| Net income | 70% | 142% | 110% | 177% | 141% | 118% | 105% | 52% | 38% | 127% | 95% | 63% |
| QoQ growth | ||||||||||||
| Net revenue | 3% | 33% | 17% | 32% | 12% | 12% | 10% | 5% | ||||
| Gross profit | 13% | 31% | 19% | 35% | 12% | 12% | 10% | 6% | ||||
| Operating income | 33% | 42% | 26% | 43% | 12% | 13% | 13% | 6% | ||||
| Net income | 30% | 24% | 21% | 42% | 13% | 12% | 14% | 5% |
Source: Company, Daiwa forecasts
Daiwa
Structural AI ASIC demand, CPO testing adoption, and greater vertical integration are expected to support further margin expansion
MPI Corp (6223 TT): 21 August 2026
Gross margin growth over 2026-28E
MPI's gross margin significantly improved from 47.8% in 2024 to all-time high of 59.5% in 1Q26, driven by structural demand from AI ASICs. Although gross margin slightly fell to 58.4% in 2Q26, management expects it to recover to 59.5% in 3Q26, with better product mix and price hikes. We forecast MPI's gross margin to expand steadily from 59.7% in 2026E to 63% in 2028E, underpinned by structural product-mix upgrades and enhanced vertical integration. In our view, primary tailwinds include rising penetration of high-ASP MEMS probe cards, the commercial ramp-up in shipments of automated CPO test systems, and 2027 commissioning of MPI's dedicated Hsinchu PCB facility, which targets an internal self-sufficiency rate above 50% to eliminate third-party substrate mark-ups.
Source: Company, Daiwa forecasts
Operating leverage profile
We forecast top-line revenue to expand several-fold over 2026-28E, but operating expense ratios (SG&A ratio: 59%/44% in 2025/2028E; R&D ratio: 26%/31% in 2025/2028E) to decline sharply, triggering a steep expansion in operating margin from 36.8% in 2026E to 46.1% by 2028E. In addition, as the internal self-sufficiency rate improves, we believe this operating leverage will allow operating profit growth (82% CAGR in 2026-28E) to significantly outpace top-line revenue growth over our forecast period.
MPI: operating margin trend and forecasts
Source: Company, Daiwa forecasts
Balance sheet and cash flow
As top-tier CSPs accelerate AI ASIC deployments, we expect MPI's operating cash inflows to expand multi-fold, providing substantial financial flexibility to fund aggressive expansion without straining liquidity. We note that working capital cycles remained healthy; despite revenue scaling rapidly over the past few years, inventory turnover days are well managed due to MPI's high vertical integration and precise supply-chain control over core probe card raw materials and substrates.
Daiwa
MPI: free cash flow
Source: Company, Daiwa forecasts
MPI Corp (6223 TT): 21 August 2026
MPI: inventory and days of inventory trend and forecasts
Source: Company, Daiwa forecasts
To support unprecedented order visibility, MPI is executing the largest capital expenditure plan in its history. Despite elevated capital outlays during the company's proposed 2026-27 capex peak, we believe net profit growth (with a 2026-28E EPS CAGR of 78%) will generate powerful operating cash flows. This would lead to free cash flow rapidly expanding, covering capex requirements while maintaining a sustainable dividend payout ratio of c.66% and an attractive ROE of 60%+ over 2027-2028E.
MPI: dividend & payout ratio
Source: Company, Daiwa forecasts
Daiwa
We initiate coverage of MPI with a Buy (1) rating on AI ASIC projects ramp-up
Risks to our call
- Competitive and pricing pressure - primary risk: Continued investment by global and regional probe card suppliers could intensify competition for key design wins, constrain MPI's market-share expansion and place pressure on pricing and margins in high-end applications.
- AI/HPC demand concentration - secondary risk: MPI's growth remains highly exposed to hyperscaler capex and AI chip roadmaps. Any moderation in infrastructure spending or platform delays could slow project ramp-ups, defer revenue recognition and reduce earnings visibility.
- CPO commercialisation risk - secondary risk: CPO testing remains at an early stage, with significant technical, qualification and ecosystem coordination requirements. Slower-than-expected industry adoption could delay MPI's anticipated revenue contribution and weaken its medium-term growth outlook.
MPI Corp (6223 TT): 21 August 2026
Valuation and recommendation
Initiating coverage with a Buy (1) rating
Given the structural shift in MEMS probe card and the potential of CPO testing equipment, we initiate coverage of MPI with a Buy (1) rating and 12-month TP of TWD8,415. Our TP is based on a target PER of 65x applied to our 4-quarter-forward EPS. Our valuation is supported by our 2026-28E EPS CAGR of 78%.
Following the company's 2Q26 earnings call, the market experienced a short-term pullback primarily triggered by management's relatively conservative 2H26 guidance. However, we view this as an attractive entry window for long-term investors. In our view, the muted outlook reflects management's customary prudence and capacity lead-time constraints rather than softening end-demand. With more AI/HPC probe card pull-ins and capacity coming online, we see clear upside potential to beat management guidance by year-end. We believe MPI's structural story remains intact.
MPI: blended 12-month PER bands (past 3 years)
Source: Bloomberg
Peers valuation
| Share price | Mkt cap | Daily turnover | EPS CAGR | PER (x) | PER (x) | PER (x) | PBR (x) | PBR (x) | PBR (x) | ROE (%) | ROE (%) | ROE (%) | |||
|---|---|---|---|---|---|---|---|---|---|---|---|---|---|---|---|
| Companies | Ticker | Rating | (LC) | (USDm) | (USDm) | 2026-28E | 2026E | 2027E | 2028E | 2026E | 2027E | 2028E | 2026E | 2027E | 2028E |
| MPI* | 6223 TT | Buy | 5,650.0 | 17,331 | 201.7 | 78% | 76.7 | 39.4 | 24.2 | 30.4 | 20.1 | 13.5 | 44.0 | 61.4 | 66.8 |
| Winway* | 6515 TT | Buy | 6,380.0 | 7,198 | 105.4 | 101% | 66.5 | 31.1 | 16.4 | 30.8 | 18.7 | 11.1 | 49.9 | 75.0 | 84.9 |
| CHPT* | 6510 TT | Buy | 2,760.0 | 2,833 | 58.8 | 57% | 44.6 | 22.8 | 18.2 | 8.4 | 6.6 | 5.4 | 20.8 | 32.3 | 32.7 |
| Formfactor | FORM US | Not Rated | 115.7 | 9,039 | 0.1 | 20% | 37.7 | 29.7 | 26.4 | n.a. | n.a. | n.a. | 18.1 | 21.3 | n.a. |
| Technoprobe | TPRO IM | Not Rated | 27.7 | 21,144 | 4.7 | 36% | 52.2 | 35.7 | 28.4 | 11.3 | 8.7 | 6.7 | 23.6 | 25.9 | 25.9 |
| MJC | 6871 JP | Not Rated | 13,310.0 | 3,348 | 628.4 | 99% | 54.7 | 17.7 | 13.8 | 8.9 | 4.9 | 3.8 | 31.0 | 34.0 | 34.1 |
| Leeno* | 058470 | Buy | 66,300.0 | 3,646 | 4,231.8 | 16% | 26.3 | 22.7 | 19.4 | 6.3 | 5.3 | 4.5 | 25.1 | 25.5 | 25.2 |
| Average | 51.2 | 28.4 | 21.0 | 16.0 | 10.7 | 7.5 | 30.3 | 39.4 | 44.9 |
Source: Bloomberg, *Daiwa forecasts Note: Share prices as of 20 Aug 2026
MPI: blended 12-month PBR bands (past 3 years)
Source: Bloomberg
Daiwa
MPI is a leading global probe card supplier with a vertically integrated model and broad exposure to AI, HPC and emerging CPO testing applications
Appendix
Company introduction
Founded in Hsinchu in 1995, MPI initially focused on cantilever probe cards before broadening its portfolio through organic development and acquisitions. It became Taiwan's first publicly listed probe card company in 2003 and has since established itself as one of the world's leading probe card suppliers.
MPI offers a full spectrum of CPC, VPC and MEMS probe cards. Its equipment businesses also provide photonics automation, advanced semiconductor testing and extremetemperature thermal solutions. The company serves a diversified customer base spanning leading IC design vendors, as well as major foundries and OSATs.
MPI's key competitive advantage lies in its vertically integrated manufacturing model, with probes and substrates produced in-house and high-layer PCB capacity currently being expanded. This structure enhances design flexibility, strengthens supply-chain control and shortens delivery lead. Combined with its proximity to Taiwan's semiconductor ecosystem and early customer engagement, these capabilities position MPI to capture rising demand for AI/HPC probe cards and emerging CPO testing solutions.
Shareholder structure
MPI's shareholder base is relatively diversified, with no single shareholder holding a controlling stake. The largest shareholder, Wang Hsi Investment Co., Ltd., owns c.8.5%, while other major holders include domestic pension funds and global institutional investors such as Vanguard, BlackRock, JPMorgan and Dresdner Bank. Notably, MPI has a high free float of c.73.6%, supporting strong trading liquidity and broad institutional participation.
MPI: shareholder structure (as of 20 August 2026)
| Holder | Share (%) |
|---|---|
| WANG HSI INVESTMENT CO LTD | 8.51 |
| NEW LABOR PENSION FUND | 8.49 |
| Uni-President Asset Management Corp/Taiwan | 5.99 |
| Dresdner BankAG | 5.75 |
| Vanguard Group Inc/The | 4.84 |
| Blackrock Inc | 3.22 |
| JPMorgan Chase & Co | 2.81 |
| OLD LABOR RETIREMENT FUND | 2.57 |
| Fuh Hwa Investment Trust Co Ltd | 2.05 |
| CIVIL SERVANTS PENSION FUND | 1.98 |
Source: Bloomberg, Company
MPI: foreign institutional ownership trend
Source: Company, Daiwa forecasts
MPI Corp (6223 TT): 21 August 2026
Daiwa
ESG analysis
ESG risks
| Risks | Risks | Management | Analyst comments |
|---|---|---|---|
| Executive/board quality | 2 | MPI maintains a robust governance framework with an independent board, specialized committees, and regular ESG oversight to strengthen transparency, accountability, and long- term sustainability. | |
| G | Capital management | 2 | The company follows a prudent financial strategy, balancing growth investments, R&D spending, and cash flow management to enhance long-term shareholder value. |
| Related party & transaction | 2 | MPI enforces strict conflict-of-interest and related-party transaction controls through board oversight, audit committee review, disclosure requirements, and recusal mechanisms to ensure transparency, fairness, and the protection of shareholder interests. | |
| S | Supply chain management | 1 | MPI promotes responsible supply chain management through supplier assessments, ESG integration, sustainability audits, and ongoing engagement to enhance supply chain resilience. |
| E | Water & wastewater management | 2 | MPI implements water conservation and wastewater control measures, focusing on efficient resource utilization, pollution prevention, and sustainable water management practices. |
Note: Management score represents a company's ability to manage/benefit from certain ESG topics. The scores range from 1 to 3, with 1 being the strongest.
Update Date: 21 Aug 2026
Source: Daiwa, Company
MPI Corp (6223 TT): 21 August 2026
Daiwa
Daiwa's Asia Pacific Research Directory
| HONG KONG | HONG KONG | HONG KONG |
|---|---|---|
| Hiroyuki GOTO | (852) 2773 8870 | hiroyuki.goto@hk.daiwacm.com |
| Regional Head of Equity, Asia & Oceania; Regional Head of Asia Pacific Research | Regional Head of Equity, Asia & Oceania; Regional Head of Asia Pacific Research | Regional Head of Equity, Asia & Oceania; Regional Head of Asia Pacific Research |
| John HETHERINGTON | (852) 2773 8787 | john.hetherington@hk.daiwacm.com |
| Co-Head of Asia Pacific Research and Head of Research Publications | Co-Head of Asia Pacific Research and Head of Research Publications | Co-Head of Asia Pacific Research and Head of Research Publications |
| Li XIONG | (852) 2773 8878 | li.xiong@hk.daiwacm.com |
| Yue TAN | (852) 2848 4947 | yue.tan@hk.daiwacm.com |
| Strategy (Greater China) and Macro Economics (China) | Strategy (Greater China) and Macro Economics (China) | Strategy (Greater China) and Macro Economics (China) |
| Kelvin LAU | (852) 2848 4467 | kelvin.lau@hk.daiwacm.com |
| Regional Head of Automobiles, Industrials and Transportation | Regional Head of Automobiles, Industrials and Transportation | Regional Head of Automobiles, Industrials and Transportation |
| Evelyn ZHANG | (852) 2848 4970 | evelyn.zhang@hk.daiwacm.com |
| Automobiles and Components (Hong Kong/China) | Automobiles and Components (Hong Kong/China) | Automobiles and Components (Hong Kong/China) |
| Carol XIA | (852) 2532 4349 | carol.xia@hk.daiwacm.com |
| Head of China Consumer; Consumer (Hong Kong/China) | Head of China Consumer; Consumer (Hong Kong/China) | Head of China Consumer; Consumer (Hong Kong/China) |
| Steven NIE | (852) 2848 4464 | steven.nie@hk.daiwacm.com |
| Consumer (Hong Kong/China); Global Cryptocurrency | Consumer (Hong Kong/China); Global Cryptocurrency | Consumer (Hong Kong/China); Global Cryptocurrency |
| Siman CHEN | (852) 2532 4350 | siman.chen@hk.daiwacm.com |
| Consumer (Hong Kong/China) | Consumer (Hong Kong/China) | Consumer (Hong Kong/China) |
| Jing YANG | (852) 2532 4308 | jing.yang@hk.daiwacm.com |
| Head of China Healthcare | Head of China Healthcare | Head of China Healthcare |
| John CHOI | (852) 2773 8730 | john.choi@hk.daiwacm.com |
| Head of China Internet; Regional Head of Emerging Opportunities | Head of China Internet; Regional Head of Emerging Opportunities | Head of China Internet; Regional Head of Emerging Opportunities |
| Dennis IP | (852) 2848 4068 | dennis.ip@hk.daiwacm.com |
| Head of Asia ex-Japan Power, Utilities, Renewables & ESS (PURE) Research; US & CN Power Equipment (Gas, Nuclear, Solar, Grid, Battery & Rare Earth Materials); Tech Hardware - AIDC Power, PCB, Optical Fiber (China) | Head of Asia ex-Japan Power, Utilities, Renewables & ESS (PURE) Research; US & CN Power Equipment (Gas, Nuclear, Solar, Grid, Battery & Rare Earth Materials); Tech Hardware - AIDC Power, PCB, Optical Fiber (China) | Head of Asia ex-Japan Power, Utilities, Renewables & ESS (PURE) Research; US & CN Power Equipment (Gas, Nuclear, Solar, Grid, Battery & Rare Earth Materials); Tech Hardware - AIDC Power, PCB, Optical Fiber (China) |
| Derek ZHANG | (852) 2532 4341 | derek.zhang@hk.daiwacm.com |
| Power, Utilities, Renewables and ESS (PURE) - Gas & Gas Equipment, Rare Earth Materials (China), Utilities (Hong Kong), Power Equipment (US) | Power, Utilities, Renewables and ESS (PURE) - Gas & Gas Equipment, Rare Earth Materials (China), Utilities (Hong Kong), Power Equipment (US) | Power, Utilities, Renewables and ESS (PURE) - Gas & Gas Equipment, Rare Earth Materials (China), Utilities (Hong Kong), Power Equipment (US) |
| Marco ZENG Power, Utilities, Renewables | (852) 2848 4430 and ESS | marco.zeng@hk.daiwacm.com (PURE) - US Power, PCB (China) |
MPI Corp (6223 TT): 21 August 2026
Daiwa
| CHINA | CHINA | CHINA |
|---|---|---|
| Louis LUO | (86) 21 6841 3282 | louis.luo@daiwacm.cn |
| Automobiles and Components, Industrials (China) | Automobiles and Components, Industrials (China) | Automobiles and Components, Industrials (China) |
| Mavis MA | (86) 21 6841 3288 | mavis.ma@daiwacm.cn |
| Leo LU Power, Utilities, | (86) 21 6841 3286 Renewables and ESS | leo.lu@daiwacm.cn (PURE) - Solar, ESS, Lithium, AIDC Power (China) |
| Skye LIANG Power, Utilities, | (86) 21 6841 3207 Renewables and ESS (PURE) | skye.liang@daiwacm.cn - Grid, Wind and Optical Fibre (China) |
| William WU Property (China/Hong | (86) 21 6841 3200 Kong) | william.wu@daiwacm.cn |
| Bintuo NI Tech Hardware and | (86) 21 6841 3228 Semiconductors (China) | bintuo.ni@daiwacm.cn |
| SOUTH KOREA | ||
|---|---|---|
| Yoonki BAE Automobile Components, | (82) 2 787 9168 Healthcare | yoonki.bae@kr.daiwacm.com |
| Mike OH Banking, Capital Goods | (82) 2 787 9179 - Defence, Construction | mike.oh@kr.daiwacm.com and Shipbuilding, and Utilities |
| Youngho JANG Consumer, Healthcare | (82) 2 787 9838 | youngho.jang@kr.daiwacm.com |
| Henny JUNG EV Batteries and Battery Components | (82) 2 787 9182 Materials, IT/Electronics | henny.jung@kr.daiwacm.com (Small/Mid Cap), Automobiles and |
| Daeho SON Industrials - Robotics | (82) 2 787 9176 | dh.son@kr.daiwacm.com |
| Joon LEE Media, Software and IT | (82) 2 787 9151 Services | hj.lee@kr.daiwacm.com |
| Thomas Y KWON Pan-Asia Head of Internet | (82) 2 787 9181 & Telecommunications; | yskwon@kr.daiwacm.com Online Games |
| SK KIM Head of Global Memory; | (82) 2 787 9173 IT/Electronics - | sk.kim@kr.daiwacm.com Semiconductors/Displays and Tech Hardware |
| TAIWAN | TAIWAN |
|---|---|
| Rick HSU | (886) 2 8758 6261 rick.hsu@daiwacm-cathay.com.tw |
| Sheng CHENG | (886) 2 8758 6253 sheng.cheng@daiwacm-cathay.com.tw |
| Allan WANG IT/Technology Hardware China) | (886) 2 8758 6249 allan.wang@daiwacm-cathay.com.tw (Automation, Datacentre Components and PCB/CCL) (Greater |
| Leon CHEN IT/Technology - Semiconductors | (886) 2 8758 6247 leon.chen@daiwacm-cathay.com.tw Supply Chain (Taiwan) |
| Stacy LIN IT/Technology - Semiconductors | (886) 2 8758 6252 stacy.lin@daiwacm-cathay.com.tw Supply Chain (Taiwan) |
| Helen CHIEN Small/Mid Cap | (886) 2 8758 6254 helen.chien@daiwacm-cathay.com.tw |
Daiwa's Offices
| Office / Branch / Affiliate | Address | Tel | Fax |
|---|---|---|---|
| DAIWA SECURITIES GROUP INC | |||
| HEAD OFFICE | Gran Tokyo North Tower, 1-9-1, Marunouchi, Chiyoda-ku, Tokyo, 100-6753 | (81) 3 5555 3111 | (81) 3 5555 0661 |
| Daiwa Securities Trust Company | One Evertrust Plaza, Jersey City, NJ 07302, U.S.A. | (1) 201 333 7300 | (1) 201 333 7726 |
| Daiwa Securities Trust and Banking (Europe) PLC (Head Office) | 5 King William Street, London EC4N 7JB, United Kingdom | (44) 207 320 8000 | (44) 207 410 0129 |
| Daiwa Europe Trustees (Ireland) Ltd | Level 3, Block 5, Harcourt Centre, Harcourt Road, Dublin 2, Ireland | (353) 1 603 9900 | (353) 1 478 3469 |
| Daiwa Capital Markets America Inc. New York Head Office | 1251 Avenue of the Americas, 49th Floor, New York, NY 10020 | (1) 212 612 7000 | (1) 212 612 7100 |
| Daiwa Capital Markets America Inc. San Francisco Branch | 555 California Street, Suite 3360, San Francisco, CA 94104, U.S.A. | (1) 415 955 8100 | (1) 415 956 1935 |
| Daiwa Capital Markets Europe Limited, London Head Office | 5 King William Street, London EC4N 7AX, United Kingdom | (44) 20 7597 8000 | (44) 20 7597 8600 |
| Daiwa Capital Markets Deutschland GmbH | Friedrich-Ebert-Anlage 35-37, 60327 Frankfurt am Main, Germany | (49) 69 27139 8100 | (49) 69 27139 8190 |
| Daiwa Capital Markets Europe Limited, Paris Representative Office | 17, rue de Surène 75008 Paris, France | (33) 1 56 262 200 | (33) 1 47 550 808 |
| Daiwa Capital Markets Europe Limited, Moscow Representative Office | Midland Plaza 7th Floor, 10 Arbat Street, Moscow 119002, Russian Federation | (7) 495 641 3416 | (7) 495 775 6238 |
| Daiwa Capital Markets Europe Limited, Bahrain Branch | 7th Floor, The Tower, Bahrain Commercial Complex, P.O. Box 30069, Manama, Bahrain | (973) 17 534 452 | (973) 17 535 113 |
| Daiwa Capital Markets Hong Kong Limited | Level 28, One Pacific Place, 88 Queensway, Hong Kong | (852) 2525 0121 | (852) 2845 1621 |
| Daiwa Capital Markets Singapore Limited | 7 Straits View, Marina One East Tower, #16-05 & #16-06, Singapore 018936, Republic of Singapore | (65) 6387 8888 | (65) 6282 8030 |
| Daiwa Capital Markets Australia Limited | Level 34, Rialto North Tower, 525 Collins Street, Melbourne, Victoria 3000, Australia | (61) 3 9916 1300 | (61) 3 9916 1330 |
| DBP-Daiwa Capital Markets Philippines, Inc | 18th Floor, Citibank Tower, 8741 Paseo de Roxas, Salcedo Village, Makati City, Republic of the Philippines | (632) 813 7344 | (632) 848 0105 |
| Daiwa-Cathay Capital Markets Co Ltd | 14/F, 200, Keelung Road, Sec 1, Taipei, Taiwan, R.O.C. | (886) 2 2723 9698 | (886) 2 2345 3638 |
| Daiwa Securities Capital Markets Korea Co., Ltd. | 20 Fl.& 21Fl. One IFC, 10 Gukjegeumyung-Ro, Yeongdeungpo-gu, Seoul, Korea | (82) 2 787 9100 | (82) 2 787 9191 |
| Daiwa Securities Co. Ltd., Beijing Representative Office | Room 301/302 , Kerry Center , 1 Guanghua Road , Chaoyang District , Beijing 100020, People's Republic of China | (86) 10 6500 6688 | (86) 10 6500 3594 |
| Daiwa (Shanghai) Corporate Strategic Advisory Co. Ltd. | 44/F, Hang Seng Bank Tower, 1000 Lujiazui Ring Road, Pudong, Shanghai China 200120 , People's Republic of China | (86) 21 3858 2000 | (86) 21 3858 2111 |
| Daiwa Securities Co. Ltd., Bangkok Representative Office | 18 th Floor, M Thai Tower, All Seasons Place, 87 Wireless Road, Lumpini, Pathumwan, Bangkok 10330, Thailand | (66) 2 252 5650 | (66) 2 252 5665 |
| Daiwa Securities Co. Ltd., Hanoi Representative Office | Suite 405, Pacific Palace Building, 83B, Ly Thuong Kiet Street, Hoan Kiem Dist. Hanoi, Vietnam | (84) 4 3946 0460 | (84) 4 3946 0461 |
DAIWA INSTITUTE OF RESEARCH LTD
HEAD OFFICE
MARUNOUCHI OFFICE
New York Research Center
London Research Centre
MPI Corp (6223 TT): 21 August 2026
15-6, Fuyuki, Koto-ku, Tokyo, 135-8460, Japan
(81) 3 5620 5100
Gran Tokyo North Tower, 1-9-1, Marunouchi, Chiyoda-ku, Tokyo, 100-6756 (81) 3 5555 7011
11th Floor, Financial Square, 32 Old Slip, NY, NY 10005-3504, U.S.A.
3/F, 5 King William Street, London, EC4N 7AX, United Kingdom
(1) 212 612 6100
(44) 207 597 8000
Daiwa
(81) 3 5620 5603
(81) 3 5202 2021
(1) 212 612 8417
(44) 207 597 8550