PDF 原檔:260623_5347_2303_hsbc_foundry_original.pdf
原始內容
Asia Technology
Secondary Foundry: Faster-than-expected recovery with more favourable pricing
- ◆ Capacity consolidation accelerate & surging AI peripheral demand to drive faster ramp of utilisation and better ASP
- ◆ Extension to new product exposure to drive value add to specialty foundry in the long run
- ◆ Upgrade UMC/VIS to Buy; maintain GFS/SMIC at Hold/Buy; increase TPs for all
Faster ramp in utilisation from AI demand and further consolidation: While the capacity consolidation from leading foundries has already been the main catalyst for secondary foundries, we expect the trend to accelerate, with expectations of TSMC extending consolidation to legacy 12' (28 -90nm), leading to a more disciplined supply environment. In addition, with ongoing AI data centre investment and deployment, the wafer foundries supply tightness has extended from AI accelerators into AI peripheral demand, such as PMIC, MCU, etc. The above drivers lead us to expect a faster ramp in the secondary foundry utilisation rate (UTR). We raise our average UTR assumptions to 91%/87%/93% for 2H26/1H27/2H27, higher than consensus expectations of 85%/84%/88%. The rise of AI also leads to demand in new areas, such as optical (for example, TFLN for UMC), which helps create new possibilities for secondary foundries to optimise value add on their speciality technologies, and highlights that leading foundries are not the only ones to benefit from the AI uptrend.
We expect better ASP into 2027 with better UTR in anticipation of tightness:
With faster UTR improvements and customers expecting future foundry tightness, we now expect secondary foundry companies to have stronger pricing power, with price hikes extending from 2H26 to end-2027. We estimate ASP increases of 11%/27% for 2026/27, much higher than consensus estimates of 1%/7% YoY.
Upgrade UMC/VIS to Buy (from Hold); maintain GFS/SMIC at Hold/Buy: We increase our UMC TP to TWD235 (from TWD80), as we expect it to become the major beneficiary as TSMC extends its consolidation to legacy 12'. We increase our VIS TP to TWD220 (from TWD171), GFS to USD92.00 (from USD65.03), and SMIC to HKD93 and CNY158 (from HKD89 and CNY146).
Exhibit 1: Secondary foundry summary table
| Target price | Target price | __Rating___ | __Rating___ | Market cap | _P/E______ | _P/E______ | _P/B______ | _P/B______ | |||||
|---|---|---|---|---|---|---|---|---|---|---|---|---|---|
| Company | Ticker | Currency | CMP | Old | New | Old | New | Upside | (USDm) | 2027 | 2028 | 2027 | 2028 |
| UMC | 2303 TW | TWD | 170.00 | 80.00 | 235.00 | Hold | Buy | 38.2% | 67,543 | 18.3x | 14.0x | 6.9x | 4.3x |
| VIS | 5347 TW | TWD | 186.50 | 171.00 | 220.00 | Hold | Buy | 18.0% | 11,074 | 18.9x | 15.8x | 3.6x | 2.9x |
| GFS | GFS US | USD | 89.67 | 65.03 | 92.00 | Hold | Hold | 2.6% | 49,202 | 40.1x | 31.5x | 4.1x | 4.8x |
| SMIC H | 0981 HK | HKD | 77.85 | 89.00 | 93.00 | Buy | Buy | 19.5% | 94,976 | 40.4x | 27.3x | 3.2x | 2.8x |
| SMIC A | 688981 CH | CNY | 141.70 | 146.00 | 158.00 | Buy | Buy | 11.5% | 95,950 | 85.0x | 57.4x | 6.7x | 5.9x |
Source: HSBC estimates, Bloomberg. Priced at close of 23 June, except for GFS, which is priced at close of 22 June 2026.
Disclosures & Disclaimer
This report must be read with the disclosures and the analyst certifications in the Disclosure appendix, and with the Disclaimer, which forms part of it.
Equities Semiconductors & Equipment
Asia & United States
Ted Lin*
Analyst, Taiwan Technology HSBC Securities (Taiwan) Corporation Limited ted.ht.lin@hsbc.com.tw +886 2 6631 2870
Frank Lee*
Global Head of Tech Hardware & Semi Research The Hongkong and Shanghai Banking Corporation Limited frank.lee@hsbc.com.hk +852 2996 6916
- Employed by a non-US affiliate of HSBC Securities (USA) Inc, and is not registered/ qualified pursuant to FINRA regulations
Issuer of report: HSBC Securities (Taiwan) Corporation Limited
View HSBC Global Investment Research at: https://www.research.hsbc.com
Why we are turning bullish and why now
In 2H25-1Q26, we were conservative on the secondary foundry sector due to its lack of exposure to AI and weaker demand from non-AI applications, leading to our expectations of a weaker utilisation (UTR) outlook and concerns about the companies' bargaining power with end-customers. In 1Q26, we observed a certain amount of pull-in bookings due to consistently raising memory prices, and we were concerned about consumer electronic demand visibility and the outlook for 2H26 after the strong pull-ins.
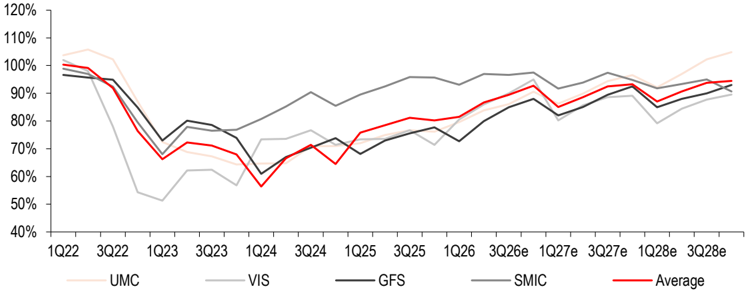
However, with AI infrastructure deployment accelerating, we started to see major IDMs turning positive on specific power semi products adopted in AI server racks. As massive AI peripheral demand is driving legacy node demand, we believe it should help improve the overall supply demand environment for secondary foundry, even with lacklustre non-AI demand. In addition, we now expect that the node consolidation from leading foundries, such as TSMC, is likely to accelerate , with consolidation extending from 6' and 8' wafers to 12' due to ongoing focus on the most advanced nodes as well as advanced packaging. As a result, we now model a faster ramp for secondary foundry's average UTR assumption s to 91%/87%/93% in 2H26/1H27/2H27, followed by 11%/27% ASP increases in 2026/27.
We also expect the rise and development of AI to provide new business opportunities for secondary foundries that possesses distinctive specialty processes. Examples include, but are not limited to, silicon interposer, memory, advanced packaging, and optical, We believe the secondary foundries can not only benefit from a favourable supply and demand environment, but also gain more value-add through this AI uptrend.
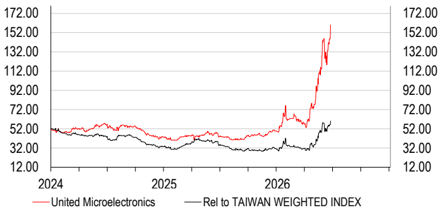
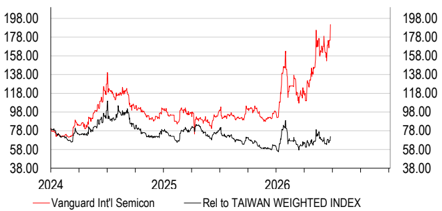
Therefore, despite the stock prices being up 102% on average since 1Q26 (vs TAIEX of 50%), we believe the market is still undervaluing the revenue and margin upside potential of secondary foundries during this upcycle. We view further price hike negotiations and for guidance upward revision as the near-term catalysts, and new business opportunities as the long-term surprises. As a result, we raise TPs for all companies while we upgrade UMC and VIS to Buy (from Hold) and maintain GFS and SMIC at Hold and Buy ratings, respectively. Among our secondary foundry coverage, we now prefer UMC given that it is set to be the major beneficiary of TSMC node consolidation. In addition, we expect UMC to benefit the most from the potential extension of its partnership with Intel, to potential opportunities in TFLN and advanced packaging, given the diverse speciality technologies the company has.
Demand extension from AI GPUs/ASICs to AI peripheral chips
We now observe foundry supply demand extending from AI accelerators to AI peripheral chips, mainly driven by aggressive capex from major CSPs (70-80% yoy in 2026e) and accelerating AI data centre deployment. We expect to see legacy foundry supply intensifying into 2H26 when several major CSP projects start to ramp up. In addition to the AI-related power semi demand, which is well-recognised by the market, we also see the potential for supply tightness extending to consumer-related products due the squeeze-out of capacity.
We are positive on the legacy node supply tightness and believe it should drive secondary foundries ' UTRs. To better model the additional legacy node demand, we raise our blended UTR assumption 91%/87%/93% in 2H26/1H27/2H27 for global secondary foundries (from previous of 89%/84%/88%).
Exhibit 2: Secondary foundries ' UTR assumptions
Source: Company data, HSBC estimates
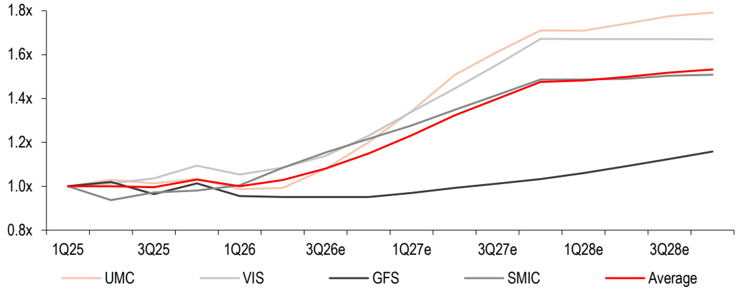
With IDMs and IC design customers successfully reflecting increasing material costs, along with tightening secondary foundry UTR, we believe the foundries are also likely to take advantage of implementing price hikes given the tightening supply demand environments. Considering the potential supply tightness, we assume a better pricing environment for secondary foundry players, with price hikes extending until the end of 2027. In addition, the ongoing mature node capacity consolidation from TSMC is likely to further increase customers' concerns around being able to secure capacity, making the overall pricing environment (especially for foundries in Taiwan) even more favourable. Therefore, we model 11%/27% average price hikes for 2026/27 on average (vs only 6%/8% previously). Our assumptions are higher than current consensus estimates of 1%/7% increases. During the last upcycle in 2021/22, on average secondary foundries saw price hikes of 14%/19% due to demand increases for consumer electronics during the COVID-19 pandemic. We believe the price hike this cycle will start intensifying in 2H26, and the magnitude in 2027 will be larger than the previous cycle due to 1) the major source of demand changing from consumer electronics to AI, with customers being more flexible on pricing; and 2) leading foundries' consolidation helping to improve product mix/ASP even more.
Exhibit 3: Secondary foundries ' pricing trends (1Q25 base)
Source: Company data, HSBC estimates
Leading foundry consolidation continues, likely to extend beyond on 6' / 8'
We expect the technology consolidation from TSMC to not stop at 6' and 8', but to continue into legacy 12 ', as it continues reallocating its resource toward advanced node and advanced packaging expansion. Considering the supply chain efficiency, we believe Taiwanese mature foundry companies, UMC and Vanguard, should remain as the biggest beneficiaries.
We expect UMC to benefit the most if TSMC extends the consolidation to 14nm-90nm, given that it's the better option for legacy 12' technologies vs Taiwa n peers with sufficient capacity and leading positions in legacy processes.
Extension to new product exposure to optimise speciality technologies
As discussed on Vanguard's 1Q26 earnings call, its decision to add silicon interposer as a new product line to its upcoming Singapore fab is an example that more secondary foundries can now benefit from the strong demand of AI. Beyond interposer, advanced packaging continues to have strong demand, and we do not rule out the possibility that companies such as UMC will eventually join the alliance of leading foundry TSMC and OSAT players, such as Spil and Amkor, to start manufacturing for the whole CoWoS process.
We expect the rise of AI to create new possibilities for secondary foundries, as the buildout of AI data centres not only requires more AI chips but also generates value for the optical interconnect layer, which is the kind of specialty manufacturing in which a mature edge foundry can differentiate itself from peers.
For example, UMC is leaning into optical through thin-film lithium niobate (TFLN), a material choice for the photonic IC that has better speed/bandwidth, and optical loss vs silicon photonics (SiPh), another technology other foundry peers, such as GlobalFoundries focuses on (and previously guided a USD2bn revenue target by 2030). UMC's partnership with HyperLight and its subsidiary Wavetek positions UMC as one of the very few foundries able to manufacture TFLN modulators, the core component that encodes data onto light, potentially at high volume across 6' and 8' wafers. Although the revenue contribution may note be significant in 2027 (we expect 20-30K wafer contribution initially from TFLN in 2027e), such technology adoption would be a strong example of new value generation for legacy foundry, rather than chasing the shrinking leading edge node market like leading foundries TSMC/Samsung.
Exhibit 4: TLFN modulator position in interconnection
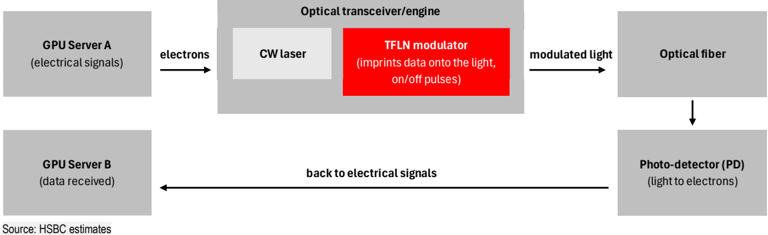
Exhibit 5: TFLN supply chain
Substrate
LNOI wafer
Modulator
PIC chip design
Volume foundry fab at scale
Packaging CPO assembly
Module ->
AI data center
Source: HSBC estimates
United Microelectronics (2303 TT): Upgrade to Buy (from Hold) with a higher TP of TWD235 (from TWD80)
As leading players gradually fade out of the legacy node market, we expect UMC to be one of the biggest beneficiaries of order overflow in PMIC, DDIC, industrial semis, etc. Benefiting from additional orders and to reflect the rising material costs, we assume UMC will increase ASPS by 21/45% in 2H26/2027 with UTR improving to 88%/92%. In addition to price hikes, we expect the company to 1) offer bridge die/DTC solutions for large-sized chiplet and advanced packaging; 2) work on a 12nm FinFET collaboration with Intel (tape-out in 1H27, MP in 2028); 3) expand its optical solution for PIC and TFLN (authorised from IMEC) as a margin-accretive business with more future upside.
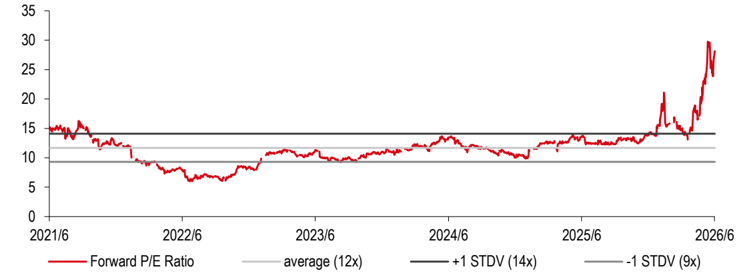
We raise our 2027/28 EPS estimates by 100%/116% to reflect a faster ramp of UTR from 2H26, better product mix toward 22nm/28nm and specialty processes, as well as stronger ASP hikes of 5%/45% YoY in 2026e/27e, vs consensus expectations of 0%/6% YoY. These assumptions make our 2027/28 EPS estimates 75%/98% higher than consensus. Our new TP of TWD235 (from TWD80) is based on a target PE of 25x (from target PB of 2.3x) applied to 2027e EPS of TWD9.31 (from BVPS of TWD34.97). We change the valuation method from PB to PE due to UMC ' s better product mix, UTR, and earnings growth potential. We think our 5-year peak PE multiple of 25x reasonable for several reasons: 1) UMC is benefiting from ongoing foundry node consolidation from leading foundry for faster UTR ramp. Along with demand of AI peripheral , customers' fear s of foundry product shortages, including mature nodes, and much better product mix vs previous cycles, these factors together will drive a strong ASP growth in 2027e (45% YoY vs last up cycle of 16%/19% in 2021/22) and UMC' s ASP in 2027e will finally surpass its last peak during the COVID-19 upcycle. 2) Such momentum will also help UMC's ROE reach 20.2%/23.4%/26.2% in 2026e /27e/28e, surpassing the last ROE peak of 26% in 2022, 3) Lastly, we further expect more room for product mix and profitability improvement in the long run, when new product exposure as well as advanced packaging start contributing. Our new TP implies 38% upside, and we upgrade to a Buy rating.
Global/Taiwan supply chain
HyperLight-UMC-Jabil
Outsourcing (same source pool) chokepoint to monitor
HyperLight
TFLN Chiplet platform
UMC (Wavetek)
8" (UMC)+ 6" (Wavetek)
Jabil high-volume assembly + packaging
1.6T/3.2T optical links, CPO, Interconnect
Exhibit 6: Estimate changes and comparison to consensus
| _New_ | _New_ | _New_ | _Old_ | _Old_ | _Old_ | _New vs old_ | _New vs old_ | _New vs old_ | _Consensus_ | _Consensus_ | _Consensus_ | HSBCe vs consensus | HSBCe vs consensus | HSBCe vs consensus | |
|---|---|---|---|---|---|---|---|---|---|---|---|---|---|---|---|
| (TWDm) | 2026e | 2027e | 2028e | 2026e | 2027e | 2028e | 2026e | 2027e | 2028e | 2026e | 2027e | 2028e | 2026e | 2027e | 2028e |
| Sales | 286,294 | 470,404 | 575,222 | 269,382 | 303,501 | 340,142 | 6.3% | 55.0% | 69.1% | 271,038 | 309,479 | 339,203 | 5.6% | 52.0% | 69.6% |
| - y-o-y | 20.5% | 64.3% | 22.3% | 13.4% | 12.7% | 12.1% | 14.1% | 14.2% | 9.6% | ||||||
| Gross profit | 92,190 | 183,398 | 237,335 | 83,122 | 96,227 | 114,705 | 10.9% | 90.6% | 106.9% | 84,641 | 103,599 | 118,361 | 8.9% | 77.0% | 100.5% |
| - GM | 32.2% | 39.0% | 41.3% | 30.9% | 31.7% | 33.7% | 31.2% | 33.5% | 34.9% | ||||||
| Operating profit | 62,419 | 132,871 | 174,754 | 55,295 | 64,894 | 79,159 | 12.9% | 104.8% | 120.8% | 57,427 | 73,769 | 85,692 | 8.7% | 80.1% | 103.9% |
| - OPM | 21.8% | 28.2% | 30.4% | 20.5% | 21.4% | 23.3% | 21.2% | 23.8% | 25.3% | ||||||
| Net income | 61,615 | 115,765 | 151,334 | 55,561 | 57,985 | 70,078 | 10.9% | 99.6% | 116.0% | 57,821 | 66,201 | 76,511 | 6.6% | 74.9% | 97.8% |
| EPS (TWD) | 4.95 | 9.31 | 12.16 | 4.47 | 4.66 | 5.63 | 10.9% | 99.6% | 116.0% | 4.65 | 5.32 | 6.15 | 6.6% | 74.9% | 97.8% |
| - y-o-y | 48% | 88% | 31% | 33.66% | 4.36% | 20.86% | 39% | 14% | 16% |
Source: HSBC estimates Visible Alpha consensus
Exhibit 7: UMC -quarterly and annual P&L estimates
| (TWDm) | 2025 | 1Q26 | 2Q26e | 3Q26e | 4Q26e | 2026e | 1Q27e | 2Q27e | 3Q27e | 4Q27e | 2027e | 2028e |
|---|---|---|---|---|---|---|---|---|---|---|---|---|
| Sales | 237,554 | 61,038 | 65,796 | 73,491 | 85,969 | 286,294 | 94,658 | 111,588 | 126,277 | 137,882 | 470,404 | 575,222 |
| Gross profit | 68,906 | 17,819 | 19,993 | 23,915 | 30,463 | 92,190 | 34,352 | 42,857 | 50,211 | 55,977 | 183,398 | 237,335 |
| Operating profit | 43,949 | 11,276 | 13,318 | 16,356 | 21,469 | 62,419 | 24,359 | 30,917 | 36,582 | 41,013 | 132,871 | 174,754 |
| Net income | 41,716 | 16,171 | 11,967 | 14,569 | 18,908 | 61,615 | 21,384 | 26,983 | 31,823 | 35,575 | 115,765 | 151,334 |
| EPS (TWD) | 3.34 | 1.29 | 0.96 | 1.17 | 1.52 | 4.95 | 1.72 | 2.17 | 2.56 | 2.86 | 9.31 | 12.16 |
| Ratios (%) | ||||||||||||
| Gross margin | 29.0% | 29.2% | 30.4% | 32.5% | 35.4% | 32.2% | 36.3% | 38.4% | 39.8% | 40.6% | 39.0% | 41.3% |
| OP margin | 18.5% | 18.5% | 20.2% | 22.3% | 25.0% | 21.8% | 25.7% | 27.7% | 29.0% | 29.7% | 28.2% | 30.4% |
| Net margin | 17.6% | 26.5% | 18.2% | 19.8% | 22.0% | 21.5% | 22.6% | 24.2% | 25.2% | 25.8% | 24.6% | 26.3% |
| Q-o-Q | ||||||||||||
| Sales | -1.2% | 7.8% | 11.7% | 17.0% | 10.1% | 17.9% | 13.2% | 9.2% | ||||
| Gross profit | -6.0% | 12.2% | 19.6% | 27.4% | 12.8% | 24.8% | 17.2% | 11.5% | ||||
| Operating profit | -7.8% | 18.1% | 22.8% | 31.3% | 13.5% | 26.9% | 18.3% | 12.1% | ||||
| Net income | 60.8% | -26.0% | 21.7% | 29.8% | 13.1% | 26.2% | 17.9% | 11.8% | ||||
| EPS | 60.8% | -26.0% | 22.2% | 29.8% | 13.1% | 26.2% | 17.9% | 11.8% | ||||
| Y-o-Y | ||||||||||||
| Sales | 2.3% | 5.5% | 12.0% | 24.3% | 39.1% | 20.5% | 55.1% | 69.6% | 71.8% | 60.4% | 64.3% | 22.3% |
| Gross profit | -8.9% | 15.4% | 18.5% | 35.7% | 60.7% | 33.8% | 92.8% | 114.4% | 110.0% | 83.8% | 98.9% | 29.4% |
| Operating profit | -14.8% | 15.2% | 23.1% | 47.1% | 75.6% | 42.0% | 116.0% | 132.2% | 123.7% | 91.0% | 112.9% | 31.5% |
| Net income | -11.6% | 107.9% | 34.4% | -2.8% | 88.1% | 47.7% | 32.2% | 125.5% | 118.4% | 88.1% | 87.9% | 30.7% |
| EPS | -12.1% | 107.8% | 34.4% | -2.4% | 88.7% | 48.2% | 32.8% | 126.4% | 118.4% | 88.1% | 87.9% | 30.7% |
Source: Company data, HSBC estimates
Exhibit 8: UMC -1-year forward PE chart
Source: Bloomberg
| Valuation Risks to our view | |||
|---|---|---|---|
| UMC 2303 TT | Current price: TWD170.00 Target price: TWD235.00 Up/downside: | Our new TP of TWD235 (from TWD80) is based on a target PE of 25x (from target PB of 2.3x) applied to 2027e EPS of TWD9.31 (from BVPS of TWD34.97).We change our valuation method to PE from PB due to our better product mix, UTR and earnings growth outlook for UMC. We find our 5-year peak PE multiple of 25x reasonable for several reasons: 1) UMC is benefiting from ongoing foundry node consolidation from | Downside risks: (1) Worse-than-expected pricing erosion; (2) intensifying competition from China peers; (3) weaker 28nm demand; and (4) reduced end-market demand due to tariffs, affecting utilisation rates. |
| U pgrade to Buy | +38.2% | leading foundry for faster UTR ramp. 2) Such momentum will also help UMC's ROE reach 20.2%/23.4%/26.2% in 2026e/27e/28e, surpassing the last ROE peak of 26% in 2022. 3) Lastly, we expect more room for product mix and profitability improvement in the long run when new product exposure as well as advanced packaging start contributing. | |
| Our new TP implies 38% upside, and we upgrade to a Buy rating (from Hold). Our target price for the ADR (UMC US, CMP USD27.50 as of 22 June 2026) is USD37.42 (from USD11.66). This is derived using a 5:1 share conversion at TWD/USD FX of 31.4. |
Source: Bloomberg, HSBC estimates; priced as at close 23 June, 2026
Financials & valuation: United Microelectronics
Financial statements
| Year to | 12/2025a | 12/2026e | 12/2027e | 12/2028e |
|---|---|---|---|---|
| Profit & loss summary (TWDm) | ||||
| Revenue | 237,554 | 286,294 | 470,404 | 575,222 |
| EBITDA | 101,111 | 127,736 | 203,650 | 245,400 |
| Depreciation & amortisation | -57,165 | -65,317 | -70,779 | -70,646 |
| Operating profit/EBIT | 43,949 | 62,419 | 132,871 | 174,754 |
| Net interest | 937 | -1,100 | -950 | -950 |
| PBT | 49,648 | 70,814 | 137,135 | 178,981 |
| HSBC PBT | 49,648 | 70,814 | 137,135 | 178,981 |
| Taxation | -8,113 | -8,652 | -20,570 | -26,847 |
| Net profit | 41,716 | 61,615 | 115,765 | 151,334 |
| HSBC net profit | 41,716 | 61,615 | 115,765 | 151,334 |
| Cash flow summary (TWDm) | ||||
| Cash flow from operations | 62,825 | 138,599 | 171,711 | 233,714 |
| Capex | -50,999 | -47,951 | -61,200 | -61,200 |
| Cash flow from investment | -53,154 | -47,951 | -61,200 | -61,200 |
| Dividends | -35,784 | -25,030 | -36,969 | -69,459 |
| Change in net debt | -41,186 | -105,884 | -140,539 | -112,226 |
| FCF equity | 11,826 | 90,648 | 110,511 | 172,514 |
| Balance sheet summary (TWDm) | ||||
| Intangible fixed assets | 0 | 0 | 0 | 0 |
| Tangible fixed assets | 271,395 | 254,029 | 244,449 | 235,004 |
| Current assets | 204,783 | 341,831 | 541,766 | 675,740 |
| Cash & others | 129,071 | 234,954 | 375,493 | 487,720 |
| Total assets | 578,996 | 633,978 | 883,370 | 1,005,067 |
| Operating liabilities | 176,793 | 307,057 | 365,785 | 405,607 |
| Gross debt | 22,348 | 22,348 | 22,348 | 22,348 |
| Net debt | -106,723 | -212,607 | -353,146 | -465,372 |
| Shareholders' funds | 379,768 | 304,233 | 494,896 | 576,771 |
| Invested capital | 170,315 | 53,849 | 44,937 | 17,417 |
Ratio, growth and per share analysis
| Year to | 12/2025a | 12/2026e | 12/2027e | 12/2028e |
|---|---|---|---|---|
| Y-o-y %change | ||||
| Revenue | 2.3 | 20.5 | 64.3 | 22.3 |
| EBITDA | 1.8 | 26.3 | 59.4 | 20.5 |
| Operating profit | -14.8 | 42.0 | 112.9 | 31.5 |
| PBT | -11.7 | 42.6 | 93.7 | 30.5 |
| HSBC EPS | -12.0 | 48.2 | 87.9 | 30.7 |
| Ratios (%) | ||||
| Revenue/IC (x) | 1.2 | 2.6 | 9.5 | 18.5 |
| ROIC | 19.3 | 48.9 | 228.7 | 476.4 |
| ROE | 11.0 | 18.0 | 29.0 | 28.2 |
| ROA | 7.2 | 10.2 | 15.4 | 16.1 |
| EBITDA margin | 42.6 | 44.6 | 43.3 | 42.7 |
| Operating profit margin | 18.5 | 21.8 | 28.2 | 30.4 |
| EBITDA/net interest (x) | 116.1 | 214.4 | 258.3 | |
| Net debt/equity | -28.1 | -69.8 | -71.3 | -80.6 |
| Net debt/EBITDA (x) | -1.1 | -1.7 | -1.7 | -1.9 |
| CF from operations/net debt | ||||
| Per share data (TWD) | ||||
| EPS Rep (diluted) | 3.34 | 4.95 | 9.31 | 12.16 |
| HSBC EPS (diluted) | 3.34 | 4.95 | 9.31 | 12.16 |
| DPS | 2.87 | 2.01 | 2.97 | 5.58 |
| Book value | 30.42 | 24.48 | 39.81 | 46.39 |
Valuation data
| Year to | 12/2025a | 12/2026e | 12/2027e | 12/2028e |
|---|---|---|---|---|
| EV/sales | 8.2 | 6.5 | 3.6 | 2.8 |
| EV/EBITDA | 19.3 | 14.5 | 8.4 | 6.5 |
| EV/IC | 11.5 | 34.4 | 38 | 91.7 |
| PE* | 50.9 | 34.3 | 18.3 | 14 |
| PB | 5.6 | 6.9 | 4.3 | 3.7 |
| FCF yield (%) | 0.6 | 4.2 | 5.2 | 8.1 |
| Dividend yield (%) | 1.7 | 1.2 | 1.7 | 3.3 |
ESG metrics
6.1
| Environmental Indicators | 12/2024a |
|---|---|
| GHG emission intensity* | 224.2 |
| Energy intensity* | 426.5 |
| CO 2 reduction policy | Yes |
| Social Indicators | 12/2024a |
| Employee costs as %of revenues | 14.1 |
| Employee turnover (%) | 6.1 |
| Diversity policy | Yes |
Source: Company data, HSBC
- GHG intensity and energy intensity are measured in kg and kWh respectively against revenue in USD '000s
Issuer information
| Share price (TWD) | 170.00 |
|---|---|
| Target price (TWD) | 235.00 |
| RIC (Equity) | 2303.TW |
| Bloomberg (Equity) | 2303 TT |
| Market cap (USDm) | 67,543 |
Price relative
Source: HSBC
Note: Priced at close of 23 Jun 2026
Buy
9
| Governance Indicators | 12/2025a |
|---|---|
| No. of board members | 9 |
| Average board tenure (years) | 8.9 |
| Female board members (%) | 33.3 |
| Board members independence (%) | 66.7 |
| Free float | 86% |
|---|---|
| Sector | Semiconductors |
| Country/Region | Taiwan |
| Analyst | Ted Lin |
| Contact | +886 2 6631 2870 |
Vanguard (5347 TT): Upgrade to Buy (from Hold) on a higher TP of TWD220 (from TWD171)
As we highlighted previously ( VIS 1Q26 result , 6 May, 2026), TSMC is outsourcing interposer production to Vanguard's newly built Singapore fab (VSMC) given the capacity tightness. We reiterate that this change could not only alleviate Vanguard's capex burden with customers helping consign partial production equipment but also help it to secure future bookings (the capacity plan is sold out with solid LTAs). Although the company's capex and depreciation burden remains until it reaches its full run rate due in 2029, we are positive on Vanguard obtaining more AI-related orders for better 12' fab ramp -up. As for price hikes, we now assume 13%/36% in 2H26/2027.
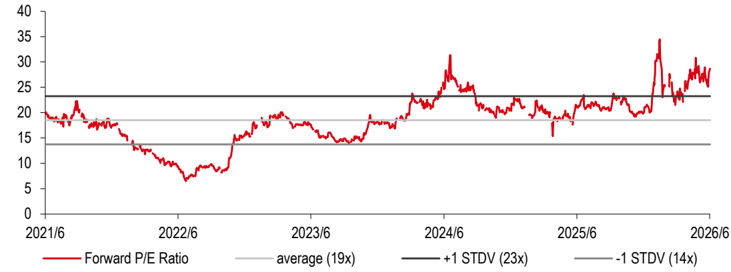
We raise our 2027/28 EPS estimates by 45%/53% on healthier legacy node demand. Specifically, we expect its PMIC platform (70% of company revenue mix) to grow robustly with surging AI power demand. We also expect a faster ramp of UTR and customers' fear s around foundry shortages to drive strong ASP hikes -we assume 8%/33% YoY ASP increases in 2026e/27e (vs 21%/16% in 2021/22 upcycle). Our numbers are 42%/37% higher than consensus. Our new TP of TWD220 (from TWD171) is based on a target PE of 22x. The target PE is higher than 5-year historical average of 19x, which we believe is justified as we expect Vanguard to continue benefiting from improving product mix and a better inventory environment.
Exhibit 9: Estimate changes and comparison to consensus
| _New_ | _New_ | _New_ | _Old_ | _Old_ | _Old_ | _New vs old_ | _New vs old_ | _New vs old_ | _Consensus_ | _Consensus_ | _Consensus_ | HSBCe vs consensus | HSBCe vs consensus | HSBCe vs consensus | |
|---|---|---|---|---|---|---|---|---|---|---|---|---|---|---|---|
| (TWDm) | 2026e | 2027e | 2028e | 2026e | 2027e | 2028e | 2026e | 2027e | 2028e | 2026e | 2027e | 2028e | 2026e | 2027e | 2028e |
| Sales | 60,567 | 95,460 | 118,498 | 57,936 | 75,818 | 92,669 | 5% | 26% | 28% | 58,334 | 73,539 | 89,635 | 4% | 30% | 32% |
| - y-o-y | 25% | 58% | 24% | 19% | 31% | 22% | 20% | 26% | 22% | ||||||
| Gross profit | 19,175 | 31,367 | 38,144 | 17,946 | 22,134 | 26,005 | 7% | 42% | 47% | 18,727 | 23,457 | 28,868 | 2% | 34% | 32% |
| - GM | 32% | 33% | 32% | 31% | 29% | 28% | 32% | 32% | 32% | ||||||
| Operating profit | 11,738 | 20,866 | 25,109 | 10,828 | 13,794 | 15,811 | 8% | 51% | 59% | 11,625 | 14,947 | 18,948 | 1% | 40% | 33% |
| - OPM | 19% | 22% | 21% | 19% | 18% | 17% | 20% | 20% | 21% | ||||||
| Net income | 11,211 | 18,959 | 22,645 | 10,488 | 13,119 | 14,805 | 7% | 45% | 53% | 11,105 | 13,341 | 16,535 | 1% | 42% | 37% |
| EPS (TWD) | 5.83 | 9.87 | 11.78 | 5.46 | 6.83 | 7.70 | 7% | 45% | 53% | 5.78 | 6.94 | 8.60 | 1% | 42% | 37% |
| - y-o-y | 36% | 69% | 19% | 27% | 25% | 13% | 35% | 20% | 24% |
Source: HSBC estimates Visible Alpha consensus
Exhibit 10: Vanguard -quarterly and annual P&L estimates
| (TWDm) | 2025 | 1Q26 | 2Q26e | 3Q26e | 4Q26e | 2026e | 1Q27e | 2Q27e | 3Q27e | 4Q27e | 2027e | 2028e |
|---|---|---|---|---|---|---|---|---|---|---|---|---|
| Sales | 48,590 | 12,532 | 14,232 | 15,796 | 18,007 | 60,567 | 18,984 | 22,455 | 25,628 | 28,392 | 95,460 | 118,498 |
| Gross profit | 13,654 | 3,671 | 4,554 | 4,959 | 5,991 | 19,175 | 5,548 | 7,179 | 8,670 | 9,969 | 31,367 | 38,144 |
| Operating profit | 7,773 | 2,087 | 2,746 | 3,111 | 3,795 | 11,738 | 3,460 | 4,709 | 5,851 | 6,846 | 20,866 | 25,109 |
| Net income | 7,907 | 2,246 | 2,817 | 2,807 | 3,341 | 11,211 | 3,477 | 4,555 | 5,076 | 5,850 | 18,959 | 22,645 |
| EPS (TWD) | 4.28 | 1.18 | 1.47 | 1.46 | 1.74 | 5.85 | 1.81 | 2.37 | 2.64 | 3.04 | 9.87 | 11.78 |
| Ratios (%) | ||||||||||||
| Gross margin | 28.1% | 29.3% | 32.0% | 31.4% | 33.3% | 31.7% | 29.2% | 32.0% | 33.8% | 35.1% | 32.9% | 32.2% |
| OP margin | 16.0% | 16.7% | 19.3% | 19.7% | 21.1% | 19.4% | 18.2% | 21.0% | 22.8% | 24.1% | 21.9% | 21.2% |
| Net margin | 16.3% | 17.9% | 19.8% | 17.8% | 18.6% | 18.5% | 18.3% | 20.3% | 19.8% | 20.6% | 19.9% | 19.1% |
| Q-o-Q | ||||||||||||
| Sales | -0.5% | 13.6% | 11.0% | 14.0% | 5.4% | 18.3% | 14.1% | 10.8% | ||||
| Gross profit | 6.0% | 24.1% | 8.9% | 20.8% | -7.4% | 29.4% | 20.8% | 15.0% | ||||
| Operating profit | 15.5% | 31.6% | 13.3% | 22.0% | -8.8% | 36.1% | 24.3% | 17.0% | ||||
| Net income | 28.5% | 25.4% | -0.4% | 19.0% | 4.1% | 31.0% | 11.4% | 15.3% | ||||
| EPS | 26.3% | 24.2% | -0.4% | 19.0% | 4.1% | 31.0% | 11.4% | 15.3% | ||||
| Y-o-Y | ||||||||||||
| Sales | 10.3% | 4.9% | 21.7% | 27.9% | 43.0% | 24.6% | 51.5% | 57.8% | 62.3% | 57.7% | 57.6% | 24.1% |
| Gross profit | 14.4% | 2.1% | 38.8% | 49.7% | 72.9% | 40.4% | 51.1% | 57.6% | 74.8% | 66.4% | 63.6% | 21.6% |
| Operating profit | 9.3% | -6.8% | 44.8% | 69.8% | 110.0% | 51.0% | 65.8% | 71.5% | 88.1% | 80.4% | 77.8% | 20.3% |
| Net income | 12.2% | -7.0% | 37.9% | 64.8% | 91.2% | 41.8% | 54.8% | 61.7% | 80.8% | 75.1% | 69.1% | 19.4% |
| EPS | 2.9% | -10.1% | 32.0% | 57.7% | 86.0% | 36.5% | 53.3% | 61.7% | 80.8% | 75.1% | 68.8% | 19.4% |
Source: Company data, HSBC estimates
Vanguard 5347 TT
U pgrade to Buy
Priced at close of 23 June 2026
Source: HSBC estimates
Current price: TWD186.50
Target price: TWD220.00
Up/downside: 18.0%
Exhibit 11: Vanguard: PE band -1-year forward band
Source: HSBC, Bloomberg
Valuation
Our new TP of TWD220 (from TWD171) is based on a target PE of 22x. The target PE is higher than 5-year historical average of 19x, which we believe is justified as we expect Vanguard to continue benefiting from improving product mix and a better inventory environment, therefore with 18% upside, we upgrade to Buy from Hold.
Risks
Downside risks: (1) Worse-than-expected pricing erosion; (2) intensifying competition from China peers; and (3) reduced end-market demand due to tariff, risking utilisation rates.
Financials & valuation: Vanguard Int'l Semicon
Financial statements
| Year to | 12/2025a | 12/2026e | 12/2027e | 12/2028e |
|---|---|---|---|---|
| Profit & loss summary (TWDm) | ||||
| Revenue | 48,590 | 60,567 | 95,460 | 118,498 |
| EBITDA | 16,231 | 21,380 | 35,865 | 44,609 |
| Depreciation & amortisation | -8,458 | -9,641 | -14,999 | -19,500 |
| Operating profit/EBIT | 7,773 | 11,738 | 20,866 | 25,109 |
| Net interest | 1,554 | -62 | -186 | -186 |
| PBT | 9,251 | 13,042 | 22,292 | 26,535 |
| HSBC PBT | 9,251 | 13,042 | 22,292 | 26,535 |
| Taxation | -1,480 | -2,161 | -3,663 | -4,219 |
| Net profit | 7,907 | 11,211 | 18,959 | 22,645 |
| HSBC net profit | 7,907 | 11,211 | 18,959 | 22,645 |
| Cash flow summary (TWDm) | ||||
| Cash flow from operations | 25,439 | 25,234 | 24,757 | 38,920 |
| Capex | -63,265 | -65,000 | -35,000 | -35,000 |
| Cash flow from investment | -75,000 | -65,000 | -35,000 | -35,000 |
| Dividends | -5,922 | -6,162 | -6,162 | -6,162 |
| Change in net debt | 22,467 | 39,208 | 10,243 | -3,920 |
| FCF equity | -37,826 | -39,766 | -10,243 | 3,920 |
| Balance sheet summary (TWDm) | ||||
| Intangible fixed assets | 3,073 | 3,073 | 3,073 | 3,073 |
| Tangible fixed assets | 113,869 | 154,306 | 174,307 | 189,807 |
| Current assets | 66,897 | 25,055 | 25,864 | 33,815 |
| Cash & others | 41,716 | 2,509 | -7,735 | -3,814 |
| Total assets | 200,469 | 199,064 | 219,874 | 243,324 |
| Operating liabilities | 53,702 | 74,482 | 86,068 | 86,874 |
| Gross debt | 18,419 | 18,419 | 18,419 | 18,419 |
| Net debt | -23,298 | 15,910 | 26,153 | 22,233 |
| Shareholders' funds | 63,877 | 61,055 | 80,343 | 103,317 |
| Invested capital | 88,421 | 105,444 | 124,911 | 143,635 |
Ratio, growth and per share analysis
| Year to | 12/2025a | 12/2026e | 12/2027e | 12/2028e |
|---|---|---|---|---|
| Y-o-y %change | ||||
| Revenue | 10.3 | 24.6 | 57.6 | 24.1 |
| EBITDA | 3.2 | 31.7 | 67.8 | 24.4 |
| Operating profit | 9.3 | 51.0 | 77.8 | 20.3 |
| PBT | 5.7 | 41.0 | 70.9 | 19.0 |
| HSBC EPS | 2.9 | 36.2 | 69.1 | 19.4 |
| Ratios (%) | ||||
| Revenue/IC (x) | 0.9 | 0.6 | 0.8 | 0.9 |
| ROIC | 12.0 | 10.1 | 15.1 | 15.7 |
| ROE | 12.4 | 17.9 | 26.8 | 24.7 |
| ROA | 4.5 | 5.4 | 8.9 | 9.6 |
| EBITDA margin | 33.4 | 35.3 | 37.6 | 37.6 |
| Operating profit margin | 16.0 | 19.4 | 21.9 | 21.2 |
| EBITDA/net interest (x) | 345.2 | 192.6 | 239.6 | |
| Net debt/equity | -27.9 | 19.8 | 26.3 | 18.2 |
| Net debt/EBITDA (x) | -1.4 | 0.7 | 0.7 | 0.5 |
| CF from operations/net debt | 158.6 | 94.7 | 175.1 | |
| Per share data (TWD) | ||||
| EPS Rep (diluted) | 4.28 | 5.83 | 9.87 | 11.78 |
| HSBC EPS (diluted) | 4.28 | 5.83 | 9.87 | 11.78 |
| DPS | 3.21 | 3.21 | 3.21 | 3.21 |
| Book value | 45.26 | 41.86 | 51.72 | 63.51 |
Valuation data
| Year to | 12/2025a | 12/2026e | 12/2027e | 12/2028e |
|---|---|---|---|---|
| EV/sales | 6.5 | 5.9 | 3.8 | 3.1 |
| EV/EBITDA | 19.6 | 16.7 | 10.2 | 8.1 |
| EV/IC | 3.6 | 3.4 | 2.9 | 2.5 |
| PE* | 43.6 | 32 | 18.9 | 15.8 |
| PB | 4.1 | 4.5 | 3.6 | 2.9 |
| FCF yield (%) | -10.8 | -11.3 | -2.9 | 1.1 |
| Dividend yield (%) | 1.7 | 1.7 | 1.7 | 1.7 |
ESG metrics
5.7
| Environmental Indicators | 12/2024a |
|---|---|
| GHG emission intensity* | 600.3 |
| Energy intensity* | 737.7 |
| CO 2 reduction policy | Yes |
| Social Indicators | 12/2024a |
| Employee costs as %of revenues | [n/a] |
| Employee turnover (%) | 5.7 |
| Diversity policy | Yes |
Source: Company data, HSBC
- GHG intensity and energy intensity are measured in kg and kWh respectively against revenue in USD '000s
Issuer information
| Share price (TWD) | 186.50 |
|---|---|
| Target price (TWD) | 220.00 |
| RIC (Equity) | 5347.TWO |
| Bloomberg (Equity) | 5347 TT |
| Market cap (USDm) | 11,074 |
Price relative
Source: HSBC
Note: Priced at close of 23 Jun 2026
Buy
9
| Governance Indicators | 12/2025a |
|---|---|
| No. of board members | 9 |
| Average board tenure (years) | 11.9 |
| Female board members (%) | 11.1 |
| Board members independence (%) | 55.6 |
| Free float | 86% |
|---|---|
| Sector | Semiconductors |
| Country/Region | Taiwan |
| Analyst | Ted Lin |
| Contact | +886 2 6631 2870 |
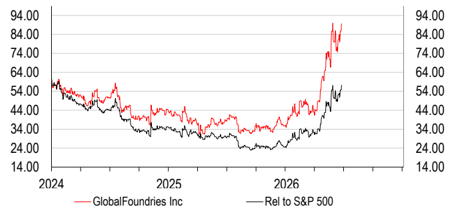
GlobalFoundries (GFS US): Retain Hold, raise TP to USD92.00 from USD65.03
We believe optical solutions differentiates GlobalFoundries from other secondary foundries peers, with portfolio of PIC, EIC, SiPh solution, etc. The optical segment is margin accretive for the company, and management expects to double its revenue to USD400m (from USD200+m in 2025). To meet increasing demand, GlobalFoundries is expanding its optical capacity by purchasing equipment and reallocating low-margin internal resources. However, we expect the price hike magnitude to be limited as most pricing adjustment are likely to take effect in 2027 due to the time gap from LTA negotiations. We now assume a 0%/9% price hikes in 2H26/2027.
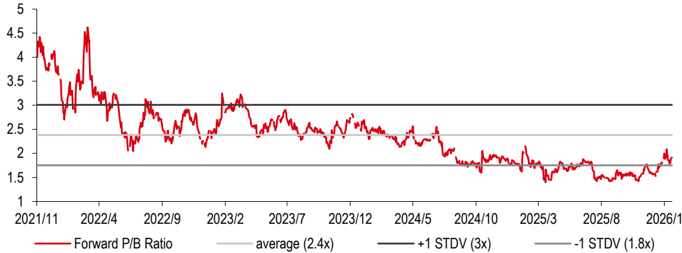
We raise our 2027/28 EPS estimates by 8%/12% to factor in the company's growing optical segment and legacy node recovery. Our numbers are 5%/3% higher than consensus. Our new TP of TWD92.00 (from TWD65.03) is based on a target PB of 4.2x (from 3.0x) applied to 2027e BVPS of TWD21.87 (from TWD21.68). The target PB is higher than the 5-year historical average of 2.4x, which we believe is justified as we expect to see a sustainable margin expansion from the company. However, the multiple is lower than the one we assign to UMC 's TP implied PB (9.6x) as we believe UMC will be the major beneficiary of further TSMC node consolidation given its geographical advantages, which help speed up UMC's UTR ramp and ASP improvement more than GFS's .
Exhibit 12: Estimate changes and comparison to consensus
| _New_ | _New_ | _New_ | _Old_ | _Old_ | _Old_ | _New vs old_ | _New vs old_ | _New vs old_ | _Consensus_ | _Consensus_ | _Consensus_ | HSBCe vs consensus | HSBCe vs consensus | HSBCe vs consensus | |
|---|---|---|---|---|---|---|---|---|---|---|---|---|---|---|---|
| (TWDm) | 2026e | 2027e | 2028e | 2026e | 2027e | 2028e | 2026e | 2027e | 2028e | 2026e | 2027e | 2028e | 2026e | 2027e | 2028e |
| Sales | 7,205 | 8,192 | 9,211 | 7,205 | 7,838 | 8,595 | 0.0% | 4.5% | 7.2% | 7,231 | 7,963 | 8,740 | 0% | 3% | 5% |
| - y-o-y chg | 6% | 14% | 12% | 6% | 9% | 10% | 6% | 10% | 10% | ||||||
| Adjusted gross profits | 2,146 | 2,641 | 3,179 | 2,146 | 2,467 | 2,865 | 0.0% | 7.0% | 11.0% | 2,137 | 2,573 | 3,063 | 0% | 3% | 4% |
| - AdjustedGM | 29.8% | 32.2% | 34.5% | 29.8% | 31.5% | 33.3% | 29.6% | 32.3% | 35.0% | ||||||
| Adjusted operating profits | 1,274 | 1,733 | 2,144 | 1,274 | 1,604 | 1,907 | 0.0% | 8.1% | 12.4% | 1,251 | 1,642 | 2,095 | 2% | 6% | 2% |
| - Adjusted OPM | 17.7% | 21.2% | 23.3% | 17.7% | 20.5% | 22.2% | 17.3% | 20.6% | 24.0% | ||||||
| Adjusted net income | 1,093 | 1,440 | 1,777 | 1,093 | 1,334 | 1,582 | 0.0% | 8.0% | 12.3% | 1,067 | 1,383 | 1,747 | 2% | 4% | 2% |
| Adjusted EPS | 1.97 | 2.59 | 3.20 | 1.97 | 2.40 | 2.85 | 0.0% | 8.0% | 12.3% | 1.91 | 2.47 | 3.12 | 3% | 5% | 3% |
| - y-o-y chg | 13% | 32% | 23% | 13% | 22% | 19% | 10% | 29% | 26% |
Source: HSBC estimates Visible Alpha consensus
Exhibit 13: GlobalFoundries -Quarterly and annual income statement
| (USDm) | 2025 | 1Q26 | 2Q26e | 3Q26e | 4Q26e | 2026e | 1Q27e | 2Q27e | 3Q27e | 4Q27e | 2027e | 2028e |
|---|---|---|---|---|---|---|---|---|---|---|---|---|
| Sales | 6,791 | 1,634 | 1,763 | 1,871 | 1,938 | 7,205 | 1,842 | 1,962 | 2,124 | 2,265 | 8,192 | 9,211 |
| - q-o-q | -11% | 8% | 6% | 4% | -5% | 7% | 8% | 7% | ||||
| - y-o-y | 1% | 3% | 4% | 11% | 6% | 6% | 13% | 11% | 14% | 17% | 14% | 12% |
| Gross profits | 1,690 | 451 | 486 | 559 | 592 | 2,087 | 560 | 574 | 678 | 748 | 2,561 | 3,099 |
| Gross margin | 24.9% | 27.6% | 27.5% | 29.9% | 30.5% | 29.0% | 30.4% | 29.3% | 31.9% | 33.0% | 31.3% | 33.6% |
| Operating profits | 797 | 180 | 204 | 316 | 340 | 1,039 | 330 | 329 | 413 | 465 | 1,537 | 1,948 |
| OP margin | 11.7% | 11.0% | 11.5% | 16.9% | 17.5% | 14.4% | 17.9% | 16.8% | 19.4% | 20.5% | 18.8% | 21.1% |
| Pre-tax income | 911 | 185 | 194 | 316 | 340 | 1,034 | 320 | 319 | 413 | 465 | 1,517 | 1,928 |
| Net income | 888 | 104 | 165 | 268 | 289 | 826 | 262 | 262 | 338 | 381 | 1,244 | 1,581 |
| Net margin | 13.1% | 6.4% | 9.3% | 14.3% | 14.9% | 11.5% | 14.3% | 13.3% | 15.9% | 16.8% | 15.2% | 17.2% |
| EPS (USD) | 1.59 | 0.19 | 0.30 | 0.48 | 0.52 | 1.49 | 0.47 | 0.47 | 0.61 | 0.69 | 2.24 | 2.84 |
| Adjusted items | ||||||||||||
| Gross profit | 1,762 | 474 | 506 | 559 | 608 | 2,146 | 580 | 594 | 698 | 768 | 2,641 | 3,179 |
| Gross margin | 25.9% | 29.0% | 28.7% | 29.9% | 31.4% | 29.8% | 31.5% | 30.3% | 32.9% | 33.9% | 32.2% | 34.5% |
| Operating profit | 1,066 | 271 | 281 | 348 | 374 | 1,274 | 383 | 382 | 465 | 503 | 1,733 | 2,144 |
| Operating margin | 15.7% | 16.6% | 16.0% | 18.6% | 19.3% | 17.7% | 20.8% | 19.5% | 21.9% | 22.2% | 21.2% | 23.3% |
| Net income | 964 | 227 | 242 | 301 | 323 | 1,093 | 315 | 315 | 391 | 419 | 1,440 | 1,777 |
| EPS (USD) | 1.73 | 0.41 | 0.44 | 0.54 | 0.58 | 1.97 | 0.57 | 0.57 | 0.70 | 0.75 | 2.59 | 3.20 |
Source: Company reports, HSBC estimates
GlobalFoundries GFS US
Hold
Priced at close of 22 June 2026
Source: HSBC estimates
Exhibit 14: GlobalFoundries forward PB trend
Source: Bloomberg
Valuation
Our new TP of TWD92.00 (from TWD65.03) is based on a target PB of 4.2x (from 3.0x) applied to 2027e BVPS of TWD21.87 (from TWD21.68).
The target PB is higher than 5-year historical average of 2.4x, which we believe is justified as we expect to see a sustainable margin expansion from the company.
However, the multiple is lower than the one we assign to UMC (9.6x) as we believe UMC will be the major beneficiary from further TSMC node consolidation given the geographical advantages, which help speed up UMC's UTR ramp and ASP improvement more than GFS.
Current price: USD89.67
Target price: USD92.00 Up/downside: +2.6%
Risks to our view
Upside risks: 1) Faster-than-expected improvement in economies of scale at fabs; 2) faster-than-expected margin improvements as a result of stronger-than-expected pricing upside and cost management; and 3) higher- and fasterthan-expected government subsidies.
Downside risks: 1) The lack of economies of scale and increasing variable costs; 2) pricing power capped by high exposure to long-term agreements (LTA); and 3) increasing competition from mainland China, arising from any policy change.
Financials & valuation: GlobalFoundries Inc
Financial statements
| Year to | 12/2025a | 12/2026e | 12/2027e | 12/2028e |
|---|---|---|---|---|
| Profit & loss summary (USDm) | ||||
| Revenue | 6,791 | 7,205 | 8,192 | 9,211 |
| EBITDA | 2,111 | 2,360 | 2,990 | 3,546 |
| Depreciation & amortisation | -1,314 | -1,321 | -1,453 | -1,599 |
| Operating profit/EBIT | 797 | 1,039 | 1,537 | 1,948 |
| Net interest | 0 | 0 | 0 | 0 |
| PBT | 911 | 1,034 | 1,517 | 1,928 |
| HSBC PBT | 911 | 1,034 | 1,517 | 1,928 |
| Taxation | -23 | -208 | -273 | -347 |
| Net profit | 887 | 826 | 1,244 | 1,581 |
| HSBC net profit | 965 | 1,093 | 1,440 | 1,777 |
| Cash flow summary (USDm) | ||||
| Cash flow from operations | 3,769 | 3,764 | 2,628 | 3,103 |
| Capex | -722 | -1,461 | -700 | -700 |
| Cash flow from investment | -740 | -1,479 | -718 | -718 |
| Dividends | 0 | 0 | 0 | 0 |
| Change in net debt | -272 | -597 | -1,020 | -1,495 |
| FCF equity | 3,047 | 2,303 | 1,928 | 2,403 |
| Balance sheet summary (USDm) | ||||
| Intangible fixed assets | 3,713 | 3,437 | 3,437 | 3,437 |
| Tangible fixed assets | 7,223 | 7,363 | 6,610 | 5,711 |
| Current assets | 5,034 | 7,242 | 8,497 | 7,755 |
| Cash & others | 1,809 | 3,186 | 4,188 | 5,665 |
| Total assets | 15,970 | 18,042 | 18,543 | 16,903 |
| Operating liabilities | 4,007 | 4,281 | 4,471 | 4,614 |
| Gross debt | 1,151 | 1,931 | 1,913 | 1,896 |
| Net debt | -658 | -1,254 | -2,275 | -3,770 |
| Shareholders' funds | 10,812 | 11,831 | 12,159 | 10,394 |
| Invested capital | 10,154 | 10,576 | 9,884 | 6,624 |
Ratio, growth and per share analysis
| Year to | 12/2025a | 12/2026e | 12/2027e | 12/2028e |
|---|---|---|---|---|
| Y-o-y %change | ||||
| Revenue | 0.6 | 6.1 | 13.7 | 12.4 |
| EBITDA | 55.9 | 11.8 | 26.7 | 18.6 |
| Operating profit | 30.5 | 47.9 | 26.7 | |
| PBT | 13.6 | 46.7 | 27.1 | |
| HSBC EPS | 10.4 | 13.3 | 31.8 | 23.4 |
| Ratios (%) | ||||
| Revenue/IC (x) | 0.7 | 0.7 | 0.8 | 1.1 |
| ROIC | 7.5 | 8.0 | 12.3 | 19.4 |
| ROE | 8.9 | 9.7 | 12.0 | 15.8 |
| ROA | 5.4 | 4.9 | 6.8 | 8.9 |
| EBITDA margin | 31.1 | 32.8 | 36.5 | 38.5 |
| Operating profit margin EBITDA/net interest (x) | 11.7 | 14.4 | 18.8 | 21.1 |
| Net debt/equity | -6.1 | -10.6 | -18.7 | -36.3 |
| Net debt/EBITDA (x) | -0.3 | -0.5 | -0.8 | -1.1 |
| Per share data (USD) | ||||
| EPS Rep (diluted) | 1.59 | 1.49 | 2.24 | 2.84 |
| HSBC EPS (diluted) | 1.73 | 1.97 | 2.59 | 3.20 |
| DPS | 0.00 | 0.00 | 0.00 | 0.00 |
| Book value | 19.45 | 21.28 | 21.87 | 18.69 |
Valuation data
| Year to | 12/2025a | 12/2026e | 12/2027e | 12/2028e |
|---|---|---|---|---|
| EV/sales | 7.1 | 6.7 | 5.7 | 4.9 |
| EV/EBITDA | 23 | 20.3 | 15.7 | 12.8 |
| EV/IC | 4.8 | 4.5 | 4.7 | 6.9 |
| PE* | 51.7 | 45.6 | 34.6 | 28.1 |
| PB | 4.6 | 4.2 | 4.1 | 4.8 |
| FCF yield (%) | 6.2 | 4.7 | 3.9 | 4.9 |
| Dividend yield (%) | 0 | 0 | 0 | 0 |
ESG metrics
7.7
| Environmental Indicators | 12/2024a |
|---|---|
| GHG emission intensity* | 242.0 |
| Energy intensity* | 593.2 |
| CO 2 reduction policy | Yes |
| Social Indicators | 12/2024a |
| Employee costs as %of revenues | [n/a] |
| Employee turnover (%) | 7.7 |
| Diversity policy | Yes |
Source: Company data, HSBC
- GHG intensity and energy intensity are measured in kg and kWh respectively against revenue in USD '000s
Issuer information
| Share price (USD) | 89.67 |
|---|---|
| Target price (USD) | 92.00 |
| RIC (Equity) | GFS.O |
| Bloomberg (Equity) | GFS US |
| Market cap (USDm) | 49,202 |
Price relative
Source: HSBC
Note: Priced at close of 22 Jun 2026
Hold
| Governance Indicators | 12/2025a |
|---|---|
| No. of board members | 11 |
| Average board tenure (years) | [n/a] |
| Female board members (%) | 18.2 |
| Board members independence (%) | 9.1 |
| Free float | 10% |
|---|---|
| Sector | Semiconductors |
| Country/Region | United States |
| Analyst | Frank Lee |
| Contact | +852 2996 6916 |
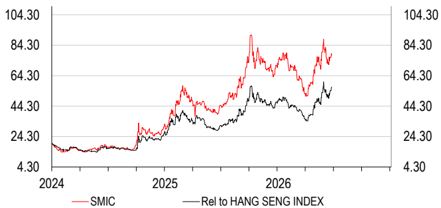
SMIC (981 HK/688981 CH): Retain Buy on a higher TP of HKD93/CNY158 (from HKD89/CNY146)
SMIC remains our top pick among the companies exposed to the "Back to China" reshoring trend among secondary foundry peers. As the largest Chinese domestic foundry with the leading developing pace toward advanced nodes, we believe SMIC stands in a decent position to enjoy domestic semi demand. In addition, the company should benefit from AI peripheral demand in areas such as PMIC, communication chip, edge AI, etc. In addition to logic semis demand, we observe the opportunity for SMIC on the specialty memory side, thanks to its production flexibility between specialty memory and logic semis (lots of equipment and process overlap). In terms of price hikes, we note that China foundries have been first movers on pricing adjustments given their lower ASPs vs global peers. We now assume 12%/22% price hikes in 2H26/2027 with UTR improving to 97%/94%.
We raise our 2027/28 EPS estimates by 21%/43% to factor in a better domestic bookings outlook and improving UTRs. Our numbers are 27%/47% higher than consensus. Our new TPs of HKD93/CNY158 (from HKD89/CNY146) are based on target PB multiples of 4.2x/8.0x (from 4.0x/7.4x) applied to 2026e BVPS of USD2.85 (unchanged). The target PB is higher than 5-year historical averages of 1.5x/3.6x, justified by our view that SMIC continues to benefit from localisation and further expansion to advanced nodes.
Exhibit 15: HSBC estimate changes and comparison to consensus
| _ New__ | _ New__ | _ New__ | _ Old _ | _ Old _ | _ Old _ | __ | __ | __ | Consensus _____ | Consensus _____ | Consensus _____ | _HSBC vs consensus __ | _HSBC vs consensus __ | _HSBC vs consensus __ | |
|---|---|---|---|---|---|---|---|---|---|---|---|---|---|---|---|
| (USDm) | 2026e | 2027e | 2028e | 2026e | 2027e | 2028e | 2026e | 2027e | 2028e | 2026e | 2027e | 2028e | 2026e | 2027e | 2028e |
| Sales | 11,897 | 15,877 | 18,536 | 11,897 | 15,042 | 16,399 | 0.0% | 5.6% | 13.0% | 11,588 | 13,745 | 15,335 | 3% | 16% | 21% |
| - y-o-y | 28% | 33% | 17% | 28% | 26% | 9% | 24% | 19% | 12% | ||||||
| Gross profits | 2,556 | 3,970 | 5,152 | 2,556 | 3,494 | 3,933 | 0.0% | 13.6% | 31.0% | 2,513 | 3,159 | 3,713 | 2% | 26% | 39% |
| - GM | 21.5% | 25.0% | 27.8% | 21.5% | 23.2% | 24.0% | 21.7% | 23.0% | 24.2% | ||||||
| Operating profits | 1,468 | 2,323 | 3,148 | 1,468 | 1,958 | 2,216 | 0.0% | 18.6% | 42.1% | 1,393 | 1,793 | 2,162 | 5% | 30% | 46% |
| - OPM | 12.3% | 14.6% | 17.0% | 12.3% | 13.0% | 13.5% | 12.0% | 13.0% | 14.1% | ||||||
| Net income | 1,164 | 1,969 | 2,914 | 1,164 | 1,626 | 2,038 | 0.0% | 21.1% | 43.0% | 1,143 | 1,547 | 1,979 | 2% | 27% | 47% |
| EPS(ordinary, USD) | 0.15 | 0.25 | 0.36 | 0.15 | 0.20 | 0.25 | 0.0% | 21.1% | 43.0% | 0.14 | 0.19 | 0.25 | 2% | 27% | 47% |
| - y-o-y | 67% | 69% | 48% | 67% | 40% | 25% | 67% | 35% | 28% |
Source: HSBC estimates, Visible Alpha consensus forecasts
Exhibit 16: SMIC quarterly and annual P&L
| (USDm) | 2025 | 1Q26 | 2Q26e | 3Q26e | 4Q26e | 2026e | 1Q27e | 2Q27e | 3Q27e | 4Q27e | 2027e | 2028e |
|---|---|---|---|---|---|---|---|---|---|---|---|---|
| Sales | 9,327 | 2,505 | 2,873 | 3,132 | 3,385 | 11,897 | 3,444 | 3,799 | 4,218 | 4,416 | 15,877 | 18,536 |
| - q-o-q | 1% | 15% | 9% | 8% | 2% | 10% | 11% | 5% | ||||
| - y-o-y | 16% | 11% | 30% | 32% | 36% | 28% | 37% | 32% | 35% | 30% | 33% | 17% |
| Gross profits | 1,957 | 504 | 612 | 689 | 751 | 2,556 | 704 | 890 | 1,129 | 1,247 | 3,970 | 5,152 |
| Gross margin | 21.0% | 20.1% | 21.3% | 22.0% | 22.2% | 21.5% | 20.5% | 23.4% | 26.8% | 28.2% | 25.0% | 27.8% |
| - q-o-q | 5% | 22% | 12% | 9% | -6% | 26% | 27% | 10% | ||||
| - y-o-y | 35% | 0% | 36% | 32% | 57% | 31% | 40% | 45% | 64% | 66% | 55% | 30% |
| Operating profits | 1,110 | 248 | 367 | 411 | 442 | 1,468 | 363 | 501 | 684 | 775 | 2,323 | 3,148 |
| OP margin | 11.9% | 9.9% | 12.8% | 13.1% | 13.0% | 12.3% | 10.5% | 13.2% | 16.2% | 17.6% | 14.6% | 17.0% |
| - q-o-q | -17% | 48% | 12% | 7% | -18% | 38% | 36% | 13% | ||||
| - y-o-y | 134% | -20% | 144% | 17% | 48% | 32% | 46% | 36% | 66% | 76% | 58% | 36% |
| Non-op income | -37 | 8 | 10 | 10 | 10 | 38 | 10 | 10 | 10 | 10 | 40 | 220 |
| Pre-tax income | 1,073 | 255 | 377 | 421 | 452 | 1,505 | 373 | 511 | 694 | 785 | 2,363 | 3,368 |
| Tax expense | -84 | -24 | -38 | -29 | -27 | -119 | -22 | -31 | -42 | -47 | -142 | -202 |
| - effective tax rate | 7.9% | 9.6% | 10.0% | 7.0% | 6.0% | 7.9% | 6.0% | 6.0% | 6.0% | 6.0% | 6.0% | 6.0% |
| Net income | 685 | 197 | 277 | 328 | 361 | 1,164 | 287 | 417 | 589 | 675 | 1,969 | 2,914 |
| - q-o-q | 14% | 40% | 19% | 10% | -20% | 45% | 41% | 15% | ||||
| - y-o-y | 39% | 5% | 109% | 71% | 109% | 70% | 46% | 51% | 79% | 87% | 69% | 48% |
| Net margin | 7.3% | 7.9% | 9.6% | 10.5% | 10.7% | 9.8% | 8.3% | 11.0% | 14.0% | 15.3% | 12.4% | 15.7% |
| EPS (ordinary, USD) | 0.09 | 0.02 | 0.03 | 0.04 | 0.05 | 0.15 | 0.04 | 0.05 | 0.07 | 0.08 | 0.25 | 0.36 |
| - q-o-q | 14% | 40% | 19% | 10% | -20% | 45% | 41% | 15% | ||||
| - y-o-y | 36% | 1% | 101% | 71% | 109% | 67% | 46% | 51% | 79% | 87% | 69% | 48% |
Source: Company data, HSBC estimates
SMIC 981 HK 688981 CH
Buy
Priced at close of 23 June 2026
Source: HSBC estimates
Current price: H : HKD77.85 A : CNY141.70
Target price: H : HKD93.00 A : CNY158.00
Up/downside:
H : 19.5% A : 11.5%
Exhibit 17: SMIC (981 HK): 1-year forward PB trend
Source: Bloomberg
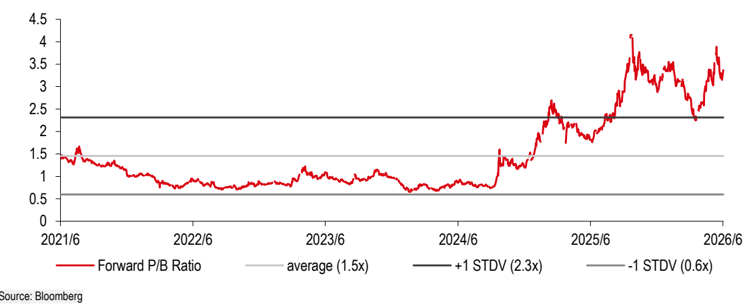
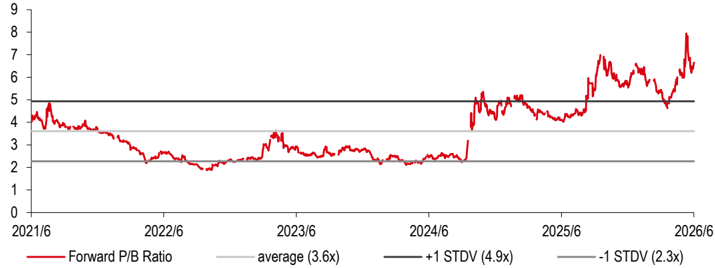
Exhibit 18: SMIC (688981 CH): 1-year forward PB trend
Source: Bloomberg
Valuation
Our new TPs of HKD93/CNY158 (from HKD89/CNY146) are based on a target PB of 4.2x/8.0x (from 4.0x/7.4x) applied to 2026e BVPS of USD2.85 (unchanged).
The target PB is higher than 5-year historical average of 1.5x/3.6x, justified by our view that SMIC continues to benefit from localisation and further expansion to advanced nodes, which also supports our Buy ratings.
Risks
Downside risks (H/A-shares): Slower-thanexpected semi demand; slower development progress of advanced nodes, higher depreciation burden; intensified competition; and less restriction from US & China government on semiconductor which could lower incentive for domestic customers to order at SMIC.
Financials & valuation: SMIC
Financial statements
| Year to | 12/2025a | 12/2026e | 12/2027e | 12/2028e |
|---|---|---|---|---|
| Profit & loss summary (USDm) | ||||
| Revenue | 9,327 | 11,897 | 15,877 | 18,536 |
| EBITDA | 4,920 | 6,413 | 8,366 | 9,589 |
| Depreciation & amortisation | -3,810 | -4,945 | -6,043 | -6,441 |
| Operating profit/EBIT | 1,110 | 1,468 | 2,323 | 3,148 |
| Net interest | 398 | 368 | 400 | 400 |
| PBT | 1,073 | 1,505 | 2,363 | 3,368 |
| HSBC PBT | 1,073 | 1,505 | 2,363 | 3,368 |
| Taxation | -84 | -119 | -142 | -202 |
| Net profit | 685 | 1,164 | 1,969 | 2,914 |
| HSBC net profit | 685 | 1,164 | 1,969 | 2,914 |
| Cash flow summary (USDm) | ||||
| Cash flow from operations | 4,920 | 6,413 | 8,366 | 9,589 |
| Capex | -8,102 | -6,251 | -7,000 | -7,000 |
| Cash flow from investment | -6,495 | -6,385 | -7,000 | -7,000 |
| Dividends | 0 | 0 | 0 | 0 |
| Change in net debt | 2,541 | -115 | 709 | -1,924 |
| FCF equity | -3,182 | 162 | 1,366 | 2,589 |
| Balance sheet summary (USDm) | ||||
| Intangible fixed assets | 20 | 20 | 20 | 20 |
| Tangible fixed assets | 32,558 | 33,690 | 34,647 | 35,206 |
| Current assets | 15,625 | 18,658 | 19,697 | 22,188 |
| Cash & others | 10,023 | 12,060 | 11,351 | 13,275 |
| Total assets | 52,271 | 57,449 | 60,589 | 63,973 |
| Operating liabilities | 4,666 | 6,183 | 7,355 | 7,825 |
| Gross debt | 12,585 | 14,508 | 14,508 | 14,508 |
| Net debt | 2,562 | 2,447 | 3,156 | 1,232 |
| Shareholders' funds | 21,440 | 22,797 | 25,018 | 28,183 |
| Invested capital | 33,514 | 34,124 | 35,657 | 36,313 |
Ratio, growth and per share analysis
| Year to | 12/2025a | 12/2026e | 12/2027e | 12/2028e |
|---|---|---|---|---|
| Y-o-y %change | ||||
| Revenue | 16.2 | 27.6 | 33.5 | 16.7 |
| EBITDA | 33.1 | 30.3 | 30.4 | 14.6 |
| Operating profit | 134.2 | 32.2 | 58.2 | 35.5 |
| PBT | 24.9 | 40.2 | 57.0 | 42.5 |
| HSBC EPS | 36.4 | 66.6 | 69.1 | 48.0 |
| Ratios (%) | ||||
| Revenue/IC (x) | 0.3 | 0.4 | 0.5 | 0.5 |
| ROIC | 3.5 | 4.0 | 6.3 | 8.2 |
| ROE | 3.3 | 5.3 | 8.2 | 11.0 |
| ROA | 1.9 | 2.5 | 3.8 | 5.1 |
| EBITDA margin | 52.8 | 53.9 | 52.7 | 51.7 |
| Operating profit margin | 11.9 | 12.3 | 14.6 | 17.0 |
| Net debt/equity | 7.3 | 6.7 | 8.1 | 3.0 |
| Net debt/EBITDA (x) | 0.5 | 0.4 | 0.4 | 0.1 |
| CF from operations/net debt | 192.1 | 262.1 | 265.1 | 778.3 |
| Per share data (USD) | ||||
| EPS Rep (diluted) | 0.09 | 0.15 | 0.25 | 0.36 |
| HSBC EPS (diluted) | 0.09 | 0.15 | 0.25 | 0.36 |
| DPS | 0.00 | 0.00 | 0.00 | 0.00 |
| Book value | 2.73 | 2.85 | 3.13 | 3.52 |
Valuation data
| Year to | 12/2025a | 12/2026e | 12/2027e | 12/2028e |
|---|---|---|---|---|
| EV/sales | 10 | 7.8 | 5.8 | 4.8 |
| EV/EBITDA | 19 | 14.4 | 11 | 9.3 |
| EV/IC | 2.8 | 2.7 | 2.6 | 2.5 |
| PE* | 113.7 | 68.3 | 40.4 | 27.3 |
| PB | 3.6 | 3.5 | 3.2 | 2.8 |
| FCF yield (%) | -3.4 | 0.2 | 1.4 | 2.7 |
| Dividend yield (%) | 0 | 0 | 0 | 0 |
ESG metrics
| Environmental Indicators | 12/2025a |
|---|---|
| GHG emission intensity* | 279.6 |
| Energy intensity* | [n/a] |
| CO 2 reduction policy | Yes |
| Social Indicators | 12/2025a |
| Employee costs as %of revenues | 12.6 |
| Employee turnover (%) | 13.8 |
| Diversity policy | Yes |
Source: Company data, HSBC
- GHG intensity and energy intensity are measured in kg and kWh respectively against revenue in USD '000s
Issuer information
| Share price (HKD) | 77.85 |
|---|---|
| Target price (HKD) | 93.00 |
| RIC (Equity) | 0981.HK |
| Bloomberg (Equity) | 981 HK |
| Market cap (USDm) | 94,976 |
Price relative
Source: HSBC
Note: Priced at close of 23 Jun 2026
Buy
8
| Governance Indicators | 12/2025a |
|---|---|
| No. of board members | 8 |
| Average board tenure (years) | [n/a] |
| Female board members (%) | 12.5 |
| Board members independence (%) | 50 |
| Free float | 77% |
|---|---|
| Sector | Semiconductors |
| Country/Region | Hong Kong |
| Analyst | Ted Lin |
| Contact | +886 2 6631 2870 |
Financials & valuation: SMIC A
Financial statements
0
| Year to | 12/2025a | 12/2026e | 12/2027e | 12/2028e |
|---|---|---|---|---|
| Profit & loss summary (USDm) | ||||
| Revenue | 9,327 | 11,897 | 15,877 | 18,536 |
| EBITDA | 4,920 | 6,413 | 8,366 | 9,589 |
| Depreciation & amortisation | -3,810 | -4,945 | -6,043 | -6,441 |
| Operating profit/EBIT | 1,110 | 1,468 | 2,323 | 3,148 |
| Net interest | 398 | 368 | 400 | 400 |
| PBT | 1,073 | 1,505 | 2,363 | 3,368 |
| HSBC PBT | 1,073 | 1,505 | 2,363 | 3,368 |
| Taxation | -84 | -119 | -142 | -202 |
| Net profit | 685 | 1,164 | 1,969 | 2,914 |
| HSBC net profit | 685 | 1,164 | 1,969 | 2,914 |
| Cash flow summary (USDm) | ||||
| Cash flow from operations | 4,920 | 6,413 | 8,366 | 9,589 |
| Capex | -8,102 | -6,251 | -7,000 | -7,000 |
| Cash flow from investment | -6,495 | -6,385 | -7,000 | -7,000 |
| Dividends | 0 | 0 | 0 | 0 |
| Change in net debt | 2,541 | -115 | 709 | -1,924 |
| FCF equity | -3,182 | 162 | 1,366 | 2,589 |
| Balance sheet summary (USDm) | ||||
| Intangible fixed assets | 20 | 20 | 20 | 20 |
| Tangible fixed assets | 32,558 | 33,690 | 34,647 | 35,206 |
| Current assets | 15,625 | 18,658 | 19,697 | 22,188 |
| Cash & others | 10,023 | 12,060 | 11,351 | 13,275 |
| Total assets | 52,271 | 57,449 | 60,589 | 63,973 |
| Operating liabilities | 4,666 | 6,183 | 7,355 | 7,825 |
| Gross debt | 12,585 | 14,508 | 14,508 | 14,508 |
| Net debt | 2,562 | 2,447 | 3,156 | 1,232 |
| Shareholders' funds | 21,440 | 22,797 | 25,018 | 28,183 |
| Invested capital | 33,514 | 34,124 | 35,657 | 36,313 |
Ratio, growth and per share analysis
| Year to | 12/2025a | 12/2026e | 12/2027e | 12/2028e |
|---|---|---|---|---|
| Y-o-y %change | ||||
| Revenue | 16.2 | 27.6 | 33.5 | 16.7 |
| EBITDA | 33.1 | 30.3 | 30.4 | 14.6 |
| Operating profit | 134.2 | 32.2 | 58.2 | 35.5 |
| PBT | 24.9 | 40.2 | 57.0 | 42.5 |
| HSBC EPS | 36.4 | 66.6 | 69.1 | 48.0 |
| Ratios (%) | ||||
| Revenue/IC (x) | 0.3 | 0.4 | 0.5 | 0.5 |
| ROIC | 3.5 | 4.0 | 6.3 | 8.2 |
| ROE | 3.3 | 5.3 | 8.2 | 11.0 |
| ROA | 1.9 | 2.5 | 3.8 | 5.1 |
| EBITDA margin | 52.8 | 53.9 | 52.7 | 51.7 |
| Operating profit margin | 11.9 | 12.3 | 14.6 | 17.0 |
| Net debt/equity | 7.3 | 6.7 | 8.1 | 3.0 |
| Net debt/EBITDA (x) | 0.5 | 0.4 | 0.4 | 0.1 |
| CF from operations/net debt | 192.1 | 262.1 | 265.1 | 778.3 |
| Per share data (USD) | ||||
| EPS Rep (diluted) | 0.09 | 0.15 | 0.25 | 0.36 |
| HSBC EPS (diluted) | 0.09 | 0.15 | 0.25 | 0.36 |
| DPS | 0.00 | 0.00 | 0.00 | 0.00 |
| Book value | 2.73 | 2.85 | 3.13 | 3.52 |
Valuation data
| Year to | 12/2025a | 12/2026e | 12/2027e | 12/2028e |
|---|---|---|---|---|
| EV/sales | 10.1 | 7.8 | 5.8 | 4.9 |
| EV/EBITDA | 19.2 | 14.6 | 11.1 | 9.5 |
| EV/IC | 2.8 | 2.7 | 2.6 | 2.5 |
| PE* | 239.6 | 143.8 | 85 | 57.4 |
| PB | 7.7 | 7.3 | 6.7 | 5.9 |
| FCF yield (%) | -3.3 | 0.2 | 1.4 | 2.7 |
| Dividend yield (%) | 0 | 0 | 0 | 0 |
ESG metrics
| Environmental Indicators | 12/2025a |
|---|---|
| GHG emission intensity* | 279.6 |
| Energy intensity* | [n/a] |
| CO 2 reduction policy | Yes |
| Social Indicators | 12/2025a |
| Employee costs as %of revenues | 12.6 |
| Employee turnover (%) | 13.8 |
| Diversity policy | Yes |
Source: Company data, HSBC
- GHG intensity and energy intensity are measured in kg and kWh respectively against revenue in USD '000s
Issuer information
| Share price (CNY) | 141.70 |
|---|---|
| Target price (CNY) | 158.00 |
| RIC (Equity) | 688981.SS |
| Bloomberg (Equity) | 688981 CH |
| Market cap (USDm) | 95,950 |
Price relative
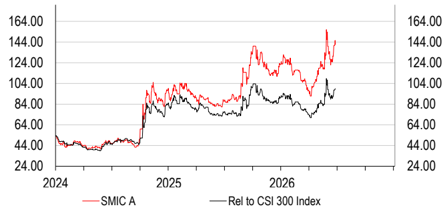
Source: HSBC
Note: Priced at close of 23 Jun 2026
Buy
8
| Governance Indicators | 12/2025a |
|---|---|
| No. of board members | 8 |
| Average board tenure (years) | [n/a] |
| Female board members (%) | 12.5 |
| Board members independence (%) | 50 |
| Free float | 50% |
|---|---|
| Sector | Semiconductors |
| Country/Region | Hong Kong |
| Analyst | Ted Lin |
| Contact | +886 2 6631 2870 |