PDF 原檔:報告_UBS_勤誠8210首次覆蓋_20260817_original.pdf
圖片清單(已驗證 2026-08-19)
分類為「真資料圖」者才可嵌入 lib/ 頁,圖說須照抄下表「親眼所見內容」。標「未驗證」者一律不得嵌入;若日後需要,須先逐張 Read 現場補驗。
| 檔名 | size | 分類 | 親眼所見內容 |
|---|---|---|---|
報告_UBS_勤誠8210首次覆蓋_20260817_001.png |
42KB | 裝飾·logo·banner | 勤誠 8210.TW 股價走勢(2024–2026)+右側 Upside/Base/Downside 三檔目標價色塊 1,750/1,450/700,Upside to Downside 2.4:1 |
報告_UBS_勤誠8210首次覆蓋_20260817_005.png |
61KB | 真資料圖 | 美系前四大 hyperscaler 資本支出共識預估折線圖(Apr'23–Apr'26 橫軸),五條線分別終點標 $920B/$851B/$670B/$375B/$215B,另一條虛線為趨勢線 |
報告_UBS_勤誠8210首次覆蓋_20260817_006.png |
194KB | 真資料圖 | 伺服器機殼分解圖:Chassis 標 Level 3;PSU Module/Cable/Backplane/Fan Module 標 Level 4;「Integrate and test L4 components」標 Level 5;Motherboard 標 Level 6 |
報告_UBS_勤誠8210首次覆蓋_20260817_007.png |
156KB | 真資料圖 | 伺服器製造 Level 1–Level 12 全流程方格圖,Server 與 Rack 兩大區塊;框出 LEVEL 3–6「L3-L6 Enclosure Solutions」與 LEVEL 11「Customized Rack」;下方註記 Enclosure solutions accounts for 5-20% BOM cost |
報告_UBS_勤誠8210首次覆蓋_20260817_008.png |
299KB | 真資料圖 | Amazon ASIC 機櫃 scale-up 四種 SKU 對照(PD 2D Torus/PDS 3D Torus/PDS Ultra/Teton Max):機櫃立面圖+規格表列 Trainium 2/3 世代、5/3nm、每 tray XPU/CPU 數、NL16/NL322/NL722 架構、氣冷 vs 液冷、TDP c.500W/c.700W,最末列 Total Chassis/Cabinet Content Value $2,000-$4,000/$4,000-$8,000/$4,000-$10,000/$4,000-$12,000 USD |
報告_UBS_勤誠8210首次覆蓋_20260817_009.png |
204KB | 真資料圖 | NVIDIA 三種機櫃架構對照:HGX Platform(Ampere/Hopper/Blackwell GPU 4-11U,4 chassis per rack @$3-$5k/unit)、MGX Platform(18 chassis per rack @$700-1,300 USD/unit,含 NVLink Switch tray 與 Power shelf)、Kyber Architecture(NVL 144 Rack,4 x Sub-Chassis per rack,每 chassis 18 片垂直運算刀鋒,1 x Kyber Backplane per Chassis、4 x Backplanes per Rack) |
報告_UBS_勤誠8210首次覆蓋_20260817_010.png |
51KB | 真資料圖 | 勤誠年度營收分段堆疊柱狀圖 2020–2030E(NT$bn),分 General server/storage、AI server chassis、Rack/components、PC;圖上註記 2025-2030E total sales +35% CAGR、AI server chassis & rack sales +43% CAGR;右側紅字 AI server chassis/rack sales mix: from <1%/47% in 2023/2024 to 85%+ in 2030E |
報告_UBS_勤誠8210首次覆蓋_20260817_025.png |
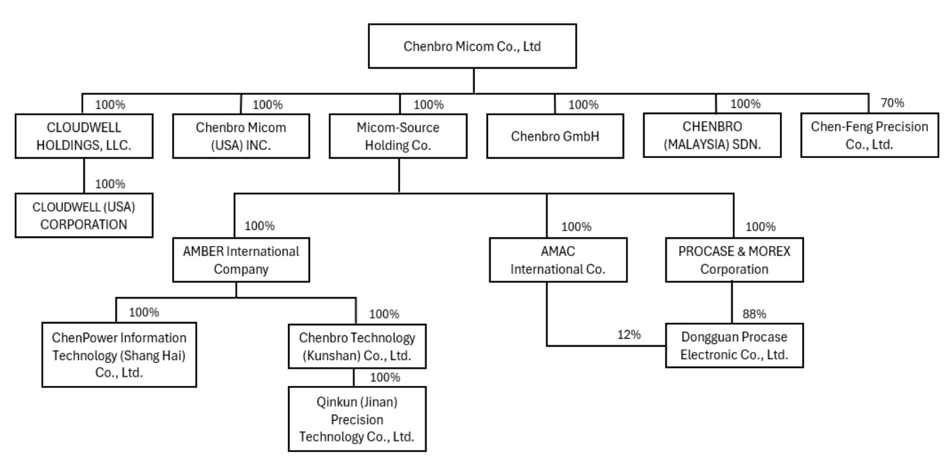
90KB | 真資料圖 | 勤誠集團股權結構圖:Chenbro Micom Co., Ltd 下轄 CLOUDWELL HOLDINGS(100%)、Chenbro Micom (USA)(100%)、Micom-Source Holding(100%)、Chenbro GmbH(100%)、CHENBRO (MALAYSIA)(100%)、Chen-Feng Precision(70%);再下層 AMBER International、AMAC International、PROCASE & MOREX、ChenPower(上海)、Chenbro Technology(昆山)、Qinkun(濟南)、Dongguan Procase(88%+12%) |
報告_UBS_勤誠8210首次覆蓋_20260817_027.png |
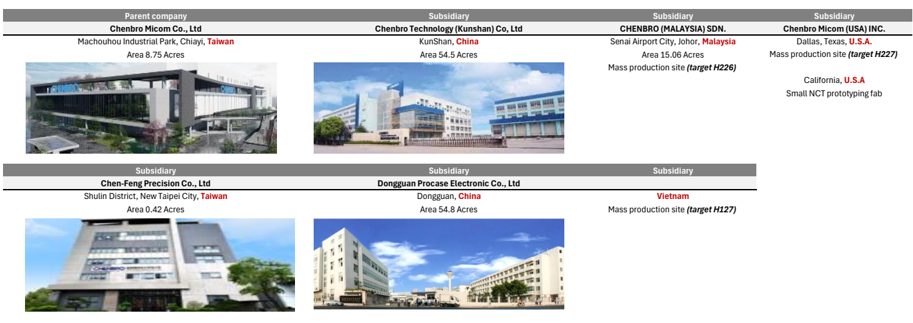
215KB | 真資料圖 | 勤誠各廠區照片與資料表:母公司嘉義馬稠後產業園區 8.75 英畝;子公司昆山 54.5 英畝、東莞普羅凱斯 54.8 英畝、晨豐精密新北樹林 0.42 英畝、馬來西亞柔佛士乃機場城 15.06 英畝(量產目標 H226)、美國德州達拉斯(量產目標 H227)+加州小型 NCT 打樣廠、越南(量產目標 H127) |
其餘 _002–_004、_011–_024、_028–_035 |
— | 未驗證 | 未逐張 Read(多為財務比較圖表、同業營收結構圖、PE/PBV band、股東結構圓餅圖),不得嵌入 lib |
原始內容
Initiation of Coverage
Chenbro Micom
The backbone of AI server/rack; initiate at Buy
Beneficiary of expanding server chassis and rack TAM
We initiate coverage of Chenbro Micom (Chenbro) with a Buy rating and a NT$1,450 price target. Chenbro, a major global chassis supplier with design and manufacturing expertise in mechanical components and strong customer relationships, should benefit from AI deployment, which is likely to drive higher chassis content and an expanded TAM through customised racks, in our view. AI server systems call for more complex design and architecture than general servers, given their more stringent requirements for component density and thermal management, leading to potential server chassis volume growth and increased content value. Beyond its original expertise in server chassis, Chenbro is expanding into customised racks with increasing component integration for its major CSP customer. We forecast a 35% CAGR through 2025-30 for Chenbro's total revenue, led by AI server chassis and racks (at a 43% CAGR), which we expect to account for over 85% of total sales in 2030, up from 47% in 2024.
Accelerated growth from broader offerings and geographical diversification
Chenbro is focused on server chassis (99% of 2025 total revenue), holding an 11-13% share of the global server chassis market. Beyond chassis products, it started with a noise-cancelling rack that reduces server operational noise and has also developed a liquid-cooling rack and a coolant distribution unit (CDU) that integrates liquid-cooling manifolds and noise-reduction features. We expect Chenbro to leverage its core mechanical capabilities and broaden its offerings to full rack-level solutions. In addition, we see potential opportunities in CPU server racks and networking and storage racks. Its capacity expansion in the US, Malaysia and Vietnam could strengthen its customer collaboration through geographic proximity, which we believe is increasingly critical as it pivots into the rack-level business. We forecast the sales contribution from Chenbro's rack-level business to expand from less than 1% in 2024 to over 15% in 2027/2028.
Structural content upgrades to continue
We examine two major AI server platforms, and our analysis suggests a chassis/cabinet content value of up to US$12,000 per AWS ASIC server scale-up unit and up to US $20,000-25,000 per Nvidia GPU server rack, which is at least 5x more than the traditional content in general server systems on a per-chassis basis. In addition, we see the increasingly complex chassis designs and greater integration requirements of racklevel solutions as creating opportunities for vendors to capture higher content premiums from their engineering and manufacturing expertise.
Valuation: Initiate coverage with a Buy rating and NT$1,450 price target
Our PT is based on a 19x average 2027-28E PE, which we believe is justified, placing the stock at the upper end of its historical PE range and implying a 0.6x PEG on a 30% 202630E EPS CAGR. Chenbro is trading at 15x/12x 2027E/2028E PE, at the high end of its historical range, backed by rapid revenue growth and structural margin improvements.
| Highlights (NT$m) | 12/23 | 12/24 | 12/25 | 12/26E | 12/27E | 12/28E | 12/29E | 12/30E |
|---|---|---|---|---|---|---|---|---|
| Revenues | 11,247 | 14,517 | 22,001 | 34,946 | 47,296 | 61,696 | 78,858 | 98,275 |
| EBIT (UBS) | 1,462 | 2,506 | 4,767 | 8,258 | 11,096 | 14,491 | 18,699 | 23,521 |
| Net earnings (UBS) | 1,111 | 1,836 | 3,570 | 6,067 | 8,184 | 10,692 | 13,801 | 17,365 |
| EPS (UBS, diluted) (NT$) | 9.24 | 15.25 | 29.28 | 48.71 | 65.69 | 85.83 | 110.79 | 139.39 |
| DPS (net) (NT$) | 4.00 | 5.00 | 7.50 | 14.00 | 21.96 | 29.56 | 38.62 | 49.85 |
| Net (debt) / cash | (97) | 2,189 | 3,358 | 4,365 | 5,917 | 10,290 | 16,192 | 23,908 |
| Profitability/valuation | 12/23 | 12/24 | 12/25 | 12/26E | 12/27E | 12/28E | 12/29E | 12/30E |
| EBIT (UBS) margin% | 13.0 | 17.3 | 21.7 | 23.6 | 23.5 | 23.5 | 23.7 | 23.9 |
| ROIC (EBIT)% | 22.9 | 48.3 | 78.4 | 91.5 | 87.9 | 91.3 | 100.0 | 107.2 |
| EV/EBITDA (UBS core) x | 11.7 | 11.6 | 11.6 | 14.0 | 10.4 | 7.8 | 5.8 | 4.4 |
| P/E (UBS, diluted) x | 17.4 | 18.6 | 17.7 | 20.7 | 15.4 | 11.8 | 9.1 | 7.2 |
| Equity FCF (UBS) yield% | 11.9 | 5.6 | 3.4 | 2.2 | 3.4 | 6.4 | 8.5 | 11.1 |
| Dividend yield (net)% | 2.5 | 1.8 | 1.4 | 1.4 | 2.2 | 2.9 | 3.8 | 4.9 |
Source: Company accounts, LSEG Eikon, UBS estimates. Metrics marked as (UBS) have had analyst adjustments applied. Valuations: based on an average share price that year, (E): based on a share price of NT$ 1,010.00 on 17-Aug-2026
Equities
Taiwan
Electric Components & Equipment
| 12-month rating | Buy Prior : No Rating |
|---|---|
| 12m price target | NT$1,450.00 Prior : |
| Price (17 Aug 2026) | NT$1,010 |
| RIC: 8210.TW BBG: 8210 TT |
Trading data and key metrics
| 52-wk range | NT$1,555.00-569.00 |
|---|---|
| Market cap. | NT$126b/US$3.95b |
| Shares o/s | 125m (ORD) |
| Free float | 48% |
| Avg. daily volume ('000) | 1,417 |
| Avg. daily value (m) | NT$1,777.2 |
| Common s/h equity (12/26E) | NT$15.2b |
| P/BV (12/26E) | 8.3x |
| Net debt to EBITDA (12/26E) | NM |
| EPS (UBS, diluted) | From | To (NT$) | %ch | Cons. |
|---|---|---|---|---|
| 12/26E | - | 48.71 | - | 47.66 |
| 12/27E | - | 65.69 | - | 64.28 |
| 12/28E | - | 85.83 | - | 82.33 |
Diana Chang Analyst diana.chang@ubs.com +886-2-8722 7335
Randy Abrams
Analyst randy.abrams@ubs.com
+886-2-8722 7338
Chenbro Micom - 8210.TW Price
1500
1750.0
• 1450.0
2.4 to 1
Upside to Downside
Upside:
+73%
Base:
+44%
Thesis Map UBS Research THESIS MAP a guide to our thinking and what´s where in this report
Pivotal Questions
2024
2025
UBS VIEW
EVIDENCE
WHAT´S PRICED IN?
Company Description
Q: Can Chenbro sustain a 35% sales CAGR and lift its share of AI infrastructure spending?
Yes. Chenbro is leveraging its strong hyperscaler relationships and close alignment with key AI chip vendors (NVIDIA, AMD) to expand beyond its traditional server chassis business. Having participated in NVIDIA HGX platforms, the company is gaining exposure to higher-value NVL programmes. Chenbro's March 2026 designation as an NVIDIA MGX rack partner further broadens its opportunity set across server-level (L6) and rack-level (L11) integration. Chenbro is also actively involved in other platforms and working with multiple CSP customers in the US and China. Combined with growing exposure to AI ASIC customers, these design wins position Chenbro to benefit from rising AI infrastructure spending, driving a 43% sales CAGR for AI server chassis/racks through 2025-30E.
Q: Can Chenbro maintain a 30%-plus gross margin as its AI business shifts towards rack and component solutions?
Likely. Chenbro's AI mix is increasingly shifting towards higher-value AI server chassis, customised racks and rack components. We estimate AI server chassis/racks to account for approximately 7075% of revenue in 2026, up from 47% in 2024, and expect this mix to continue rising. Some investors are concerned that gross margins could be dragged down as the company ramps up its rack business. Customised racks typically generate 20%-plus gross margins versus roughly 10% for standard racks, while individual rack components can achieve 30-35% gross margins. As AI server system/rack designs become more complex, with higher customisation and integration required at the rack level, we believe the profitability of its rack and component business will likely improve on an increased value-add, which could support margins above 30%.
We believe Chenbro looks well positioned to benefit from the AI infrastructure buildout due to its: 1) rising exposure to hyperscaler AI deployments across HGX, MGX and ASIC platforms; 2) rising content opportunities as AI server architecture evolves toward higher compute density, more complex thermal designs and rack-scale systems; and 3) particularly attractive valuation following the recent share price pullback.
Our industry analysis suggests an AI server chassis can have a 5-10x higher ASP than a traditional server chassis, driven by higher thermal requirements and system complexity. We estimate chassis/ cabinet content could reach up to US$12,000 per AWS ASIC scale-up unit and up to US$20,00025,000 per Nvidia GPU rack. We also see further upside from customised racks and liquid-cooling infrastructure, with management guiding for rack sales contribution of 10-15% in 2026 and above 20% in 2027.
The stock is trading at 15x/12x 2027/2028 PE, at the upper end of its historical range, but at the midto-lower end of its post-AI cycle range of 14-27x PE. Our PT implies a 19x average 2027-28E PE and a 0.6x PEG based on a 30% 2026-30E earnings CAGR. We believe Chenbro deserves a valuation premium to hardware ODM/OEM peers (13.2x/10.7x 2027/2028E PE) and should trade toward its high-end valuation multiple, reflecting its rising exposure to higher-content rack-level systems.
| Value drivers (2028E) | Sales growth, YoY | Gross margin | Operating margin | EPS | PE Multiple |
|---|---|---|---|---|---|
| NT$1,750 upside | 35.4% | 31.0% | 23.9% | NT$93.3 | 22x |
| NT$1,450 base | 30.4% | 30.2% | 23.5% | NT$85.8 | 19x |
| NT$700 downside | 22.5% | 25.2% | 21.0% | NT$65.5 | 12x |
Source: UBS estimates
Founded in 1983, Chenbro designs and manufactures server chassis, rack solutions and related components for hyperscale, enterprise and AI data centre customers.
TWD 1010.0
17 Aug
Chenbro provides the backbone for AI servers
Chenbro offers enclosure solutions and chassis/components for servers, personal computers, storage and industrial computers. Chassis are key mechanical components required for hardware devices and involve metal and plastic parts processing to assembly compute host chassis, which provide structural protection for components and systems while meeting stringent requirements for thermal management and electromagnetic interference (EMI). Server chassis and peripheral products made up 99% of its total revenue in 2024, and the remaining 1% was attributable to personal compute chassis.
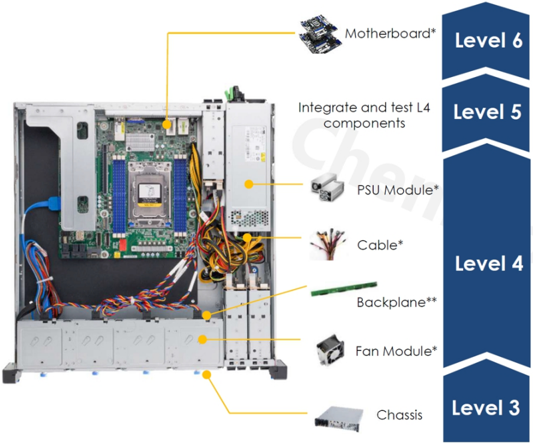
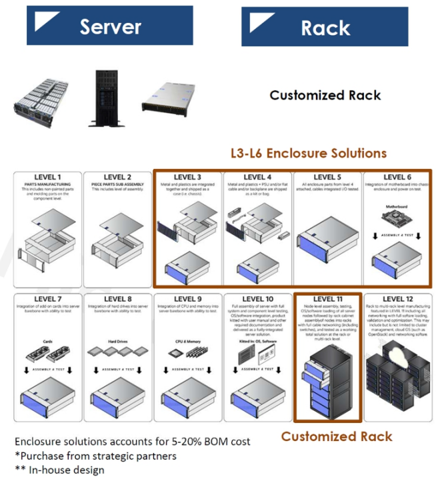
Its core offering mainly ranges from Level 3 (L3) to Level 6 (L6) of the server manufacturing process. Server chassis, normally classified as L3, refers to the process in which metal and plastic components are integrated into a case. Level 4 (L4) involves the addition of components including the power supply unit (PSU), cables and the backplane; all enclosure parts are then integrated and tested at Level 5 (L5). Level 6, known as the server barebone, assembles the motherboard into the chassis enclosure and is powered and tested as a subsystem. By integrating key components through chassis designs Chenbro has, from 2025, extended its offering into customised solutions covering Level 11 (L11, rack cabinet assembly/testing and multi-rack deployment that may include cluster management optimisation and networking software, among other features.) More specifically, it currently offers noise-reduction racks and solutions that aggregate PSUs (power supply units) into a stand-alone power rack.
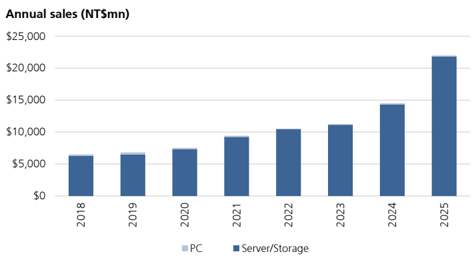
Figure 1: Chenbro's annual sales breakdown by product
Source: Company data
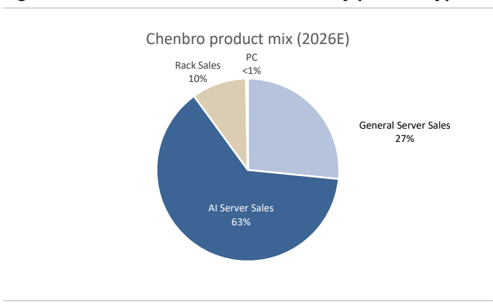
Figure 2: Chenbro's 2026E revenue mix by product type
Source: UBS estimates
Amid strong AI demand, major CSPs' strong capex growth supports Chenbro's growth outlook
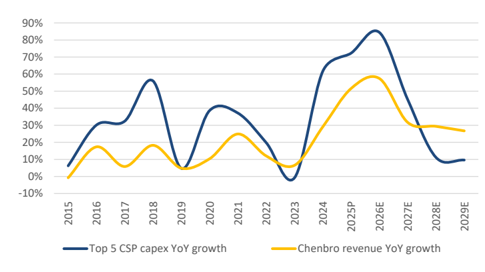
According to UBS (link), 2026 capex estimates for the top five hyperscalers (MSFT, META, GOOG, AWS and Oracle) moved up ~4% recently following earnings reports, and UBS now models ~US$958bn in capex from the top 12 hyperscalers and neoclouds. On earnings calls, all five major US hyperscalers described strong AI demand and expectations to be in a supply-demand imbalance through 2026 despite accelerating capex. UBS now foresees capex up another ~46% YoY next year (previously +20%), on top of growth tracking to 89% YoY this year. Looking ahead, Nvidia's management reiterated its view that AI infrastructure spend can reach US$3-4trn by the end of the decade, with CSPs spending still driven by operating cash flow, compute still constrained rather than built to anticipated future demand, and customer capex still being materially increased for 2026, in line with the UBS hyperscaler tracker. The company noted it has robust order visibility, with AI chip/system orders for Blackwell and Rubin of around US $500bn in 2025-26. We believe these comments signal a sustainable growth trajectory over the next few years.
S1000B
S900B
$800B
$700B
S600B
$500B
$400B
$300B
S200B
S100B
$920B
$851B
Figure 3: Top 5 CSPs' YoY capex growth vs. Chenbro's YoY revenue growth
Apr '23
Source: Company data, UBS estimates. Notes: Top 5 CSPs' capex includes Meta, Google, Amazon, Microsoft and Oracle. The outer-year capex forecasts are UBS estimates.
Figure 5: UBS model of NVIDIA's rack shipments
| GB200/GB300 Rack Units | 2025 | Q126E | Q226E | Q326E | Q426E | 2026E | Q127E | Q227E | Q327E | Q427E | 2027E |
|---|---|---|---|---|---|---|---|---|---|---|---|
| Quanta | 6,420 | 4,000 | 5,200 | 5,800 | 4,500 | 19,500 | 2,700 | 1,200 | 705 | 700 | 5,305 |
| Hon Hai | 10,550 | 5,400 | 6,200 | 7,620 | 6,000 | 25,220 | 3,500 | 2,500 | 1,000 | 500 | 7,500 |
| Wistron | 5,860 | 3,905 | 4,250 | 4,800 | 4,000 | 16,955 | 2,700 | 1,400 | 900 | 500 | 5,500 |
| Total (Top 3) | 22,830 | 13,305 | 15,650 | 18,220 | 14,500 | 61,675 | 8,900 | 5,100 | 2,605 | 1,700 | 18,305 |
| SMCI, Wiwynn, GigaByte, Inventec, Asus, Lenovo, Pega, etc | 4,204 | 2,861 | 3,130 | 3,644 | 2,900 | 12,535 | 1,335 | 765 | 261 | 170 | 2,531 |
| Others share% | 18% | 22% | 20% | 20% | 20% | 20% | 15% | 15% | 10% | 10% | 14% |
| GB200 racks (market-wide) | 20,690 | 7,275 | 5,634 | 4,373 | 1,740 | 19,021 | 1,024 | 293 | 143 | 0 | 1,460 |
| mix% | 77% | 45% | 30% | 20% | 10% | 26% | 10% | 5% | 5% | 0% | 7% |
| GB300 racks (market-wide) | 6,344 | 8,891 | 13,146 | 17,491 | 15,660 | 55,188 | 9,212 | 5,572 | 2,722 | 1,870 | 19,375 |
| mix% | 23% | 55% | 70% | 80% | 90% | 74% | 90% | 95% | 95% | 100% | 93% |
| Total GB200/300 racks (market-wide) | 27,034 | 16,166 | 18,780 | 21,864 | 17,400 | 74,210 | 10,235 | 5,865 | 2,866 | 1,870 | 20,836 |
| Total GB200/300 GPUs into racks | 1,946,412 | 1,163,921 | 1,352,160 | 1,574,208 | 1,252,800 | 5,343,089 | 736,920 | 422,280 | 206,316 | 134,640 | 1,500,156 |
| VR200 NVL72 Rack Units | 2025 | Q126E | Q226E | Q326E | Q426E | 2026E | Q127E | Q227E | Q327E | Q427E | 2027E |
| Quanta | 1,420 | 1,420 | 4,000 | 6,400 | 5,100 | 4,300 | 19,800 | ||||
| Hon Hai | 1,500 | 1,500 | 6,500 | 7,000 | 6,700 | 6,500 | 26,700 | ||||
| Wistron | 20 | 200 | 220 | 2,600 | 4,400 | 3,900 | 3,500 | 14,400 | |||
| Total (Top 3) | 20 | 3,120 | 3,140 | 13,100 | 17,800 | 15,700 | 14,300 | 60,900 | |||
| SMCI, Wiwynn, GigaByte, Inventec, Asus, Lenovo, Pega, etc | 0 | 156 | 156 | 2,227 | 3,560 | 3,140 | 2,860 | 11,787 | |||
| Others share% | 2% | 5% | 5% | 17% | 20% | 20% | 20% | 19% | |||
| Total VR200 racks (market-wide) | 20 | 3,276 | 3,296 | 15,327 | 21,360 | 18,840 | 17,160 | 72,687 | |||
| Total VR200 GPUs into racks | 1,469 | 235,872 | 237,341 | 1,103,544 | 1,537,920 | 1,356,480 | 1,235,520 | 5,233,464 | |||
| VR300 Rack Units | 2025 | Q126E | Q226E | Q326E | Q426E | 2026E | Q127E | Q227E | Q327E | Q427E | 2027E |
| Quanta | 475 | 475 | |||||||||
| Hon Hai | 900 | 900 | |||||||||
| Wistron | 200 | 200 | |||||||||
| Total (Top 3) | 1,575 | 1,575 | |||||||||
| SMCI, Wiwynn, GigaByte, Inventec, Asus, Lenovo, Pega, etc | 0 | 0 | |||||||||
| Others share% | 0% | 0% | |||||||||
| Total VR300 (market-wide) | 1,575 | 1,575 | |||||||||
| Total VR300 GPUs into racks | 113,400 | 113,400 | |||||||||
| Total NVIDIA Racks | 2025 | Q126E | Q226E | Q326E | Q426E | 2026E | Q127E | Q227E | Q327E | Q427E | 2027E |
| GB200/GB300 | 27,034 | 16,166 | 18,780 | 21,864 | 17,400 | 74,210 | 10,235 | 5,865 | 2,866 | 1,870 | 20,836 |
| VR200 | 0 | 0 | 0 | 20 | 3,276 | 3,296 | 15,327 | 21,360 | 18,840 | 17,160 | 72,687 |
| VR300 | 0 | 0 | 0 | 0 | 0 | 0 | 0 | 0 | 0 | 1,575 | 1,575 |
| Total Racks | 27,034 | 16,166 | 18,780 | 21,884 | 20,676 | 77,506 | 25,562 | 27,225 | 21,706 | 20,605 | 95,098 |
| Total GPUs into Racks | 1,946,412 | 1,163,921 | 1,352,160 | 1,575,677 | 1,488,672 | 5,580,430 | 1,840,464 | 1,960,200 | 1,562,796 | 1,483,560 | 6,847,020 |
Source: Company data, UBS estimates (link)
Server chassis set to ride on AI-driven upcycle
Chenbro entered the server chassis business in the early 2000s, and this business has contributed over 90% of its revenue over the past decade. The company first worked with global OEMs like Dell, HPE and IBM on traditional servers, then started to collaborate with cloud service providers on general server chassis. It entered the AI server chassis market in 2023 and has been expanding its chassis offering to support HGX, MGX and ASIC platforms:
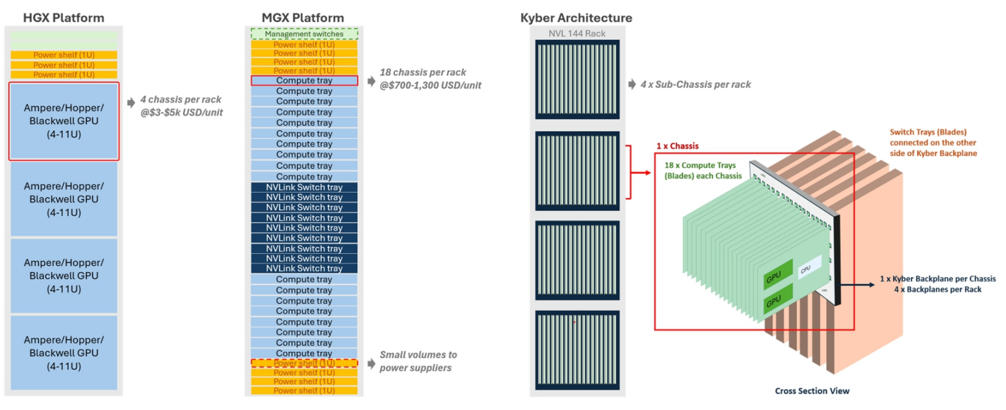
- HGX: It first started to supply 4-7U chassis for Ampere/Hopper HGX racks, which have since evolved into 7-11U chassis for Blackwell HGX racks. The company has a significant share with one major US CSP , and has recently added another US CSP customer. Our industry studies suggest that chassis content value could reach as high as US$10-15k when first introduced, including R&D and qualification costs, but should settle at the US$3-5K range at mass-production volumes.
- MGX: The company is NVDA's design partner for 1U/2U MGX chassis and supplies L3 chassis for compute trays to 1-2 major US CSPs, while also working closely with ODMs to ship to other enterprise/neocloud customers. Our studies suggest each generation potentially looking for 15-50% of chassis content increase based on the additional tooling required.
- ASIC: Chenbro ships mostly L3 chassis to one major US CSP , whose ASIC server racks come in various forms/structures), and also supplies a major Chinese CSP . It is
Figure 4: US big 4 hyperscalers' consensus capex estimates
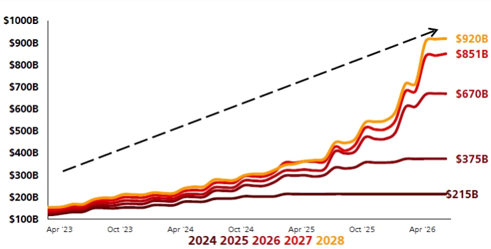
Source: Company data, Visible Alpha, UBS estimates (link).
Notes: US big 4 hyperscalers include Meta, Google, Amazon and Microsoft. The outer-year capex forecasts are from Visible Alpha.
Motherboard*
Level 6
Server generally the second source for ASIC projects, with a roughly 30% share allocation based on UBS estimates. Level 5
components
Major hyperscalers are racing to ramp AI deployment based on NVDA/AMD platforms while also developing their custom AI chipsets, which compared to general servers, features enhanced computing performance and efficiency as well as higher thermal design power (TDP) that are optimised specifically for predetermined functions. This leads to more complex chassis design as a number of components including chipsets, memory, thermal, and cable, etc, occupy more space within the dense systems. This creates thermal challenges that calls for thermal efficiency on not only the component level (including fans, 3D vapor chambers, and cold plates, etc) but also optimised chassis/rack design/layouts that considers specialised materials, component placement (which significantly affects cooling requirement), cable routing, and airflow management to ensure efficient heat paths. This creates opportunities to chassis suppliers to add value with optimised component placement and heat dissipation designs as they leverage their engineering/design capabilities. Our studies suggest AI server chassis could carry 5-10x higher ASPs than an equivalent general server chassis. Chenbro is engaging with multiple major hyperscalers and we believe it is currently one of the major suppliers for at least one US hyperscalers and potentially winning projects with other hyperscalers.
Customised server/CDU racks with an expanding TAM to serve as new growth pillars
Chenbro has stepped into customised rack-level components and solutions for its key customers. It started with noise-cancelling rack that helped reduce server operational noises and based on its latest annual report established a number of patents that cover high-load server handle linkage structures, modular system backplane designs, expansion card retention mechanisms, high-density storage array devices, tool-less quick-release structures, as well as rack-level structural support and airflow optimisation designs. It has also developed liquid cooling rack compatible with NVDA MGX rack, AMD Helios, and ORW (Open Rack Wide) standards; as well as CDU (coolant distribution unit) rack that integrates liquid cooling manifolds and noise-reduction racks. We see Chenbro's efforts to leverage core mechanical capabilities and broadening its offerings to full rack-level solutions. In addition, we are seeing potential edge AI opportunities including CPU server racks, networking racks, and storage racks, suggesting larger addressable market in coming years. We forecast Chenbro's rack-level business sales contribution will expand from <1% in 2024 to 15%+ in 2027/2028E.
Figure 6: Offerings expanding from L3-L6 enclosure solutions to customised rack-level solutions
Source: Company data
LEVEL 3
LEVEL 9
ASSEMBLE & TEST
LEVEL 10
LEVEL 11
Rack
Customized Rack
L3-L6 Enclosure Solutions
LEVEL 4
LEVEL S
LEVEL 6
ASSEMBLE & TEST
LEVEL 12
ASSEMBLY & TEST
Customized Rack
deep dive into content opportunities
In this section, we dive into two of the major AI server architectures in the industry to gauge the potential market opportunities for chassis suppliers.
Case studies #1: AWS ASIC AI servers
AWS has been building one of the largest AI clusters globally, investing heavily in Nvidia GPU-based AI clusters and also spending massive capex in its own custom silicon-based AI clusters. Amazon has several server rack scale-up architecture as illustrated below in Figure 7.
- PD (4x4 2D torus): Under this architecture, one scale-up unit is made up of two 16-Trainium-chips servers, which are fitted into one rack and relies on a single backplane with relatively less AEC units compared to other architectures. This suggests potential content of 2 cabinets per rack with 8 compute trays sitting in one cabinet. We estimate this translates up to $2,000-$4,000 USD chassis/ cabinet content value per rack (normally shipped L3).
- PDS (4x4x4 3D torus): Different from PD, one scale-up unit consists of four 16Trainium-chips servers, which will take up two server racks (or NL322, a similar configuration to Nvidia's NVL362), and each server systems are connected through active electrical copper cables (AEC). We estimates potential content of 4 cabinets per scale-up unit, translating up to $4,000-$8,000 USD chassis/cabinet content value per scale-up unit (normally shipped L3) .
- PDS ultra (switch): Similar to the PDS SKU, a scale-up unit is made up of two server racks that include 16 compute trays and 2 host CPU trays per rack, which combined hosts a total of 64 Trainium chipsets and 4 CPUs. The key difference is the addition of NeuronLink switch trays in each rack that will be placed in the middle of the rack to shorten the distance between the ASICs and the switch. The Trainium NL32*2 switch will have design with four NeuronLink switch trays, or potentially with five so these trays could be swapped when needed without downtime. Meanwhile the two racks will be connected through cross-rack active electrical copper cables where a chip in one rack will be connected directly to a chip in another rack. The chassis/cabinet content differences versus PDs is the additions of switch trays. We estimates potential content of 4 cabinets per scaleup unit, translating up to $4,000-$10,000 USD chassis/cabinet content value per scale-up unit (normally shipped L3) .
- Teton Max (switch): Similar to the PDS ultra SKU, a scale-up unit is build up of two server rack that includes 16 compute trays and 2 host CPU trays per rack with NeuronLink switch trays in the middle. The key differences include: 1) the increase in compute and power density where each compute tray will host four Trainium chips and one CPU - so a scale-up unit (2 racks) hosts a total of 144 Trainium chipsets and 36 CPUs; 2) liquid cooling adoption: Trainium NL722 will use cold plates for XPU/CPU liquid cooling; 3) a single rack will house 10 NeuronLink switch trays in the middle; and 4) copper cable units more than double for NL722 switch vs. NL32*2 switch to support the density increase for AEC cross rack per pair of XPUs. The chassis/cabinet content would include 8 compute trays, up to 2 switch trays, and 2 storage trays. We estimates potential content of 4 cabinets per scaleup unit, translating up to $4,000-$12,000 chassis/cabinet content value per scale-up unit (normally shipped L3) .
We noted that customer could decide what are the constituents within the sub-chassis/ cabinets, chassis suppliers such as Chenbro would ship simply compute/switch trays or could ship sub-chassis/cabinets that includes compute/switch/storage trays based on customer's request. On a component level, our industry checks suggest Chenbro has been the main source for switch tray chassis while gaining share in compute tray chassis as 2nd source (AVC as the primary supplier). On a rack/scale-up level, we believe Chenbro is the major supplier for PDS ultra and Teton Max rack SKUs.
Besides the above various types of chassis/cabinet products, we also note that Chenbro supplies noise-reduction racks to Amazon that help reduce server operational noises. We believe Chenbro is the main source for this product with up to $2,000-$3,000 USD content value per noise-cancellation rack.
PD (2D Torus)
Power shelt
OOB Management switch
ToR Switch
BBU shelf
Power shelf
BBU shelf
Power shelf
ToR Switch
CPU Head tray (2U)
Storage tray
CPU Head tray (2U)
Compute tray (1U)
Compute tray (2U)|
Compute tray (2U)
Teton Max
PDS Ultra
→ 2 CPUs per tray|
PDS (3D Torus)
OOB Management switch
OOB Management switch|
Powershei
Power shelf
CPU Head tray (2U)
CPU Head tray (2U)
→ 2 XPUs per tray |
Compute tray (2U)
Storage tray
Compute tray (1U)
Power shelt
CPU Head tray (2U)
Compute tray (2U)
• 2 CPUs per tray|
• 2 XPUs per tray
• 2 CPUs per tray|
• 2 XPUs per tray
Compute tray (2U)|
• 4 XPUs & 1 CPU
per tray
Figure 7: Amazon ASIC server rack scale-up SKUs
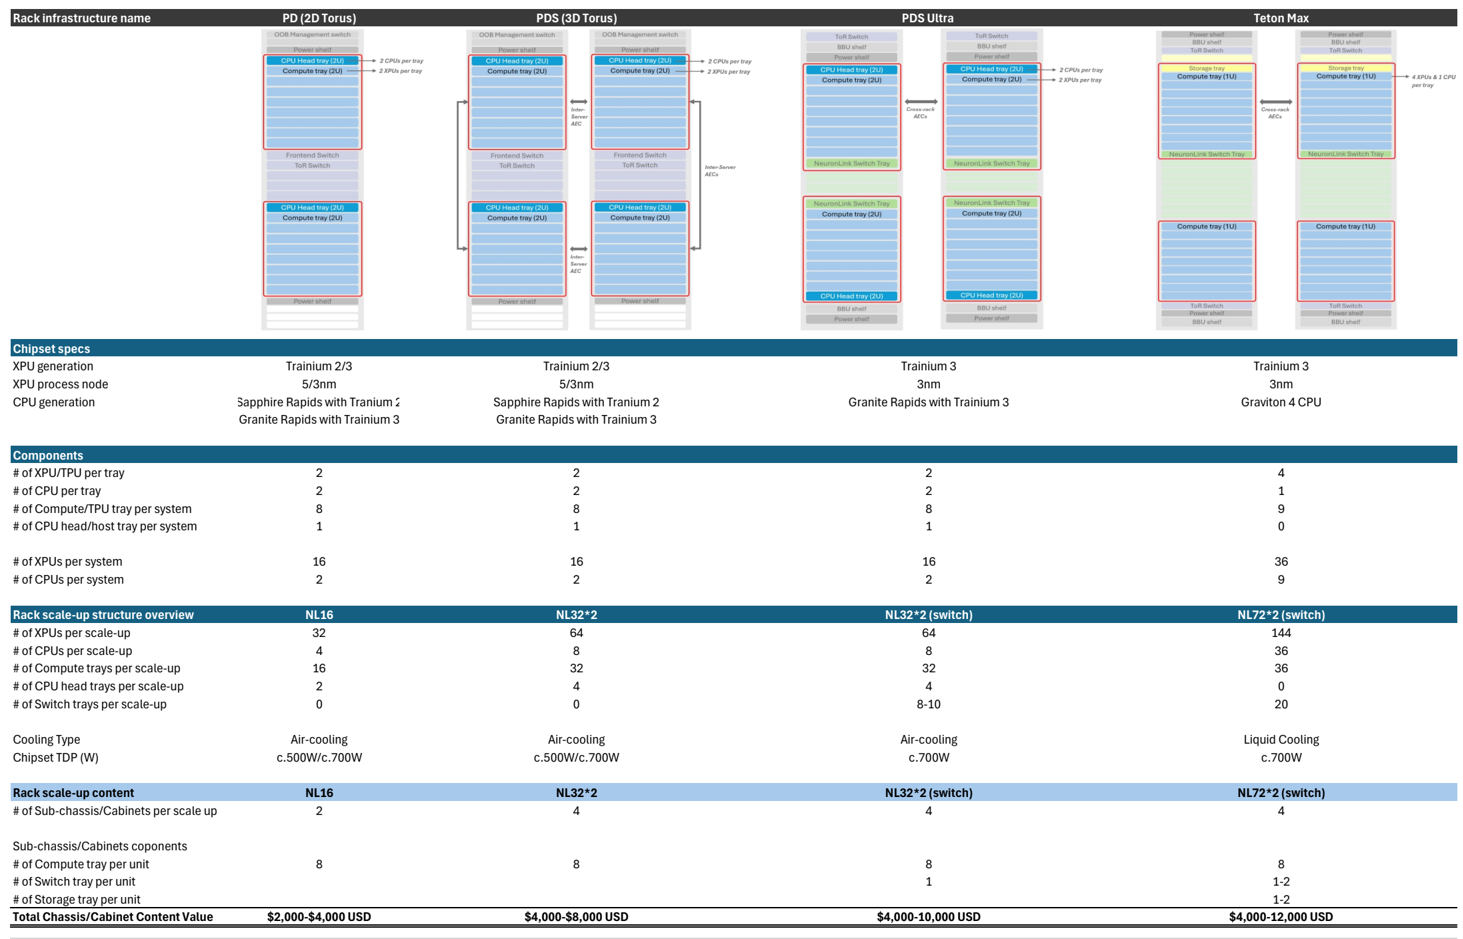
Source: Company data, UBS estimates
Power shelt
ToR Switch
BBU shelf
BBU shelf
ToR Switch
HGX Platform
Power shelf (1U)
Power shelf (1U)
Power shelf (1U)
MGX Platform
Management switches
Power shelf (1U)
Power shelf (1U)
Power shelf (1U)
Power shelf (1U)
Compute tray
18 chassis per rack
Case studies #2: NVDA GPU AI servers
Blackwell GPU
Compute tray
Compute tray
Compute tray
For Nvidia's market shift from Hopper racks in 2023-24 to Blackwell through 2025-26, we see a trend toward lower rack unit (U) servers that allow a server to include more trays in a rack, requiring significantly more rails and content in each rack. Chenbro first started to supply 4-7U chassis for Ampere/Hopper HGX racks, where one rack hosts up to 2-4 GPU server systems, where the design concept is mainly focused on GPU component protection. Moving to the Blackwell generation with NVL72 architecture, 1U/2U server rack demand has accelerated with rising component density, where Chenbro is NVDA's MGX 1U/2U chassis design partner.
- HGX (Oberon, 4-11U height): Align with what we've seen with rail kit designs, per Ampere/Hopper server system (4-7U height) comes with one external enclosed chassis and an open chassis/drawer in the middle specifically hosting the GPU board. This has later evolved into 7-11U chassis for Blackwell HGX racks, where customer is asking for more optimised thermal management, required more space for additional fans to be added. The HGX server chassis are generally shipped on L5 level, where metal/plastic chassis case, along with enclosure parts including PSU, cable, and/or backplane would be integrated and I/O tested. Our industry studies suggest the content for chassis players could go as high as $10,000$15,000 USD when firstly introduced if including the R&D and qualification costs, but content value sits at $3,000-$5,000 USD per chassis for mass production level. We believe Chenbro has major share with one major US CSP , and has recently added another US CSP customer. Blackwell GPU (4-11U)
- MGX (Oberon, 1/2U height): Chenbro is NVDA's design partner for 1U/2U MGX chassis and supplies L3 chassis. The company manufactures mainly compute trays (no switch tray) and small volume of power shelf chassis. GB200 MGX systems were more 1U height while GB300 had higher 2U mix. Chenbro supplies to 1-2 major US CSPs and also working closely with ODMs to ship to other enterprise/ neo-cloud customers. Our studies suggest each generation potentially looking for 15-50% of chassis content increase based on the additional tooling required, where content value sits at $700-$1,300 USD per chassis .
- Kyber (vertical, less than 1U width): Kyber as the potential successor to Nvidia's Oberon rack design will likely have four sub-chassis per rack, where each chassis will house up to 18 vertical computing blades, and each blade presumably can support up to eight GPUs and two CPUs. Meanwhile, NVLink switch blades will be integrated with orthogonal backplane. Our research suggests the system design has yet to be finalised for Kyber, the architecture would likely reduce each compute blade to as low as 0.5-0.7U in width/thickness to pack high densities of computing chipsets in shrinking physical space. We believe AI server requirements for customised designs and specifications, as well as diverse customer demand, will continue to drive up the complexity for server component design, which may bode well for the server chassis content trajectory.
Figure 8: Nvidia GPU server rack architectures
Source: Company data, UBS estimates
Kyber Architecture
NVL 144 Rack
• 4 x Sub-Chassis per rack
GPU
GPU
Cross Section View
Switch Trays (Blades)
connected on the other side of Kyber Backplane
1 x Kyber Backplane per Chassis
4 x Backplanes per Rack
financial analysis
Near term: Strong performance in 2025, in-line Q2 results but temporary hiccup in July sales
Chenbro's 2025 sales reached NT$22bn, for 52% YoY growth, driven by the ramp-up of Server/Storage (99% of sales). Gross margin increased 3.9ppt YoY to 30.0%, reflecting a favourable product mix change, as rapid volume growth in higher-margin AI server chassis. Operating expenses increased approximately NT$543mn, driven by higher administrative and R&D spending to support growth initiatives. However, opex as a percentage of sales declined from 8.8 in 2024 to 8.3%, reflecting improved operating leverage. Operating profit increased 85% YoY, more than offsetting a decline in nonoperating income to NT$65m from NT$105mn in 2024 on FX losses. As a result, 2025 EPS surged 82% YoY to NT$29.06.
Q226 EPS of NT$11.10 was in line with consensus estimates. Q226 sales of NT$7.8n were up 10% QoQ and up 44% YoY, supported by stronger demand for HGX, ASIC, and MGX servers. We estimate a Q226 sales mix of AI server chassis ~65%, general servers at ~27%, Rack/Components at ~8% and PC less than 1%. GM was 32.6%, flattish QoQ, though Opex was 8% of sales, within its target range of 8-8.5%, leading to OPM to 24.6%. It booked a NT$22m non-operating loss, primarily from FX loss on NTD/ USD depreciation.
July sales declined 24% MoM impacted by shipment logistics and electronic component shortages, which has led the stock to declined 18% since reported; but management reiterated sales were simply delayed and expect revenue to grow sequentially through Q326 and Q426, driven by strong CSP capex trends and continued strength in AI-related demand. We forecast Chenbro's Q326/Q426 sales to grow 17%/19% QoQ, while GM slightly down to 30.1%/29.8% to reflect increasing product mix for racks, leading to 22.9%/22.6% operating margin. For full-year 2026, management guides at least 40% sales growth YoY with stable margins.
Figure 9: We expect AI server chassis/racks to drive a 35% sales CAGR in 2025-30
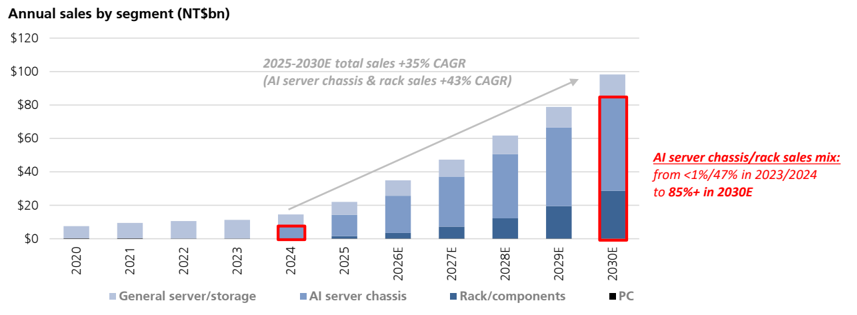
Source: Company data, UBS estimates
Expanding AI platform supports sustained revenue growth
We estimate Chenbro's 2026 revenue to grow 59% YoY to NT$34.9bn, driven by continued growth in AI server chassis and expanding participation in rack-level AI infrastructure projects. We forecast AI server chassis revenue to grow 74% YoY, accounting for 63% of total revenue, supported by increasing deployments across NVIDIA HGX/MGX platforms and growing exposure to AI ASIC customers. Meanwhile, we see Chenbro's efforts to leverage core mechanical capabilities and broadening its offerings to full rack-level customised solutions with noise cancellation rack project with major US CSP , and also working on cooling/CDU rack/components with multiple platforms. We forecast Chenbro's rack-level business sales contribution will expand from <1% in 2024 to 15%+ in 2027/2028E.
We model GM to sustain at 31%/30%/30%in 2026E/27E/28E, with increasing AI server chassis mix and higher margin rack components to more than offset the relatively lowermargin rack business. That being said, as AI server system/rack designs become more
complex with higher customisation and integration efforts asked on rack level, we believe its profitability for its rack/component business would improve on higher valueadd, which will support GM at 30%+ level. We also expect opex as a percentage of sales to decline on stronger revenue growth with operating leverage, supporting further margin expansion. As a result, we forecast EPS growth of 68%/35%/31% in 2026E/27E/28E, respectively.
Figure 10: Our estimates vs. consensus
| Q126 | Q226 | Q226 | Q326E | Q326E | Q426E | Q426E | |
|---|---|---|---|---|---|---|---|
| (NT$m) | Actual | Actual | Consensus | UBSe | Consensus | UBSe | Consensus |
| Revenue | 7,107 | 7,821 | 7,882 | 9,129 | 8,830 | 10,889 | 9,863 |
| - QoQ / YoY | 5.4% | 10.0% | 10.9% | 16.7% | 12.0% | 19.3% | 11.7% |
| Gross profit | 2,333 | 2,553 | 2,461 | 2,748 | 2,750 | 3,247 | 3,043 |
| - Gross margin | 32.8% | 32.6% | 31.2% | 30.1% | 31.1% | 29.8% | 30.9% |
| Operating profit | 1,779 | 1,926 | 1,843 | 2,087 | 2,048 | 2,465 | 2,270 |
| - OP margin | 25.0% | 24.6% | 23.4% | 22.9% | 23.2% | 22.6% | 23.0% |
| Non-op profit | 13 | -22 | (1) | -2 | (2) | -2 | 2 |
| Pre-tax profit | 1,792 | 1,904 | 1,842 | 2,085 | 2,046 | 2,463 | 2,273 |
| Tax | 427 | 500 | 447 | 521 | 493 | 616 | 540 |
| - Tax rate | 23.8% | 26.3% | 24.3% | 25.0% | 24.1% | 25.0% | 23.8% |
| Net profit | 1,336 | 1,383 | 1,384 | 1,541 | 1,496 | 1,820 | 1,664 |
| EPS (NT$) | 10.73 | 11.10 | 11.22 | 12.37 | 12.05 | 14.61 | 13.41 |
| 2025 | 2026E | 2026E | 2027E | 2027E | 2028E | 2028E | |
|---|---|---|---|---|---|---|---|
| (NT$m) | Actual | UBSe | Consensus | UBSe | Consensus | UBSe | Consensus |
| Revenue | 22,001 | 34,946 | 33,622 | 47,296 | 45,410 | 61,696 | 54,129 |
| - QoQ / YoY | 51.6% | 58.8% | 52.8% | 35.3% | 35.1% | 30.4% | 19.2% |
| Gross profit | 6,594 | 10,882 | 10,680 | 14,333 | 13,677 | 18,638 | 15,886 |
| - Gross margin | 30.0% | 31.1% | 31.8% | 30.3% | 30.1% | 30.2% | 29.3% |
| Operating profit | 4,767 | 8,258 | 8,024 | 11,096 | 10,264 | 14,491 | 11,901 |
| - OP margin | 21.7% | 23.6% | 23.9% | 23.5% | 22.6% | 23.5% | 22.0% |
| Non-op profit | 65 | -14 | (9) | -20 | (18) | -20 | (51) |
| Pre-tax profit | 4,832 | 8,244 | 8,014 | 11,076 | 10,246 | 14,471 | 11,851 |
| Tax | 1,171 | 2,064 | 1,959 | 2,769 | 2,480 | 3,618 | 2,854 |
| - Tax rate | 24.2% | 25.0% | 24.4% | 25.0% | 24.2% | 25.0% | 24.1% |
| Net profit | 3,558 | 6,080 | 5,878 | 8,184 | 7,688 | 10,692 | 8,687 |
| EPS (NT$) | 29.06 | 48.81 | 47.37 | 65.69 | 61.94 | 85.83 | 70.11 |
Source: UBS estimates, Visible Alpha. Note: Above EPS figures reflect reported EPS and may differ from figures in the coverage page table, which show adjusted earnings.
Figure 11: Chenbro's GM and OPM
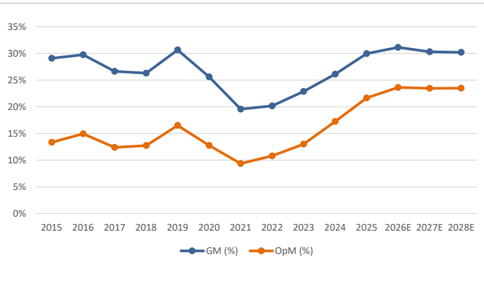
Source: Company data, TEJ, UBS estimates
Figure 12: Chenbro's R&D dollar and % of sales
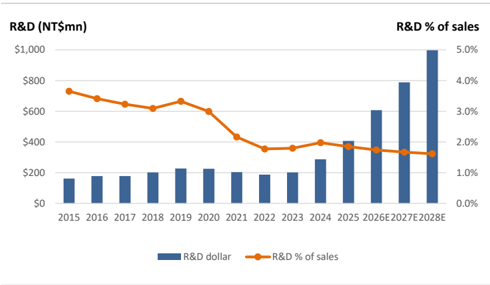
Source: Company data, TEJ, UBS estimates
Geographical diversification is key to driving an outperformance in the rack business
Considering the rising geopolitical risks and the growing importance of proximity to its major customers, Chenbro plans to establish manufacturing sites in 1) California, US: first operation base in US focusing on sampling and prototype studies starting in September, 2025; 2) Texas, US: first volume manufacturing site in US scheduled for production by end of 2026 or early 2027 with up to 80-100K units monthly capacity (based on 1U measurement); 3) Johor, Malaysia: factory plant targeted for pilot run in May 2026 with up to 80-100K of monthly capacity. Manufacturing site proximity in the US can allow faster market response and reduce production lead times as well as risks associated with raw material availability and logistics costs among the global supply chain.
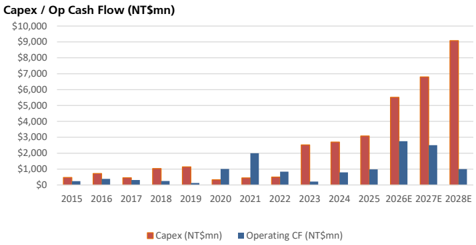
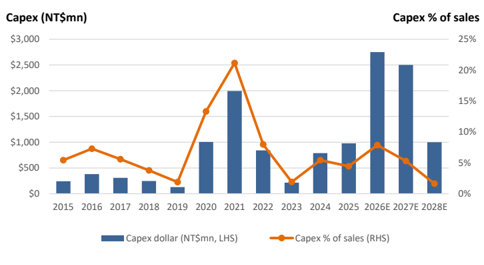
With the strategic shift for near-shoring and capacity expansion plans announced, we expect Chenbro to embark higher capex in the coming years. We forecast its capex to reach NT$2.8bn/2.5bn in 2026E/27E, above the prior peak level in 2020/2021 at NT $1bn/2bn, when the company established its manufacturing sites in Shulin (sampling) and Chiayi (volume production), Taiwan.
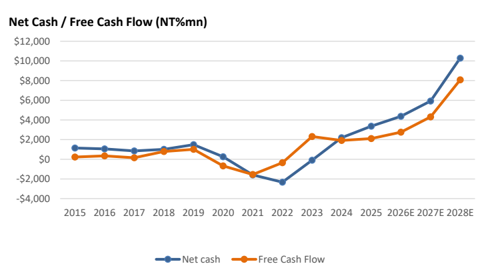
Over the past decade, Chenbro generated a total of NT$10.3bn of operating cash flow (c.NT$1.0bn/annual on average) to fund its aggregate capex of NT$6.1bn (or c.0.6bn/ annual) and still generated NT$4.2bn of free cash flow through 2015-2024.We anticipate its operating cash flow to be higher on expanding revenue scale and project Chenbro to generate NT$8.7bn/11.6bn of free cash flow in 2026E/2027E, which should be sufficient to support current capex plan. That being said, given the strong expansion plans ahead and considering its net cash to equity ratio at 30.3% as of Q425, we believe there is room to increase its financial leverage to strengthen its operational flexibility.
Figure 13: Chenbro's operating cash flow vs. capex dollar
Source: Company data, TEJ, UBS estimates
Figure 15: Chenbro's net cash/debt and FCF
Source: Company data, TEJ, UBS estimates
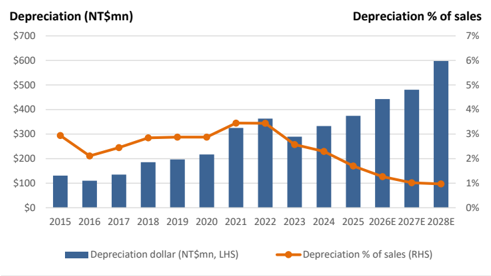
Figure 14: Chenbro's depreciation dollar and % of sales
Source: Company data, TEJ, UBS estimates
Figure 16: Chenbro's capex dollar and % of sales
Source: Company data, TEJ, UBS estimates
fragmented Competitive landscape
Server chassis market is quite fragmented. Compared with peers, Chenbro is the most concentrated player, deriving 99% of revenue from server chassis (60-65% AI) with increasing customer exposure to major CSPs and enterprises, where others maintain a more diversified mix that includes PC chassis, power/liquid cooling supplies. Below is a brief overview of the major server chassis/cabinet suppliers:
- Foxconn Group (2317.TW) and AVC (3017.TW): We believe Foxconn Group and AVC are the two major competitors Chenbro encounter in the AI server space. Foxconn Group and AVC are particularly competitive in GPU/ASIC platforms, where computing and thermal requirements are more demanding; calling for higher level of integration capabilities and thermal expertise.
- Chen Ming (3013.TW): Expanding from traditional server chassis to IT racks as well as vertical integration of key thermal components such as sidecar and manifold. The company has received qualification for NVDA GB300 and serve major CSP customer such as Meta.
- AIC (3693.TW): Investments in both chassis and system leading to transition from single AI server to rack-level system integration. The company is collaborating with Nvidia on Vera storage and server platforms and also partnering with AMD on AI infrastructure that includes Helios AI server chassis/cabinet and rack-scale platform as well as custom AMD EPYC/instinct servers.
- In Win (6117.TW): Expanding from PC/Gaming to Workstations with concentration in Taiwan/South East Asia and has relatively small exposure for Blackwell/GB chassis.
Figure 17: AI server chassis market value
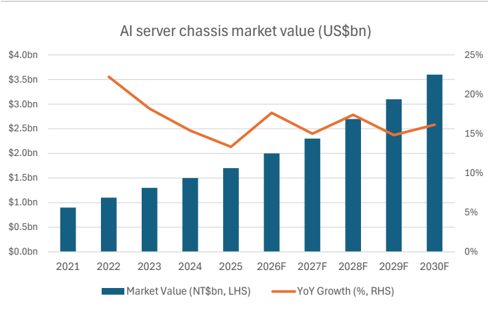
Source: Future Market Insights
Figure 18: AI server chassis by cooling
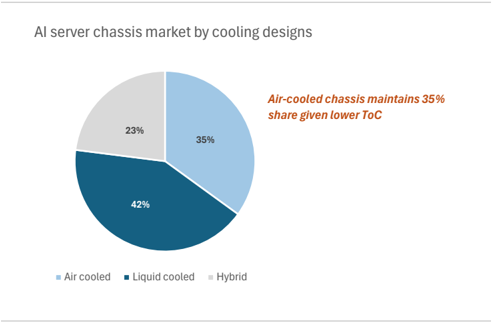
Source: Future Market Insights
AVC: Thermal-led business emerging as key AI server chassis competitor
Asia Vital Components (AVC, 3017.TW), founded in 1991, is a leading Taiwanese provider of thermal management solutions. Its core thermal and mechanical segment accounts for 78% of total revenue in 2025, including chassis (16%) and a broad thermal portfolio (62%) spanning air and liquid cooling products such as cold plates, manifolds, and CDUs. System assembly and peripherals contribute 13%, while its subsidiary Fositek adds 9% through hinge products.
Unlike traditional chassis vendors, AVC's chassis business is supported by its in-house thermal portfolio and its position as the reference designer for leading-edge AI server cold plates. This enables the company to deliver integrated thermal and mechanical solutions, particularly for increasingly complex AI server architectures. We believe AVC supports all tier 1 US CSPs on GPU AI racks, with ASIC rack coverage expanding from three to all four CSPs in 2026, making it one of Chenbro's main direct competitors in the industry. The company is particularly competitive in ASIC platforms, where thermal requirements are more demanding, while Chenbro focuses on mechanical design and chassis engineering, with higher share in GB/VRs. AVC's server chassis business grew +160% YoY in 2025, supported by strong AI server demand, with servers accounting for
over 80% of its chassis mix. AVC operates manufacturing sites in China and Vietnam and is expanding chassis capacity mainly through new Vietnam plants, supplemented by additions at existing China sites expected to ramp progressively through 2026-27.
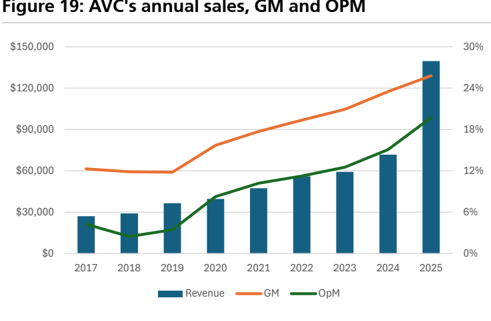
Source: Company data
Figure 20: AVC's 2025 revenue mix by product
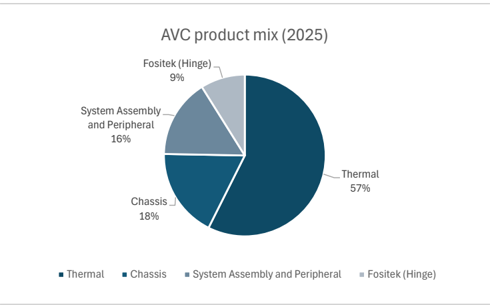
Source: Company data
ChenMing Electronic: Highly concentrated customer exposure
ChenMing Electronic (3013.TW) is a Taiwanese chassis manufacturer established in 1976. The company started out providing stamping molds before supplying PC chassis to OEM/ODM customers including IBM, HP, Acer, and Quanta in the 1990s. It created its own brand "UNEEC" in 2000 and gradually expanded into general servers, AI servers, and liquid-cooling rack systems. It entered the U.S. cloud supply chain through Meta, supported by its development of high-U AI server chassis and liquid-cooled side-car rack. Expanding beyond L3-L6, the company has started to offer L6-L10 server assembly services for selected customers to capture the value of the full-assembly model. Major customers include 2 Taiwan ODMs which account for roughly 60% of revenue, Chinese system vendors 30%, and other brand customers about 10%. US CSPs contributes 7080% of sales, which Meta represent the largest potion; and China accounts for 20-30% sales, where e.g. Huawei's server chassis are used in SuperPODs. The company noted its GB300 side car rack for Meta was delayed from a bottleneck in radiators and had finally started to ramp in November 2025 to triple digit units, and highlighted its AMD ORW rack that has passed verification and can ship once orders are received.
Headquartered in Taipei City (Taiwan), its manufacturing sites are located in: 1) Dongguan (China) and 2) Ningbo (China), which together form the company's core production base for high-volume server chassis and racks, with Dongguan mainly supplying Taiwanese customers in the South China region and Ningbo supporting those in the Central China region; 3) Zhongli (Taiwan), which handles Taiwan-based sampling and liquid-cooling rack assembly, has announced to start construction of a second fab starting December 2025 due to strong demand, and should double liquid cooling sidecar capacity in 2026; and 4) Thailand, where mass production is expected in Q326 and bring capacity up +20-30% YoY.
Figure 21: ChenMing's annual sales, GM and OPM
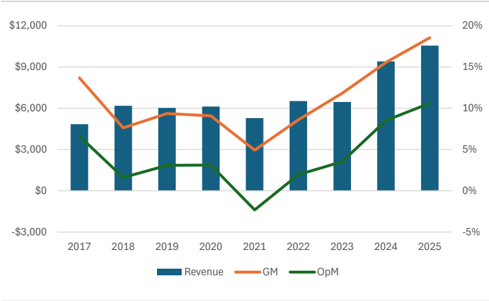
Source: Company data
Figure 22: ChenMing's 9M25 revenue mix by product
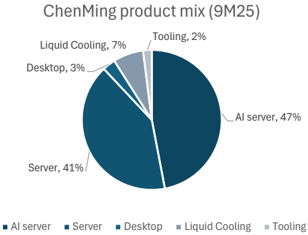
Source: Company data
In Win: Ramping Blackwell/GB series from a small base
In Win (6117.TW) is a Taiwanese chassis manufacturer established in 1985. It began in selling PC cases and progressively expanded into painting, stamping, molding, power supplies, and full in-house production capabilities through the 1990s-2000s. In 2006, the company stepped into the retail market with PC and Gaming products, and in 2009 started mass production of IPC chassis. In 2012, In Win established its cloud business division and further set up a server system assembly line in 2013. Its business model primarily involves co-designing server chassis with customers, manufacturing the chassis, and then performing system assembly services up to L11 using customersupplied materials, followed by testing. The liquid cooling business unit focuses mainly on equipment testing after assembly rather than component manufacturing many peers are focused on. Revenue mix for 2025 was Server 59%, PC 29%, Power Supply 4%, Cooling 1%, and Others 7%, with management guiding server contribution to reach 60% by 2026 as the key growth driver. Geographically, server sales are primarily made to Taiwan-based system vendors, including ASUS, ASRock, and Gigabyte, which serve overseas enterprise and data center end-customers. This drove Taiwan's revenue contribution from 42% in 2024 to 54% in 2025. In contrast, Americas (14%) and EMEA (13%) have seen mix decline with more exposure in PC chassis business. Malaysia mix (included in APAC 10%) is growing as it's developed as a separate hub for server assembly for newly acquired regional customers. In Win has been ramping up production of its B200, B300, and GB200 platforms, with GB300 system assembly driving incremental revenue from H225 onwards following NVIDIA's qualification of the Taoyuan ChangXing II facility.
In Win is headquartered in Taoyuan with manufacturing concentrated in Taiwan and the U.S., and additional capacity under development in Malaysia. The company's Taiwan facilities include Nankan (established in 1992), Changxing I (2016) as the primary manufacturing base, and Changxing II (2021), which expanded system assembly capacity. In the U.S., a factory constructed in 2024 is dedicated exclusively to rack-level assembly up to L11, in contrast to Chenbro's fully integrated U.S. plant. In Win also began constructing a Malaysia site in 2025 for IPC server chassis and system assembly which is currently sampling, with both the U.S. and Malaysia facilities expected to commence mass production in 2026.
Figure 23: In Win's annual sales, GM and OPM
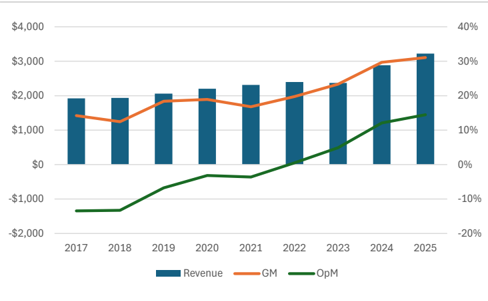
Source: Company data
Figure 24: In Win's 2025 revenue mix by product
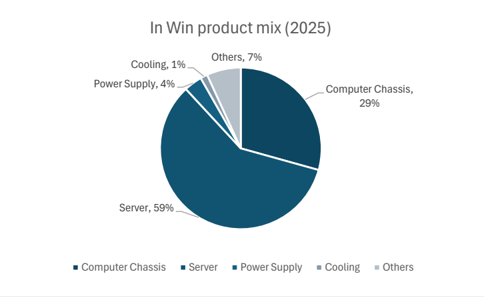
Source: Company data
Business overview
HOLDINGS, LLC.
(USA) INC.
Chenbro Micom Co., Ltd
| 100%
Micom-Source
Holding Co.
100%
Chenbro GmbH
100%
CHENBRO
(MALAYSIA) SDN.
Chenbro was founded in 1983 and is widely recognised as Asia's first PC chassis manufacturer, establishing its reputation through high customisation and design differentiation, and securing the PC chassis OEM mandate for IBM. In the early 2000s, the company pivoted to server chassis, winning projects from global OEMs like Dell, HPE, IBM, as well as a broad range of major Taiwan ODMs serving major CSPs. Today, Chenbro designs and manufactures server chassis, industrial/personal computer chassis and peripheral mechanical components, providing L3-L6 solutions along with initial server rack offerings through its three service models: OTS (Off-The-Shelf), JDM/ODM (Joint Design Manufacturing), and OEM Plus. 12% 100% 88% Dongguan Procase
Figure 25: Chenbro's company structure (2025)
Qinkun (Jinan)
Source: Company data
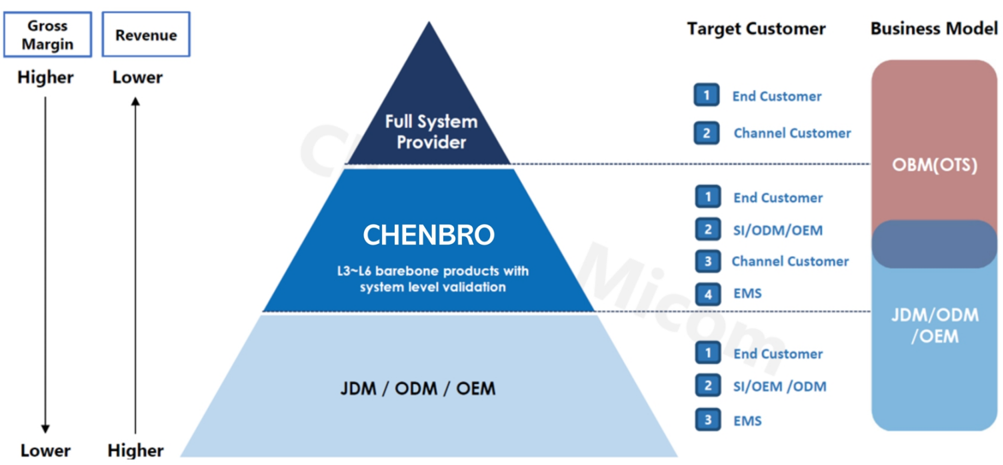
The company mainly operates under three business models including Joint Design Manufacturing (JDM/ODM), Original Technology Solutions (OTS), and Original Equipment Manufacturer Plus (OEM Plus), ensuring it meets the diverse market requirements.
- JDM/ODM (joint development, 60-65% of sales): The JDM/ODM model centers on Chenbro co-designing next-generation data center products with CSP and system integrator customers from an early stage. Chenbro offers complete end-to-end service, from front-end product design, R&D, small-scale production, and verification at its NCT factories to full-scale mass production across its Chiayi, Dongguan, and Kunshan sites.
- OBM/OTS (own branded manufacturing/standard process, 10-20% of sales): The OBM/OTS model focuses on standardised, modular off-the-shelf server enclosures designed for high compatibility and high diversity, enabling quick and flexible deployment. These ready-made chassis target AI and 5G applications and are primarily distributed through channel partners.
- OEM Plus (Value-added contract manufacturing, 15-25% of sales): The OEM Plus business model builds on conventional contract manufacturing by adding process optimisation, improved lead-time management and cost efficiencies. This model focuses on manufacturing support without design involvement.
Electronic Co., Ltd.
70%
Chen-Feng Precision
Co., Ltd.
Gross
Margin
Revenue
Figure 26: Chenbro's business model
Lower
Target Customer
1 End Customer
Source: Company data. Image courtesy of Chenbro
Taiwan and China as main production sites, with Malaysia capacity to come online in 2026 and US/Vietnam after
Chenbro is headquartered in New Taipei City, and operates a 8.75-acre mass production plant in Chiayi since 2022, focusing on designing and manufacturing server chassis and related peripheral components. Its subsidiary Chen-Feng Precision Co. has just completed relocation from Wugu to Shulin in early 2025 to expand Numerical Control Turret Punch (NCT) plant production capacity and accelerate customer prototyping, with a total area of 0.42 acres. Chenbro also has 2 major manufacturing sites in China, located in Kunshan (54.5 acres) and Dongguan (54.8 acres), which commenced operations in 2006 and 2007 respectively. NCT capabilities are embedded within its MP sites in Chiayi, Kunshan, Dongguan, in addition to standalone NCT faciities in Shulin and the US.
To strengthen its OOC manufacturing footprint, Chenbro announced plans to set up a Malaysia fab in August 2024, with cumulative investment of up to NT$2.0bn. The plant in Johor will support both chassis and rack manufacturing with mass production targeted in Q326. In addition, Chenbro inaugurated a new NCT site in California in March 2026 to accelerate product development with US front-end customers. In August 2025, the board approved of a manufacturing facility in Dallas, Texas. Following an additional NT$800mn investment, the total planned investment has increased to NT $2.0bn, management expects mass production kicking off in H227 considering the time required to set up highly automated production lines.
As Chenbro expands into rack-level solutions, management expects the rack business to exceed 10% of revenue in 2026 and reach 20% in 2027. To support growth, its Malaysia fab will start production in Q426, and the company approved up to NT$600mn in Aug 2026 to establish a Vietnam subsidiary, positioning the new facility (through leasing) as a key rack production hub targeted to begin production in H127. Together with the Dallas facility, which over half dedicated to rack production from Q427, and existing operations in Malaysia, China and Taiwan, Chenbro is building a global, increasingly in-house manufacturing footprint for rack products.
Business Model
Area 0.42 Acres
Area 8.75 Acres
Figure 27: Chenbro's fab locations
Source: Company data, UBS
Senior management
- Chairman - Ms. Mei-Chi Chen : Ms. Mei-Chi Chen co-founded Chenbro in 1983 with Mr. Lien-Chun Chen and Mr. Feng-Ming Chen, and has served as Chairman since inception. She is also the representative of Lian Mei Investment Co., Ltd. which holds ~10% of Chenbro's shares. She graduated from the National Chengchi University with a bachelor's degree in Banking and earned an EMBA and a Global Entrepreneur Program from National Taiwan University.
- CEO and President - Ms. Corona Chen : Ms. Corona Chen assumed the role of CEO & President of Chenbro in 2023 and also serves as Chief Sustainability Officer. She joined Chenbro in 2013 and has held several key positions, including Executive Assistant to the Chairperson, Vice President of Global Sales, and Group General Manager. Prior to joining Chenbro, Ms. Chen accumulated 37 years of industry experience with Intel, LSI, and NetApp. At Intel, she managed suppliers and ODM factories across Greater China and helped establish the server operations team in Shanghai, successfully driving the white-box server business model. Ms. Chen holds both a bachelor's degree in Foreign Languages and Literature and completed the Global Entrepreneur Program at National Taiwan University.
Shareholder structure
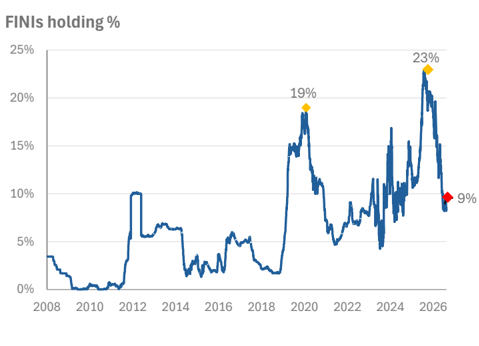
Publicly listed on the Taiwan Stock Exchange in Dec 2011, Chenbro's founder and family members along with related investment companies under the company/family's control in aggregate holds roughly 51% of the outstanding shares. Chenbro's FINI holding came down from 19% in 2020 to 4% in 2021 but had climbed back up to previous levels of 20% in Q325 as AI server market took off, but has since corrected to 9% (vs Taiex's FINI holding 49%). Core family vehicles include Peng Wei Investment Development (9.9%), Lian Mei Investment (9.7%), and Ming-Kwong Investment (6.7%).
Figure 28: Breakdown of Chenbro's shareholdings
Holdings Breakdown
21%
7%
51%
Local SITEs/Prop
Figure 29: Foreign investors' ownership %
Source: TEJ. Note: Data as of 17 August 2026
20%
Family Holdings
FINIs
Source: TEJ. Note: Data as of end-Q126.
Area 54.8 Acres
Area 54.5 Acres
Others
What´s Priced In?
WHAT´S PRICED IN?
Source: Refinitiv Eikon
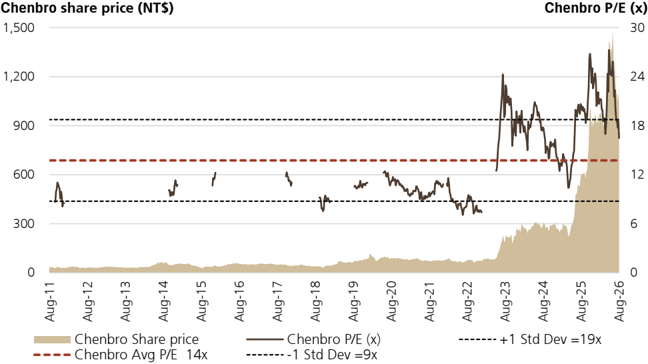
Chenbro's PE valuation range was 7-12x before 2023, before structurally re-rating to a higher valuation range from H223. Its re-rating was mainly driven by: 1) the ramp-up of H100 AI server shipments to AWS; and 2) a mix shift toward higher-U AI server chassis, driving higher ASPs through increased system complexity. Since the start of the AI cycle, Chenbro has largely traded within a 14-27x PE range, averaging 18x 12-month forward PE. The stock has since pulled back from its peak valuation of 27x in May 2026 due to near-term earnings concerns related to component shortages and freight issues, and is now trading at 15x/12x 2027E/2028E PE, at the mid-to-lower end of its post-AI range and implying a 0.6x PEG on a 30% 2026-30E earnings CAGR. We believe the current valuation largely reflects continued growth in Chenbro's core AI chassis business, but does not fully capture several potential upside drivers. In our view, these include: 1) the Vera Rubin platform transition, which should drive higher AI server chassis volumes and content per system; 2) an increasing contribution from rack-level solutions, including AMD Helios and liquid-cooling platforms, which expand Chenbro's addressable content beyond standalone chassis; and 3) additional ASIC programme wins, which could further diversify customer exposure and extend Chenbro's AI growth runway.
We note that Chenbro's FINI holding pulled back in 2021 when gross margin fell short of investor expectations, dragged by material cost pressure while end markets remained relatively stagnant. While institutional investors' holdings gradually climbed back as the AI server market took off, they have been falling again from their 2025 peak due to rising competitive risks as customers added alternative suppliers amid capacity tightness. Chenbro is expanding capacity to support its emerging rack business. Its Malaysia fab will start production in Q426F, with its Vietnam fab scheduled to commence operation in H127. We believe this should help alleviate concerns about Chenbro's growth being capped by limited capacity, and believe increasing engagement in the rack business leverages Chenbro's design/manufacturing expertise in mechanical components and strong customer relationships, which should benefit from AI deployment that drives higher chassis content and an expanding TAM for customised racks.
We also note that the stock has pulled back 18% since the release of its financial results. July sales came in below consensus expectations at NT$2.46bn, down 24% MoM, as customers pull-in were slower-than-expected due to 1) component mismatches caused by memory shortages; 2) longer lead times owing to logistics constraints. As the company has pivoted into the rack business, which typically involves much heavier payloads, some customers have started to request that shipments be transported by sea freight rather than traditional air cargo used for lighter chassis/cabinet products. Management believes revenue recognition will gradually flow back in the coming months after these products arrive at customer hubs. We remain confident in its rack business growth and believe its strategic shift towards the customised rack and component business has yet to be fully priced in.
Chenbro is trading at NT$1,010 (as of 17 August 2026)
Our price target of NT$1,450.00 is based on a 19x average 2027-28E PE. While Foxconn and AVC are more direct comparables at the chassis/rack business level, chassis/rack and mechanical parts remain a relatively small part of both companies' businesses. We believe Chenbro should trade above the average valuation for ODM/OEM peers at a 1015x 12-month forward PE, considering its stronger earnings expansion and better margin profile; but should trade below the average 20-30x 12-month forward PE valuation of other component peers such as Delta, KingSlide and Jentech, which have more dominant market shares in their respective fields. We believe Chenbro will continue to trade at a premium to hardware ODM/OEM peers and should trade towards its historical high-end trading range of 18-24x 12-month forward PE, reflecting accelerated growth boosted by its increasing exposure to higher-content rack-level systems.
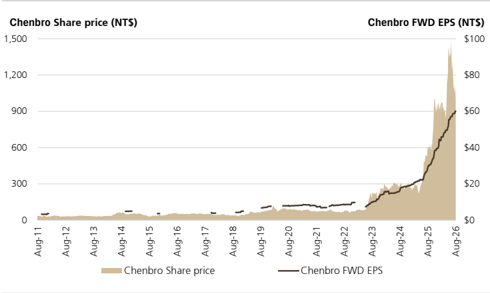
Figure 31: Chenbro's historical share price and 12-month forward EPS trend
Source: Company data, Refinitiv Eikon
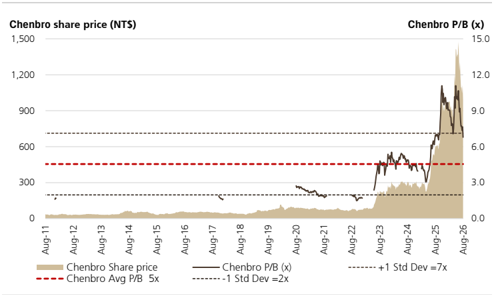
Figure 32: Chenbro's historical P/BV band
Source: Company data, Refinitiv Eikon
Figure 33: Valuation comparison of Taiwan hardware ODM/OEMs, AI components and PCB substrates
| Sales | growth | (%) | Sales CAGR EPS | growth | (%) | EPS CAGR | P/E (x) | P/E (x) | P/E (x) | P/B | P/B | ROE (%) | ROE (%) | Div Yld (%) | Div Yld (%) | ||||
|---|---|---|---|---|---|---|---|---|---|---|---|---|---|---|---|---|---|---|---|
| Company | Ticker | Market Cap ($USmn) | 2026E | 2027E | 2028E | 2025-28 | 2026E | 2027E | 2028E | 2025-28 | 2026E | 2027E | 2028E | 2027E | 2028E | 2027E | 2028E | 2027E | 2028E |
| Hardware ODM/OEMs | |||||||||||||||||||
| Asustek Computer Inc. | 2357.TW | 21,817 | 42.0 | 24.1 | 7.1 | 23.6 | 27.8 | -8.7 | 5.4 | 7.1 | 13.2 | 14.2 | 13.5 | 2.4 | 2.3 | 17.3 | 17.4 | 5.7 | 5.2 |
| Compal Electronics | 2324.TW | 5,765 | 28.1 | 31.7 | 16.7 | 25.3 | 55.8 | 31.5 | 24.3 | 36.6 | 20.5 | 15.3 | 12.3 | 1.4 | 1.3 | 9.0 | 10.6 | 0.0 | 4.1 |
| Giga-Byte Technology | 2376.TW | 7,526 | 75.0 | 15.9 | 15.8 | 32.9 | 83.8 | -1.3 | 12.0 | 26.7 | 12.0 | 12.0 | 10.8 | 3.2 | 2.8 | 28.4 | 28.2 | 5.6 | 5.5 |
| Hon Hai Precision | 2317.TW | 111,802 | 36.7 | 35.1 | 16.4 | 29.0 | 35.8 | 26.5 | 17.5 | 26.4 | 14.0 | 11.1 | 9.4 | 1.7 | 1.6 | 16.4 | 17.3 | 3.6 | 4.6 |
| Inventec | 2356.TW | 7,486 | 46.3 | 25.1 | 15.1 | 28.2 | 44.2 | 21.5 | 27.8 | 30.8 | 20.0 | 16.5 | 12.9 | 3.0 | 2.5 | 18.9 | 21.2 | 3.0 | 2.3 |
| Lenovo Group | 0992.HK | 44,604 | 33.3 | 10.5 | 10.9 | 17.8 | 43.6 | 72.6 | 9.8 | 39.6 | 27.5 | 19.1 | 11.0 | 5.2 | 3.6 | 38.4 | 30.8 | 1.2 | 1.2 |
| Micro-Star International | 2377.TW | 4,003 | -5.4 | 11.2 | 10.0 | 5.0 | 87.8 | -15.6 | 11.5 | 20.9 | 12.9 | 14.7 | 13.2 | 2.0 | 1.9 | 14.3 | 14.9 | 4.2 | 3.6 |
| Pegatron | 4938.TW | 7,572 | 15.0 | 19.8 | 5.2 | 13.1 | 8.5 | 22.3 | 20.0 | 16.8 | 16.2 | 13.3 | 11.0 | 1.1 | 1.1 | 8.9 | 9.9 | 4.4 | 4.7 |
| Quanta | 2382.TW | 40,398 | 98.5 | 28.5 | 24.1 | 46.8 | 38.0 | 27.8 | 24.1 | 29.8 | 12.2 | 9.5 | 7.7 | 4.1 | 3.2 | 48.4 | 47.1 | 4.8 | 6.6 |
| Wistron | 3231.TW | 17,650 | 82.5 | 55.1 | 29.7 | 54.2 | 91.8 | 48.6 | 36.8 | 57.4 | 11.1 | 7.4 | 5.4 | 1.8 | 1.3 | 29.4 | 27.6 | 4.9 | 5.4 |
| Wiwynn | 6669.TW | 38,309 | 38.3 | 89.4 | 22.1 | 47.4 | 33.2 | 43.3 | 16.5 | 30.5 | 17.7 | 12.3 | 10.5 | 6.8 | 5.2 | 66.2 | 55.9 | 3.3 | 4.7 |
| Avg. | 44.6 | 31.5 | 15.7 | 29.4 | 50.0 | 24.4 | 18.7 | 29.3 | 16.1 | 13.2 | 10.7 | 3.0 | 2.4 | 26.9 | 25.5 | 3.7 | 4.4 | ||
| Median | 38.3 | 25.1 | 15.8 | 28.2 | 43.6 | 26.5 | 17.5 | 29.8 | 14.0 | 13.3 | 11.0 | 2.4 | 2.3 | 18.9 | 21.2 | 4.2 | 4.7 | ||
| Components | |||||||||||||||||||
| Accton Technology Corp | 2345.TW | 40,497 | 67.1 | 29.8 | 37.3 | 43.9 | 89.2 | 30.8 | 43.0 | 52.4 | 25.8 | 19.7 | 13.8 | 9.6 | 7.0 | 56.2 | 58.6 | 2.3 | 3.3 |
| Chenbro | 8210.TW | 3,947 | 58.8 | 35.3 | 30.4 | 41.0 | 67.2 | 34.6 | 30.7 | 43.3 | 20.5 | 15.2 | 11.7 | 6.0 | 4.5 | 45.7 | 44.3 | 2.2 | 2.9 |
| Delta Electronics | 2308.TW | 154,053 | 41.1 | 40.3 | 29.3 | 36.8 | 82.8 | 59.6 | 33.3 | 57.3 | 45.6 | 27.9 | 20.9 | 9.8 | 7.4 | 40.6 | 40.2 | 1.1 | 1.8 |
| King Slide Works | 2059.TW | 40,972 | 173.9 | 40.2 | 16.5 | 64.8 | 192.0 | 33.0 | 17.3 | 65.7 | 41.5 | 31.2 | 26.6 | 15.7 | 11.7 | 59.9 | 50.6 | 3.0 | 3.5 |
| Lotes | 3533.TW | 6,003 | 18.2 | 32.5 | 19.5 | 23.3 | 18.7 | 40.2 | 26.9 | 28.3 | 20.6 | 14.7 | 11.6 | 3.6 | 3.0 | 26.6 | 28.5 | 2.4 | 3.4 |
| Asia Vital Components Co Ltd | 3017.TW | 39,675 | 57.9 | 37.9 | 20.6 | 38.0 | 111.3 | 47.8 | 22.3 | 56.3 | 31.7 | 21.5 | 17.6 | 11.3 | 7.0 | 61.1 | 47.3 | 1.7 | 2.0 |
| Auras Technology Co Ltd | 3324.TWO | 2,937 | 61.2 | 27.6 | 23.2 | 36.3 | 95.6 | 35.3 | 25.1 | 49.0 | 18.3 | 13.5 | 10.8 | 4.7 | 3.6 | 38.8 | 36.4 | 2.8 | 3.6 |
| Jentech Precision Industrial Co Ltd | 3653.TW | 22,174 | 50.2 | 79.9 | 46.7 | 58.3 | 70.1 | 108.7 | 54.3 | 76.3 | 79.0 | 37.8 | 24.5 | 18.2 | 13.3 | 55.5 | 61.5 | 1.3 | 2.5 |
| Avg. | 66.1 | 40.5 | 27.9 | 42.8 | 90.8 | 48.7 | 31.6 | 53.6 | 35.4 | 22.7 | 17.2 | 9.9 | 7.2 | 48.0 | 45.9 | 2.1 | 2.9 | ||
| Median | 58.4 | 36.6 | 26.2 | 39.5 | 86.0 | 37.7 | 28.8 | 54.3 | 28.8 | 20.6 | 15.7 | 9.7 | 7.0 | 50.6 | 45.8 | 2.3 | 3.1 | ||
| PCB | |||||||||||||||||||
| Kinsus Interconnect Technology | 3189.TW | 13,335 | 35.3 | 30.6 | 43.9 | 36.5 | 235.4 | 85.5 | 70.0 | 119.5 | 73.1 | 39.3 | 23.2 | 8.8 | 6.9 | 24.3 | 33.5 | 0.7 | 1.2 |
| Nan Ya Printed Circuit Board | 8046.TW | 26,664 | 45.1 | 54.4 | 25.7 | 41.2 | 433.2 | 125.3 | 28.1 | 148.7 | 81.2 | 36.1 | 28.2 | 11.5 | 9.2 | 36.4 | 36.3 | 0.6 | 1.4 |
| Unimicron Technology | 3037.TW | 53,777 | 43.3 | 45.4 | 35.1 | 41.2 | 455.0 | 60.6 | 52.9 | 138.9 | 42.8 | 26.1 | 17.1 | 8.7 | 6.3 | 37.9 | 42.8 | 0.9 | 1.4 |
| Avg. | 41.2 | 43.5 | 34.9 | 39.6 | 374.5 | 90.5 | 50.3 | 135.7 | 65.7 | 33.8 | 22.8 | 9.6 | 7.5 | 32.9 | 37.5 | 0.7 | 1.3 | ||
| Median | 43.3 | 45.4 | 35.1 | 41.2 | 433.2 | 85.5 | 52.9 | 138.9 | 73.1 | 36.1 | 23.2 | 8.8 | 6.9 | 36.4 | 36.3 | 0.7 | 1.4 |
Source: LSEG Workspace (non-covered companies), UBS estimates (covered companies). Note: Data as of 17 August 2026.
Chenbro Micom - 8210.TW Price
1500
Upside/Downside Spectrum
Upside/Downside Spectrum
1750.0
• 1450.0
700.0
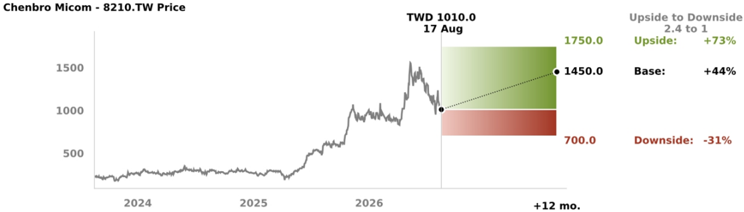
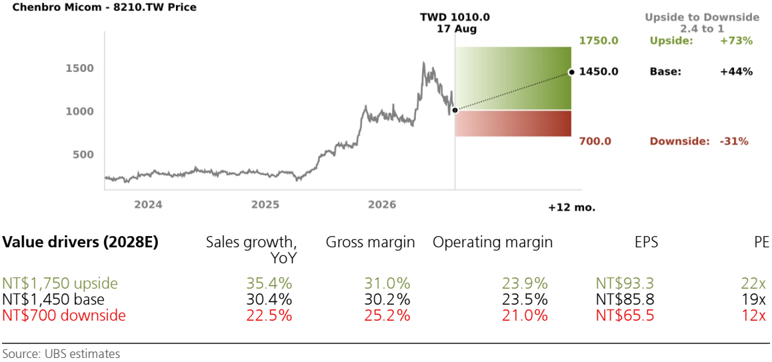
Risk to the current share price is skewed (2.4:1) to the upside
Chenbro is trading at NT$1,010 (as of 17 August 2026).
UPSIDE (NT$1,750): We assume 2027E/2028E YoY sales growth would increase to 38%/35%, while GM would expand to 31%/31%, reflecting stronger-than-expected HGX, ASIC and MGX demand; faster rack penetration; and greater contribution from liquid-cooling solutions. We apply a roughly 22x average 2027-28E PE to arrive at our NT $1,750.00 upside valuation.
BASE (NT$1,450): We forecast 2027-28 YoY sales growth of 35%/30%, and GM of 30%/30%, reflecting continued AI and general server demand, as well as rack revenue expansion. We then apply a 19x average 2027-28E PE to arrive at our NT$1,450.00 price target.
DOWNSIDE (NT$700): We assume 2027-28E YoY sales growth would fall to 29%/22%, and GM would be 27%/25%, reflecting slower AI deployments, prolonged component shortages and weaker-than-expected rack ramp-up. We then apply a roughly 12x average 2027-28E PE to arrive at our NT$700.00 downside valuation.
TWD 1010.0
17 Aug
Upside to Downside
Upside:
2.4 to 1
+73%
Base:
+44%
Downside: -31%
Chenbro is trading at NT $1,010 (as of 17 August 2026)
Company Description
Company Description
Chenbro Micom is a leading global provider of chassis solutions for server, storage and industrial computing applications. Founded in 1983 as one of Asia's earliest PC chassis manufacturers, Chenbro expanded into the server chassis in the early 2000s and has since built long-standing partnerships with: 1) enterprise server vendors including HPE, IBM and Dell; and 2) major CSPs through ODM integration. In 2025, server chassis and peripheral products accounted for 99% of its total sales, while PC chassis products contributed the remaining 1%.
Industry Outlook
The UBS Global Tech team expects total server shipments to grow 18.9% in 2026 and 16.6% in 2027 YoY (link), supported by strong AI demand with solid visibility in 2027E. The team forecasts 77.5k Nvidia NVL72 racks in 2026, with expectations for 2027E reaching 95k (across the Blackwell and Rubin platforms) (link).
Figure 34: Revenue by product type, 2025
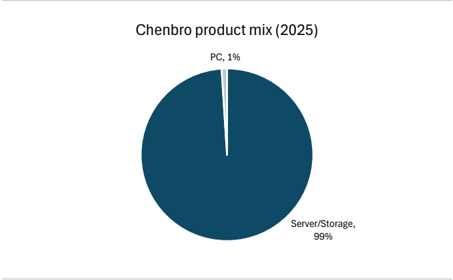
Source: Company data
Figure 35: Revenue by region, 2025
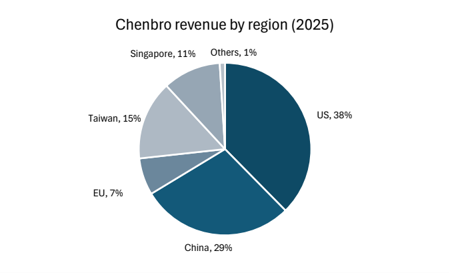
Source: Company data
Chenbro Micom (8210.TW)
| Income Statement (NT$m) | 12/23 | 12/24 | 12/25 | 12/26E | %ch | 12/27E | %ch | 12/28E | 12/29E | 12/30E |
|---|---|---|---|---|---|---|---|---|---|---|
| Revenues | 11,247 | 14,517 | 22,001 | 34,946 | 58.8 | 47,296 | 35.3 | 61,696 | 78,858 | 98,275 |
| Gross profit | 2,574 | 3,790 | 6,594 | 10,882 | 65.0 | 14,333 | 31.7 | 18,638 | 23,905 | 29,892 |
| EBITDA (UBS) | 1,751 | 2,839 | 5,142 | 8,700 | 69.2 | 11,577 | 33.1 | 15,089 | 19,298 | 24,136 |
| Depreciation & amortisation | (290) | (333) | (374) | (443) | -18.3 | (481) | -8.6 | (598) | (600) | (615) |
| EBIT (UBS) | 1,462 | 2,506 | 4,767 | 8,258 | 73.2 | 11,096 | 34.4 | 14,491 | 18,699 | 23,521 |
| Associates & investment income | 0 | 0 | 0 | 0 | - | 0 | - | 0 | 0 | 0 |
| Other non-operating income | 39 | 26 | 82 | (20) | - | 0 | 0 | 0 | 0 | |
| Net interest | (46) | (19) | (6) | (6) | 5.5 | (20) | - -239.4 | (20) | (20) | (20) |
| Exceptionals (incl goodwill) | (25) | 97 | (11) | 12 | - | 0 | - | 0 | 0 | 0 |
| Pre-tax profit | 1,430 | 2,611 | 4,832 | 8,244 | 70.6 | 11,076 | 34.4 | 14,471 | 18,679 | 23,501 |
| Tax | (323) | (639) | (1,171) | (2,064) | -76.2 | (2,769) | -34.2 | (3,618) | (4,670) | (5,875) |
| Profit after tax | 1,107 | 1,972 | 3,661 | 6,180 | 68.8 | 8,307 | 34.4 | 10,853 | 14,009 | 17,626 |
| Preference dividends | 0 | 0 | 0 | 0 | - | 0 | - | 0 | 0 | 0 |
| Minorities | (22) | (38) | (102) | (101) | 1.5 | (123) | -22.2 | (161) | (207) | (261) |
| Extraordinary items | 0 | 0 | 0 | - | 0 | - | 0 | 0 | 0 | |
| Net earnings (local GAAP) | 1,085 | 1,934 | 0 3,558 | 6,080 | 70.9 | 8,184 | 34.6 | 10,692 | 13,801 | 17,365 |
| Net earnings (UBS) | 1,111 | 1,836 | 3,570 | 70.0 | 8,184 | 34.9 | 10,692 | 13,801 | 17,365 | |
| Tax rate (%) | 22.6 | 24.5 | 24.2 | 6,067 25.0 | 3.3 | 25.0 | -0.1 | |||
| Per Share (NT$) | 12/23 | 12/24 | 12/25 | 12/26E | %ch | 12/27E | 25.0 | 25.0 | 25.0 | |
| EPS (UBS, diluted) | 9.24 | 15.25 | 29.28 | 48.71 | 66.3 | 65.69 | %ch 34.9 | 12/28E 85.83 | 12/29E 110.79 | 12/30E 139.39 |
| EPS (local GAAP, diluted) | 9.03 | 16.06 | 29.19 | 48.81 | 67.2 | 65.69 | 34.6 | 85.83 | 110.79 | 139.39 |
| EPS (UBS, basic) | 9.24 | 29.28 | 48.71 | 65.69 | 85.83 | 139.39 | ||||
| DPS (net) (NT$) | 4.00 | 15.25 | 14.00 | 66.3 | 21.96 | 34.9 | 29.56 | 110.79 | ||
| Cash EPS (UBS, diluted) 1 | 11.65 | 5.00 18.01 | 7.50 32.35 | 52.26 | 86.7 61.5 | 69.55 | 56.9 33.1 | 90.63 | 38.62 115.60 | 49.85 144.33 |
| Book value per share | 45.70 | 59.33 | 89.53 | 122.10 | 36.4 | 165.71 | 35.7 | 221.80 | 293.74 | 382.99 |
| Average shares (diluted) | 120 | 120 | 122 | 125 | 2.2 | 125 | 0.0 | 125 | 125 | 125 |
| Balance Sheet (NT$m) | 12/23 | 12/24 | 12/25 | 12/26E | %ch | 12/27E | %ch | 12/28E | 12/29E | 12/30E |
| Cash and equivalents | 2,979 | 4,540 | 5,912 | 6,919 | 17.0 | 8,470 | 22.4 | 12,844 | 18,746 | 26,462 |
| Other current assets Total current assets | 5,609 8,588 | 6,045 | 10,672 | 13,274 | 24.4 | 18,043 26,513 | 35.9 | 23,549 | 30,082 | 37,467 |
| Net tangible fixed | 4,875 | 10,585 | 16,583 | 20,193 | 21.8 | 31.3 | 36,392 | 48,828 | 63,929 | |
| assets | 5,314 | 5,591 | 7,898 | 41.3 | 9,917 | 25.6 | 10,319 | 10,720 | 11,105 | |
| Net intangible fixed assets assets | 0 | 0 | 0 | 0 | - | 0 1,283 | - | 0 | 0 | 0 1,283 |
| Investments / other | 524 | 744 | 1,283 | 1,283 | 0.0 | 0.0 | 1,283 | 1,283 | ||
| Total assets | 13,987 | 16,644 | 23,456 | 29,373 | 25.2 | 37,713 | 28.4 | 47,994 | 60,830 | 76,316 |
| Trade payables & other ST liabilities | 5,307 | 5,992 | 9,692 | 11,284 | 16.4 | 14,192 | 25.8 | 17,485 | 21,360 | 25,729 |
| Short term debt | 376 | 641 | 1,222 | 1,222 | 0.0 | 1,222 | 0.0 | 1,222 | 1,222 | 1,222 |
| Total current liabilities Long term debt | 5,683 2,701 | 6,632 1,711 | 10,914 1,332 | 12,506 1,332 | 14.6 0.0 | 15,414 1,332 | 23.3 0.0 | 18,707 1,332 | 22,582 1,332 | 26,951 |
| Other long term liabilities | 26 | 1,037 | 134 | 134 | 0.0 | 134 | 0.0 | 134 | 134 | 1,332 134 |
| Preferred shares | 0 | 0 | 0 | 0 | - | 0 | - | 0 | 0 | 0 |
| Total liabilities (incl pref shares) | 8,409 | 9,380 | 12,380 | 13,972 | 12.9 | 16,880 | 20.8 | 20,173 | 24,048 | 28,417 |
| Common s/h equity | 51 | 90 | 192 | 192 | 0.0 | 192 | 0.0 | 192 | 192 | 47,707 |
| Minority interests | 5,527 | 7,174 | 10,885 | 15,210 | 39.7 | 20,641 | 35.7 | 27,629 | 36,590 | 192 |
| Total liabilities & equity | 13,987 | 16,644 | 23,456 | 29,373 | 25.2 | 37,713 | 28.4 | 47,994 | 60,830 | 76,316 |
| Cash Flow (NT$m) | 12/23 | 12/24 | 12/25 | 12/26E | %ch | 12/27E | %ch | 12/28E | 12/29E | 12/30E |
| Net income (before pref divs) | 1,085 | 1,934 | 3,558 | 6,080 | 70.9 | 8,184 | 34.6 | 10,692 | 13,801 | 17,365 |
| Depreciation & amortisation | 290 | 333 | 374 | 443 | 18.3 | 481 | 8.6 | 598 | 600 | 615 |
| Net change in working capital Other operating | 1,611 (462) | 249 181 | (927) 82 | (1,010) 0 | -8.9 - | (1,861) 0 | -84.2 - | (2,212) 0 | (2,659) 0 | (3,016) 0 |
| Operating cash | 2,524 | 2,697 | 3,087 | 5,512 | 78.6 | 23.4 | 9,078 | 11,743 | 14,964 (1,000) | |
| flow Tangible capital | (214) | (789) | (978) | (2,750) | 6,804 (2,500) | (1,000) | ||||
| expenditure | -181.2 | 9.1 | (1,000) | |||||||
| Intangible capital expenditure | 0 | 0 | 0 | 0 | - | 0 | - | 0 | 0 | 0 |
| Net (acquisitions) & disposals Other investing | 0 (20) | (106) | 0 | 0 0 | - - | 0 0 | - - | 0 0 | 0 0 | 0 0 |
| Investing cash | (234) | (694) | 485 (493) | NM | ||||||
| flow | (1,589) | (2,750) | (2,500) | 9.1 | (1,000) | (1,000) | (1,000) | |||
| Equity dividends paid | (483) | (603) | (907) 0 | (1,754) | -93.3 | (2,752) | -56.9 - | (3,705) 0 | (4,840) 0 | (6,248) 0 |
| Share issues / (buybacks) | 0 | 0 | - | 0 | ||||||
| Other financing | (10) | 0 1,083 | (8) | 0 | - | 0 | - | 0 | 0 | 0 0 |
| Change in debt & pref shares | (682) | (828) | 210 (705) | 0 | - -149.0 | 0 (2,752) | - -56.9 | 0 (3,705) | 0 (4,840) | (6,248) |
| Financing cash flow Cash flow inc/(dec) in | (1,175) 1,116 | (348) 759 | 1,889 | (1,754) 1,008 | 4,373 | 5,902 | 7,716 | |||
| cash | -46.7 - | 1,551 0 | 53.9 | |||||||
| FX / non cash items cash | (4) | 802 | (518) | 0 1,008 | 1,551 | - 53.9 | 0 4,373 | 0 | 0 | |
| 1,111 | 1,371 | -26.5 | ||||||||
| 5,902 | ||||||||||
| Balance sheet inc/(dec) in | 1,561 | 7,716 |
Source: Company accounts, UBS estimates. (UBS) metrics use reported figures which have been adjusted by UBS analysts. 1 Cash EPS (UBS, diluted) is calculated using UBS net income adding back depreciation and amortization.
Chenbro Micom (8210.TW)
| Valuation (x) | 12/23 | 12/24 | 12/25 | 12/26E | 12/27E | 12/28E | 12/29E | 12/30E |
|---|---|---|---|---|---|---|---|---|
| P/E (local GAAP, diluted) | 17.8 | 17.6 | 17.7 | 20.7 | 15.4 | 11.8 | 9.1 | 7.2 |
| P/E (UBS, diluted) | 17.4 | 18.6 | 17.7 | 20.7 | 15.4 | 11.8 | 9.1 | 7.2 |
| P/CEPS | 13.8 | 15.7 | 16.0 | 19.3 | 14.5 | 11.1 | 8.7 | 7.0 |
| Equity FCF (UBS) yield% | 11.9 | 5.6 | 3.4 | 2.2 | 3.4 | 6.4 | 8.5 | 11.1 |
| Dividend yield (net)% | 2.5 | 1.8 | 1.4 | 1.4 | 2.2 | 2.9 | 3.8 | 4.9 |
| P/BV | 3.5 | 4.8 | 5.8 | 8.3 | 6.1 | 4.6 | 3.4 | 2.6 |
| EV/revenues (core) | 1.8 | 2.3 | 2.7 | 3.5 | 2.5 | 1.9 | 1.4 | 1.1 |
| EV/EBITDA (UBS core) | 11.7 | 11.6 | 11.6 | 14.0 | 10.4 | 7.8 | 5.8 | 4.4 |
| EV/EBIT (core) | 14.1 | 13.2 | 12.5 | 14.7 | 10.9 | 8.1 | 6.0 | 4.5 |
| EV/OpFCF (core) | 11.7 | 11.6 | 11.6 | 14.0 | 10.4 | 7.8 | 5.8 | 4.4 |
| EV/op. invested capital | 3.2 | 6.4 | 9.8 | 13.5 | 9.5 | 7.4 | 6.0 | 4.8 |
| Enterprise value (NT$m) | 12/23 | 12/24 | 12/25 | 12/26E | 12/27E | 12/28E | 12/29E | 12/30E |
| Market cap. | 19,402 | 34,234 | 62,756 | 125,784 | 125,784 | 125,784 | 125,784 | 125,784 |
| Net debt (cash) | 1,213 | (1,046) | (2,773) | (3,862) | (5,141) | (8,103) | (13,241) | (20,050) |
| Buy out of minorities | 40 | 70 | 141 | 192 | 192 | 192 | 192 | 192 |
| Pension provisions/other | 0 | 0 | 0 | 0 | 0 | 0 | 0 | 0 |
| Total enterprise value | 20,656 | 33,258 | 60,124 | 122,115 | 120,835 | 117,873 | 112,735 | 105,926 |
| Non core assets | (93) | (277) | (354) | (354) | (354) | (354) | (354) | (354) |
| Core enterprise value | 20,564 | 32,981 | 59,770 | 121,761 | 120,482 | 117,519 | 112,382 | 105,572 |
| Growth (%) | 12/23 | 12/24 | 12/25 | 12/26E | 12/27E | 12/28E | 12/29E | 12/30E |
| Revenue | 6.5 | 29.1 | 51.6 | 58.8 | 35.3 | 30.4 | 27.8 | 24.6 |
| EBITDA (UBS) | 16.4 | 62.1 | 81.1 | 69.2 | 33.1 | 30.3 | 27.9 | 25.1 |
| EBIT (UBS) | 28.0 | 71.5 | 90.2 | 73.2 | 34.4 | 30.6 | 29.0 | 25.8 |
| EPS (UBS, diluted) | 38.6 | 65.0 | 92.1 | 66.3 | 34.9 | 30.7 | 29.1 | 25.8 |
| Net DPS | 33.3 | 25.0 | 50.0 | 86.7 | 56.9 | 34.6 | 30.7 | 29.1 |
| Margins & Profitability (%) | 12/23 | 12/24 | 12/25 | 12/26E | 12/27E | 12/28E | 12/29E | 12/30E |
| Gross profit margin | 22.9 | 26.1 | 30.0 | 31.1 | 30.3 | 30.2 | 30.3 | 30.4 |
| EBITDA margin | 15.6 | 19.6 | 23.4 | 24.9 | 24.5 | 24.5 | 24.5 | 24.6 |
| EBIT (UBS) margin | 13.0 | 17.3 | 21.7 | 23.6 | 23.5 | 23.5 | 23.7 | 23.9 |
| Net earnings (UBS) margin | 9.9 | 12.6 | 16.2 | 17.4 | 17.3 | 17.3 | 17.5 | 17.7 |
| ROIC (EBIT) | 22.9 | 48.3 | NM | NM | NM | NM | NM | NM |
| ROIC post tax | 17.8 | 36.0 | 59.4 | 68.6 | 65.9 | 68.5 | 75.0 | NM |
| ROE (UBS) | 21.3 | 28.9 | 39.5 | 46.5 | 45.7 | 44.3 | 43.0 | 41.2 |
| Capital structure & Coverage (x) | 12/23 | 12/24 | 12/25 | 12/26E | 12/27E | 12/28E | 12/29E | 12/30E |
| Net debt / EBITDA | 0.1 | (0.8) | (0.7) | (0.5) | (0.5) | (0.7) | (0.8) | (1.0) |
| Net debt / total equity% | 1.7 | (30.1) | (30.3) | (28.3) | (28.4) | (37.0) | (44.0) | (49.9) |
| Net debt / (net debt + total equity)% | 1.7 | (43.1) | (43.5) | (39.6) | (39.7) | (58.7) | (78.6) | (99.7) |
| Net debt/EV% | 5.9 | (3.1) | (4.6) | (3.2) | (4.3) | (6.9) | (11.7) | (18.9) |
| Capex / depreciation% | 73.8 | NM | NM | NM | NM | 167.3 | 166.7 | 162.7 |
| Capex / revenue% | 1.9 | 5.4 | 4.4 | 7.9 | 5.3 | 1.6 | 1.3 | 1.0 |
| EBIT / net interest | 31.5 | NM | NM | NM | NM | NM | NM | NM |
| Dividend cover (UBS) | 2.3 | 3.0 | 3.9 | 3.5 | 3.0 | 2.9 | 2.9 | 2.8 |
| Div. payout ratio (UBS)% | 43.3 | 32.8 | 25.6 | 28.7 | 33.4 | 34.4 | 34.9 | 35.8 |
| Revenues by division (NT$m) | 12/23 | 12/24 | 12/25 | 12/26E | 12/27E | 12/28E | 12/29E | 12/30E |
| Others | 11,247 | 14,517 | 22,001 | 34,946 | 47,296 | 61,696 | 98,275 | |
| 11,247 | 78,858 78,858 | 98,275 | ||||||
| Total | 14,517 | 22,001 | 34,946 | 47,296 | 61,696 | |||
| EBIT (UBS) by division (NT$m) | 12/23 | 12/24 | 12/25 | 12/26E | 12/27E | 12/28E | 12/29E | 12/30E |
| Others | 1,462 | 2,506 | 4,767 | 8,258 | 11,096 | 14,491 | 18,699 | 23,521 23,521 |
| Total | 1,462 | 2,506 | 4,767 | 8,258 | 11,096 | 14,491 | 18,699 |
Source: Company accounts, UBS estimates. (UBS) metrics use reported figures which have been adjusted by UBS analysts.
Forecast returns
| Forecast price appreciation | 43.6% |
|---|---|
| Forecast dividend yield | 1.4% |
| Forecast stock return | 45.0% |
| Market return assumption | 6.3% |
| Forecast excess return | 38.7% |
Company Description
Chenbro Micom is a leading global provider of chassis solutions for server, storage and industrial computing applications. Founded in 1983 as one of Asia's earliest PC chassis manufacturers, Chenbro expanded into the server chassis in the early 2000s and has since built long-standing partnerships with: 1) enterprise server vendors including HPE, IBM and Dell; and 2) major CSPs through ODM integration. In 2025, server chassis and peripheral products accounted for 99% of its total sales, while PC chassis products contributed the remaining 1%.
Valuation Method and Risk Statement
We value Chenbro using a PE-based methodology
Industry risks: AI server demand remains dependent on data centre investment and hyperscaler capex. Slower-than-expected AI server deployments, delays in data centre projects or weaker IT spending could reduce demand for server chassis and weigh on Chenbro's revenue growth and margins. In addition, increasing competition could lead to pricing pressure and lower industry profitability.
Company-specific risks: Chenbro faces customer concentration risk, making it potentially vulnerable to order volatility, inventory corrections, and shifts in customer procurement strategies. The company could also face market share losses if key customers diversify suppliers or if it is unable to maintain its competitiveness in product design, cost and execution.
Quantitative Research Review
UBS Global Research publishes a quantitative assessment of its analysts' responses to certain questions about the likelihood of an occurrence of a number of short term factors in a product known as the 'Quantitative Research Review'. The views for this month can be found below. Views contained in this assessment on a particular stock reflect only the views on those short term factors which are a different timeframe to the 12-month timeframe reflected in any equity rating set out in this note. For previous responses please make reference to (i) previous UBS Global Research reports; and (ii) where no applicable research report was published that month, the Quantitative Research Review which can be found at https://neo.ubs.com/quantitative, or contact your UBS sales representative for access to the report or the Quantitative Research Team on ubs-quant-answers@ubs.com. A consolidated report which contains all responses is also available and again you should contact your UBS sales representative for details and pricing or the Quantitative Research Team on the email above.
Chenbro Micom
| Question | Response |
|---|---|
| 1. Is the industry structure facing the firm likely to improve or deteriorate over the next six months? Rate on a scale of 1-5 (1 = getting worse, 3 = no change, 5 = getting better, N/A = no view) | 4 |
| 2. Is the regulatory/government environment facing the firm likely to improve or deteriorate over the next six months? Rate on a scale of 1-5 (1 = getting tougher 3 = no change, 5 = getting better, N/A = no view) | N/A |
| 3. Over the last 3-6 months in broad terms have things been improving/no change/getting worse for this stock? Rate on a scale of 1-5 (1 = getting a lot worse, 3 = not much change, 5 = getting a lot better, N/A = no view) | 4 |
| 4. Relative to the current CONSENSUS EPS forecast, is the next company EPS update likely to lead to: (1 = negative surprise vs consensus, 3 = in-line with consensus, 5 = positive surprise vs consensus expectations, N/A = no view) | N/A |
| 5. What's driving the difference? | |
| 6. Relative to YOUR current earnings forecast, is there relatively greater risk at the next earnings result of:(1 = downside skew risk to earnings, 3 = equal upside or downside risk to earnings, 5 = upside skew risk to earnings, N/A = no view) | N/A |
| 7. What's driving the difference? | |
| 8. Is there an upcoming catalyst for the company over the next three months? | |
| 9. Is there an actual or approximate date for the catalyst? | |
| 10. Is the catalyst date an actual or approximate date? | |
| 11. What is the catalyst? |
Required Disclosures
This document has been prepared by UBS Securities Pte. Ltd., Taipei Branch, an affiliate of UBS AG. UBS AG, its subsidiaries, branches and affiliates, including former Credit Suisse AG and its subsidiaries, branches and affiliates are referred to herein as "UBS".
For information on the ways in which UBS manages conflicts and maintains independence of its UBS Global Research product; historical performance information; certain additional disclosures concerning UBS Global Research recommendations; and terms and conditions for certain third party data used in research report, please visit https://www.ubs.com/disclosures. Unless otherwise indicated, information and data in this report are based on company disclosures including but not limited to annual, interim, quarterly reports and other company announcements. The figures contained in performance charts refer to the past; past performance is not a reliable indicator of future results. Additional information will be made available upon request. UBS Securities Co. Limited is licensed to conduct securities investment consultancy businesses by the China Securities Regulatory Commission. UBS acts or may act as principal in the debt securities (or in related derivatives) that may be the subject of this report. This recommendation was finalized on: 17 August 2026 10:25 AM GMT. UBS has designated certain UBS Global Research department members as Derivatives Research Analysts where those department members publish research principally on the analysis of the price or market for a derivative, and provide information reasonably sufficient upon which to base a decision to enter into a derivatives transaction. Where Derivatives Research Analysts coauthor research reports with Equity Research Analysts or Economists, the Derivatives Research Analyst is responsible for the derivatives investment views, forecasts, and/or recommendations. Quantitative Research Review: UBS Global Research publishes a quantitative assessment of its analysts' responses to certain questions about the likelihood of an occurrence of a number of short term factors in a product known as the 'Quantitative Research Review'. Views contained in this assessment on a particular stock reflect only the views on those short term factors which are a different timeframe to the 12-month timeframe reflected in any equity rating set out in this note. For the latest responses, please see the Quantitative Research Review Addendum at the back of this report, where applicable. For previous responses please make reference to (i) previous UBS Global Research reports; and (ii) where no applicable research report was published that month, the Quantitative Research Review which can be found at https://neo.ubs.com/ quantitative, or contact your UBS sales representative for access to the report or the Quantitative Research Team on ubs-quantanswers@ubs.com. A consolidated report which contains all responses is also available and again you should contact your UBS sales representative for details and pricing or the Quantitative Research team on the email above.