PDF 原檔:報告_Nomura_玉晶光3406_光纖連接器CPO_20261005_original.pdf
圖片清單(已驗證 2026-10-07)
ingest 時建立的圖片索引,是 lib/ 嵌圖的唯一真相來源;<40KB 者未 Read、預設 logo/小圖。
| 檔名 | size | 分類 | 親眼所見內容 |
|---|---|---|---|
報告_Nomura_玉晶光3406_光纖連接器CPO_20261005_003.png |
41KB | 真資料圖 | MT-16/TMT-16 與 MT/TMT Ferrule 端面對照圖,標示兩導針孔中心距 5.3mm/4.6mm、光纖間距 0.25mm、導針孔徑 0.55mm/0.70mm |
報告_Nomura_玉晶光3406_光纖連接器CPO_20261005_004.png |
97KB | 真資料圖 | MPO(1x16、1x12、2x12)與 MMC(1x16、1x12、2x12)連接器外觀,及 1RU 面板:72 個 MPO 埠 vs 264 個 MMC 埠,列出各芯數光纖數 |
報告_Nomura_玉晶光3406_光纖連接器CPO_20261005_005.png |
67KB | 真資料圖 | 透明 EBO ferrule 實體照,可見排列的光纖槽與透鏡區 |
報告_Nomura_玉晶光3406_光纖連接器CPO_20261005_006.png |
70KB | 真資料圖 | EBO 截面示意:9um 光纖光斑經全反射(TIR)鏡準直擴束為 80um,穿過氣隙後由對側 ferrule 聚焦回光纖,標註 AR coating |
報告_Nomura_玉晶光3406_光纖連接器CPO_20261005_007.png |
126KB | 真資料圖 | 兩個 EBO ferrule 對接的 3D 渲染圖與局部放大,紅色光束在鏡面轉折 |
報告_Nomura_玉晶光3406_光纖連接器CPO_20261005_008.png |
75KB | 真資料圖 | FAU 結構示意(來源標 TSMC):光纖、V-groove、鏡子、Si lens 與 COUPE-GC 晶片 |
報告_Nomura_玉晶光3406_光纖連接器CPO_20261005_009.png |
90KB | 真資料圖 | PIC 光經 MLA(微透鏡陣列)稜鏡導向 FAU 光纖陣列的示意圖(來源標 AGC) |
報告_Nomura_玉晶光3406_光纖連接器CPO_20261005_010.png |
52KB | 真資料圖(財務/估值) | 玉晶光股價與 P/E 帶(10x/18x/26x/34x),2020-2027 |
報告_Nomura_玉晶光3406_光纖連接器CPO_20261005_011.png |
46KB | 真資料圖(財務/估值) | 玉晶光股價與 P/B 帶(1x/2.5x/4.0x/5.5x),2020-2027 |
報告_Nomura_玉晶光3406_光纖連接器CPO_20261005_012.png |
66KB | 真資料圖(股價/目標價) | 大立光股價與目標價變動、評等變動標記圖(至 2026-10-05) |
報告_Nomura_玉晶光3406_光纖連接器CPO_20261005_013.png |
91KB | 真資料圖(股價/目標價) | 玉晶光三年股價與目標價/評等變動圖,附 2024 年評等與目標價沿革表 |
原始內容
NOMURA
Genius Electronic Optical 3406.TW 3406 TT
EQUITY: TECHNOLOGY
Fiber connector and CPO an ideal leverage of its capabilities (Erratum)
Quantifying passive fiber connector and CPO opportunities; reiterate Buy
Action: Maintain Buy; raise TP to TWD1,415, implying ~34% upside
We expect AI optical interconnect and communication opportunities (e.g. co-packaged optics fiber array unit [CPO FAU], passive fiber connectors) to transform the traditional optical lens industry over the next 5 years, and believe Taiwanese handset camera lens makers (e.g. Largan [3008 TT, Buy] and Genius) possess inherent advantages to cater to these new markets, given their high-precision molding+plastic injection, optical design, active alignment, optical coating and inspection capabilities, as well as clean-room facilities and sufficient FCF from cash-cow handset lens businesses.
In addition to holding the position of Apple's (AAPL US, Not rated) No. 2 lens supplier, we believe Genius has obtained ferrule order for passive fiber connectors and will start shipping by end-2026F or early-2027F, as per our channel checks (Genius declines to comment, however). Genius appears well-positioned to supply various CPO FAU components (lens, prism, V groove, FA, etc.) and may potentially handle FAU assembly if requested by customers. We estimate the passive fiber connector and CPO-related new businesses will contribute <3%/16-20% earnings for Genius in 2027F/2028F (details in Fig. 10). Yet, given the high dollar content and long-term growth potential of CPO/FAU related products over the next five years, we believe optical lens makers with inherent advantages in this new field deserve stock re-rating; we thus raise our target P/E to 25x (near the high end of the historical range of 10-30x since 2020), from 17x. We reiterate Buy, and raise our TP to TWD1,415, based on 25x 2028F EPS of TWD56.61 (vs. prior TP of TWD568, based on 17x 2025F EPS of TWD33.4, set two years ago). Genius trades at 25x 2027F P/E.
Apple: Sunny's market share loss and continued camera upgrades in 2027-28F
Sunny (2382 HK, Neutral) earlier faced some yield issues with the new variable aperture (VA) main camera lens for the iPhone 18 Pro series, and this could benefit Largan (more directly) and Genius (indirectly) in the competitive landscape. It remains uncertain whether Genius will be introduced as a third lens supplier to iPhone Pro' main camera in the future, and this poses an upside risk to our forecasts. However, given the headwinds of rising memory costs and the potential cannibalization of the 18 Pro series by the iPhone Duo, we forecast slower iPhone lens shipments from end-2026F to 1H27F, before the 20 th anniversary iPhone (Pro Max) and the second-gen iPhone Duo are introduced in 2H27F. We expect further upgrades to the iPhone Pro main camera in 2H27F, and introduction of a new periscope camera for the Pro Max in 2H28F.
(Erratum: This note replaces an earlier published note which incorrectly focused on specific fiber connector. We apologise for any inconvenience this may have caused.)
| Year-end 31 Dec Currency (TWD) | FY25 Actual | Old | FY26F New | Old | FY27F New | Old | FY28F New |
|---|---|---|---|---|---|---|---|
| Revenue (mn) | 24,989 | 24,564 | 27,773 | 0 | 27,514 | 0 | 33,486 |
| Reported net profit (mn) | 3,702 | 3,781 | 4,329 | 0 | 4,677 | 0 | 6,382 |
| Normalised net profit (mn) | 3,702 | 3,781 | 4,329 | 0 | 4,677 | 0 | 6,382 |
| FD normalised EPS | 32.84 | 33.53 | 38.39 | 41.49 | 56.61 | ||
| FD norm. EPS growth (%) | -14.4 | 0.3 | 16.9 | 8.1 | 36.4 | ||
| FD normalised P/E (x) | 32.1 | - | 27.5 | - | 25.4 | - | 18.6 |
| EV/EBITDA (x) | 12.7 | - | 10.9 | - | 9.8 | - | 7.4 |
| Price/book (x) | 4.5 | - | 4.2 | - | 3.8 | - | 3.4 |
| Dividend yield (%) | 1.6 | - | 1.8 | - | 1.9 | - | 2.7 |
| ROE (%) | 14.5 | 13.4 | 15.8 | 15.6 | 19.2 | ||
| Net debt/equity (%) | net cash | net cash | net cash | net cash | net cash |
Source: Company data, Nomura estimates
| Rating Remains | Buy |
|---|---|
| Target price Increased from TWD 568.00 | TWD 1,415.00 |
| Closing price 5 October 2026 | TWD 1,055.00 |
Implied upside
+34.1%
Market Cap (USD mn)
3,740.5
ADT (USD mn)
110.2
Relative performance chart
Source: LSEG, Nomura
Research Analysts
Taiwan Technology
Anne Lee, CFA - NITB anne.lee@nomura.com +886(2) 21769966
Eric Chen, CFA - NITB
eric.chen@nomura.com +886(2) 21769965
China Technology
Donnie Teng - NIHK
donnie.teng@nomura.com +852 2252 1439
Production Complete: 2026-10-05 18:29 UTC
Key data on Genius Electronic Optical
Cashflow statement (TWDmn)
| Year-end 31 Dec | FY24 | FY25 | FY26F | FY27F | FY28F |
|---|---|---|---|---|---|
| EBITDA | 8,858 | 8,782 | 10,009 | 10,756 | 13,633 |
| Change in working capital | 1,417 | -208 | -2,187 | 76 | -1,562 |
| Other operating cashflow | 373 | -1,263 | -1,314 | -1,140 | -1,813 |
| Cashflow from operations | 10,649 | 7,312 | 6,509 | 9,691 | 10,258 |
| Capital expenditure | -1,390 | -1,602 | -2,500 | -4,000 | -3,500 |
| Free cashflow | 9,259 | 5,709 | 4,009 | 5,691 | 6,758 |
| Reduction in investments | -510 | -1,481 | 0 | 0 | 0 |
| Net acquisitions | 0 | 0 | 0 | 0 | 0 |
| Dec in other LT assets | 0 | 0 | 0 | 0 | 0 |
| Inc in other LT liabilities | 0 | 0 | 0 | 0 | 0 |
| Adjustments | -1,130 | 91 | 0 | 0 | 0 |
| CF after investing acts | 7,619 | 4,320 | 4,009 | 5,691 | 6,758 |
| Cash dividends | -1,353 | -2,029 | -1,917 | -2,143 | -2,315 |
| Equity issue | 0 | 0 | 0 | 0 | 0 |
| Debt issue | -3,667 | -2,574 | 0 | 0 | 0 |
| Convertible debt issue | |||||
| Others | -140 | -95 | 0 | 0 | 0 |
| CF from financial acts | -5,160 | -4,699 | -1,917 | -2,143 | -2,315 |
| Net cashflow | 2,459 | -379 | 2,092 | 3,548 | 4,443 |
| Beginning cash | 8,714 | 11,173 | 10,795 | 12,887 | 16,435 |
| Ending cash Ending net debt | 11,173 -6,007 | 10,795 -7,653 | 12,887 -9,745 | 16,435 -13,293 | 20,878 -17,736 |
| Balance sheet (TWDmn) | |||||
| As at 31 Dec | FY24 | FY25 | FY26F | FY27F | FY28F |
| Cash & equivalents | 11,173 | 10,795 | 12,887 | 16,435 | 20,878 |
| Marketable securities | 672 | 2,246 | 2,246 | 2,246 | 2,246 |
| Accounts receivable | 3,981 | 5,640 | 6,943 | 6,878 | 8,372 |
| Inventories | 2,675 | ||||
| 2,379 | 2,115 | 2,759 | 582 | 3,190 | |
| Other current assets | 581 | 582 | 582 | 582 | |
| Total current assets investments | 18,786 500 | 21,378 378 | 25,417 378 | 28,816 378 | 35,267 378 |
| LT Fixed assets | 20,727 | 18,991 | 17,125 | 16,187 | 14,249 |
| Goodwill | 0 | 0 | 0 | 0 | 0 |
| Other intangible assets | |||||
| Other LT assets | 3,022 | 2,893 | 2,893 | 2,893 | 2,893 |
| Total assets | 43,035 | 43,641 | 45,813 | 48,275 | 52,788 |
| Short-term debt | 1,802 | 383 | 383 | 383 | 383 |
| Accounts payable | 1,367 | 2,631 | 2,391 | 2,318 | 2,765 |
| 5,707 | 5,632 | 5,632 | 5,632 | 5,632 | |
| Other current liabilities | 8,780 | ||||
| Total current liabilities | 8,876 | 8,646 | 8,406 | 8,333 | |
| Long-term debt | 3,365 | 2,759 | 2,759 | 2,759 | 2,759 |
| Convertible debt | |||||
| Other LT liabilities | 6,030 | 5,752 | 5,752 | 5,752 | 5,752 |
| Total liabilities | 18,271 | 17,157 | 16,917 | 16,844 | 17,291 |
| Minority interest | 83 | 241 | 241 | 241 | 241 |
| 1,127 | |||||
| Preferred stock Common stock | 1,127 | 1,127 | 1,127 | 1,127 | |
| Retained earnings | 23,554 | 25,116 | 27,528 | 30,063 | 34,129 |
| Proposed dividends | |||||
| Other equity and reserves Total shareholders' equity | 24,681 | 26,243 | 28,655 | 31,190 | 35,257 |
| Total equity & liabilities | 43,035 | 43,641 | 45,813 | 48,275 | 52,788 |
| Liquidity (x) | |||||
| Current ratio | 2.12 | 2.47 | 3.02 | 3.46 | 4.02 |
| Interest cover | - | - | - | ||
| Leverage | - | - | |||
| Net debt/EBITDA (x) | net cash | net cash | net cash | net cash | net cash |
| Net debt/equity (%) | net cash | net cash | net cash | net cash | net cash |
| Per share Reported EPS (TWD) | 38.35 | 32.84 | 38.39 | 41.49 | 56.61 |
| Norm EPS (TWD) | 38.35 | 32.84 | 38.39 | 41.49 | 56.61 |
| FD norm EPS (TWD) | 38.35 | 32.84 | 38.39 | 41.49 | |
| 218.92 | 232.77 | 254.17 | 276.65 | 56.61 | |
| BVPS (TWD) | 18.00 | 17.00 | 19.01 | 20.54 | 312.72 |
| DPS (TWD) Activity (days) | 28.02 | ||||
| Days receivable | 76.3 | 70.3 | 82.7 | 91.7 | 83.3 |
| Days inventory | 49.6 | 48.6 | 48.4 | 55.6 | 50.5 |
| Days payable Cash cycle | 29.4 96.5 | 43.3 75.6 | 49.8 81.2 | 48.2 99.1 | 43.7 90.1 |
Source: Company data, Nomura estimates
| Performance (%) | 1M | 3M | 12M | ||
|---|---|---|---|---|---|
| Absolute (TWD) | 0.0 | 65.9 | 145.1 | M cap (USDmn) | 3,740.5 |
| Absolute (USD) | -0.6 | 66.5 | 134.2 | Free float (%) | 67.3 |
| Rel to Taiwan TAIEX Index | -4.1 | 62.3 | 63.9 | 3-mth ADT (USDmn) | 110.2 |
| Income statement (TWDmn) Year-end 31 Dec | FY24 | FY25 | FY26F | FY27F | FY28F |
|---|---|---|---|---|---|
| Revenue | 23,187 | 24,989 | 27,773 | 27,514 | 33,486 |
| Cost of goods sold | -15,190 | -16,864 | -18,394 | -17,834 | -21,267 |
| Gross profit | 7,997 | 8,125 | 9,379 | 9,680 | 12,219 |
| SG&A | -3,325 | -3,352 | -3,736 | -3,863 | -4,024 |
| Employee share expense | |||||
| Operating profit | 4,671 | 4,773 | 5,643 | 5,818 | 8,195 |
| EBITDA | 8,858 | 8,782 | 10,009 | 10,756 | 13,633 |
| Depreciation | -4,187 | -4,009 | -4,367 | -4,938 | -5,438 |
| Amortisation EBIT | 4,671 | 4,773 | 5,643 | 5,818 | 8,195 |
| Net interest expense | 304 | 298 | 389 | 406 | 406 |
| Associates & JCEs | 4 | 2 | 0 | 0 | 0 |
| Other income | 945 | -83 | -140 | 300 | 290 |
| Earnings before tax | 5,925 | 4,990 | 5,893 | 6,524 | 8,892 |
| Income tax | -1,587 | -1,282 | -1,546 | -1,827 | -2,490 |
| Net profit after tax | 4,338 | 3,708 | 4,347 | 4,697 | 6,402 |
| Minority interests | -14 | -6 | -18 | -20 | -20 |
| Other items | |||||
| Preferred dividends | |||||
| Normalised NPAT | 4,323 | 3,702 | 4,329 | 4,677 | 6,382 |
| Extraordinary items | |||||
| Reported NPAT | 4,323 | 3,702 | 4,329 | 4,677 | 6,382 |
| Dividends | -2,029 | -1,917 | -2,143 | -2,315 | -3,159 |
| Transfer to reserves | 2,294 | 1,786 | 2,186 | 2,362 | 3,223 |
| Valuations and ratios | |||||
| Reported P/E (x) | 27.5 | 32.1 | 27.5 | 25.4 | 18.6 |
| Normalised P/E (x) | 27.5 | 32.1 | 27.5 | 25.4 | 18.6 |
| FD normalised P/E (x) | 27.5 | 32.1 | 27.5 | 25.4 | 18.6 |
| Dividend yield (%) | 1.7 | 1.6 | 1.8 | 1.9 | 2.7 |
| Price/cashflow (x) | 11.2 | 16.3 | 18.3 | 12.3 | 11.6 |
| Price/book (x) | 4.8 | 4.5 | 4.2 | 3.8 | 3.4 |
| EV/EBITDA (x) | 12.8 | 12.7 | 10.9 | 9.8 | 7.4 |
| EV/EBIT (x) | 24.2 | 23.4 | 19.4 | 18.2 | 12.4 |
| Gross margin (%) | 34.5 | 32.5 | 33.8 | 35.2 | 36.5 |
| EBITDA margin (%) | 38.2 | 35.1 | 36.0 | 39.1 | 40.7 |
| EBIT margin (%) | 20.1 | 19.1 | 20.3 | 21.1 | 24.5 |
| Net margin (%) | 18.6 | 14.8 | 15.6 | 17.0 | 19.1 |
| Effective tax rate (%) | 26.8 | 25.7 | 26.2 | 28.0 | 28.0 |
| Dividend payout (%) | 46.9 | 51.8 | 49.5 | 49.5 | 49.5 |
| ROE (%) | 18.7 | 14.5 | 15.8 | 15.6 | 19.2 |
| ROA (pretax %) | 14.4 | 14.8 | 17.2 | 18.0 | 25.7 |
| Growth (%) | |||||
| Revenue | 7.0 | 7.8 | 11.1 | -0.9 | 21.7 |
| EBITDA | 12.0 | -0.9 | 14.0 | 7.5 | 26.8 |
| Normalised EPS | 40.7 | -14.4 | 16.9 | 8.1 | 36.4 |
| Normalised FDEPS | 40.7 | -14.4 | 16.9 | 8.1 | 36.4 |
Source: Company data, Nomura estimates
Company profile
Genius is the second source in Apple's lenses, and is gaining share in recent years. VR is a new growth engine for the company, with Facebook and Apple being its key VR customers.
Valuation Methodology
Our TP of TWD1,415 is based on 25x 2028F EPS of TWD56.6. Our target P/E of 25x is near the high end of Genius' historical range of 10-30x since 2020. The benchmark index for this stock is TAIEX.
Risks that may impede the achievement of the target price
Downside risks are: 1) worse-than-expected iPhone demand, 2) rising ASP pressure due to competition, 3) worse-than-expected progress in market-share gain in iPhone rear cam lenses, and 4) slower-than-expected penetration into other Android customers.
ESG
The company does not disclose any ESG information. However, based on industry features, we believe Genius is not a labor-intensive corporation and it should not cause severe environmental issues.
Optical communication - an ideal leverage of lens makers' capabilities
Optical interconnect - from MPO to MMC and contact-less fiber connector
Multi-fiber push-on (MPO) is the current standardized physical-contact optical interconnect architecture designed to aggregate high-density ribbon fibers (typically 8, 12, 16, 24 or 32 cores per ferrule) into a single compact interface. MPO connectors leverage precise physical contact enforced by a high mechanical spring force (around 10-20N) and steel guide pins for alignment to achieve ultra-low insertion loss (0.20-0.35dB) across clean fiber end-faces.
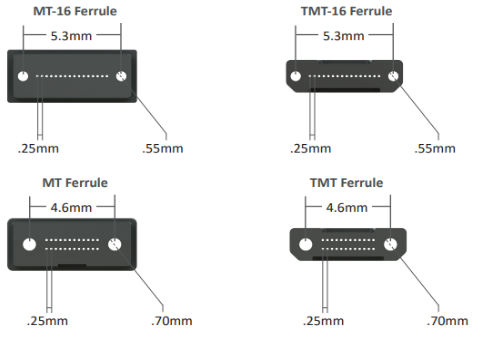
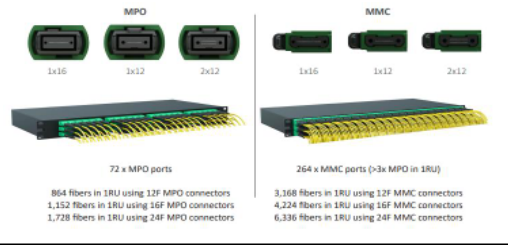
The micro multi-fiber connector (MMC) is another proprietary physical-contact optical interconnect standard beyond MPO developed by US Conec (unlisted) for high-density AI interconnects to directly address the server faceplate and panel space constraints. The MMC introduces a very small form-factor (VSFF) multi-fiber design that utilizes a miniaturized TMT ferrule (patented by US Conec; Fig. 1), and according to US Conec, the width of the TMT ferrule is similar to that of conventional MT ferrule yet with ~30% smaller in thickness and ~50% shorter in length to shrink the physical footprint to roughly one-third the size of an MPO. The spatial reduction consequently unlocks up to a 3x density advantage in patch panel ports and transceiver faceplates compared to standard MPO footprints (Fig. 2). Meanwhile, the MMC delivers a crucial density jump while preserving high optical performance, offering low insertion loss and supporting up to 250um pitch multi-fiber ribbon arrays (including 12-, 16-, 24-, and 32-fiber configurations) to ensure interoperability with MPO ecosystems. The MMC also improves operational serviceability through US Conec's DirectConec push-pull latching mechanism to allow technicians to plus and unplug individual cables even at a highly populated panel without external retraction tools.
Fig. 1: TMT ferrule vs. conventional MT ferrule
Source: US Conec, Nomura research
Although MPO and MMC are the most popular standards of optical fiber connectors nowadays, they both rely on direct physical contact between ferrules and thus require higher spring pressure and precision alignments when connecting the cables. Also, physical contacts leave MPO and MMC's exposed optical interfaces inherently susceptible to wear and tear over repeating mating cycles as well as potential signal degradation from dust and debris contamination (and therefore needs frequent cleaning and inspection).
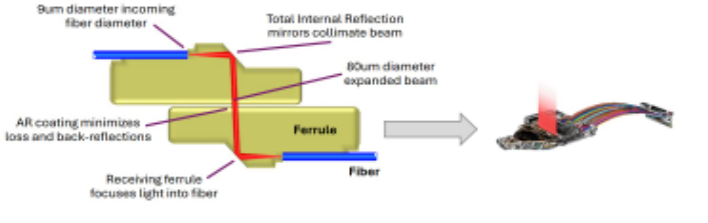
Expanded beam optical (EBO), for example, is an innovative passive fiber connector technology promoted by an industry group 'EBO Multi-Source Agreement Group (EBO MSA)' that could reshape optical interconnect technologies by addressing pre-mentioned challenges of MPO or MMC, since this type of connector replaces traditional physicalcontact end-face matings with non-contact, lens-based beam expansion (Fig. 4). The passive fiber connectorutilizes integrated total internal reflection (TIR) mirrors within precision polymer ferrules. As the light exits an optical fiber core and enters the ferrule, it
Fig. 2: MMC has a smaller footprint than MPO to enable a 3X optical interconnect density
Source: US Conec, Nomura research
strikes the internal TIR mirror that collimates and expands light beams up to 10x their core diameter before travelling through an intentional, tiny air gap to the mating connector. An identical, paired TIR mirror is integrated within the receiving ferrule to capture the expanded beam and focuses it back into the receiving fiber core. According to the EBO MSA, the ferrule is vapor-coated with a special anti-reflection coating that efficiently reduces the reflection of light beams (Fig. 5).
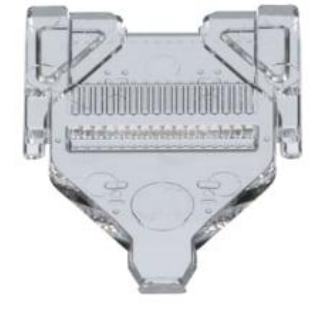
Fig. 3: An EBO ferrule
Source: EBO MSA, Nomura research
Fig. 5: A cross-section illustration of EBO
Modern EBO Technology for data-centers
Source: EBO MSA, Nomura research
Although one of the underlying issues with contact-less passive fiber connector is a higher insertion loss (0.35-0.75dB), the contact-less passive fiber connector system still provides a few advantages compared to traditional physical-contact connectors:
- Physical-contact connectors require frequent inspection and cleaning cycle before mating, while the contact-less connectoris nearly immune to airborne particle contamination thanks to the embedded lens system and no direct surface contacts. An easier handling with reduced maintenance efforts therefore significantly lowers the installation time (as much as by 85%, according to industry statistics) and labor cost. ·
- Contact-less passive fiber connector can ensure consistent signal integrity across thousands of mating cycles due to contact-less designs to avoid face-wear and microscratching. By contrast, physical connectors grind against each other and ultimately lacks long-term durability. ·
- Traditional connectors require precise fiber-to-fiber alignments, whereas the contactless passive fiber connector system can be used in a hermaphroditic condition (socket/connector agnostic) given identical connector at both ends. As such, the risk of installation error is largely eliminated, even without the need for fiber-optic ·
Fig. 4: Connection of two EBO ferrules
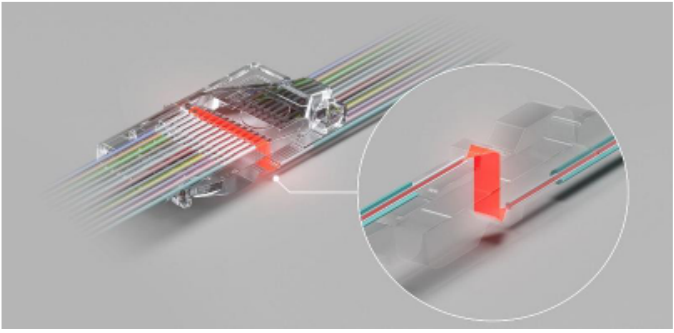
Source: Rosenberger, Nomura research
specialists.
- The contact-less fiber connector only demand a fraction (e.g. one-tenth) of the high spring pressure that compresses glass end-faces together in physical connectors, thereby minimizing mechanical strains on chassis frames. ·
- The contact-less, high density, blind mating, and low spring pressure features make the connector potentially an ideal optical connector for optical back-plane interconnect applications (similar to the function of orthogonal backplane or midplane in nVidia's [NVDA US, Not rated] Kyber architecture), in our view. ·
Fig. 6: EBO ferrule offerings (12F/16F)
| Property | 12 fiber Single mode | 12 fiber Multimode | 16 fiber Single mode | 16 fiber Multimode |
|---|---|---|---|---|
| Operating wavelength | 1310nm | 850nm | 1310nm | 850nm |
| Random mated attentuation (≥97%) | ≤0.7dB | ≤0.3dB | ≤0.75dB | ≤0.3dB |
| Return loss | ≥55dB | ≥35dB | ≥55dB | ≥35dB |
| Operating temperature range | -10°C to +60°C | -10°C to +60°C | -10°C to +60°C | -10°C to +60°C |
Source: EBO MSA, Nomura research
The EBO MSA was established in March 2026 to promote EBO as an open, industry-wide standard for AI cluster infrastructure. The primary objective is to standardize EBO connector mechanical form factors, latching mechanisms, and optical fiber interface dimensions to allow hyperscalers to source interchangeable EBO connectors from multiple vendors rather than relying on one single supplier. According to EBO MSA, there are 9 end-user companies (including Microsoft [MSFT US, Not rated], Meta [META US, Not rated], nVidia, AMD [AMD US, Not rated], etc.) and 48 vendors in the membership by the end of September 2026 (Fig. 7). Members vote on specific connectors to develop and contribute design specifications - there are 18 types under discussion, and four are on the roadmap:
- 128f (8x16f) design specification is underway. ·
- 16f MPO design is under discussion on specification. ·
- 16f VSFF and external laser small form factor pluggable (ELSFP) are planned, and we note that EBO development for ELSFP could be challenging since high-power laser could damage the AR coating and polymer ferrules. ·
Fig. 7: EBO MSA member companies
| End-users | End-users | Vendors | |||
|---|---|---|---|---|---|
| AMD AMD US | 3M | MMM US | Luxglo | Unlisted | |
| Arista ANET US | Accelight | Unlisted | Luxshare | 002475 CH | |
| Cisco CSCO US | Accelink | 002281 CH | Luxvisions | Unlisted | |
| HPE HPE US | ACES Electronics | 3605 TT | Mixx Technologies | Unlisted | |
| Meta META US | AFL Global | Unlisted; subsidiary of Fujikura (5803 JP) | Molex | Unlisted | |
| Microsoft MSFT US | Aperion | Unlisted | O-Net | Unlisted | |
| Nexthop.ai | Unlisted | Amphenol | APH US | Pan-International | 2328 TT |
| nVidia NVDA US | Bellwether | 7861 TT | Rosenberger | Unlisted | |
| Oracle ORCL US | BKS Tech | Unlisted | Samba Photonics | Unlisted | |
| Chant Sincere | 6205 TT | Senko | Unlisted | ||
| Celestica | CLS US | Shijia Photons | 688313 CH | ||
| Credo | CRDO US | Source Photonics | Unlisted; subsidiary of DSBJ (002384 CH) | ||
| Ezconn | 6442 TT | Sterlite | STLTECH IN | ||
| FIT | 6088 HK | Sumitomo | 5802 JP | ||
| Foxconn | 2317 TT | TE Connectivity | TEL US | ||
| Gen Precision | Unlisted | Teradyne | TER US | ||
| Genuine Optics | Unlisted | Terahop | Unlisted; subsidiary of InnoLight (300308 CH) | ||
| Goeroptics | Unlisted; subsidiary of Goertek (002241 CH) | TIME Interconnect | 1729 HK | ||
| HFCL | HFCL IN | TFC Communication | 300394 CH | ||
| Huamai | 603042 CH | viaPhoton | Unlisted | ||
| JPC connectivity | 6197 TT | VSO Electronics | 6913 TT | ||
| Jyh Eng | Unlisted | Xscape Photonics | Unlisted | ||
| Lintes | 6715 TT | Yokogawa | 6841 JP | ||
| Lotes | 3533 TT | Zhaolong Interconnect | 300913 CH |
Source: EBO MSA, Nomura research
Of course, all the key members of EBO MSA are potential users of EBO connectors. But for more concrete industry developments, Microsoft was the first announced hyperscale cloud provider to deploy EBO technology in its Azure cloud (link). Microsoft's early use of EBO technology has shown the potential to reduce network deployment timelines in certain environments. The technology has also demonstrated strong signal performance in live data center conditions, where dust exposure and routine handling are typical during installation and maintenance. The technology will help Microsoft reduce the need for frequent cleaning and inspection while supporting reliable optical performance in dense, high-volume deployment environments.
Meta joined EBO MSA in May 2026, and from our industry checks, we think Meta is likely evaluating the technology for future ASIC mass-volume optical interconnect demand.
Why optical plastic lens companies have advantages in producing ferrules for passive optical connectors?
From MPO to MMC, the fiber density increases to 3x, and we notice that the precision level requirements for MMC TMT ferrules also increase substantially versus MPO MT ferrules. The high precision levels (<5um, or even <3um) of MMC TMT ferrules usually exceed the traditional optical connector makers' plastic injection capability (usually >10um) and traditional connector makers need to invest new, higher precision level tools to deal with those higher precision requirements. However, those precision levels are about the right levels (or even lower-end than) which plastic camera lens makers can do without much new investment in machine tools. This is why we think plastic lens makers have advantage in the advanced passive optical connectors. The reason why we do not see many lens makers enter MMC ferrule market at this moment is because it is a patented technology by US Conec, and US Conec only licenses to limited suppliers, such as Sumitomo (5802 JP, Buy), etc. We estimate the production difficulty and price of passive fiber connector ferrule is around the levels of mid-range handset camera lenses.
Our base assumption for Genius' fiber connector ferrule revenue contribution is about 2-3% for 2027F and 2028F, by assuming an ASP of USD0.5-1 with 20-35mn units annual volume. We assume the GM for this new product to be higher than corporate average.
The upside of fiber connector market will depend on the adoption and penetration of the technology into hyperscalers' AI optical interconnect roadmap. By our estimate, every rack (containing 60-80 units of GPUs or AI ASICs), if adopting fiber connector for optical scale-up for intra-rack or cross-rack interconnect technology, will potentially require 600-1,000 units of fiber connector ferrule components (300-500 pairs). Our base volume assumption for Genius' fiber connector shipments require one major CSP to adopt fiber connector in one major AI platform, plus global sampling, yield loss, trial run demand and necessary inventory buffer. If there are more than one major AI projects adopt fiber connector in 2028F, it will represent potential upside to our forecasts.
CPO opportunities could be bigger than fiber connector ferrule, but less clear at this moment
Compared to fiber connector ferrule, CPO opportunities to Genius remain more uncertain in details, such as what products to offer, what are the business models, and who are intermediate customers and/or end customers. Not to mention, the ramp-up of CPO market itself also has high uncertainties.
We believe Genius is working with FOCI (3363 TT, Not rated) in supplying key components for CPO FAU, such as V groove, prism, and/or fiber array (FA). It is also likely in talk with other FAU makers for various component supply (including lens, V groove, prism, FA, etc.). These FAU makers tend to do FAU final assembly in-house, and hence, may treat Genius as a component supplier to fill its internal capability or outsourcing partners' gap. Genius' flexibility in various component offering for CPO FAU could make it an easier partner for FAU customers, versus Largan (it tends to do more FA or FAU, rather than just components), and may see revenue contribution earlier than Largan. However, we assume USD25-35 ASP for Genius' CPO FAU component offering in our base assumptions, given that it may supply more components rather than doing finished FAU products (ASP USD>100).
In the other side, we also see opportunities for Genius to get FAU module business from customers like Corning (GLW US, Not rated), but the progress of Genius to do such full assembly lines could be slower than Largan, as Genius still relies more on external equipment supply, unlike Largan having strong internal equipment design and manufacturing capability.
We assume CPO FAU to contribute Genius' EPS by <1% in 2027F and 17% in 2028F. For detailed assumptions, please refer to Fig. 10.
Fig. 8: The FAU typically includes optical components such as the V-groove, mirror and optical fibers
Source: TSMC, Nomura research
Fig. 9: Prism/MLA is the mirror directing the beam to PIC
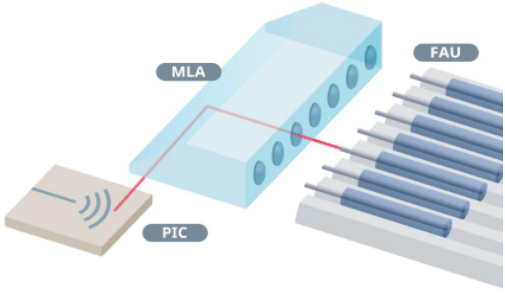
Source: AGC, Nomura research
Fig. 10: Our estimates of CPO market and earnings contribution to Genius
| nVidia | 2027F | 2028F |
|---|---|---|
| Rubin Ultra (mn units) | 2.0 | 10.0 |
| % of NVL576 in total | 70% | 70% |
| % of CPO | 30% | 50% |
| % of NPO | 70% | 50% |
| # of CPO/NPO OE per GPU | 4.8 | 4.8 |
| # of CPO OE (mn units) | 2.0 | 16.8 |
| # of NPO (mn units) | 4.7 | 16.8 |
| Feynman (mn units) | 2.0 | |
| % of NVL576 in total | 70% | |
| % of CPO | 60% | |
| % of NPO | 40% | |
| # of CPO/NPO OE per GPU | 6.8 | |
| # of CPO OE (mn units) | 5.7 | |
| # of NPO (mn units) | 3.8 | |
| Total CPO OE (mn units) | 2.0 | 22.5 |
| nVidia's market share in CPO | 95% | 90% |
| Yield loss, buffer, or inventory for CPO FAU | 60% | 40% |
| Total CPO OE FAU (mn units) | 3.4 | 35.0 |
| Genius' share | 6% | 10% |
| Genius' units (mn units) | 0.2 | 3.5 |
| Genius' ASP (USD) | 25 | 35 |
| Genius' revenue (TWD mn) | 159 | 3,885 |
| Genius' GM % | 40% | 48% |
| EPS contribution to Genius (TWD) | 0.3 | 9.2 |
| CPO contribution % in EPS | 0.7% | 16.8% |
Source: Nomura estimates
Fig. 11: Genius: Earnings forecast revisions
| TWDmn | New forecasts - 2026F | New forecasts - 2027F | New forecasts - 2028F | Previous forecasts - 2026F | Previous forecasts - 2027F | Previous forecasts - 2028F | Change (%) - 2026F | Change (%) - 2027F | Change (%) - 2028F |
|---|---|---|---|---|---|---|---|---|---|
| Revenue | 27,773 | 27,514 | 33,486 | 24,564 | n.a. | n.a. | 13.1 | n.a. | n.a. |
| Gross profit | 9,379 | 9,680 | 12,219 | 8,473 | n.a. | n.a. | 10.7 | n.a. | n.a. |
| Operating profit | 5,643 | 5,818 | 8,195 | 4,929 | n.a. | n.a. | 14.5 | n.a. | n.a. |
| Pretax profit | 5,893 | 6,524 | 8,892 | 5,429 | n.a. | n.a. | 8.5 | n.a. | n.a. |
| Net profit | 4,329 | 4,677 | 6,382 | 3,781 | n.a. | n.a. | 14.5 | n.a. | n.a. |
| EPS (NT$) | 38.4 | 41.5 | 56.6 | 33.5 | n.a. | n.a. | |||
| Margins (%) | |||||||||
| Gross margin | 33.8 | 35.2 | 36.5 | 34.5 | n.a. | n.a. | (0.7) | n.a. | n.a. |
| Operating margin | 20.3 | 21.1 | 24.5 | 20.1 | n.a. | n.a. | 0.2 | n.a. | n.a. |
| Pretax margin | 21.2 | 23.7 | 26.6 | 22.1 | n.a. | n.a. | (0.9) | n.a. | n.a. |
| Net margin | 15.6 | 17.0 | 19.1 | 15.4 | n.a. | n.a. | 0.2 | n.a. | n.a. |
Source: Nomura estimates
Fig. 12: Genius: Quarterly financial forecasts
| (TWD mn) | 1Q25 | 2Q25 | 3Q25 | 4Q25 | 2025 | 1Q26 | 2Q26 | 3Q26F | 4Q26F | 2026F | 1Q27F | 2Q27F | 3Q27F | 4Q27F | 2027F | 2028F |
|---|---|---|---|---|---|---|---|---|---|---|---|---|---|---|---|---|
| Net revenue | 5,321 | 4,776 | 7,740 | 7,152 | 24,989 | 6,141 | 5,682 | 8,013 | 7,936 | 27,773 | 5,094 | 4,945 | 8,509 | 8,965 | 27,514 | 33,486 |
| COGS | 3,709 | 3,354 | 5,099 | 4,702 | 16,864 | 4,080 | 3,798 | 5,272 | 5,244 | 18,394 | 3,317 | 3,233 | 5,487 | 5,796 | 17,834 | 21,267 |
| Gross profit | 1,612 | 1,422 | 2,641 | 2,449 | 8,125 | 2,061 | 1,884 | 2,741 | 2,692 | 9,379 | 1,777 | 1,712 | 3,022 | 3,169 | 9,680 | 12,219 |
| Op expenses | 749 | 792 | 827 | 983 | 3,352 | 860 | 925 | 919 | 1,032 | 3,736 | 880 | 952 | 947 | 1,084 | 3,863 | 4,024 |
| Op profit | 863 | 630 | 1,814 | 1,466 | 4,773 | 1,201 | 960 | 1,822 | 1,660 | 5,643 | 897 | 760 | 2,075 | 2,085 | 5,818 | 8,195 |
| Non-op profit | 301 | (338) | 119 | 135 | 217 | 39 | (142) | 202 | 152 | 250 | 152 | 202 | 202 | 152 | 706 | 696 |
| Pretax profit | 1,164 | 292 | 1,933 | 1,602 | 4,990 | 1,239 | 818 | 2,024 | 1,812 | 5,893 | 1,049 | 961 | 2,277 | 2,237 | 6,524 | 8,892 |
| Net profit | 872 | 240 | 1,414 | 1,176 | 3,702 | 891 | 686 | 1,452 | 1,300 | 4,329 | 750 | 687 | 1,634 | 1,606 | 4,677 | 6,382 |
| EPS (NT$) | 7.74 | 2.13 | 12.54 | 10.43 | 32.84 | 7.90 | 6.09 | 12.88 | 11.53 | 38.39 | 6.66 | 6.09 | 14.50 | 14.24 | 41.49 | 56.61 |
| Operating ratios (%) | ||||||||||||||||
| Gross margin | 30.3% | 29.8% | 34.1% | 34.3% | 32.5% | 33.6% | 33.2% | 34.2% | 33.9% | 33.8% | 34.9% | 34.6% | 35.5% | 35.3% | 35.2% | 36.5% |
| Operating margin | 16.2% | 13.2% | 23.4% | 20.5% | 19.1% | 19.6% | 16.9% | 22.7% | 20.9% | 20.3% | 17.6% | 15.4% | 24.4% | 23.3% | 21.1% | 24.5% |
| Pretax profit margin | 21.9% | 6.1% | 25.0% | 22.4% | 20.0% | 20.2% | 14.4% | 25.3% | 22.8% | 21.2% | 20.6% | 19.4% | 26.8% | 25.0% | 23.7% | 26.6% |
| Net profit margin | 16.4% | 5.0% | 18.3% | 16.4% | 14.8% | 14.5% | 12.1% | 18.1% | 16.4% | 15.6% | 14.7% | 13.9% | 19.2% | 17.9% | 17.0% | 19.1% |
| Year-to-year (%) | ||||||||||||||||
| Net revenue | 2% | -4% | 3% | 31% | 8% | 15% | 19% | 4% | 11% | 11% | -17% | -13% | 6% | 13% | -1% | 22% |
| Gross profit | -14% | -23% | -6% | 66% | 2% | 28% | 33% | 4% | 10% | 15% | -14% | -9% | 10% | 18% | 3% | 26% |
| Operating profit | -23% | -40% | -8% | 187% | 2% | 39% | 52% | 0% | 13% | 18% | -25% | -21% | 14% | 26% | 3% | 41% |
| Pretax profit | -23% | -79% | 2% | 41% | -16% | 7% | 180% | 5% | 13% | 18% | -15% | 18% | 13% | 23% | 11% | 36% |
| Net profit | -20% | -76% | 3% | 37% | -14% | 2% | 186% | 3% | 11% | 17% | -16% | 0% | 13% | 24% | 8% | 36% |
| Qtr-to-Qtr (%) | ||||||||||||||||
| Net revenue | -3% | -10% | 62% | -8% | -14% | -7% | 41% | -1% | -36% | -3% | 72% | 5% | ||||
| Gross profit | 9% | -12% | 86% | -7% | -16% | -9% | 45% | -2% | -34% | -4% | 77% | 5% | ||||
| Operating profit | 69% | -27% | 188% | -19% | -18% | -20% | 90% | -9% | -46% | -15% | 173% | 0% | ||||
| Pretax profit | 2% | -75% | 561% | -17% | -23% | -34% | 148% | -10% | -42% | -8% | 137% | -2% | ||||
| Net profit | 2% | -72% | 489% | -17% | -24% | -23% | 112% | -10% | -42% | -8% | 138% | -2% |
Source: Company data, Nomura estimates
Fig. 13: Genius: P/E bands
Fig. 14: Genius: P/B bands
Source: TEJ, Nomura estimates
Source: TEJ, Nomura estimates
Appendix A-1
This report has been produced by Nomura International (Hong Kong) Ltd., Taipei Branch (NITB), Taiwan.
See Disclaimers for Nomura Group entity details.