完整版說明
本篇 pdf_trim 自動 trim 誤砍 93%(僅剩約 50 行),2026-08-10 ingest 改以 pdf_parse 完整解析版重建「原始內容」,內容截至 Disclosure Section 前三段標準免責聲明(後續為分析師認證與大量法遵揭露表格,不予保留)。
PDF 原檔:報告_MS_香港投資人回饋_20260809_original.pdf
圖片清單(已驗證 2026-08-10)
| 檔名 | size | 分類 | 親眼所見內容 |
|---|---|---|---|
報告_MS_香港投資人回饋_20260809_002.png |
25KB | 真資料圖 | Exhibit 1:2027 年雲端資本支出拆解圓餅圖(記憶體 53%、基礎設施 20%、GPU/ASIC ex.HBM 18%、硬體 7%、Server CPU 2%) |
報告_MS_香港投資人回饋_20260809_004.png |
25KB | 真資料圖 | Exhibit 3:2027 年 GPU/ASIC 總耗電量圓餅圖,單位 GW(NVIDIA 16、Google 9、AMD 7、AWS 2、Microsoft 1、Meta 1,其他 <1) |
報告_MS_香港投資人回饋_20260809_001.png |
66KB | 裝飾·banner | 「Asia Summer School 2026」泳池意象廣告 banner,非資料圖 |
報告_MS_香港投資人回饋_20260809_005.png |
78KB | 真資料圖 | Exhibit 4:2023-2027e 全球 CoWoS 產能需求依主要客戶堆疊長條(單位千片晶圓;NVIDIA/Broadcom/AMD/Xilinx/AWS-Annapurna/AWS-Alchip/Marvell/GUC/MediaTek/Intel Habana/其他,2027e 達約 2,700k 片) |
報告_MS_香港投資人回饋_20260809_003.png |
105KB | 真資料圖 | Exhibit 2:2013-2027E 雲端資本支出長條圖(單位 US$bn),2027E 達 $1,304bn,圖內註記 MSe 較 consensus 高 24% |
報告_MS_香港投資人回饋_20260809_006.png |
108KB | 真資料圖 | Exhibit 7:前 14 大雲端業者資本支出 YoY 成長率折線圖(2014-2027),現行預測 vs 前次預測對比,2026E 97% vs 前次 92%、2027E 29% vs 前次 14% |
原始內容
M August 9, 2026 08:23 PM GMT
Asia-Pacific Technology | Asia Pacific
Connecting Dots: HK investors' feedback on Asian semis
We have done three days of marketing in Hong Kong for Greater China Semis. We offer key observations within and across other tech sectors. We also present analysis of TSMC CoWoS implied power consumption (in GWs) .
Key Takeaways
- Some investors' interests are moving to "volume plays" if "price hike" momentum slows down.
- We recommend TSMC, ASE, ASM Pacific, MediaTek, Aspeed, Hygon, and Montage as our key OWs in Greater China semis.
Key observations:
- The ROIC of AI capex is the most important thing to track for future hardware demand
- While spending continues, how big the "memory cake" should be is a growing debate
- The implied chip volume vs. electricity consumption (GW) was frequently asked about, suggesting that power supply remains a global bottleneck
- Memory currently still attracts more attention than logic/computing semis
- Within memory, we see a split in participation between momentum and value investors
- What are key stocks to own, if investors' focus shifts from pricing hike to volume play?
Key analysis: TSMC CoWoS vs. GW consumption
- How significant is SpaceX's 8GW data center build in 2027?
- Global CSPs kept raising capex during C2Q26 earnings
- AI investments are paying off, according to CSPs' official comments
- What if memory could consume less of future cloud capex?
Idea
Morgan Stanley Taiwan Limited+ Charlie Chan, Equity Analyst, Charlie.Chan@morganstanley.com, +886 2 2730-1725 Morgan Stanley Asia Limited+ Andy Meng, CFA, Equity Analyst, Andy.Meng@morganstanley.com, +852 2239-7689 Derrick Yang, Derrick.Yang@morganstanley.com, +886 2 2730-2862 Howard Kao, Equity Analyst, Howard.Kao@morganstanley.com, Morgan Stanley MUFG Securities Co., Ltd.+, +886 2 2730-2989 Yoshihito Hasegawa, Equity Analyst, Yoshihito.Hasegawa@morganstanleymufg.com, +81 3 6836-8910 Shoji Sato, Equity Analyst, Shoji.Sato@morganstanleymufg.com, Morgan Stanley & Co. International plc+, +81 3 6836-8404 Shawn Kim, Equity Analyst, Shawn.Kim@morganstanley.com, Morgan Stanley Taiwan Limited+, +44 20 7677-1018 Tiffany Yeh, Equity Analyst, Tiffany.Yeh@morganstanley.com, +886 2 7712-3032 Daniel Yen, CFA, Equity Analyst, Daniel.Yen@morganstanley.com, +886 2 2730-2863 Morgan Stanley Asia Limited+ Daisy Dai, CFA, Equity Analyst, Daisy.Dai@morganstanley.com, +852 2848-7310 Ethan Jia, Research Associate, Ethan.Jia@morganstanley.com, +852 3963-2287

Morgan Stanley does and seeks to do business with companies covered in Morgan Stanley Research. As a result, investors should be aware that the firm may have a conflict of interest that could affect the objectivity of Morgan Stanley Research. Investors should consider Morgan Stanley Research as only a single factor in making their investment decision.
For analyst certification and other important disclosures, refer to the Disclosure Section, located at the end of this report.
+= Analysts employed by non-U.S. affiliates are not registered with FINRA, may not be associated persons of the member and may not be subject to FINRA restrictions on communications with a subject company, public appearances and trading securities held by a research analyst account.
M
Key observations on HK investors' positioning and interests
The ROIC of AI capex is the most important thing to track for future hardware demand
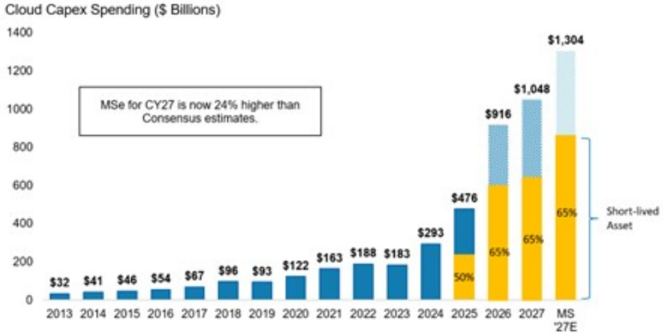
For Greater China Semis, our major underlying assumptions for AI semis come from cloud capex updates (Exhibit 5) and major CSPs' narratives on RoI (Exhibit 2). Some HK investors told us that they are tracking the ARR of LLM vendors, on a quarterly or even monthly basis, to make sure the revenue expansion is fast enough to cover the growing capex costs. We alluded to Brian Nowak's recent research: Internet: The Paths to 25-50% GenAI ROIC (27 Jul 2026). And from the recent rise in cloud capex budgets, AI revenue growth, as well as the positive narratives on CSPs' ROIC, we are not worried about overproduction of AI GPUs and ASICs in 2027 - our assessment of TSMC CoWoS capacity implies a 70%-80% Y/Y increase in chip output in 2027.
While spending continues, how big the "memory cake" should be is a growing debate
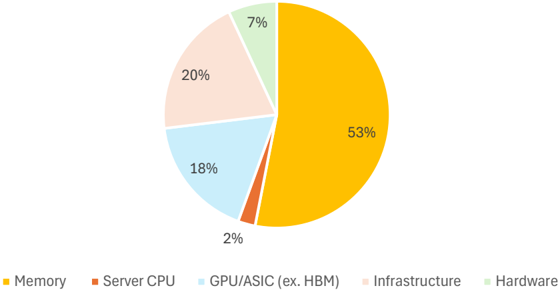
Some investors even believe that if memory's portion of cloud capex budgets shifts to computing and networking chips, AI capex may generate more computing capacity. In our cloud capex 2027 breakdown analysis (Exhibit 5), memory accounts for 53% of the budget of US$1.5tn, while computing (GPUs, ASICs, CPUs) accounts for 20%.
Exhibit 1: 2027 Cloud Capex Breakdown by Using US$1.5 Trillion as the Total Budget (including sovereign AI)
2027 Cloud Capex Breakdown
Source: Morgan Stanley Research estimates
Cloud Capex Spending ($ Billions): 1400/1200/1000/800/600/400/200/- 軸;OCR 殘形:$46 / $32 $41 / $54 $87 / $96 / 503 $122 / $163 / $188 / $183 / $293 / $1,304;年度 2013-2027
M
Exhibit 2: Morgan Stanley cloud capex tracker: we estimate nearly US$1.3tn of cloud capex in 2027 (top 14 listed global CSPs; no sovereign AI)
65% Short-lived
Source: Morgan Stanley Research estimates
The implied chip volume vs. electricity consumption (GW) was frequently asked about, suggesting that power supply remains a global bottleneck
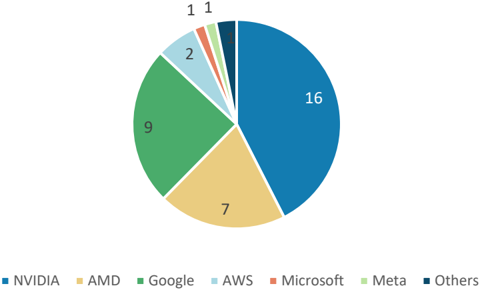
When we showed our 2027 CoWoS implied chip volume (around 19 mn units), investors were concerned about whether there would be sufficient electricity. If each GPU/ASIC's average TDP is 2kw, it would mean that around 38GW of new electricity would be needed. Looking at it the other way around, when SpaceX indicated that it would expand its capacity from 2GW by this year-end, to closer to 10GW as an ambitious target (see SpaceX: Strong Beat/Outlook vs. Higher Capex), we were also asked what that means to TSMC's CoWoS capacity consumption. Of note, Adam Jonas is only modeling in 3 GW of incremental computing - getting to 5 GW by year-end 2027. But just in a rough sense, the additional 8GW would mean around 4mn units of Rubin GPUs or 20% of the AI accelerators that TSMC produces in 2027. See Exhibit 5 and Exhibit 2 for detailed analysis.
Global CoWoS capacity demand by key customer(軸 3,000/1,500/1,000/500,OCR 殘形)
Exhibit 3: 2027 GPU/ASIC chip-implied power consumption - 38GW in total
2027 GPU/ASIC total power consumption (GW)
Source: Morgan Stanley Research estimates
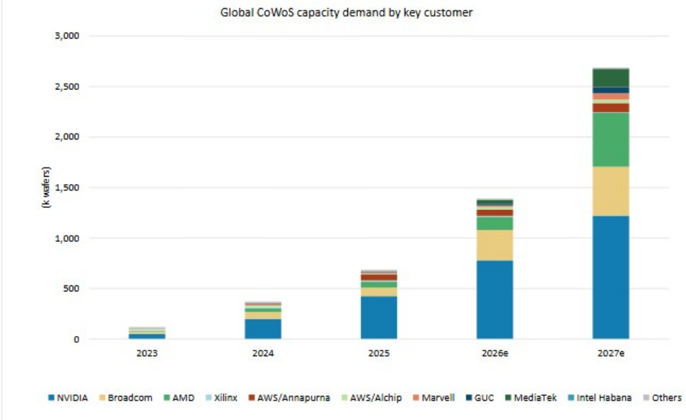
Exhibit 4: Global CoWoS consumption into 2027 - around 2mn units of CoWoS wafers to produce 19mn units of AI GPU/ASIC in 2027
Source: Morgan Stanley Research estimates
Memory currently still attracts more attention than logic/computing semis
HK investors were still more interests in the memory stocks than the logic foundries, such as TSMC, ASE, and MediaTek. We believe it is because of more positioning with more volatility in memory stocks. Some investors even stated a belief that 'if memory stocks don't work, logic foundries like TSMC also can't work.' Historically, the logic semi and memory cycles were indeed concurrent, if they shared the same end demand. However, we can sense that this time around, there are memory-specific debates. For example, by sharing the same AI infrastructure, memory is facing more 'spec change.' For example, we were cross-checked about the Rubin Ultra's HBM spec change and the new Apple iPhone's DRAM density being reduced from 12GB to 9GB. It seems that investors are trying to figure out whether those spec changes have been caused by shortage or customers' intent to save costs.
(圖例 OCR 殘形:2023 NVIDIA / 2024 AWS-Annapurna / 2025 AWS-Alchip / Broadcom / AMD / Xilinx,對應 Exhibit 4 CoWoS 客戶別長條圖圖例)
Within memory, we see a split in participation between momentum and value investors
In our Asian Tech strategist Shawn Kim's report Asia Technology: Memory - A Small Wrinkle (6 Aug 2026), he focused on the memory trade vs. valuation support. 'The sharpest correction in the memory industry to date appears to have ended, shifting focus to buybacks as the next catalyst.' We do think that momentum investors in HK are more conservative on the memory stock price rebound - they are focusing on secondary derivatives (eg. DRAM price Y/Y change), earnings estimate revision breadth, and spot market trend. For example, when we gave our view about potential price moderation in Chinese consumer NAND modules into 4Q26, some investors were concerned that it may affect contract prices in 2027.
However, another camp of memory investors really appreciates the potential cash returns from memory companies. They are willing to use P/E multiples to evaluate the stocks and buy on recent dips.
What are key stocks to own, if investors' focus shifts from pricing hike to volume play?
We are still bullish on commodity semis such as DRAM/NAND and MLCC. However, some momentum investors expect consolidation. Instead, they turned their focus back to volume plays or business models, technology that can also add value or increase the efficiency of AI infrastructure.
Key OWs in logic/compute
- We think TSMC's wafer business and ASE's packaging (along with ABF substrates) are the key concepts of volume plays. Otherwise, we continue to like the ASIC story (saving on budgets if successfully executed) and keep MediaTek as our Top Pick.
- We also pushed the agenetic AI enablers CPU proxies in Greater China semis, including Aspeed (server BMC), Hygon (Chinese CPU), GUC (Google Arm-based CPU), and ASE (AMD server CPU).
Our calls in niche memories
- Within niche memory, we prefer DDR4 DRAM (OW Nanya Tech and Winbond) to NAND module makers (EW Phison and Longsys).
Stocks to avoid
- We also suggest avoiding low-end commodity players that may not be able to hike prices successfully - for example, GWC (EW rated) in raw wafers and Silergy (UW rated) in consumer analog.
M
Key analysis: TSMC CoWoS vs. GW consumption
How significant is SpaceX's 8GW data center build in 2027?
During its earnings call on August 4, SpaceX announced an exclusive commitment to build its future computing capacity on Nvidia's Vera Rubin architecture. The scale is unprecedented: 2 gigawatts (GW) of installed computing by 2026, scaling to around 10 GW by 2027.
If realized, this would represent a substantial expansion in SpaceX's computing footprint and could support increasingly computing-intensive AI workloads across its businesses. The buildout would also create another sizable demand vector for NVIDIA accelerators and the broader AI infrastructure supply chain, including memory, logic wafer supply, networking, power, etc.
If we assume that all of the 8GW of computing will be Vera Rubin in 2027, it would suggest around 400k of CoWoS wafer demand, accounting for close to half of Nvidia Rubin's CoWoS booking in 2027. According to our latest CoWoS forecast, we are expecting around 38GW of computing power to be produced from TSMC, while SpaceX's 8GW plan could account for around 20% of total GPU/ASIC production.
Exhibit 5: Announced power deployment implications for TSMC
| GPU/ASIC Vendor | NVIDIA (Top US AI firm) | AMD (Top US AI firm) | Broadcom | AWS (Top US AI firm) | Nvidia (SpaceX) |
|---|---|---|---|---|---|
| Power Deployed (GW) | 10 | 6 | 3.5 | 2 | 8 |
| Rack name | Vera Rubin NVL144 | Helios | TPU | Trainium3 UltraServers | Vera Rubin NVL144 |
| Power consumption per Rack (kW) | 220 | 220 | 63 | 144 | 220 |
| Rack Number (k units) | 45 | 27 | 56 | 14 | 36 |
| Chip Name | Rubin GPU | MI455 GPU | TPUv7 (Ironwood) / TPUv8i (Sunfish) | Trainium3 (4) | Rubin GPU |
| Chip Volume (k units) | 3,273 | 1,964 | 3,571 | 2,000 | 2,618 |
| Life Cycle for the project (years) | 3 | 3 | 5 | 8 | 1 |
| Implied life-cycle CoWoS Volume (k wafers) | 409 | 166 | 260 | 118 | 409 |
| Implied life-cycle 2/3nm wafer Volume (k wafers) | 260 | 95 | 190 | 107 | 208 |
| 2027 annual CoWoS demand (k wafers) | 136 | 55 | 52 | 15 | 409 |
Source: Company Data, Morgan Stanley Research estimates
Global CSPs kept raising capex during C2Q26 earnings
CSP capex continues to move higher as hyperscalers lean into AI infrastructure buildout amid sustained demand and ongoing capacity constraints. Recent guidance revisions from Amazon, Alphabet, and Meta point to a higher-for-longer investment cycle, while Microsoft's underlying infrastructure spending remains elevated despite accounting-related changes in reported capex.
The key investor debate is increasingly shifting from whether AI demand is real to whether incremental returns can keep pace with the magnitude of capital deployment. For now, management commentary suggests that confidence remains high, with capacity largely being absorbed as it comes online, but the rising spending profile raises the bar for future cloud growth, AI monetization, and free cash flow conversion.
AI investments are paying off, according to CSPs' official comments
(CY27 資本支出彙總表,OCR 表格嚴重錯位無法可靠重建,關鍵數字:Total CY27 Capex 現值 $1,216.1bn(前次 $1,104.3bn,$ 變動 +$167.9bn,較 2026 年初 +129.8%);Total ex-Amazon CY27 Capex 現值 $962.4bn(前次 $872.8bn,較 2026 年初 +58.1%);個別公司 OCR 可辨識片段:Tencent $21.6/$21.5/$15.6bn、Baidu $2.4/$2.3/$1.6bn、CoreWeave $39.9/$39.3/$22.3bn、Nebius $26.4/$26.5/$15.4bn、IREN $6.3/$6.5/$5.3bn、Tesla $22.7/$21.2/$12.2bn、Apple $14.2/$13.7/$15.3bn、IBM $1.5/$1.6/$1.6bn、Oracle $97.4/$92.2/$64.3bn;表格三欄依序為 Current CY27 Capex/CY27 Capex Pre-2Q Earnings/CY26 Capex Beginning of 2026,右側另有 % Change 與 $ Change 欄位,數字因 PDF 表格解析錯位無法逐格對應,僅供參考、不引用個別公司精確值)
During those CSPs' earnings calls, commentary continued to support the view that rising AI capex is increasingly underwritten by visible monetization rather than purely speculative demand. Below are key comments from those CSPs.
Meta: Mark Zuckerberg said 'these AI investments are paying off' in the core ads business. More importantly for the forward ROI debate, he argued that there should be 'a significantly higher margin on selling intelligence rather than selling compute directly. But think that there's a big opportunity obviously to sell compute as well" and "quite optimistic to see meaningful growth in all of these areas."
Google: On the capex/ROI question, CFO Anat Ashkenazi said the objective is to 'invest as long as we see an attractive return on that investment.' CEO Pichai added that Alphabet has become more bullish on the AI opportunity over the past year, citing stronger consumer, enterprise and developer momentum.
Amazon: Amazon disclosed that AWS's AI revenue run-rate is now above US$25bn and growing at triple-digit rates YoY, after rising significantly QoQ. Amazon also said that AI and traditional/core AWS workloads are increasingly reinforcing each other's growth.
Microsoft: CFO Amy Hood said, 'Customer demand continues to exceed available capacity' and that incremental Azure capacity was 'quickly monetized.'
Exhibit 6: Consensus CY27 capex just increased by 70%+ (or ~$500bn) YTD, which makes us believe that as long as the qualitative commentary on cloud spending stays robust, there likely will be further increases in CY27 capex
Source: Company data, FactSet, Morgan Stanley Research. Note: Using 5/13/2025 CRVW estimates for 'beginning of 2025' and 'a year ago' as CRWV went public in March 2025.
Idea
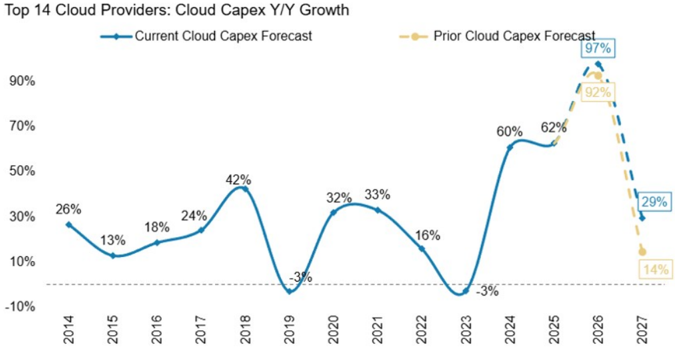
Top 14 Cloud Providers: Cloud Capex Y/Y Growth(Current Cloud Capex Forecast vs. Prior Cloud Capex Forecast,軸 OCR 殘形:42% / 32% 33% / 2020 2021 / 97% / 92% / 16%)
Exhibit 7: Following US hyperscalers' C2Q26 earnings, our cloud capex tracker is now pointing to 29% Y/Y in 2027, up 15 points from the prior forecast of +14% Y/Y about a month ago
Source: Company data, FactSet, Morgan Stanley US Research. Note: Cloud capex includes capex from Alphabet, Amazon, Microsoft, Meta Platforms, Alibaba, Tencent, Baidu, CoreWeave, Nebius, IREN, Tesla, Apple, IBM, and Oracle. We started to include NVIS from 2023, and CRWV/IREN from 2024.
What if memory could consume less of future cloud capex?
Assuming 2027 global cloud capex from major CSPs reaches US$1.5trn, we expect the mix to remain heavily skewed toward memory and accelerated-computing infrastructure, underscoring the increasingly hardware-intensive nature of AI investment. Memory represents the largest component at >50% of total spending in our view, reflecting the growing importance of HBM and other high-bandwidth memory technologies with high ASP driven by severe supply shortage.
GPU/ASIC spending excluding HBM accounts for 15-20%, while infrastructure contributes 20%, highlighting substantial investment in data center buildout, power, cooling, and networking. Although current server CPU exposure remains relatively low, we believe it will also enjoy rapid growth in the following years given strong agentic AI demand.
However, the current capex mix is heavily influenced by elevated memory pricing. If memory prices normalize from current levels, we believe CSPs could reallocate a greater share of budgets toward GPUs/ASICs and server CPUs, allowing the same overall capex envelope to support more computing capacity. In this scenario, lower memory costs could effectively improve the purchasing power of cloud capex and potentially accelerate deployment of incremental AI computing.
M
Disclosure Section
The information and opinions in Morgan Stanley Research were prepared or are disseminated by Morgan Stanley Asia Limited (which accepts the responsibility for its contents) and/or Morgan Stanley Asia (Singapore) Pte. (Registration number 199206298Z) and/or Morgan Stanley Asia (Singapore) Securities Pte Ltd (Registration number 200008434H), regulated by the Monetary Authority of Singapore (which accepts legal responsibility for its contents and should be contacted with respect to any matters arising from, or in connection with, Morgan Stanley Research), and/or Morgan Stanley Taiwan Limited and/or Morgan Stanley & Co International plc, Seoul Branch, and/or Morgan Stanley Australia Limited (A.B.N. 67 003 734 576, holder of Australian financial services license No. 233742, which accepts responsibility for its contents), and/or Morgan Stanley Wealth Management Australia Pty Ltd (A.B.N. 19 009 145 555, holder of Australian financial services license No. 240813, which accepts responsibility for its contents), and/or Morgan Stanley India Company Private Limited having Corporate Identification No (CIN) U22990MH1998PTC115305, regulated by the Securities and Exchange Board of India ('SEBI') and holder of licenses as a Research Analyst (SEBI Registration No. INH000001105); Stock Broker (SEBI Stock Broker Registration No. INZ000244438), Merchant Banker (SEBI Registration No. INM000011203), and depository participant with National Securities Depository Limited (SEBI Registration No. IN-DP-NSDL-567-2021) having registered office at Altimus, Level 39 & 40, Pandurang Budhkar Marg, Worli, Mumbai 400018, India; Telephone no. +91-22-61181000; Compliance Officer Details: Mr. Tejarshi Hardas, Tel. No.: +91-22-61181000 or Email: tejarshi.hardas@morganstanley.com; Grievance officer details: Mr. Tejarshi Hardas, Tel. No.: +91-22-61181000 or Email: msic-compliance@morganstanley.com which accepts the responsibility for its contents and should be contacted with respect to any matters arising from, or in connection with, Morgan Stanley Research, and their affiliates (collectively, "Morgan Stanley"). Morgan Stanley India Company Private Limited (MSICPL) may use AI tools in providing research services. All recommendations contained herein are made by the duly qualified research analysts.
For important disclosures, stock price charts and equity rating histories regarding companies that are the subject of this report, please see the Morgan Stanley Research Disclosure Website at www.morganstanley.com/eqr/disclosures/webapp/generalresearch, or contact your investment representative or Morgan Stanley Research at 1585 Broadway, (Attention: Research Management), New York, NY, 10036 USA.
For valuation methodology and risks associated with any recommendation, rating or price target referenced in this research report, please contact the Client Support Team as follows: US/Canada +1 800 303-2495; Hong Kong +852 2848-5999; Latin America +1 718 754-5444 (U.S.); London +44 (0)20-7425-8169; Singapore +65 6834-6860; Sydney +61 (0)2-9770-1505; Tokyo +81 (0)3-6836-9000. Alternatively you may contact your investment representative or Morgan Stanley Research at 1585 Broadway, (Attention: Research Management), New York, NY 10036 USA.
個股評等索引(節錄,報告涵蓋範圍佐證)
Analyst Industry Coverage 表格節錄本次報告內文明確論及之個股評等(完整覆蓋清單見原檔):TSMC(2330.TW) O(2022-02-07)、ASE(3711.TW) O(2024-09-15)、MediaTek(2454.TW) O(2025-11-28)、Aspeed(5274.TWO) O(2025-06-09)、Nanya Tech(2408.TW) O(2026-05-28)、Winbond(2344.TW) O(2026-05-28)、Phison(8299.TWO) E(2026-02-25)、Silergy(6415.TW) U(2026-05-19)、GlobalWafers(6488.TWO) E(2026-05-19)、Hygon(688041.SS) O(2026-07-03)、Montage(6809.HK/688008.SS) O(2026-03-18)。