PDF 原檔:報告_MS_聯發科2454_20260525_original.pdf
原始內容
MediaTek | Asia Pacific
'Target Price Up' thanks to 2nm TPU volume upside; stay OW
| What's Changed | To | |
|---|---|---|
| Price Target | NT$2,988.00 | NT$5,088.00 |
We expect MediaTek to re-rate further on its strong 2nm TPU design service execution. The stock remains our sector Top Pick.
MediaTek is working closely with Intel to enable the 2nm TPU 'Humufish": On its latest earnings call, MediaTek indicated for the first time that it expects 2nm ASIC to enter mass production by 2027, but investors remained concerned about production volumes in 2028, as Intel's EMIB-T was not proven in a large-scale ASIC project. In our prior report, we assumed a conservative 2028 volume of 1mn units of 2nm TPU, implying ~US$20bn of total AI ASIC revenue. However, our recent industry checks suggest upside for next -gen 2nm TPU, "Humufish", given (1) more ABF substrate capacity, as we believe major EMIB substrate suppliers currently include Ibiden, Unimicron, Shinko, and AT&S, and SEMCO could be added; (2) EMIB yield at Intel foundry is already high (>90%), ie yield improvement from embedding technology/ TGV (Through Glass Via); and (3) the rest of the supply chain is in place, including bumping (PTI, etc.), silicon capacitor (AP Memory/Semco), and silicon bridge die (from Intel's foundry). We now expect at least 2.5mn units of 2nm TPU in 2028, mainly based on Intel EMIB, implying at least US$37bn of total TPU revenue (2.5mn units of 2nm TPU at US$13k ASP, and 1mn units of 3nm TPU at $4.5k ASP).
Beyond 2nm TPU, MediaTek engages in the 1.4nm TPU v10 "Icefish", supporting stronger growth from 2029 onward: Our latest supply chain checks suggest MediaTek is likely to secure another TPU project (potentially v10) beyond the current 2nm TPU. Although the customer may adopt a COT (customer-owned tooling) model with potential dual-foundry supply (TSMC and Samsung foundry), we believe MediaTek could still enjoy strong revenue/earnings growth from 2029. We expect MediaTek's gross margin for the Google TPU to decline from c.40% in 2026, to around 30%-35% in 2029, but operating margin may stay at 25%-30%, accretive to corporate operating margin at around 20%-25%. We therefore raise our intermediate growth rate for MediaTek from 9% to 12%. If MediaTek also started to provide a full-rack turnkey service in 2028, there could be more revenue upside.
Raise PT to NT$5,088: We estimate Google TPU to account for 38% and 63% of MediaTek's revenue in 2027 and 2028, making the stock one of the purest Google TPU plays in Asia Tech. Our new PT of NT$5,088 implies 38x our 2027e EPS and 18x our 2028e EPS. We believe the stock deserves a re-rating, given a strong TPU pipeline with close to 50% revenue CAGR over 2025-28e. We believe the agentic AI replacement cycle may also start in 2027 for high-end Android phones, driven by Gemini Spark - another option value on MediaTek.
| Morgan Stanley Taiwan Limited+ Charlie Chan Equity Analyst Charlie.Chan@morganstanley.com | +886 2 2730-1725 |
|---|---|
| Daniel Yen, CFA Equity Analyst Daniel.Yen@morganstanley.com Morgan Stanley Asia Limited+ | +886 2 2730-2863 |
| Daisy Dai, CFA Equity Analyst Daisy.Dai@morganstanley.com Morgan Stanley Taiwan Limited+ | +852 2848-7310 |
| Tiffany Yeh Equity Analyst Tiffany.Yeh@morganstanley.com Lucas Wang Research Associate | +886 2 7712-3032 |
| Lucas.Wang@morganstanley.com | +886 2 2730-2875 |
MediaTek (2454.TW, 2454 TT)
Top Pick
Greater China Technology Semiconductors | Taiwan
| Stock Rating | Stock Rating | Stock Rating | Overweight | Overweight |
|---|---|---|---|---|
| Industry View | Industry View | Industry View | Attractive | Attractive |
| Price target | Price target | Price target | NT$5,088.00 | NT$5,088.00 |
| Up/downside to price target (%) | Up/downside to price target (%) | Up/downside to price target (%) | 20 | 20 |
| Shr price, close (May 25, 2026) | Shr price, close (May 25, 2026) | Shr price, close (May 25, 2026) | NT$4,245.00 | NT$4,245.00 |
| 52-Week Range | 52-Week Range | 52-Week Range | NT$4,245.00- | NT$4,245.00- |
| 1,130.00 | 1,130.00 | |||
| Sh out, dil, curr (mn) | Sh out, dil, curr (mn) | Sh out, dil, curr (mn) | 1,565 | 1,565 |
| Mkt cap, curr (mn) | Mkt cap, curr (mn) | Mkt cap, curr (mn) | NT$6,644,209 | NT$6,644,209 |
| EV, curr (mn) | EV, curr (mn) | EV, curr (mn) | NT$6,428,680 | NT$6,428,680 |
| Avg daily trading value (mn) | Avg daily trading value (mn) | Avg daily trading value (mn) | NT$14,268 | NT$14,268 |
| Fiscal Year Ending | 12/25 | 12/26e | 12/27e | 12/28e |
| EPS (NT$)** | 62.79 | 70.02 | 133.72 | 280.59 |
| Prior EPS (NT$)** | - | 70.23 | 130.26 | 200.57 |
| EPS (NT$)§ | 66.05 | 65.62 | 117.09 | 193.71 |
| Revenue, net (NT$ bn) | 596.0 | 655.9 | 1,026.4 | 1,920.7 |
| ModelWare net inc (NT | 99.9 | 111.5 | 213.0 | 446.9 |
| $ bn) | ||||
| ROE (%) | 24.7 | 27.3 | 44.4 | 65.9 |
| Div yld (%) | 15.7 | 0.0 | 0.0 | 0.0 |
Unless otherwise noted, all metrics are based on Morgan Stanley ModelWare framework
** = Based on consensus methodology
§ = Consensus data is provided by Refinitiv Estimates e = Morgan Stanley Research estimates
Morgan Stanley does and seeks to do business with companies covered in Morgan Stanley Research. As a result, investors should be aware that the firm may have a conflict of interest that could affect the objectivity of Morgan Stanley Research. Investors should consider Morgan Stanley Research as only a single factor in making their investment decision.
For analyst certification and other important disclosures, refer to the Disclosure Section, located at the end of this report.
+= Analysts employed by non-U.S. affiliates are not registered with FINRA, may not be associated persons of the member and may not be subject to FINRA restrictions on communications with a subject company, public appearances and trading securities held by a research analyst account.
Interposer Size
CoWoS-s
1.5-reticle
'16
CoWos-s
2-reticle
'20
Source: Winway, TSMC
'25
'26
SolC
SolC
more reticles (>12x) if its supply chain execution proceeds well
CoWoS Enables Al Compute Scaling
EMIB Scalability to Support Al Demand
M
SoC
Strong AI ASIC upside in 2028 from 2nm TPU
CoWos-s
3.3-reticle
CoWos-R
1.4-reticle
'23
CoWoS-L/R
3.3-reticle
'24
HEM
HEM
HEM
HERA
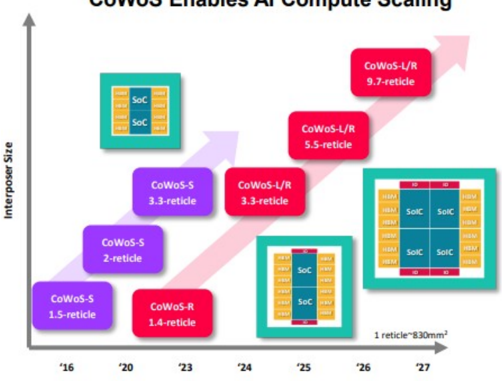
The 2nm TPU will adopt dual sourcing - both TSMC CoWoS -L and Intel EMIB
TSMC's CoWoS (Chip-on-Wafer-on-Substrate) is the industry's leading 2.5D packaging solution, particularly for AI and HPC applications. Its key advantage lies in the use of a high-density interposer or RDL layer, which enables extremely wide, low-latency connections between logic dies and HBM stacks. This makes it well suited for bandwidthintensive workloads such as GPUs and AI accelerators. Source: Intel
Source: TSMC
However, these benefits come at a cost: CoWoS - particularly the silicon interposer/bridge - is expensive, capacity-constrained, and subject to yield challenges, including potential warpage issues at larger chip sizes. Cost and manufacturing complexity remain key tradeoffs. As a result, we see TSMC's CoWoS roadmap supporting only up to ~9.7x reticle size, which does not appear sufficient for future AI or HPC chip designs.
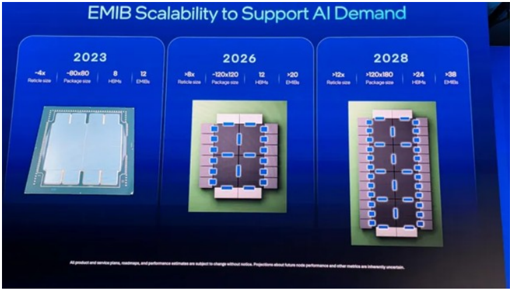
We expect MediaTek to secure a portion of CoWoS capacity for 2nm TPU to ensure minimum volume production, but we believe it will use Intel's (covered by Joseph Moore) EMIB-T as the primary solution to reduce costs and scale volume in 2028, if execution proceeds well.
Exhibit 1: TSMC's roadmap for interposer size
Exhibit 2: Intel's EMIB can easily support larger chips with more reticles (>12x) if its supply chain execution proceeds well
Margin trend and full -rack system support. In response to our question on providing full-rack support during its earnings call (referencing recent Broadcom-Google collaboration), MediaTek indicated it is in discussions with the customer. Management expects any full -rack system design support to materialize after 2027.
On margin trends, management highlighted continued value addition to the customer across both silicon and packaging design. As a result, ASIC should remain accretive to
Source: Intel
2023
2026
-вОкв0
-120k120
12
+20
+12x
2028
>120x180
124
M
operating margins
Google 2nm TPU the major growth driver for MediaTek from 2028
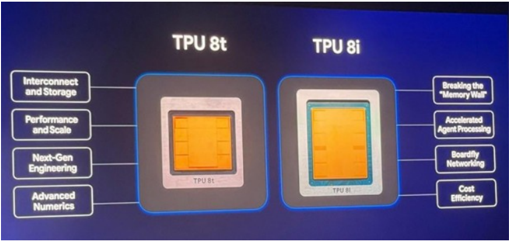
On April 22, Google introduced TPU v8 at Google Cloud Next, featuring two purpose-built architectures for training and inference: TPU 8t and TPU 8i. Our recent supply chain checks across multiple companies on reticle size confirm that MediaTek's 3nm TPU 8 corresponds to TPU 8t. This supports our view that MediaTek's TPU performance should be sufficient for AI training.
According to Google's announcement, 'both chips will be generally available later this year and can be used as part of Google's AI Hypercompute,' in line with MediaTek's guidance that AI ASIC will contribute ~US$2bn of revenue in 2026 (we now assume 450500k units at a US$4,500 ASP).
In addition, our recent checks suggest that ASP for the next-generation 2nm Humufish TPU, supported by MediaTek, could exceed our prior expectations, driven by an increased number of main dies. For Humufish, checks across multiple sources indicate the number of main dies per chip will significantly exceed Zebrafish (one compute die with one I/O die). Combined with a SerDes upgrade and larger packaging size, we estimate ASP at US$1215k (we now model US$13k).
At the gross margin level, management indicated margins vary by project, which may also reflect potential full-rack system support. We model 2nm TPU gross margin at c.35% (vs. c.40% for 3nm TPU) given larger revenue scale, while we still expect operating margin at ~20-25%, above the smartphone BU's 15-20%.
Exhibit 3: Our new supply chain-based Asia Google TPU volume forecasts
| k Units | 2023 | 2024 | 2025e | 2026e | 2027e | 2028e |
|---|---|---|---|---|---|---|
| v5 | 500 | 2,400 | 250 | |||
| v6 (Trillium) | 1,000 | |||||
| v7 (Ironwood, by Broadcom) | 500 | 2,300 | 500 | |||
| v8i (Sunfish; 3nm, by Broadcom) | 900 | 3,000 | 2,500 | |||
| v8t (Zebrafish; 3nm, by MediaTek) | 500 | 2,500 | 1,000 | |||
| v9 (Humufish; 2nm, by MediaTek) | 150 | 2,500 | ||||
| v9a (Merope; 2nm, by US design service) v10 (Icefish; 1.4nm, by MediaTek) | unknown unknown | |||||
| Total | 500 | 2,400 | 1,750 | 3,700 | 6,150 | >6000 |
Source: Morgan Stanley Research (e) estimates
Exhibit 4: Our previous supply chain-based Asia Google TPU volume forecasts
| k Units | 2023 | 2024 | 2025e | 2026e | 2027e | 2028e |
|---|---|---|---|---|---|---|
| v5 | 500 | 2,400 | 250 | |||
| v6 (Trillium) | 1,000 | |||||
| v7 (Ironwood, by Broadcom) | 500 | 2,300 | 500 | |||
| v8i (Sunfish; 3nm, by Broadcom) | 900 | 3,000 | 2,500 | |||
| v8t (Zebrafish; 3nm, by MediaTek) | 500 | 2,500 | 2,000 | |||
| v9 (Pumafish; 2nm, by Broadcom) | 150 | 1,000 | ||||
| v10 (Humufish; 2nm, by MediaTek) | 150 | 1,000 | ||||
| Total | 500 | 2,400 | 1,750 | 3,700 | 6,300 | 6,500 |
Source: Morgan Stanley Research (e) estimates
ruolallu tru or al a yiallue
(vol) yivell ils sillallel Chlp size vs. Dioducoll IrU
Feature
TPU 8t
TPU 8t
TPU 8i
TPU 8i
M
Specialized Chip
Features
SparseCore (Embeddings) & LLM
CAE (Collectives Acceleration
Next-Gen
Exhibit 5: TPU 8t and TPU 8i at a glance
Advanced
Numerics
HBM Capacity
On-Chip SRAM
(Vmem)
Peak FP4 PFLOPs
HBM Bandwidth
CPU Header
| 128 MB | 384 MB | |
|---|---|---|
| 12.6 | 10.1 | |
| 6,528 GB/s Arm Axion | Arm Axion | 8,601 GB/s (~1.3x of TPU 8t) |
Source: Google
Exhibit 7: MediaTek TPU could be used for training purposes (v8t) given its smaller chip size vs. Broadcom TPU
Source: Google
Exhibit 6: Performance of Google TPU by generation
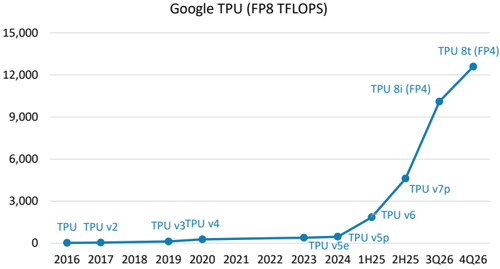
Source: Google, Morgan Stanley Research; Note: TPU prior than TPU v7, performance is based on FP8
M
Android AI agent phones as an emerging trend from Google I/O
Android AI agent phones - a trend to watch: Google is actively rolling out AI agents on Android phones, starting with Galaxy S26 and Pixel 10 in early 2026. These agents can perform multi-step tasks across apps - for example, ordering food, organizing notes, or creating calendar events through direct interaction with app UIs. Over time, we expect broader adoption across the Android ecosystem. Token consumption and cost remain key constraints for agentic AI, and we believe on-device computing on edge devices such as smartphones will help alleviate part of this cost burden.
Google I/O 2026 - Gemini evolves into an Agentic platform: At Google I/O 2026, Google repositioned Gemini from a chatbot to a proactive AI 'personal agent' capable of autonomously handling tasks across apps and services. Google introduced several new technologies, including Gemini Spark - a persistent assistant operating in the background across Workspace tools - Gemini 3.5 Flash for faster real-time interaction, and Gemini Omni for advanced multimodal capabilities spanning text, audio, images, and video. The company also announced AI-driven changes to Google Search and deeper Gemini integration across Android, YouTube, shopping, and future XR devices, signaling a broader push to embed AI as a continuously available assistant that manages workflows and automates user tasks. We believe the agentic AI replacement cycle could start in 2027 from high-end Android phones - another option value on MediaTek.
Exhibit 8: Gemini transforms into 'agentic' platform

Source: Google
M
Earnings estimate revisions and quarterly financials
We raise our earnings estimates 0% for 2026, 3% for 2027, and 40% for 2028: Our increased estimates mostly reflect potential better-than-expected 2nm TPU demand from end-2027 and into 2028.
Exhibit 9: MediaTek: Earnings estimate revisions
| (NT$ mn) | Current New 2026e | Previous Old 2026e | Diff.% | Current New 2027e | Previous Old 2027e | Diff.% | Current New 2028e | Previous Old 2028e | Diff.% |
|---|---|---|---|---|---|---|---|---|---|
| Net sales | 655,906 | 655,906 | 0% | 1,026,353 | 1,007,633 | 2% | 1,920,744 | 1,403,360 | 37% |
| Gross profit | 296,244 | 296,244 | 0% | 434,806 | 427,692 | 2% | 743,875 | 583,753 | 27% |
| Operating profit | 114,462 | 114,475 | 0% | 237,047 | 230,401 | 3% | 513,867 | 362,869 | 42% |
| Pretax income | 130,461 | 130,754 | 0% | 252,047 | 245,401 | 3% | 528,867 | 377,869 | 40% |
| Reported net income | 111,518 | 111,810 | 0% | 212,980 | 207,364 | 3% | 446,892 | 319,299 | 40% |
| Reported basic EPS | 70.02 | 70.23 | 0% | 133.72 | 130.26 | 3% | 280.59 | 200.57 | 40% |
| Reported diluted EPS | 69.94 | 70.12 | 0% | 133.58 | 130.05 | 3% | 280.28 | 200.26 | 40% |
| Margins | |||||||||
| Gross margin | 45.2% | 45.2% | 42.4% | 42.4% | 38.7% | 41.6% | |||
| Operating margin | 17.5% | 17.5% | 23.1% | 22.9% | 26.8% | 25.9% | |||
| Pretax margin | 19.9% | 19.9% | 24.6% | 24.4% | 27.5% | 26.9% | |||
| Net margin | 17.0% | 17.0% | 20.8% | 20.6% | 23.3% | 22.8% |
Source: Morgan Stanley Research (e) estimates
Exhibit 10: MediaTek: Quarterly financials
| (NT$ mn) | 1Q26e | 2Q26e | 3Q26e | 4Q26e | 1Q27e | 2Q27e | 3Q27e | 4Q27e | 2024 | 2025 | 2026e | 2027e | 2028e |
|---|---|---|---|---|---|---|---|---|---|---|---|---|---|
| Total revenues | 149,151 | 142,588 | 148,427 | 215,741 | 211,228 | 227,348 | 272,582 | 315,195 | 530,586 | 595,966 | 655,906 | 1,026,353 | 1,920,744 |
| Q/Q Change | -0.7% | -4.4% | 4.1% | 45.4% | -2.1% | 7.6% | 19.9% | 15.6% | |||||
| Y/Y Change | -2.7% | -5.2% | 4.5% | 43.6% | 41.6% | 59.4% | 83.6% | 46.1% | 22.4% | 12.3% | 10.1% | 56.5% | 87.1% |
| Cost of Sales | 80,095 | 77,309 | 81,242 | 121,016 | 120,564 | 130,356 | 157,794 | 182,832 | 267,200 | 312,886 | 359,662 | 591,547 | 1,176,869 |
| Percent of Revenues | 53.7% | 54.2% | 54.7% | 56.1% | 57.1% | 57.3% | 57.9% | 58.0% | 50.4% | 52.5% | 54.8% | 57.6% | 61.3% |
| Gross Profit | 69,055 | 65,279 | 67,185 | 94,724 | 90,664 | 96,992 | 114,788 | 132,362 | 263,386 | 283,080 | 296,244 | 434,806 | 743,875 |
| Gross Margin | 46.3% | 45.8% | 45.3% | 43.9% | 42.9% | 42.7% | 42.1% | 42.0% | 49.6% | 47.5% | 45.2% | 42.4% | 38.7% |
| Incremental Margin | NM | NM | 33% | 41% | NM | 39% | 39% | 41% | 58% | 30% | 22% | 37% | 35% |
| Total Opex | 46,165 | 44,414 | 44,660 | 46,543 | 47,731 | 48,434 | 50,065 | 51,530 | 160,974 | 179,610 | 181,783 | 197,759 | 230,009 |
| Percent of Revenues | 31.0% | 31.1% | 30.1% | 21.6% | 22.6% | 21.3% | 18.4% | 16.3% | 30.3% | 30.1% | 27.7% | 19.3% | 12.0% |
| R&D | 38,345 | 38,195 | 38,245 | 38,345 | 39,550 | 39,750 | 39,950 | 40,150 | 131,993 | 148,306 | 153,130 | 159,400 | 168,090 |
| Percent of Revenues | 25.7% | 26.8% | 25.8% | 17.8% | 18.7% | 17.5% | 14.7% | 12.7% | 24.9% | 24.9% | 23.3% | 15.5% | 8.8% |
| General & Adm Exp. | 2,805 | 2,655 | 2,705 | 2,805 | 2,900 | 3,000 | 3,300 | 3,500 | 11,891 | 10,856 | 10,969 | 12,700 | 13,900 |
| Percent of Revenues | 1.9% | 1.9% | 1.8% | 1.3% | 1.4% | 1.3% | 1.2% | 1.1% | 2.2% | 1.8% | 1.7% | 1.2% | 0.7% |
| Selling Expenses | 5,015 | 3,565 | 3,711 | 5,394 | 5,281 | 5,684 | 6,815 | 7,880 | 17,090 | 20,448 | 17,684 | 25,659 | 48,019 |
| Percent of Revenues | 3.4% | 2.5% | 2.5% | 2.5% | 2.5% | 2.5% | 2.5% | 2.5% | 3.2% | 3.4% | 2.7% | 2.5% | 2.5% |
| Operating Income | 22,891 | 20,865 | 22,525 | 48,181 | 42,933 | 48,558 | 64,723 | 80,832 | 102,412 | 103,470 | 114,462 | 237,047 | 513,867 |
| Operating Margin | 15.3% | 14.6% | 15.2% | 22.3% | 20.3% | 21.4% | 23.7% | 25.6% | 19.3% | 17.4% | 17.5% | 23.1% | 26.8% |
| Total Non-operating Income (loss) | 3,849 | 4,050 | 4,050 | 4,050 | 3,750 | 3,750 | 3,750 | 3,750 | 17,107 | 16,047 | 15,999 | 15,000 | 15,000 |
| Profit Before Taxes | 26,740 | 24,915 | 26,575 | 52,231 | 46,683 | 52,308 | 68,473 | 84,582 | 119,519 | 119,517 | 130,461 | 252,047 | 528,867 |
| Percent of Revenues | 17.9% | 17.5% | 17.9% | 24.2% | 22.1% | 23.0% | 25.1% | 26.8% | 22.5% | 20.1% | 19.9% | 24.6% | 27.5% |
| Change vs Year Ago | -23% | -25% | 2% | 103% | 75% | 110% | 158% | 62% | 37.7% | 0.0% | 9.2% | 93.2% | 109.8% |
| Taxes | 2,643 | 3,862 | 4,119 | 8,096 | 7,236 | 8,108 | 10,613 | 13,110 | 12,378 | 18,770 | 18,720 | 39,067 | 81,974 |
| Tax Rate | 9.9% | 15.5% | 15.5% | 15.5% | 15.5% | 15.5% | 15.5% | 15.5% | 10.4% | 15.7% | 14.3% | 15.5% | 15.5% |
| Minor interest | 222 | 0 | 0 | 0 | 0 | 0 | 0 | 0 | 754 | 798 | 222 | 0 | 0 |
| Total Net Income to Parent Percent of Revenues | 23,874 | 21,053 | 22,456 | 44,135 | 39,447 18.7% | 44,200 | 57,860 21.2% | 71,472 22.7% | 106,387 20.1% | 99,948 16.8% | 111,518 17.0% | 212,980 20.8% | 446,892 |
| 16.0% | 14.8% | 15.1% | 20.5% | 19.4% | 23.3% | ||||||||
| Change vs Year Ago | -18.6% | -24.4% | 5.4% | 105.5% | 65.2% | 109.9% | 157.7% | 61.9% | 38.2% | -6.1% | 11.6% | 91.0% | 109.8% |
| Reported Basic EPS (NT$, TW GAAP) | 14.99 | 13.22 | 14.10 | 27.71 | 24.77 | 27.75 | 36.33 | 44.88 | 66.93 | 62.79 | 70.02 | 133.72 | 280.59 |
| Reported Diluted EPS (NT$, TW GAAP) | 14.97 | 13.20 | 14.08 | 27.68 | 24.74 | 27.72 | 36.29 | 44.83 | 66.81 | 62.70 | 69.94 | 133.58 | 280.28 |
Source: Company data, Morgan Stanley Research (e) estimates
M
Raising price target from NT$2,988 to NT$5,088
We continue to derive our price target (our base case scenario value) from a residual income model. The price target change reflects our EPS estimate revisions, which are higher in outer years. In addition to raising the intermediate growth rate to 12% (from 9%) given the strong TPU pipeline, our other key valuation assumptions remain unchanged: cost of equity at 9.2% (beta of 1.2, risk-free rate of 2%, and risk premium of 6%) and terminal growth rate of 3.0%.
Our bull and bear case scenario values also rise from NT$4,100 and NT$1,520 to NT $6,988 and NT$2,588, respectively.
Exhibit 11: MediaTek: Residual income model
| (NT$ mn) | 2026e | 2027e | 2028e | 2029e | 2030e | 2031e | 2032e | 2033e | 2034e | 2035e | 2036e | 2037e |
|---|---|---|---|---|---|---|---|---|---|---|---|---|
| Total Equity | 479,581 | 677,987 | 1,029,970 | 1,265,614 | 1,529,536 | 1,825,128 | 2,156,192 | 2,526,983 | 2,942,269 | 3,407,390 | 3,928,325 | 4,511,772 |
| Net Profit | 111,518 | 212,980 | 446,892 | 500,519 | 560,582 | 627,851 | 703,194 | 787,577 | 882,086 | 987,936 | 1,106,489 | 1,239,267 |
| ROAE | 25.1% | 36.8% | 52.3% | 43.6% | 40.1% | 37.4% | 35.3% | 33.6% | 32.3% | 31.1% | 30.2% | 29.4% |
| Residual Income | 65,041 | 132,354 | 292,420 | 354,383 | 391,214 | 431,812 | 476,808 | 526,851 | 582,626 | 644,880 | 714,433 | 792,193 |
| Spread | 15.9% | 27.6% | 43.1% | 34.4% | 30.9% | 28.2% | 26.1% | 24.4% | 23.1% | 21.9% | 21.0% | 20.2% |
| Ending Equity Capital | 479,581 | |||||||||||
| PV of Forecast Period | 2,634,017 | |||||||||||
| PV of Continuing Value | 4,998,363 | |||||||||||
| Equity Value | 8,111,960 | |||||||||||
| No. of Shares | 1,594 | |||||||||||
| Projected Price (NT$) | 5,088 |
Source: Company data, Morgan Stanley Research (e) estimates
M
Relative valuation
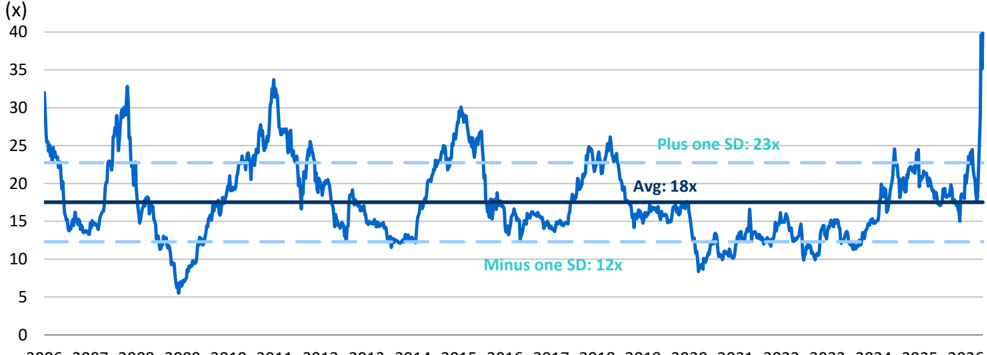
We view the P/E as relatively attractive - even after the share price rally - given strong AI demand. Although MediaTek faces smartphone headwinds in 2026, we believe it is time to look beyond 2026; we think this margin pressure is fully priced in, while TPU upside is not. We believe the stock should trade more than +1SD above its historical average, supported by strong TPU demand. Our new price target of NT$5,088 implies 38x 2027e EPS.
Exhibit 12: MediaTek: One-year forward P/E trend
2006 2007 2008 2009 2010 2011 2012 2013 2014 2015 2016 2017 2018 2019 2020 2021 2022 2023 2024 2025 2026 MediaTek One-year Forward P/E
Source: Company data, FactSet, Morgan Stanley Research
Idea
M
Risk Reward - MediaTek (2454.TW) Risk Reward - MediaTek (2454.TW) Top Pick
AI ASIC demand likely to offset smartphone headwind; Top Pick
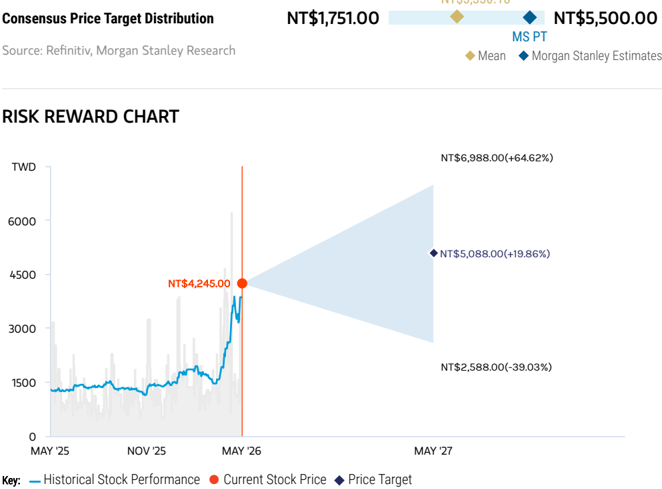
NT$5,088.00 PRICE TARGET
Base case, residual income model. Key assumptions: cost of equity 9.2%, intermediate growth rate 12.0%, terminal growth rate 3.0%.
NT$3,330.18
BASE CASE
38x 2027e EPS
MediaTek maintains around 35-40% overall share in the Chinese smartphone market, with a share of 30-40% in 5G SoC for 2025 (ex-Apple). Besides smartphones, AI ASIC should be the largest focus for the company now. We expect a 40-50% revenue CAGR during 2025-28. Non-smartphone business development stays on track, including IoT, autos, enterprise networking chips, edge AI projects and AI ASIC business.
Source: Refinitiv, Morgan Stanley Research
BULL CASE
52x 2027e EPS
MediaTek receives US licenses for shipments to all Chinese smartphone brands. Emerging market demand recovers to trend-line growth. MediaTek reaches 90% of an enlarged addressable market for 5G Android smartphones in 2027, including share gains in premium smartphone models. Blended ASP rises in 2027. Better business development in IoT, autos, enterprise networking chips, edge AI projects and AI ASIC business, especially on Google TPU demand.
NT$6,988.00
NT$5,088.00
OVERWEIGHT THESIS
- We think MediaTek's gross margin to decline in both 2026 and 2027 as a result of smartphone headwinds and TPU margin dilution, but strong demand from TPU should drive earnings growth.
- Overall AI ASIC demand looks very strong, especially from Google's TPU, which should benefit MediaTek in the coming years.
- The AI smartphone replacement cycle is the key wild card. AI smartphone replacement could be too mild to pass through additional costs in Chinese smartphones.
- Risk-reward is attractive at the current level given strong TPU demand. We believe the stock could re-rate to >35x 2027e P/E, doubling from its 18x historical average since 2006.
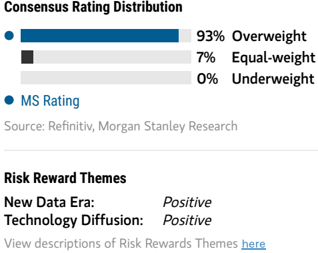
New Data Era: Technology Diffusion:
Positive
Positive
View descriptions of Risk Rewards Themes here
BEAR CASE
19x 2027e EPS
Competitive pressures are worse than expected, with some market share loss, which hurts gross margin. Emerging market smartphone growth stalls. Chinese smartphone chipset vendors show a breakthrough in 5G technologies or foundry supply and start to take more market share in mid-range 5G smartphone SoCs. Slow new business development in ASIC, IoT and automotive, edge AI projects and AI ASIC business.
NT$2,588.00
M
Risk Reward - MediaTek (2454.TW)
KEY EARNINGS INPUTS
| Drivers | 2025 | 2026e | 2027e | 2028e |
|---|---|---|---|---|
| Revenue from 5G Products (NT$, mn) | 291,637 | 276,362 | 301,505 | 341,338 |
| Revenue from Mid-low-end 4G Products (NT$, mn) | 4,854 | 1,189 | 1,137 | 1,186 |
| Revenue from Growing Products (NT$, mn) | 195,335 | 300,325 | 647,565 | 1,498,492 |
| Revenue from Mature Products (NT$, mn) | 34,922 | 32,845 | 32,857 | 32,682 |
INVESTMENT DRIVERS
- Market share in major smartphone brands
- Overall demand from non-smartphone businesses, such as TVs and set-top boxes
- Introduction of new products, such as SoC, smartphones, and tablets
GLOBAL REVENUE EXPOSURE
Source: Morgan Stanley Research Estimate View explanation of regional hierarchies here
MS ALPHA MODELS
3 Month Horizon
Source: Refinitiv, FactSet, Morgan Stanley Research; 1 is the highest favored Quintile and 5 is the least favored Quintile
RISKS TO PT/RATING
RISKS TO UPSIDE
- Edge AI proliferates smartphone replacement cycle.
- Smartphone demand rises in China and other EMs.
- New products attract high demand, resulting in market share gains.
- Google's TPU spurs demand.
RISKS TO DOWNSIDE
- Smartphone demand deteriorates in China and other EMs.
- Competition heats up, resulting in pricing competition.
- New products attract low demand, causing market share loss.
- Margin dilution is more severe.
OWNERSHIP POSITIONING
Inst. Owners, % Active
74%
Source: Refinitiv, Morgan Stanley Research
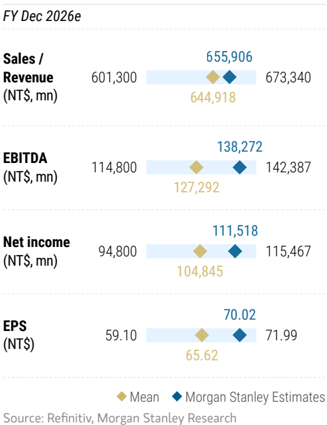
MS ESTIMATES VS. CONSENSUS
M
MediaTek: Financial Summary
Income Statement
| NT$mn (Years End Dec ) | 2024 | 2025 | 2026e | 2027e | 2028e |
|---|---|---|---|---|---|
| Net sales | 530,586 | 595,966 | 655,906 | 1,026,353 | 1,920,744 |
| COGS | (267,200) | (312,886) | (359,662) | (591,547) | (1,176,869) |
| Gross profit | 263,386 | 283,080 | 296,244 | 434,806 | 743,875 |
| Operating expenses | (160,974) | (179,610) | (181,783) | (197,759) | (230,009) |
| Operating income | 102,412 | 103,470 | 114,462 | 237,047 | 513,867 |
| Non-operating income | 17,107 | 16,047 | 15,999 | 15,000 | 15,000 |
| Pre-tax income | 119,519 | 119,517 | 130,461 | 252,047 | 528,867 |
| Income tax | (12,378) | (18,770) | (18,720) | (39,067) | (81,974) |
| Net income (excl. emp. bonus) | 133,925 | 125,933 | 139,676 | 266,225 | 558,615 |
| Employee Bonus Expense | 26,785 | 25,187 | 27,935 | 53,245 | 111,723 |
| Net income (incl. emp. bonus) | 106,387 | 99,948 | 111,518 | 212,980 | 446,892 |
| Adj.wtd.avg.shrs( m) | 1,589 | 1,592 | 1,593 | 1,593 | 1,593 |
| Reported EPS (NT$) | 66.93 | 62.79 | 70.02 | 133.72 | 280.59 |
| Diluted EPS (NT$) | 66.81 | 62.70 | 69.94 | 133.58 | 280.28 |
| EPS for Consensus (NT$) | 66.81 | 62.70 | 69.94 | 133.58 | 280.28 |
Balance Sheet
| NT$mn (Years End Dec ) | 2024 | 2025 | 2026e | 2027e | 2028e |
|---|---|---|---|---|---|
| Cash | 203,696 | 235,290 | 131,087 | 164,701 | 117,688 |
| Mkt Securities | 15,928 | 12,419 | 12,419 | 12,419 | 12,419 |
| AR/NR | 44,713 | 62,121 | 77,978 | 122,019 | 228,349 |
| Inventory | 58,414 | 67,235 | 91,508 | 150,506 | 299,428 |
| Other | 28,274 | 20,392 | 13,520 | 21,156 | 39,592 |
| Current Assets | 351,025 | 397,456 | 326,512 | 470,800 | 697,476 |
| Long-term investments | 169,970 | 168,912 | 168,912 | 168,912 | 168,912 |
| Fixed assets | 56,917 | 60,427 | 65,427 | 70,427 | 75,427 |
| Other assets | 119,955 | 116,990 | 181,821 | 284,511 | 532,442 |
| Total Assets | 697,868 | 743,785 | 742,672 | 994,650 | 1,474,256 |
| S/T borrowings | 940 | 940 | 940 | 940 | 940 |
| AP/NP | 40,777 | 48,710 | 59,763 | 98,294 | 195,555 |
| Other ST liabilities | 225,186 | 253,700 | 171,148 | 186,189 | 216,552 |
| LT debt | 2,681 | 6,795 | 6,795 | 6,795 | 6,795 |
| Other LT liabilities | 23,228 | 24,444 | 24,444 | 24,444 | 24,444 |
| Total Liabilities | 292,812 | 334,590 | 263,091 | 316,663 | 444,287 |
| Common shares | 16,017 | 16,039 | 16,039 | 16,039 | 16,039 |
| Retained earning | 331,543 | 354,139 | 465,657 | 678,637 | 1,125,529 |
| Other shareholders' equity | 57,495 | 39,017 | (2,115) | (16,689) | (111,599) |
| Total Equity | 405,055 | 409,195 | 479,581 | 677,987 | 1,029,970 |
| Total Liab. & Shrhldr's Equity | 697,868 | 743,785 | 742,672 | 994,650 | 1,474,256 |
e = Morgan Stanley Research Estimates
Source: Morgan Stanley Research, Company Data
Cash Flow Statement
| NT$mn (Years End Dec ) | 2024 | 2025 | 2026e | 2027e | 2028e |
|---|---|---|---|---|---|
| Cash flow from Operations | 156,055 | 162,793 | 30,569 | 180,519 | 326,301 |
| Net profits | 106,385 | 99,948 | 111,518 | 212,980 | 446,892 |
| Depreciation | 20,936 | 22,974 | 23,808 | 24,641 | 25,474 |
| Equity investment losses (income) | (517) | (785) | 0 | 0 | 0 |
| Other adjustments | 29,251 | 40,655 | (104,758) | (57,102) | (146,065) |
| Cash flow from Investing | (35,928) | (37,754) | (69,831) | (107,690) | (252,931) |
| Capex | (13,787) | (15,059) | (5,000) | (5,000) | (5,000) |
| Change of LT Investment | (14,226) | (9,851) | 0 | 0 | 0 |
| Change of ST Investment | 283 | (69) | 0 | 0 | 0 |
| Other adjustments | (8,198) | (12,775) | (64,831) | (102,690) | (247,931) |
| Cash flow from financing | (90,119) | (87,675) | (64,940) | (39,215) | (120,384) |
| Increase in L/T debt | 0 | 60 | 50,000 | 50,000 | 50,000 |
| Increase in S/T debt | (1,260) | 0 | 0 | 0 | 0 |
| Cash Dividend Paid | (87,551) | (86,070) | (114,940) | (89,215) | (170,384) |
| Dir& Emp Bonus Paid | 0 | 0 | 0 | 0 | 0 |
| Issuance of stock | 0 | 0 | 0 | 0 | 0 |
| Other adjustments | (1,309) | (1,665) | 0 | 0 | 0 |
| Exchange rate adjustment | 0 | 0 | 0 | 0 | 0 |
| Net change in cash | 30,008 | 37,364 | -104,203 | 33,614 | -47,013 |
Financial Ratios
| 2024 | 2025 | 2026e | 2027e | 2028e | |
|---|---|---|---|---|---|
| Growth(%) | |||||
| Turnover | 22.4 | 12.3 | 10.1 | 56.5 | 87.1 |
| Operating profits | 42.6 | 1.0 | 10.6 | 107.1 | 116.8 |
| Pretax profits | 37.7 | 0.0 | 9.2 | 93.2 | 109.8 |
| Net profits | 38.8 | -6.0 | 10.9 | 90.6 | 109.8 |
| EPS | 38.1 | -6.1 | 11.5 | 91.0 | 109.8 |
| Margins (%) | |||||
| Gross Margin | 49.6 | 47.5 | 45.2 | 42.4 | 38.7 |
| Operating Margin | 19.3 | 17.4 | 17.5 | 23.1 | 26.8 |
| Pretax Margin | 22.5 | 20.1 | 19.9 | 24.6 | 27.5 |
| Net Profit | 20.1 | 16.8 | 17.0 | 20.8 | 23.3 |
| Return (%) | |||||
| ROAA | 16.0 | 13.9 | 15.0 | 24.5 | 36.2 |
| ROAE | 27.3 | 24.5 | 25.1 | 36.8 | 52.3 |
| Gearing (%) | |||||
| Net Debt/Equity | (50.1) | (57.3) | (27.1) | (24.2) | (11.3) |
| Liabilities/Equity | 72.3 | 81.8 | 54.9 | 46.7 | 43.1 |
| Ratios (X) | |||||
| Current ratio | 1.3 | 1.3 | 1.4 | 1.6 | 1.7 |
| Quick ratio | 0.9 | 1.0 | 0.9 | 1.0 | 0.8 |
| Others | |||||
| AR/NR Turnover (days) | 43 | 43 | 43 | 43 | 43 |
| Inventory Turnover (days) | 92 | 92 | 92 | 92 | 92 |
| AP Turnover (days) | 60 | 60 | 60 | 60 | 60 |
| Cash Conversion (days) | 75 | 75 | 75 | 75 | 75 |
M
Risk Reward Reference links
- View explanation of Options Probabilities methodology -Options_Probabilities_Exhibit_Link.pdf
- View descriptions of Risk Rewards Themes - RR_Themes_Exhibit_Link.pdf
-
View explanation of regional hierarchies - GEG_Exhibit_Link.pdf
-
View explanation of Theme/Exposure methodology -
-
ESG_Sustainable_Solutions_External_Link.pdf
-
View explanation of HERS methodology - ESG_HERS_External_Link.pdf
M
Disclosure Section
The information and opinions in Morgan Stanley Research were prepared or are disseminated by Morgan Stanley Asia Limited (which accepts the responsibility for its contents) and/or Morgan Stanley Asia (Singapore) Pte. (Registration number 199206298Z) and/or Morgan Stanley Asia (Singapore) Securities Pte Ltd (Registration number 200008434H), regulated by the Monetary Authority of Singapore (which accepts legal responsibility for its contents and should be contacted with respect to any matters arising from, or in connection with, Morgan Stanley Research), and/or Morgan Stanley Taiwan Limited and/or Morgan Stanley & Co International plc, Seoul Branch, and/or Morgan Stanley Australia Limited (A.B.N. 67 003 734 576, holder of Australian financial services license No. 233742, which accepts responsibility for its contents), and/or Morgan Stanley Wealth Management Australia Pty Ltd (A.B.N. 19 009 145 555, holder of Australian financial services license No. 240813, which accepts responsibility for its contents), and/or Morgan Stanley India Company Private Limited having Corporate Identification No (CIN) U22990MH1998PTC115305, regulated by the Securities and Exchange Board of India ('SEBI') and holder of licenses as a Research Analyst (SEBI Registration No. INH000001105); Stock Broker (SEBI Stock Broker Registration No. INZ000244438), Merchant Banker (SEBI Registration No. INM000011203), and depository participant with National Securities Depository Limited (SEBI Registration No. IN-DP-NSDL-567-2021) having registered office at Altimus, Level 39 & 40, Pandurang Budhkar Marg, Worli, Mumbai 400018, India; Telephone no. +91-22-61181000; Compliance Officer Details: Mr. Tejarshi Hardas, Tel. No.: +91-22-61181000 or Email: tejarshi.hardas@morganstanley.com; Grievance officer details: Mr. Tejarshi Hardas, Tel. No.: +91-22-61181000 or Email: msic-compliance@morganstanley.com which accepts the responsibility for its contents and should be contacted with respect to any matters arising from, or in connection with, Morgan Stanley Research, and their affiliates (collectively, "Morgan Stanley"). Morgan Stanley India Company Private Limited (MSICPL) may use AI tools in providing research services. All recommendations contained herein are made by the duly qualified research analysts.
For important disclosures, stock price charts and equity rating histories regarding companies that are the subject of this report, please see the Morgan Stanley Research Disclosure Website at www.morganstanley.com/eqr/disclosures/webapp/generalresearch, or contact your investment representative or Morgan Stanley Research at 1585 Broadway, (Attention: Research Management), New York, NY, 10036 USA.
For valuation methodology and risks associated with any recommendation, rating or price target referenced in this research report, please contact the Client Support Team as follows: US/Canada +1 800 303-2495; Hong Kong +852 2848-5999; Latin America +1 718 754-5444 (U.S.); London +44 (0)20-7425-8169; Singapore +65 6834-6860; Sydney +61 (0)2-9770-1505; Tokyo +81 (0)3-6836-9000. Alternatively you may contact your investment representative or Morgan Stanley Research at 1585 Broadway, (Attention: Research Management), New York, NY 10036 USA.
圖片清單(已驗證 2026-07-02)
回補驗證:僅涵蓋已被 lib 頁嵌入的圖片,非全量驗證。
| 檔名 | size | 分類 | 親眼所見內容 |
|---|---|---|---|
報告_MS_聯發科2454_20260525_001.png |
146KB | 真資料圖 | 「CoWoS Enables AI Compute Scaling」圖,縱軸 Interposer Size、橫軸年份 '16 至 '27,標示 CoWoS-S/CoWoS-R/CoWoS-L/R 各世代 reticle 倍數演進(1.5-reticle 至 9.7-reticle) |