PDF 原檔:報告_MS_世芯3661_20260813_original.pdf
圖片清單(已驗證 2026-08-14)
| 檔名 | size | 分類 | 親眼所見內容 |
|---|---|---|---|
報告_MS_世芯3661_20260813_001.png |
66KB | 裝飾·banner | "Asia Summer School 2026" 泳池與電子郵件圖示宣傳橫幅 |
報告_MS_世芯3661_20260813_003.png |
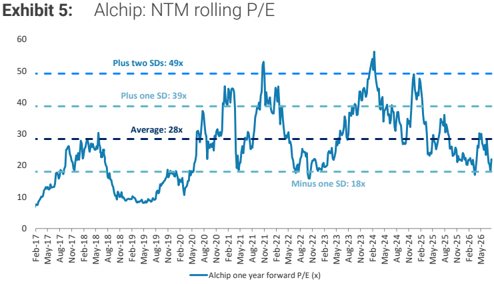
60KB | 真資料圖 | Alchip NTM rolling P/E 走勢圖(2017-2026),標示 +2SD 49x/+1SD 39x/avg 28x/-1SD 18x 四條水平線 |
報告_MS_世芯3661_20260813_004.png |
66KB | 真資料圖 | 左:Consensus Price Target Distribution(NT$3,755-NT$6,542,標示 MS PT/Mean);右:Risk Reward Chart,股價走勢圖搭配 Bull/Base/Bear 目標價 NT$5,950(+46.73%)/NT$5,088(+25.47%)/NT$2,130(-47.47%),現價 NT$4,055 |
報告_MS_世芯3661_20260813_006.png |
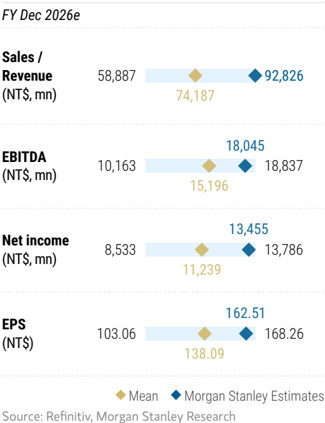
42KB | 真資料圖 | MS Estimates vs. Consensus 圖(FY Dec 2026e):Sales/EBITDA/Net income/EPS 四項 MS 估值 vs 市場均值比較(如 EPS 162.51 vs 138.09) |
報告_MS_世芯3661_20260813_007.png |
82KB | 真資料圖 | Alchip 評等與目標價歷史圖(2023-2026),紅色虛線標示歷次目標價自 2280 逐步上調至 5088,藍線為股價 |
分類只有三類:
真資料圖/裝飾·logo·banner/文字卡。<40KB 未 Read 者免列(預設 logo,本份為_002.png29KB、_005.png15KB)。
原始內容
M August 13, 2026 03:17 AM GMT
Alchip Technologies Ltd | Asia Pacific
2Q26 preview: 3nm Trainium3 ramping nicely, what's next?
We keep our Street-high price target of NT$5,088 to reflect Alchip's strong position in AWS Trainium ASIC design service. Additional project wins at other CSPs would bring our Bull Case into play.
2Q26 results preview: In our Asia AI Summit 2026 Feedback (31 May 2026), the company indicated its 3nm shipments were expected to surge in June and July, with maximum shipments starting in August. Full-year 3nm revenue was guided at US $1.5bn+. We anticipate 3Q revenue to see a >250% Q/Q increase, with margins declining Q/Q to 18% given the Trainium3 turnkey revenue ramp.
Key questions for management at the earnings call on August 14: 1) Any increase in 2027 and 2028 ASIC TAM and Alchip's market share, given strong Trainium demand?; 2) 2nm tape-out appears on track for late 2026, with production and shipments expected for 4Q27. Any schedule change or a revenue gap between Trainium3 and Trainium4?; 3) How will you address competition from Marvell, Qualcomm, GUC, and MediaTek within AI ASIC?; 4) What's the chance to win new projects from other CSPs like Google and Meta?
Trainium4 the major growth driver in the next two years: Alchip continues to design for emerging accounts in the US that are investing heavily in innovative 3and 2-nanometer projects to solve AI infrastructure bottlenecks. We expect Alchip to gradually tape out designs in the chiplets in 4Q27 and 1Q28. Some CPO optical I/ O dies will still be at the engineering stage, and Alchip, as the design service vendor for the compute die, will know the progress of CPO adoption for the Trainium series. Although we believe Trainium4 is still several months from broad availability, our supply chain checks indicate Alchip has had its capacity reserved (suggesting mass production in 4Q27). Against this backdrop, we believe the TAM for Trainium is growing. We now forecast Trainium4 to contribute revenue of US$4bn to Alchip in 2028 (400k units at ASP > US$10k) vs. our previous forecast of 500k units at ASP US$8k.
China AI CPU opportunities: For the China market, at our Asia AI Summit, the company indicated ADAS chip for Li Auto is shipping, and its next-gen iteration is scheduled to tape out in 3Q26. Also, given the strong China AI CPU demand (see Integrated CPU+GPU Compute), we think Alchip can generate >US$100mn in annual revenue from major China Arm-based CPU customers, such as HJ Micro. We believe these China CPUs can be done by TSMC's 5nm nodes. Of note, TSMC and its design service comply with US export control rules, if the China CPU die size is within 300mm square.
Idea
| Morgan Stanley Taiwan Limited+ Charlie Chan Equity Analyst Charlie.Chan@morganstanley.com | +886 2 2730-1725 |
|---|---|
| Daniel Yen, CFA Equity Analyst Daniel.Yen@morganstanley.com | +886 2 2730-2863 |
| Tiffany Yeh Equity Analyst Tiffany.Yeh@morganstanley.com | +886 2 7712-3032 |
| Lucas Wang Research Associate Lucas.Wang@morganstanley.com | +886 2 2730-2875 |

Alchip Technologies Ltd (3661.TW, 3661 TT)
Greater China Technology Semiconductors | Taiwan
| Stock Rating | Overweight | Overweight | ||
|---|---|---|---|---|
| Industry View | Attractive | |||
| Price target | NT$5,088.00 | |||
| Up/downside to price target | (%) | 25 | ||
| Shr price, close (Aug 12, | 2026) | NT$4,055.00 | ||
| 52-Week Range | NT$5,640.00- | |||
| 2,480.00 | 2,480.00 | |||
| Mkt cap, curr (mn) | NT$329,036 | NT$329,036 | ||
| Avg daily trading value (mn) | Avg daily trading value (mn) | NT$7,922 | NT$7,922 | |
| Fiscal Year Ending | 12/25 | 12/26e | 12/27e | 12/28e |
| EPS (NT$)** | 67.68 | 162.51 | 181.22 | 218.27 |
| Prior EPS (NT$)** | - | 151.58 | 180.46 | 218.13 |
| EPS (NT$)§ | 65.78 | 138.09 | 180.95 | 240.97 |
| Revenue, net (NT$ mn) | 30,926 | 92,826 | 134,592 | 165,265 |
| P/E | 51.9 | 25.0 | 22.4 | 18.6 |
Unless otherwise noted, all metrics are based on Morgan Stanley ModelWare framework
- ** = Based on consensus methodology
- § = Consensus data is provided by Refinitiv Estimates
- e = Morgan Stanley Research estimates
Morgan Stanley does and seeks to do business with companies covered in Morgan Stanley Research. As a result, investors should be aware that the firm may have a conflict of interest that could affect the objectivity of Morgan Stanley Research. Investors should consider Morgan Stanley Research as only a single factor in making their investment decision.
For analyst certification and other important disclosures, refer to the Disclosure Section, located at the end of this report.
+= Analysts employed by non-U.S. affiliates are not registered with FINRA, may not be associated persons of the member and may not be subject to FINRA restrictions on communications with a subject company, public appearances and trading securities held by a research analyst account.
M
AlphaSignals Earnings Preview
| Focus KPI | Focus KPI Surprise | Likely impact to consensus EPS* |
|---|---|---|
| Alchip Technologies Ltd 3661.TW 2Q26 Margin and 2H26 Revenue Guidance | In-line | Modest revision higher |
- 2Q26 preliminary revenue rose 82% Q/Q on the Trainium3 production ramp, and management will release the full 2Q26 result on Friday.
- Margins are expected to fall as turnkey mix rises, with 2Q around 30% and 3Q margin seen down to 18% alongside a >250% Q/Q revenue jump.
*Likely impact to consensus EPS is for the next 12 months
Source: Company data, Morgan Stanley Research
M
Alchip's near-term revenue momentum should accelerate in 3Q26 from Trainium3 ramp
Alchip's 2Q26 preliminary revenue was up 82% Q/Q given the Trainium3 production ramp. We expect 2Q26 and 3Q26 margin to decline significantly Q/Q due to higher turnkey revenue share. We therefore expect that 2Q margin was around 30%, similar to consensus. We anticipate 3Q revenue to see a significant increase of >250% Q/Q, with margin declining to 18% given the Trainium3 turnkey revenue ramp.
Exhibit 1: Alchip: 2Q26 earnings and 3Q26 guidance preview
| 2Q26 | 2Q26 | 2Q26 | 2Q26 | 2Q26 | 3Q26 | 3Q26 | 3Q26 | 3Q26 | |
|---|---|---|---|---|---|---|---|---|---|
| (NT$ mn) | Guidance | Prelim. | MSe | Consensus | Diff. | Guidance | Mse | Consensus | Diff. |
| Revenue | Revenue grow Q/Q | 7,640 | 7,640 | 8,945 | -15% | 29,370 | 24,302 | 21% | |
| Q/Q | 82.5% | 113.6% | 284.4% | 171.7% | |||||
| Y/Y | -16.4% | -2.2% | 347.0% | 269.9% | |||||
| GM (%) | 30.0% | 29.8% | 0.2 ppt | 18.0% | 19.5% | -1.5 ppt | |||
| OpM (%) | 19.6% | 20.9% | -1.3 ppt | 14.6% | 15.1% | -0.5 ppt | |||
| Basic EPS (NT$) | 18.33 | 23.13 | -21% | 45.65 | 39.47 | 16% |
Source: Company Data, Morgan Stanley research (e) estimates, Visible Alpha
After several collaboration announcements with AWS, we expect a bigger TAM for Trainium
According to an announcement, a major US AI company and Amazon have expanded collaboration for up to 5 gigawatts of new computing capacity for training and deployment, including new Trainium2 capacity coming online in 1H26 and nearly 1GW of combined Trainium2 and Trainium3 capacity by year-end 2026.
According to the announcement, the commitment spans Graviton and Trainium2 through Trainium4 chips, with an option to buy future generations of Amazon's custom silicon as they become available. On AWS's earnings call, management also said that Trainium3 started shipping at the start of 2026, offering 30-40% better price performance than Trainium2, and it is nearly fully subscribed. Although Trainium4 is still several months from broad availability, our channel checks suggest the capacity has already been reserved (suggesting mass production in 4Q27). Against this backdrop, we believe the TAM for Trainium is growing. We now forecast Trainium4 to contribute revenue of US$4bn to Alchip in 2028 (400k units at ASP US$10k) vs. our previous forecast of 500k units at ASP US$8k.
Exhibit 2: AWS ASIC volume forecast from CoWoS and Morgan Stanley Asia's view
| k Units | 2023 | 2024 | 2025e | 2026e | 2027e | 2028e |
|---|---|---|---|---|---|---|
| Trainium1/Inferentia2 | 300 | 600 | 30 | |||
| Trainium2 | 300 | 1,200 | ||||
| Trainium3 | 85 | 1,700 | 2,380 | - | ||
| Trainium4 | 150 | 2,000 | ||||
| Total | 300 | 900 | 1,315 | 1,700 | 2,530 | 2,000 |
Source: Morgan Stanley Research (e) estimates; Company data
Alchip's 2026 revenue could improve >100% YoY
After a 40% Y/Y decline in 2025 NT$ revenue, we expect Alchip's revenue to rebound strongly in 2026, mostly in 2H26, thanks to the Trainium3 and Li Auto contributions. We continue to expect Trainum3 volume at Alchip to be around 450k with ASP US$4,400 in 2026. We believe other factors could include some Japanese consumer ASIC projects, as
M
well as low production of AI ASIC from US AI start-ups.
Exhibit 3: Our bottom-up assumptions for Alchip's revenue growth
| Revenue (US$ mn) | 2025e | 2026e | 2027e | 2028e | 2025 Y/Y | 2026 Y/Y | 2027 Y/Y | 2028 Y/Y |
|---|---|---|---|---|---|---|---|---|
| NRE | ||||||||
| Total NRE | 321 | 403 | 350 | 373 | -15% | 26% | -13% | 7% |
| Turnkey | ||||||||
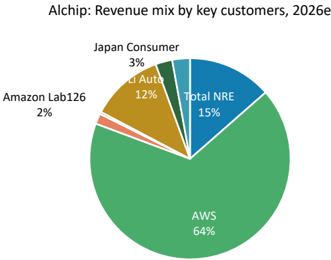
| AWS | 100 | 2,000 | 3,300 | 4,000 | -86% | 1900% | 65% | 21% |
| Intel Habana | 300 | 0 | 0 | 0 | 50% | -100% | NA | NA |
| Amazon Lab126 | 40 | 50 | 50 | 50 | -33% | 25% | 0% | 0% |
| Sony | 20 | 0 | 0 | 0 | -60% | -100% | NA | NA |
| Chinese CPU | 10 | 10 | 10 | 10 | -75% | 0% | 0% | 0% |
| Li Auto | 20 | 350 | 500 | 700 | NA | NA | NA | NA |
| Japan Consumer | 30 | 80 | 100 | 100 | NA | NA | NA | NA |
| Others | 143 | 85 | 68 | 93 | -25% | -41% | -20% | 37% |
| Total turnkey | 663 | 2,575 | 4,028 | 4,953 | -47% | 288% | 56% | 23% |
| Total revenue | 984 | 2,978 | 4,378 | 5,326 | -39% | 203% | 47% | 22% |
| Revenue mix | 2025e | 2026e | 2027e | 2028e |
|---|---|---|---|---|
| NRE | ||||
| Total NRE | 33% | 14% | 8% | 7% |
| Turnkey | ||||
| AWS | 10% | 67% | 75% | 75% |
| Intel Habana | 30% | 0% | 0% | 0% |
| Amazon Lab126 | 4% | 2% | 1% | 1% |
| Sony | 2% | 0% | 0% | 0% |
| Chinese CPU | 1% | 0% | 0% | 0% |
| Li Auto | 2% | 12% | 11% | 13% |
| Japan Consumer | 3% | 3% | 2% | 2% |
| Others | 15% | 3% | 2% | 2% |
| Total turnkey | 67% | 86% | 92% | 93% |
| Total revenue | 100% | 100% | 100% | 100% |
Source: Company data, Morgan Stanley Research (e) estimates
The stock looks attractive on a long-term perspective
Alchip stock is trading at 22x our revised 2027e EPS, vs. its +1SD five-year average of 39x. Our price target implies a target multiple of 28x our 2027e EPS. We think the implied target multiple is justified because:
- We estimate a 2025-28 revenue CAGR of 75%;
- We continue to believe that AI ASICs will outgrow AI GPUs in the coming years; and
- Alchip is one of the few ASIC design service providers that can deal with increasingly complex designs (at 2nm) with good production/design track records for large leading-edge chips.
Exhibit 4: We expect AWS to account for c.65% of Alchip's 2026e revenue
Source: Company data, Morgan Stanley Research (e) estimates
Source: Company data, FactSet, Morgan Stanley Research estimates
M
Alchip: Earnings estimates revision summary
We raise our earnings estimates 7% for 2026 and 0% for 2027/2028 estimates: Our 2026 revenue estimate increase 1% after we factor in 2Q26 preliminary revenue numbers, and our 2026e EPS increase 7% to reflect operating leverage and well-controlled opex. While our 2027/28 numbers remain largely unchanged.
Exhibit 6: Alchip: Earnings estimate revisions
| NT$ mn | New '26E | Old '26E | Diff. | New '27E | Old '27E | Diff. | New '28E | Old '28E | Diff. |
|---|---|---|---|---|---|---|---|---|---|
| Net sales | 92,826 | 92,318 | 1% | 134,592 | 134,592 | 0% | 165,265 | 165,250 | 0% |
| Gross profit | 18,973 | 18,559 | 2% | 23,545 | 23,547 | 0% | 28,549 | 28,546 | 0% |
| Operating profit | 15,301 | 13,954 | 10% | 17,423 | 17,462 | 0% | 21,379 | 21,472 | 0% |
| Pretax Income | 16,817 | 15,590 | 8% | 18,755 | 18,677 | 0% | 22,590 | 22,576 | 0% |
| Net income | 13,455 | 12,550 | 7% | 15,004 | 14,941 | 0% | 18,072 | 18,061 | 0% |
| Reported EPS | 162.51 | 151.58 | 7% | 181.22 | 180.46 | 0% | 218.27 | 218.13 | 0% |
| Margins | |||||||||
| Gross margin | 20.4% | 20.1% | 17.5% | 17.5% | 17.3% | 17.3% | |||
| Operating margin | 16.5% | 15.1% | 12.9% | 13.0% | 12.9% | 13.0% | |||
| Net margin | 14.5% | 13.6% | 11.1% | 11.1% | 10.9% | 10.9% | |||
| Opex% | 4.0% | 5.0% | 4.5% | 4.5% | 4.3% | 4.3% |
Source: Morgan Stanley Research (E) estimates
Exhibit 7: Alchip: Quarterly financials
| (NT$ mn) YE DEC 31 | 1Q25 | 2Q25 | 3Q25 | 4Q25 | 1Q26 | 2Q26E | 3Q26E | 4Q26E | 2023 | 2024 | 2025 | 2026E | 2027E | 2028E |
|---|---|---|---|---|---|---|---|---|---|---|---|---|---|---|
| Total revenues | 10,485 | 9,144 | 6,570 | 4,727 | 4,187 | 7,640 | 29,370 | 51,629 | 30,482 | 51,969 | 30,926 | 92,826 | 134,592 | 165,265 |
| Q/Q Change | -19.8% | -12.8% | -28.2% | -28.0% | -11.4% | 82.5% | 284.4% | 75.8% | ||||||
| Y/Y Change | 0.0% | -32.7% | -55.7% | -63.8% | -60.1% | -16.4% | 347.0% | 992.1% | 122.1% | 70.5% | -40.5% | 200.2% | 45.0% | 22.8% |
| Cost of Sales | 8,056 | 7,257 | 4,729 | 2,730 | 2,086 | 5,348 | 24,084 | 42,336 | 23,687 | 41,768 | 22,772 | 73,854 | 111,047 | 136,715 |
| Percent of Revenues | 76.8% | 79.4% | 72.0% | 57.7% | 49.8% | 70.0% | 82.0% | 82.0% | 77.7% | 80.4% | 73.6% | 79.6% | 82.5% | 82.7% |
| Gross Profit | 2,429 | 1,887 | 1,841 | 1,997 | 2,101 | 2,292 | 5,287 | 9,293 | 6,794 | 10,201 | 8,154 | 18,973 | 23,545 | 28,549 |
| Gross Margin | 23.2% | 20.6% | 28.0% | 42.3% | 50.2% | 30.0% | 18.0% | 18.0% | 22.3% | 19.6% | 26.4% | 20.4% | 17.5% | 17.3% |
| Incremental Margin | NM | NM | NM | NM | NM | 6% | 14% | 18% | 14% | 16% | NM | 17% | 11% | 16% |
| Total Opex | 934 | 737 | 684 | 782 | 733 | 796 | 1,012 | 1,130 | 3,033 | 3,705 | 3,138 | 3,671 | 6,122 | 7,170 |
| Percent of Revenues | 8.9% | 8.1% | 10.4% | 16.6% | 17.5% | 10.4% | 3.4% | 2.2% | 10.0% | 7.1% | 10.1% | 4.0% | 4.5% | 4.3% |
| R&D | 467 | 494 | 453 | 417 | 508 | 558 | 608 | 608 | 1,547 | 2,142 | 1,831 | 2,281 | 3,545 | 3,938 |
| Percent of Revenues | 4.5% | 5.4% | 6.9% | 8.8% | 12.1% | 7.3% | 2.1% | 1.2% | 5.1% | 4.1% | 5.9% | 2.5% | 2.6% | 2.4% |
| General & Adm Exp. | 406 | 157 | 175 | 273 | 164 | 174 | 184 | 264 | 1,237 | 1,286 | 1,011 | 786 | 1,500 | 1,910 |
| Percent of Revenues | 3.9% | 1.7% | 2.7% | 5.8% | 3.9% | 2.3% | 0.6% | 0.5% | 4.1% | 2.5% | 3.3% | 0.8% | 1.1% | 1.2% |
| Selling Expenses | 61 | 86 | 56 | 92 | 61 | 64 | 221 | 258 | 250 | 276 | 295 | 604 | 1,077 | 1,322 |
| Percent of Revenues | 0.6% | 0.9% | 0.9% | 2.0% | 1.5% | 0.8% | 0.8% | 0.5% | 0.8% | 0.5% | 1.0% | 0.7% | 0.8% | 0.8% |
| Operating Income | 1,494 | 1,150 | 1,157 | 1,215 | 1,368 | 1,496 | 4,274 | 8,163 | 3,761 | 6,496 | 5,017 | 15,301 | 17,423 | 21,379 |
| Operating Margin | 14.3% | 12.6% | 17.6% | 25.7% | 32.7% | 19.6% | 14.6% | 15.8% | 12.3% | 12.5% | 16.2% | 16.5% | 12.9% | 12.9% |
| Total Non-operating Income (loss) | 299 | 449 | 433 | 522 | 416 | 366 | 366 | 366 | 436 | 1,312 | 1,703 | 1,515 | 1,332 | 1,211 |
| Profit Before Taxes | 1,793 | 1,599 | 1,591 | 1,737 | 1,784 | 1,862 | 4,641 | 8,530 | 4,198 | 7,808 | 6,720 | 16,817 | 18,755 | 22,590 |
| Percent of Revenues | 17.1% | 17.5% | 24.2% | 36.7% | 42.6% | 24.4% | 15.8% | 16.5% | 13.8% | 15.0% | 21.7% | 18.1% | 13.9% | 13.7% |
| Taxes | 332 | 277 | 265 | 250 | 357 | 373 | 928 | 1,706 | 877 | 1,362 | 1,124 | 3,364 | 3,751 | 4,518 |
| Tax Rate | 18.5% | 17.3% | 16.6% | 14.4% | 20.0% | 20.0% | 20.0% | 20.0% | 20.9% | 17.4% | 16.7% | 20.0% | 20.0% | 20.0% |
| Minor interest | -2 | -1 | -2 | 3 | -1 | -1 | -1 | -1 | -5 | 1 | -2 | -3 | 0 | 0 |
| Total Net Income to Parent | 1,464 | 1,324 | 1,328 | 1,483 | 1,428 | 1,491 | 3,713 | 6,824 | 3,325 | 6,446 | 5,598 | 13,455 | 15,004 | 18,072 |
| Percent of Revenues Y/Y change | 14.0% 19.0% | 14.5% -16.6% | 20.2% -25.9% | 31.4% -19.2% | 34.1% -2.4% | 19.5% 12.6% | 12.6% | 13.2% | 10.9% 81.3% | 12.4% 93.8% | 18.1% -13.1% | 14.5% 140.3% | 11.1% 11.5% | 10.9% 20.4% |
| Diluted EPS (NT$) | 17.69 | 16.02 | 16.04 | 17.92 | 17.25 | 18.00 | 179.6% | 360.0% | 43.27 | 79.05 | 67.68 | 162.51 | 181.22 | 218.27 |
| Reported Basic EPS (NT$, TW GAAP) | 18.13 | 16.37 | 16.40 | 18.33 | 17.55 | 18.33 | 44.84 45.65 | 82.42 83.89 | 45.42 | 81.51 | 69.22 | 165.42 | 184.46 | 222.18 |
Source: Company data, Morgan Stanley Research (E) estimates
M
Alchip: Valuation methodology
Price target unchanged at NT$5,088: We continue to derive our base case value, which is also our price target, from a residual income model. All of our key assumptions are unchanged, including cost of equity of 10.4% (beta of 1.4, equity risk premium of 6.0%, and risk-free rate of 2.0%), intermediate growth rate of 16%, and terminal growth rate of 5.0%.
Our bear case value of NT$2,130 and bull case value of NT$5,950 also remain unchanged.
Exhibit 8: Alchip: Residual income model
| NT$ million | 2026E | 2027E | 2028E | 2029E | 2030E | 2031E | 2032E | 2033E | 2034E | 2035E | 2036E | 2037E |
|---|---|---|---|---|---|---|---|---|---|---|---|---|
| Total Equity | 40,824 | 50,448 | 56,199 | 67,135 | 79,820 | 94,536 | 111,605 | 131,406 | 154,374 | 181,018 | 211,925 | 247,776 |
| Net Profit | 13,455 | 15,004 | 18,072 | 20,964 | 24,318 | 28,209 | 32,722 | 37,958 | 44,031 | 51,076 | 59,248 | 68,728 |
| ROAE | 33.5% | 32.9% | 33.9% | 34.0% | 33.1% | 32.4% | 31.7% | 31.2% | 30.8% | 30.5% | 30.2% | 29.9% |
| Residual Income | 9,124 | 9,176 | 11,851 | 13,260 | 15,237 | 17,527 | 20,181 | 23,258 | 26,826 | 30,963 | 35,762 | 41,327 |
| Spread | 23.1% | 22.5% | 23.5% | 23.6% | 22.7% | 22.0% | 21.3% | 20.8% | 20.4% | 20.1% | 19.8% | 19.5% |
| Ending Equity Capital | 40,824 | |||||||||||
| PV of Forecast Period | 109,777 | |||||||||||
| PV of Continuing Value | 270,629 | |||||||||||
| Equity Value | 421,230 | |||||||||||
| No. of Shares | 83 | |||||||||||
| Projected Price | 5,088 |
Source: Morgan Stanley Research (E) estimates
M
Risk Reward - Alchip Technologies Ltd (3661.TW) Risk Reward - Alchip Technologies Ltd (3661.TW)
AI ASIC project demand remains strong in 2026-28
NT$5,088.00 PRICE TARGET
Base case value, derived from a residual income model. We assume the cost of equity is constant at 10.4% (2% risk-free rate, 6% risk premium, 1.4 beta). Our intermediate growth rate and terminal growth rates are 16% and 5%, respectively.
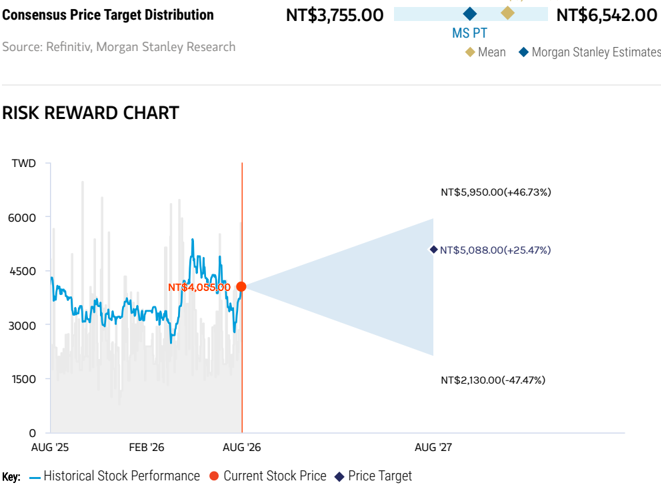
NT$5,772.33
Morgan Stanley Estimates
Mean
Consensus Price Target Distribution
NT$3,755.00
NT$6,542.00
Source: Refinitiv, Morgan Stanley Research
MS PT
Source: Refinitiv, Morgan Stanley Research
BULL CASE
33x 2027e EPS
AI chipsets and HPC projects start to proliferate, amid substantial end demand.
Alchip's leading-edge tape-out numbers increase significantly, with some high-profile project wins at 3nm or even 2nm. Alchip is able to secure enough foundry capacity (front-end wafers and back-end packaging) and substrates for all of its leading-edge turnkey production. Alchip gradually gains market share within the design service market, amid continued proliferation of custom chip demand.
NT$5,950.00
BASE CASE
28x 2027e EPS
AI chipsets and HPC projects start to proliferate amid strong end demand, resulting in steady growth in tape-outs and volume. There might be a slowdown in Alchip's Chinese customers' design activity for leading-edge chips as a result of US export controls; we believe this would be largely offset by ASIC demand strength from non-China regions.
NT$5,088.00
OVERWEIGHT THESIS
- We continue to believe that AI ASICs will outgrow AI GPUs in the coming years, and Alchip is one of the few ASIC design service providers that can deal with increasingly complex designs (at 2nm) with good production/design track records for large leading edge chips.
- AWS's announcement of its 3nm Trainium3 chip matches the timing of Alchip's 3nm project win. The growing number of use cases for Trainium (e.g., Apple's adoption) bodes well for Alchip's revenue growth in 2026.
- We believe Alchip has strong potential to win Trainium4.
- Our price target implies 28x our 2027e EPS, which we find undemanding vs. our >70% revenue CAGR for 2025-28e.
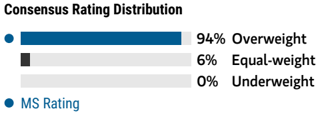
Source: Refinitiv, Morgan Stanley Research
Risk Reward Themes
New Data Era: Secular Growth:
Positive Positive
View descriptions of Risk Rewards Themes here
BEAR CASE
12x 2027e EPS
AI chipsets and HPC projects lack concrete end demand, resulting in delayed tape-outs and mass production. Alchip's leading-edge project pipeline deteriorates, or some customers turn directly to TSMC. AI GPU's dominance in AI computing compresses the market share gain potential for overall ASIC, with customers starting to slow their custom silicon developments - and therefore ASIC procurement plans.
NT$2,130.00
M
Risk Reward - Alchip Technologies Ltd (3661.TW)
KEY EARNINGS INPUTS
| Drivers | Dec 2025 | Dec 2026e | Dec 2027e | Dec 2028e |
|---|---|---|---|---|
| HPC revenue (NT$, mn) | 25,816 | 62,194 | 90,177 | 110,727 |
| Networking revenue (NT$, mn) | 698 | 6,498 | 9,421 | 11,569 |
INVESTMENT DRIVERS
- New promising AI chipset entrants
- NRE revenue growth
- Faster migration of semi industry to 7nm
GLOBAL REVENUE EXPOSURE
Source: Morgan Stanley Research Estimate View explanation of regional hierarchies here
MS ALPHA MODELS
3/5 MOST
3 Month
Horizon
Source: Refinitiv, FactSet, Morgan Stanley Research; 1 is the highest favored Quintile and 5 is the least favored Quintile
RISKS TO PT/RATING
RISKS TO UPSIDE
- Demand for Chinese GPUs and AI chipsets takes off earlier than expected.
- NRE demand accelerates.
- Alchip wins more US hyperscaler HPC projects.
RISKS TO DOWNSIDE
- China's HPC localization progress slows down.
- AI chipset progress is much slower to develop.
- NRE demand decelerates.
- Pricing competition intensifies.
OWNERSHIP POSITIONING
Inst. Owners, % Active
62.7%
Source: Refinitiv, Morgan Stanley Research
MS ESTIMATES VS. CONSENSUS
M
M
Alchip: Financial summary
Income Statement
| NT$mn (Years End Dec ) | 2024 | 2025 | 2026E | 2027E | 2028E |
|---|---|---|---|---|---|
| Net sales | 51,969 | 30,926 | 92,826 | 134,592 | 165,265 |
| COGS | (41,768) | (22,772) | (73,854) | (111,047) | (136,715) |
| Gross profit | 10,201 | 8,154 | 18,973 | 23,545 | 28,549 |
| Operating expenses | (3,705) | (3,138) | (3,671) | (6,122) | (7,170) |
| Operating income | 6,496 | 5,017 | 15,301 | 17,423 | 21,379 |
| Non-operating income | 1,312 | 1,703 | 1,515 | 1,332 | 1,211 |
| Pre-tax income | 7,808 | 6,720 | 16,817 | 18,755 | 22,590 |
| Income tax | 1,362 | 1,124 | 3,364 | 3,751 | 4,518 |
| Minority Interest | 1 | (2) | (3) | 0 | 0 |
| Reported net Income | 6,446 | 5,598 | 13,455 | 15,004 | 18,072 |
| Adj.wtd.avg.shrs( m) | 79 | 81 | 81 | 81 | 81 |
| Reported EPS (NT$) | 79.05 | 67.68 | 162.51 | 181.22 | 218.27 |
| Modelware EPS (NT$) | 79.05 | 67.68 | 162.51 | 181.22 | 218.27 |
Balance Sheet
| NT$mn (Years End Dec ) | 2024 | 2025 | 2026E | 2027E | 2028E |
|---|---|---|---|---|---|
| Cash | 27,044 | 32,627 | 17,979 | 8,197 | 4,970 |
| Mkt Securities | 16 | 163 | 163 | 163 | 163 |
| AR/NR | 5,730 | 3,011 | 13,118 | 19,020 | 23,354 |
| Inventory | 8,661 | 6,945 | 25,307 | 38,052 | 46,847 |
| Other | 4,733 | 10,311 | 10,311 | 10,311 | 10,311 |
| Current Assets | 46,184 | 53,057 | 66,877 | 75,742 | 85,645 |
| Long-term investments | 1,600 | 2,204 | 2,204 | 2,204 | 2,204 |
| Fixed assets | 1,775 | 1,680 | 1,680 | 1,680 | 1,680 |
| Deffered assets | 169 | 440 | 440 | 440 | 440 |
| Other assets | 582 | 659 | 659 | 659 | 659 |
| Total Assets | 50,309 | 58,039 | 71,859 | 80,724 | 90,627 |
| S/T borrowings | 0 | 0 | 0 | 0 | 0 |
| AP/NP | 1,826 | 1,986 | 6,183 | 9,297 | 11,446 |
| Other ST liabilities | 8,845 | 14,988 | 14,988 | 14,988 | 14,988 |
| LT debt | 0 | 0 | 0 | 0 | 0 |
| Other LT liabilities | 161 | 240 | 240 | 240 | 240 |
| Common shares | 806 | 813 | 813 | 813 | 813 |
| Total Liabilities | 10,833 | 17,214 | 21,411 | 24,525 | 26,674 |
| Additional capital | 25,350 | 25,755 | 25,755 | 25,755 | 25,755 |
| Retained earning | 10,752 | 13,405 | 23,029 | 28,780 | 36,534 |
| Other shareholders' equity | 2,568 | 852 | 852 | 852 | 852 |
| Total Equity | 39,477 | 40,824 | 50,448 | 56,199 | 63,953 |
| Total Liab. & Shrhldr's Equity | 50,309 | 58,039 | 71,859 | 80,724 | 90,627 |
E = Morgan Stanley Research Estimates
Source: Morgan Stanley Research, Company Data
Cash Flow Statement
| NT$mn (Years End Dec ) | 2024 | 2025 | 2026E | 2027E | 2028E |
|---|---|---|---|---|---|
| Cashflow from Operations | 3,358 | 15,272 | (8,073) | 2,215 | 9,835 |
| Net profits | 6,446 | 5,598 | 13,455 | 15,004 | 18,072 |
| Depreciation | 2,129 | 2,744 | 2,744 | 2,744 | 2,744 |
| Working Capital Change | (869) | 4,741 | (24,272) | (15,533) | (10,981) |
| Other adjustments | (4,348) | 2,189 | 0 | 0 | 0 |
| Cashflow from Investing | (676) | (5,828) | (2,744) | (2,744) | (2,744) |
| Capex | (1,998) | (2,287) | (2,744) | (2,744) | (2,744) |
| Change of LT Investment | 1,748 | (3,701) | 0 | 0 | 0 |
| Change of ST Investment | (953) | (929) | 0 | 0 | 0 |
| Other adjustments | 527 | 1,089 | 0 | 0 | 0 |
| Cashflow from financing | 12,855 | (2,653) | (3,831) | (9,253) | (10,318) |
| Increase in L/T debt | 0 | 0 | 0 | 0 | 0 |
| Increase in S/T debt | 0 | 0 | 0 | 0 | 0 |
| Cash Dividend Paid | (1,818) | (2,946) | (3,831) | (9,253) | (10,318) |
| Issuance of stock | 0 | 0 | 0 | 0 | 0 |
| Other adjustments | 14,673 | 293 | 0 | 0 | 0 |
| Exchange rate adjustment | 1,348 | (1,208) | 0 | 0 | 0 |
| Net change in cash | 16,885 | 5,583 | -14,648 | -9,782 | -3,227 |
Financial Ratios
| 2024 | 2025 | 2026E | 2027E | 2028E | |
|---|---|---|---|---|---|
| Growth(%) | |||||
| Turnover | 70.5 | -40.5 | 200.2 | 45.0 | 22.8 |
| Operating profits | 72.7 | -22.8 | 205.0 | 13.9 | 22.7 |
| Pretax profits | 86.0 | -13.9 | 150.2 | 11.5 | 20.4 |
| Net profits | 93.8 | -13.1 | 140.3 | 11.5 | 20.4 |
| EPS | 82.7 | -14.4 | 140.1 | 11.5 | 20.4 |
| Margins (%) | |||||
| Gross Margin | 19.6 | 26.4 | 20.4 | 17.5 | 17.3 |
| Operating Margin | 12.5 | 16.2 | 16.5 | 12.9 | 12.9 |
| Pretax Margin | 15.0 | 21.7 | 18.1 | 13.9 | 13.7 |
| Net Profit | 12.4 | 18.1 | 14.5 | 11.1 | 10.9 |
| Return (%) | |||||
| ROAE | 22.4 | 13.9 | 29.5 | 28.1 | 30.1 |
| ROAA | 15.6 | 10.3 | 20.7 | 19.7 | 21.1 |
| Gearing (%) | |||||
| Net Debt/Equity | (68.5) | (79.9) | (35.6) | (14.6) | (7.8) |
| Liabilities/Equity | 27.4 | 42.2 | 42.4 | 43.6 | 41.7 |
| Ratios (X) | |||||
| Current ratio | 4.3 | 3.1 | 3.2 | 3.1 | 3.2 |
| Quick ratio | 3.1 | 2.1 | 1.5 | 1.1 | 1.1 |
| Others | |||||
| AR/NR Turnover (days) | 29 | 52 | 52 | 52 | 52 |
| Inventory Turnover (days) | 89 | 125 | 125 | 125 | 125 |
| AP Turnover (days) | 16 | 31 | 31 | 31 | 31 |
| Cash Conversion (days) | 101 | 146 | 146 | 146 | 146 |
M
Risk Reward Reference links
- View explanation of Options Probabilities methodology -Options_Probabilities_Exhibit_Link.pdf
- View descriptions of Risk Rewards Themes - RR_Themes_Exhibit_Link.pdf
- View explanation of regional hierarchies - GEG_Exhibit_Link.pdf
- View explanation of Theme/Exposure methodology -ESG_Sustainable_Solutions_External_Link.pdf
- View explanation of HERS methodology - ESG_HERS_External_Link.pdf
M
Disclosure Section
The information and opinions in Morgan Stanley Research were prepared or are disseminated by Morgan Stanley Asia Limited (which accepts the responsibility for its contents) and/or Morgan Stanley Asia (Singapore) Pte. (Registration number 199206298Z) and/or Morgan Stanley Asia (Singapore) Securities Pte Ltd (Registration number 200008434H), regulated by the Monetary Authority of Singapore (which accepts legal responsibility for its contents and should be contacted with respect to any matters arising from, or in connection with, Morgan Stanley Research), and/or Morgan Stanley Taiwan Limited and/or Morgan Stanley & Co International plc, Seoul Branch, and/or Morgan Stanley Australia Limited (A.B.N. 67 003 734 576, holder of Australian financial services license No. 233742, which accepts responsibility for its contents), and/or Morgan Stanley Wealth Management Australia Pty Ltd (A.B.N. 19 009 145 555, holder of Australian financial services license No. 240813, which accepts responsibility for its contents), and/or Morgan Stanley India Company Private Limited having Corporate Identification No (CIN) U22990MH1998PTC115305, regulated by the Securities and Exchange Board of India ('SEBI') and holder of licenses as a Research Analyst (SEBI Registration No. INH000001105); Stock Broker (SEBI Stock Broker Registration No. INZ000244438), Merchant Banker (SEBI Registration No. INM000011203), and depository participant with National Securities Depository Limited (SEBI Registration No. IN-DP-NSDL-567-2021) having registered office at Altimus, Level 39 & 40, Pandurang Budhkar Marg, Worli, Mumbai 400018, India; Telephone no. +91-22-61181000; Compliance Officer Details: Mr. Tejarshi Hardas, Tel. No.: +91-22-61181000 or Email: tejarshi.hardas@morganstanley.com; Grievance officer details: Mr. Tejarshi Hardas, Tel. No.: +91-22-61181000 or Email: msic-compliance@morganstanley.com which accepts the responsibility for its contents and should be contacted with respect to any matters arising from, or in connection with, Morgan Stanley Research, and their affiliates (collectively, "Morgan Stanley"). Morgan Stanley India Company Private Limited (MSICPL) may use AI tools in providing research services. All recommendations contained herein are made by the duly qualified research analysts.
For important disclosures, stock price charts and equity rating histories regarding companies that are the subject of this report, please see the Morgan Stanley Research Disclosure Website at www.morganstanley.com/eqr/disclosures/webapp/generalresearch, or contact your investment representative or Morgan Stanley Research at 1585 Broadway, (Attention: Research Management), New York, NY, 10036 USA.
For valuation methodology and risks associated with any recommendation, rating or price target referenced in this research report, please contact the Client Support Team as follows: US/Canada +1 800 303-2495; Hong Kong +852 2848-5999; Latin America +1 718 754-5444 (U.S.); London +44 (0)20-7425-8169; Singapore +65 6834-6860; Sydney +61 (0)2-9770-1505; Tokyo +81 (0)3-6836-9000. Alternatively you may contact your investment representative or Morgan Stanley Research at 1585 Broadway, (Attention: Research Management), New York, NY 10036 USA.