PDF 原檔:報告_GS_華碩2357_20260820_original.pdf
已驗證圖片清單(Step 2.5,2026-08-20 逐張 Read)
| 檔名 | size | 分類 | 親眼所見內容 |
|---|---|---|---|
報告_GS_華碩2357_20260820_001.png |
92KB | 真資料圖 | 左 Exhibit 6「ASUS 12M forward PE ratio」2019/1-2026 折線,標示 +1stv. 14.1x/avg 9.9x/-1stv. 5.7x,2026/5 後由約 7x 拉升至接近 14x;右 Exhibit 7「ASUS QFII」外資持股比重 66%(2019/1)→42%(2023 低點)→39%(最新) |
報告_GS_華碩2357_20260820_002.png |
85KB | 真資料圖 | GS 評等與目標價沿革圖(2023/8-2026/6):藍點目標價 522→506→566→563→639→681→688→690→691→703→794→825→814→775→784→849→854→672→611,2026 股價區間標 690.1/1,082;評等由 B(Buy)於 2025/12/17 轉 N(Neutral);分析師 Allen Chang(as of Jun 28, 2024) |
原始內容
For the exclusive use of KEVINLU@LENOVO.COM
Asus (2357.TW): PC enjoying product mix upgrade; AI server client base expansion; July & 2Q26 beat; Neutral
ASUS's Jul revenue was up 53% YoY / down 21% QoQ to NT$84bn, or 16% higher than our estimate, re fl ecting strong AI servers demand, along with PC product mix upgrade. Looking forward, we expect sequential revenue growth in Aug-Sep, considering the low base in Jul, followed by sequential revenue declines in Oct-Nov, as the rising memory cost would weigh PC end demand and AI servers model transition. Overall, our estimate shows double-digit YoY revenue growth for 3Q / 4Q26E, supported by PC product mix upgrade and rack-level AI server ramp up. Management is positive on ASUS's AI server business growth ahead and expects client base expansion in 2027, and the company is expanding its global capacity to better capture the growing demand. ASUS aims a stronger 2026E AI server revenue growth and announced the plan of raising US$2.5bn by issuing bonds, supporting the company's AI server capacity expansion. For PC business, ASUS will continue to launch new models, including AI, gaming, and commercial PC to support the product mix upgrade, o ff setting the impact of memory price hike, per management. We remain positive on ASUS's expansion toward AI, while the rising memory cost could weigh on PC end demand. Maintain Neutral.
Exhibit 1: We expect ASUS Aug revenue to grow +41% YoY/+5% MoM to NT$88bn
| Jul-26 | Aug-26E | Sep-26E | Oct-26E | Nov-26E | Dec-26E | 3Q26E | 3426E | |
|---|---|---|---|---|---|---|---|---|
| Rev (NT$m) | 84,131 | 88,338 | 96,272 | 81,831 | 72,011 | 75,459 | 268,741 | 229,302 |
| Rev YoY | 53% | 41% | 17% | 23% | 8% | 8% | 34% | 13% |
| RevMoM/QoQ | -21% | 5% | 9% | -15% | -12% | 5% | 4% | -15% |
| GS estimates (NT$m) | 72,325 | |||||||
| Act vs. GS | 16% |
Source: Company data, Goldman Sachs Global Investment Research
2Q26 beat: ASUS's 2Q26 revenue was up 37% YoY / 24% QoQ, or 9% / 7% higher than our estimate / Bloomberg consensus, which we attribute to the PC pull-in and AI server shipments growth. GM improved QoQ, higher than our estimate and Bloomberg consensus, which management attribute to ASUS's strong supply chain management and AI server shipments ramp up driving manufacturing e ffi ciency. 2Q26 opex ratio is better than our estimate, re fl ecting the operational e ffi ciency improvement as revenue scales up and leading 2Q26 net income 88% / 75% higher than our estimate.
Allen Chang
+852-2978-2930 | allen.k.chang@gs.com Goldman Sachs (Asia) L.L.C.
Verena Jeng
+852-2978-1681 | verena.jeng@gs.com Goldman Sachs (Asia) L.L.C.
Yifan Hu +852-2978-0996 | yifan.hu@gs.com Goldman Sachs (Asia) L.L.C.
e92c7a75ab8b4efbba794e6b187208c8
For the exclusive use of KEVINLU@LENOVO.COM
Exhibit 2: 2Q26 result snapshot
| NTm | 2Q25 | 1Q26 | 2Q26 | QoQ | YoY | GS | Act / GS | Cons. | Act/Cons. |
|---|---|---|---|---|---|---|---|---|---|
| Revenue | 188,006 | 208,370 | 257,732 | 24% | 37% | 236,098 | 9% | 240,393 | 7% |
| GP | 25,963 | 30,969 | 44,243 | 43% | 70% | 33,886 | 31% | 32,787 | 35% |
| OP | 7,835 | 11,896 | 20,974 | 76% | 168% | 10,748 | 95% | 11,246 | 87% |
| Net income | 9,806 | 9,797 | 19,048 | 94% | 94% | 10,120 | 88% | 10,854 | 75% |
| Margins | |||||||||
| GM | 13.8% | 14.9% | 17.2% | 2.3ppts | 3.4ppts | 14.4% | 2.8ppts | 13.6% | 3.5ppts |
| OPM | 4.2% | 5.7% | 8.1% | 2.4ppts | 4ppts | 4.6% | 3.6ppts | 4.7% | 3.5ppts |
| NM | 5.2% | 4.7% | 7.4% | 2.7ppts | 2.2ppts | 4.3% | 3.1ppts | 4.5% | 2.9ppts |
Source: Company data, Goldman Sachs Global Investment Research
Earnings revision: We factor in ASUS's 2Q26 result and raise our 2026-28E net incomes by 30% / 2% / 4%, mainly on higher revenues and lower opex ratios. 2026-28E revenues are raised by 12% / 8% / 8%, mainly on higher contribution from rack-level AI server business as global capacity ramps up. We revise up 2026E GM to re fl ect the 2Q26 GM beat, while revise down 2027-28E GM, as the rising rack-level AI server shipments would weigh on the GM. 2026-28E opex ratios are revised down to re fl ect the operational e ffi ciency improvement as revenue scales up.
Exhibit 3: Earnings revision
| 2026E | 2026E | 2026E | 2027E | 2027E | 2027E | 2028E | 2028E | 2028E | |
|---|---|---|---|---|---|---|---|---|---|
| NTm | Old | New | Chg | Old | New | Chg | Old | New | Chg |
| Revenue | 859,450 | 964,144 | 12% | 967,080 | 1,048,547 | 8% | 1,062,418 | 1,146,944 | 8% |
| GP | 125,096 | 149,175 | 19% | 149,602 | 157,827 | 5% | 165,684 | 175,983 | 6% |
| OP | 44,968 | 60,175 | 34% | 57,633 | 61,256 | 6% | 67,413 | 73,332 | 9% |
| Net income | 41,798 | 54,397 | 30% | 51,802 | 52,647 | 2% | 59,314 | 61,817 | 4% |
| Margins | |||||||||
| GM | 14.6% | 15.5% | 15.5% | 15.1% | 15.6% | 15.3% | |||
| OPM | 5.2% | 6.2% | 6.0% | 5.8% | 6.3% | 6.4% | |||
| NM | 4.9% | 5.6% | 5.4% | 5.0% | 5.6% | 5.4% |
Source: Company data, Goldman Sachs Global Investment Research
Exhibit 4: ASUS P&L Summary
| (NT$ m) | 1Q25 | 2Q25 | 3Q25 | 4Q25 | 1Q26 | 2Q26 | 3Q26E | 4Q26E | 2022 | 2023 | 2024 | 2025 | 2026E | 2027E | 2028E |
|---|---|---|---|---|---|---|---|---|---|---|---|---|---|---|---|
| Revenue | 147,693 | 188,006 | 200,281 | 202,924 | 208,370 | 257,732 | 268,741 | 229,302 | 537,192 | 482,314 | 587,087 | 738,905 | 964,144 | 1,048,547 | 1,146,944 |
| Gross profit | 24,600 | 25,963 | 28,706 | 32,346 | 30,969 | 44,243 | 40,103 | 33,860 | 74,145 | 72,405 | 103,474 | 111,614 | 149,175 | 157,827 | 175,983 |
| Operating income | 12,580 | 7,835 | 9,839 | 9,403 | 11,896 | 20,974 | 15,916 | 11,389 | 12,982 | 11,164 | 29,595 | 39,656 | 60,175 | 61,256 | 73,332 |
| Net income | 12,791 | 9,806 | 10,556 | 11,405 | 9,797 | 19,048 | 14,663 | 10,889 | 14,691 | 15,928 | 31,394 | 44,558 | 54,397 | 52,647 | 61,817 |
| EPS (NT$) | 17.22 | 13.20 | 14.21 | 15.36 | 13.19 | 25.64 | 19.74 | 14.66 | 19.78 | 21.44 | 42.27 | 59.99 | 73.24 | 70.88 | 82.98 |
| Margins / ratio | |||||||||||||||
| Gross margin | 16.7% | 13.8% | 14.3% | 15.9% | 14.9% | 17.2% | 14.9% | 14.8% | 13.8% | 15.0% | 17.6% | 15.1% | 15.5% | 15.1% | 15.3% |
| Operating margin | 8.5% | 4.2% | 4.9% | 4.6% | 5.7% | 8.1% | 5.9% | 5.0% | 2.4% | 2.3% | 5.0% | 5.4% | 6.2% | 5.8% | 6.4% |
| Net margin | 8.7% | 5.2% | 5.3% | 5.6% | 4.7% | 7.4% | 5.5% | 4.7% | 2.7% | 3.3% | 5.3% | 6.0% | 5.6% | 5.0% | 5.4% |
| QoQ | |||||||||||||||
| Revenue | -4% | 27% | 7% | 1% | 3% | 24% | 4% | -15% | |||||||
| Gross profit | -6% | 6% | 11% | 13% | -4% | 43% | -9% | -16% | |||||||
| Operating income | 699% | -38% | 26% | -4% | 27% | 76% | -24% | -28% | |||||||
| Net income | 681% | -23% | 8% | 8% | -14% | 94% | -23% | -26% | |||||||
| EPS | 681% | -23% | 8% | 8% | -14% | 94% | -23% | -26% | |||||||
| YoY | |||||||||||||||
| Revenue | 21% | 30% | 20% | 32% | 41% | 37% | 34% | 13% | 0% | -10% | 22% | 26% | 30% | 9% | 9% |
| Gross profit | 26% | -7% | -4% | 24% | 26% | 70% | 40% | 5% | -33% | -2% | 43% | 8% | 34% | 6% | 12% |
| Operating income | 160% | -32% | -16% | 497% | -5% | 168% | 62% | 21% | -74% | -14% | 165% | 34% | 52% | 2% | 20% |
| Net income | 135% | -17% | -16% | 596% | -23% | 94% | 39% | -5% | -67% | 8% | 97% | 42% | 22% | -3% | 17% |
| EPS | 135% | -17% | -16% | 596% | -23% | 94% | 39% | -5% | -67% | 8% | 97% | 42% | 22% | -3% | 17% |
Source: Company data, Goldman Sachs Global Investment Research
Valuation: We continue to use near term P/E to derive our 12M TP. Our target P/E is updated to 15.7x 2027E EPS, (vs. 15.8x previously), still derived from peers' avg. ratio of 2027E PE to 2028E NI YoY and OPM. With the updated earnings estimates and target P/E, our 12M TP is raised to NT$1,109 (vs. NT$1,082 previously). Maintain Neutral.
e92c7a75ab8b4efbba794e6b187208c8
For the exclusive use of KEVINLU@LENOVO.COM
Exhibit 5: Target P/E is derived from peers' avg. ratio of 2027E PE to 2028E NI YoY and OPM
| Company Ticker Rating | ASUS 2357.TW Neutral | Lenovo 0992.HK Buy | Gigabyte 2376.TW Neutral | Dell DELL Buy | Quanta 2382.TW Neutral | HP HPQ Sell | Apple AAPL Buy |
|---|---|---|---|---|---|---|---|
| 2027E PE | 15.7 | 16.8 | 9.6 | 21.4 | 11.5 | 9.8 | 32.8 |
| 2028E NI YoY | 17% | 50% | 17% | 12% | 9% | 13% | 8% |
| 2028E OPM | 6.4% | 7.0% | 4.7% | 9.7% | 3.5% | 6.9% | 30.8% |
| Ratio | 0.7 | 0.3 | 0.4 | 1.0 | 0.9 | 0.5 | 0.9 |
| Avg. | 0.7 |
Source: Company data, Goldman Sachs Global Investment Research
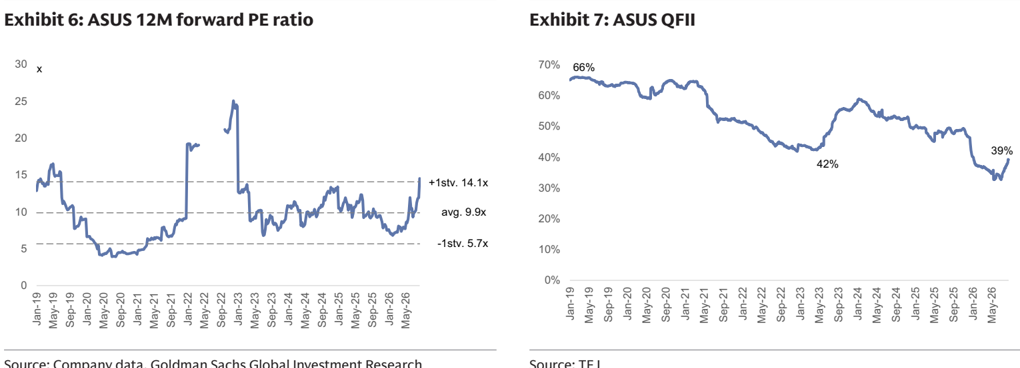
Source: Company data, Goldman Sachs Global Investment Research
Source: TEJ
Price Target Risks and Methodology - Asus
We are Neutral-rated on ASUS with a 12-month target price of NT$1,109 . Our target price is based on 15.7x 2027E P/E , which is derived from brand makers' average ratio of 2027E P/E to 2028E NI YoY and OPM. We see EPS growth and OPM as major factors for the stock's share performance.
Key upside/downside risks include: 1) stronger / weaker-than-expected PC market growth; 2) faster / slower-than-expected AI and gaming PC growth; and 3) faster / slower-than-expected AI server ramp-up.
e92c7a75ab8b4efbba794e6b187208c8
For the exclusive use of KEVINLU@LENOVO.COM
| 2357.TW 12m Price | Target: NT$1,109.00 | Price: NT$925.00 | Price: NT$925.00 | Upside: 19.9% | Upside: 19.9% |
|---|---|---|---|---|---|
| Neutral | GS Forecast | ||||
| Market c ap: NT$687.1 bn / $ 2 1. 5bn | Revenue (NT$m n ) N e w Revenue (NT$ mn) Old EBITDA (NT$ mn) E PS(NT$) N e w EPS (NT$) Old P/E (X) P/B (X) | 12/25 7 3 8 ,904. 8 738,904.8 42,773.2 5 9.99 59.99 | 12/26E 9 6 4, 1 44. 2 859,449.5 65,908.8 7 3. 2 4 56.27 12.6 2.4 5.5 | 12/27E 1 ,04 8 , 5 4 6 . 6 967,079.9 66,436.1 | 12/28E 1 , 1 4 6 ,944.3 82 .9 |
| En terpr is e v a lu e: | 1,062,417.7 | ||||
| NT$7 5 8. 9bn / $ 23 .8 bn | 78,082.5 | ||||
| 3m AD T V : NT$ 4 . 4bn / $1 3 7. 3mn n | 7 0. | 88 | 8 | ||
| Ta iw a | 69.74 | 79.13 | |||
| G reater Chin a Te chnology | 10.6 | 13.1 | 11.1 | ||
| M &A R a n k: 3 | 1.8 | 2.3 | 2.2 | ||
| L ea s e s incl . in n et d e b t & EV? : e s | Dividend yield (%) 6.5 | 5.3 | 6.3 | ||
| Y | CROCI (%) 26.9 | 23.7 | 22.5 | 23.8 | |
| 6/26 | 9 /26E | 12/26E | 3 /27E | ||
| EPS (NT$) 25.64 | 19.74 | 14.66 | 15.70 |
Source: Company data, Goldman Sachs Research estimates, FactSet. Price as of 19 Aug 2026 close.
e92c7a75ab8b4efbba794e6b187208c8
For the exclusive use of KEVINLU@LENOVO.COM