PDF 原檔:報告_GS_旺矽6223_20260727_original.pdf
圖片清單(已驗證 2026-07-28)
Step 2.5 眼見為憑索引,是 lib/ 嵌圖的唯一真相來源。只挑分類為「真資料圖」且已逐張 Read 者嵌入,圖說照抄「親眼所見內容」。
| 檔名 | size | 分類 | 親眼所見內容 |
|---|---|---|---|
報告_GS_旺矽6223_20260727_009.png |
74KB | 真資料圖 | GS rating and stock price target history(MPI 6223.TWO):2023-2026 股價線+目標價點位標註 1,000/1,140/1,420/2,000/2,250/3,300/3,750/8,800,評等自 May 25 轉 B(Buy),底部圖例列 Rating/Price target/Price target at removal/Taiwan SE Weighted Index |
報告_GS_旺矽6223_20260727_003.png |
47KB | 真資料圖(未逐張 Read) | Exhibit 1/2 區塊圖,依報告章節標題判定為 VPC/MEMS 產能或營收拆解 |
報告_GS_旺矽6223_20260727_005.png |
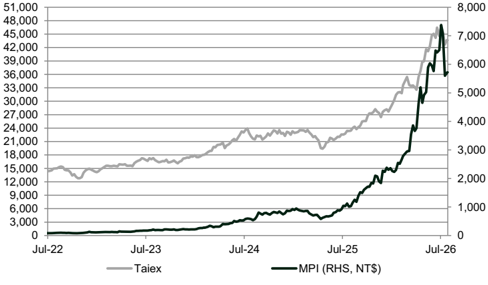
43KB | 真資料圖(未逐張 Read) | Exhibit 5:Taiex vs. MPI 相對走勢 |
報告_GS_旺矽6223_20260727_006.png |
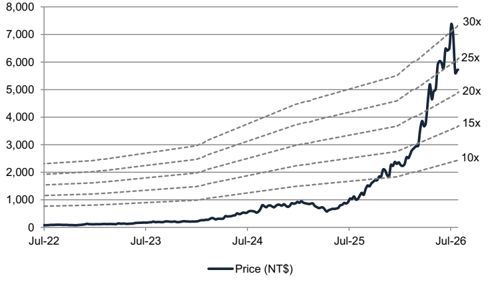
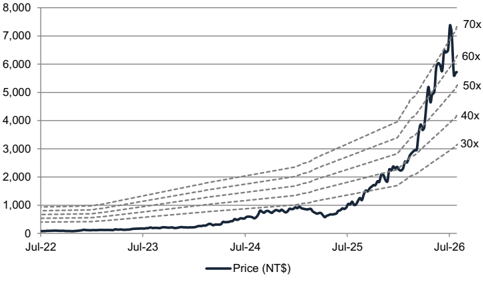
40KB | 真資料圖(未逐張 Read) | Exhibit 7:Forward P/B |
報告_GS_旺矽6223_20260727_007.png |
40KB | 真資料圖(未逐張 Read) | Exhibit 6:Forward P/E |
報告_GS_旺矽6223_20260727_001.png |
21KB | 裝飾·logo·banner | <40KB,未 Read |
報告_GS_旺矽6223_20260727_002.png |
39KB | 裝飾·logo·banner | <40KB,Price Performance 縮圖,未 Read |
報告_GS_旺矽6223_20260727_004.png |
31KB | 真資料圖(未逐張 Read) | Exhibit 2 區塊圖 |
報告_GS_旺矽6223_20260727_008.png |
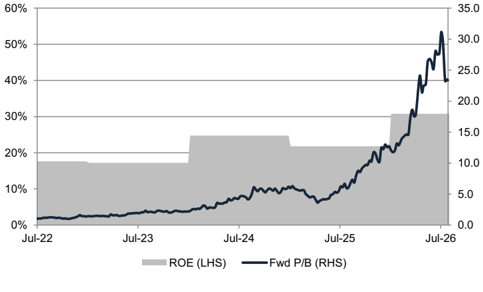
28KB | 真資料圖(未逐張 Read) | Exhibit 8:P/B vs. ROE |
只有 _009.png 逐張 Read 確認;其餘為估值/走勢類,依 Exhibit 標題做範圍性驗證,未嵌入 lib 頁。
原始內容
For the exclusive use of KEVINLU@LENOVO.COM
MPI Corp. (6223.TWO)
CPO overhang largely priced in; new customer penetration to support a stronger capacity expansion outlook; reiterate Buy with TP of NT$8,000 (from NT$8,800)
6 22 3.TWO
12m Pri c e Target:
NT$8,000.00
Pri
c
e:
NT$5,7 2 0.00
Upside:
39.9%
Resilient outlook into 3Q26
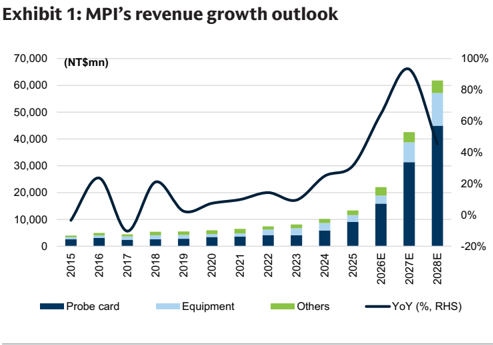
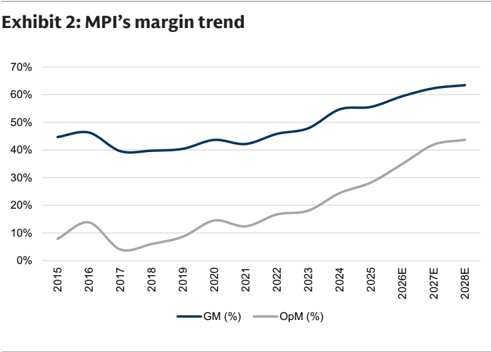
MPI has previously reported its June 2026 revenue of NT$1,833mn, bringing total 2Q26 revenue to NT$5,226mn (+33% QoQ, +59% YoY), 6% above GSe. We attribute the strong QoQ growth to robust VPC and MEMS momentum, driven by sustained AI-related demand. GM wise, we estimate 2Q26E GM at 57.9%, down 1.6ppts QoQ, as we expect higher VPC revenue contribution in 2Q26E. Looking into 3Q26, we expect revenue to grow 14% QoQ, while GM should rise sequentially to 59.5%, supported by higher AI ASIC-related revenue contribution.
Stronger MEMS capacity expansion supporting 2027 outlook
Management has guided VPC/MEMS monthly pin capacity to reach 2mn/3.5mn by 4Q26, and indicated that total VPC+MEMS capacity additions in 2027 could match or exceed the 2026 expansion pace, with MEMS expansion expected to outpace VPC in growth percentage terms. However, as momentum from AI-related customers continues to strengthen, we see high possibility for MPI to pursue an even more aggressive MEMS capacity expansion plan in 2027 , with several large-scale MEMS projects for ASIC, CPU, and AI-related applications ramping up simultaneously. Overall, we are now expecting MPI's VPC/MEMS capacity could reach 2mn/5mn pins per month by end 2026E (vs. 2mn/3.5mn previously) and 2.5mn/8.0mn pins per month by end 2027E (vs. 2.5mn/6.5mn previously).
New customer penetration likely to see meaningful ramp in 2027
Beyond AI ASIC-related demand, we are seeing growing traction from non-AI ASIC customers, with MPI potentially capturing a sizable market share in 2027. Based on company's comments, we note MPI is in active discussions with a leading CPU provider, with initial shipments slated to begin in 4Q26 for legacy products ,
BUY
Evelyn Yu
+886(2)2730-4187 | evelyn.yu@gs.com Goldman Sachs (Asia) L.L.C., Taipei Branch
Ryan Huang, CFA
+886(2)2730-4084 | ryan.huang@gs.com Goldman Sachs (Asia) L.L.C., Taipei Branch
Key Data _____________________________________
Market cap: NT$539.0bn / $16.6bn
Enterprise value: NT$536.5bn / $16.5bn
3m ADTV: NT$7.2bn / $228.0mn
Taiwan
Taiwan Semiconductor
M&A Rank: 3
Leases incl. in net debt & EV?: Yes
| GS Forecast | 12/25 | __________ 12/26E | 12/27E | 12/28E |
|---|---|---|---|---|
| Revenue(NT$mn) New | 13,371.2 | 22,027.2 | 42,553.5 | 61,843.6 |
| Revenue (NT$ mn) Old | 13,371.2 | 21,4 6 4.5 | 42,223.4 | 6 4,545.7 |
| EBITDA (NT$ mn) | 4,5 66 .2 | 8,741.4 | 19,009.5 | 28,315.8 |
| EPS(NT$) New | 33.65 | 67.64 | 149.64 | 224.75 |
| EPS (NT$) Old | 33. 6 5 | 6 2.99 | 148. 6 7 | 247.23 |
| P/E (X) | 3 6 .2 | 84. 6 | 38.2 | 25.5 |
| P/B (X) | 8.2 | 29.4 | 19.1 | 13.4 |
| Dividend yield (%) | 1.8 | 0.8 | 1.7 | 2. 6 |
| CROCI (%) | 21.2 | 44.5 | 6 0.3 | 71.5 |
| 3/26 | 6/26E | 9/26E | 12/26E | |
| EPS (NT$) | 12.53 | 14.57 | 17.93 | 22. 6 1 |
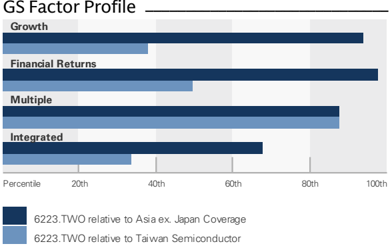
Source: Company data, Goldman Sachs Research estimates. See disclosures for details.
Goldman Sachs does and seeks to do business with companies covered in its research reports. As a result, investors should be aware that the fi rm may have a con fl ict of interest that could a ff ect the objectivity of this report. Investors should consider this report as only a single factor in making their investment decision. For Reg AC certi fi cation and other important disclosures, see the Disclosure Appendix, or go to ed as research www.gs.com/research/hedge.html. Analysts employed by non-US a ffi liates are not registered/quali fi analysts with FINRA in the U.S.
e92c7a75ab8b4efbba794e6b187208c8
For the exclusive use of KEVINLU@LENOVO.COM
BUY
MPI Corp. (6223.TWO)
Rating since May 25, 2025
Ratios & Valuation __________________________________________
| 12/25 | 12/26E | 12/27E | 12/28E | |
|---|---|---|---|---|
| P/E (X) | 36.2 | 84.6 | 38.2 | 2 5 . 5 |
| P/B (X) | 8.2 | 2 9 .4 | 1 9 .1 | 13.4 |
| FCF yield (%) | (1.6) | 0.4 | 1.4 | 3.4 |
| EV/EBITD A R(X) | 24.6 | 63.8 | 2 9 .2 | 1 9 .3 |
| EV/EBITD A (excl. leases) (X) | 24.6 | 63.8 | 2 9 .2 | 1 9 .3 |
| CROCI (%) | 21.2 | 44. 5 | 60.3 | 71. 5 |
| ROE (%) | 26.6 | 3 9 .4 | 60. 5 | 61.8 |
| Net debt/equity (%) | (18. 9 ) | (13.0) | (1 9 . 9 ) | (3 5 . 9 ) |
| Net debt/equity (excl. leases) (%) | (18. 9 ) | (13.0) | (1 9 . 9 ) | (3 5 . 9 ) |
| Interest c ov er (X) | 42.2 | 11 9 .7 | 262.4 | 3 99 . 9 |
| Days in v ent o ry o utst , sales | 11 5 . 9 | 130.7 | 12 5 .2 | 117. 5 |
| Recei v able days | 62.4 | 59 .4 | 60. 5 | 63. 5 |
| Days p ayable o utstandin g | 21 9 . 5 | 2 5 7.1 | 270.6 | 273. 9 |
| DuP o nt ROE (%) | 21.8 | 34.7 | 4 9 . 9 | 5 2.6 |
| Turn ov er (X) | 0.6 | 0.6 | 0.8 | 0. 9 |
| L e v era g e (X) | 1.6 | 1.8 | 1.7 | 1.6 |
| G r o ss cas h in v ested (ex cas h ) (NT $ ) | 17 , 0 5 6.3 | 22 , 220.1 | 30 , 347. 9 | 34 ,9 02.7 |
| Av era g e ca p ital e mp l o yed (NT $ ) | 9, 702.6 | 14 , 21 5 .3 | 20 , 077.8 | 2 5, 176.6 |
| BVP S (NT $ ) | 148.7 9 | 1 9 4.71 | 300.12 | 427.03 |
Growth & Margins (%) ______________________________________
| 12/25 | 12/26E | 12/27E | 12/28E | |
|---|---|---|---|---|
| Total revenue growth | 3 1 . 5 | 64 . 7 | 9 3. 2 | 45 .3 |
| E BITDA growth | 50 .3 | 91 . 4 | 117 . 5 | 49 . 0 |
| E PS growth | 3 7 . 8 | 101 . 0 | 121 . 2 | 50 . 2 |
| DPS growth | 3 7 . 8 | 101 . 0 | 121 . 2 | 50 . 2 |
| E BIT margin | 28 . 2 | 3 4 . 9 | 41 . 9 | 4 3. 7 |
| E BITDA margin | 3 4 . 1 | 3 9 . 7 | 44 . 7 | 45 . 8 |
| Net income margin | 2 3. 8 | 3 0 . 1 | 3 4 . 5 | 3 5 . 6 |
Price Performance __________________________________________
Absolute
Rel. to the Taiwan SE Weighted Index
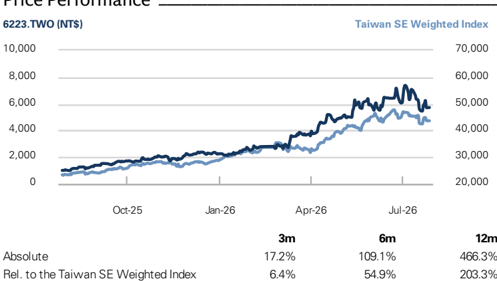
Source: FactSet. Price as of 27 Jul 2026 close.
Income Statement (NT$ mn) ________________________________
| 12/25 | 12/26E | 12/27E | 12/28E | |
|---|---|---|---|---|
| To t a l r e v e nu e | 13,371.2 | 22, 0 27.2 | 42,553.5 | 61,843.6 |
| Cost of goods sold | (5,943.4) | (8,942.6) | (16, 0 45.8) | (22,627.8) |
| SG&A | (2,384.5) | (3,642. 0 ) | (6,139.4) | (8,771.4) |
| R&D | (1,276.2) | (1,724.4) | (2,535.6) | (3,436.9) |
| Other operating inc./(exp.) | 7.4 | (26. 0 ) | -- | -- |
| E BITDA | 4, 566 . 2 | 8 , 7 4 1 .4 | 1 9,009. 5 | 28 ,3 15 . 8 |
| Depreciation& amortization | (791.7) | (1, 0 49.3) | (1,176.8) | (1,3 0 8.4) |
| E BIT | 3, 77 4. 5 | 7 , 6 9 2 . 1 | 17 , 8 3 2 . 7 | 27 ,00 7 .4 |
| Net interest inc./(exp.) | (13.5) | (11.8) | (11.5) | (11.4) |
| Income/(loss) from associates | -- | -- | -- | -- |
| Pre-tax pro fi t | 3, 8 4 1 . 1 | 8 , 116 . 1 | 18 ,0 61 . 2 | 27 , 2 3 6 .0 |
| Provision for taxes | (665.7) | (1,488.9) | (3,399.4) | (5,214.5) |
| Minority interest | 1.3 | -- | -- | -- |
| Preferred dividends | -- | -- | -- | -- |
| N et inc . ( pre-ex c ept i o n a ls) | 3, 176 . 6 | 6 , 627 . 2 | 1 4, 661 . 8 | 22 ,0 21 . 5 |
| Post-tax exceptionals | -- | -- | -- | -- |
| N et inc . ( po s t-ex c ept i o n a ls) | 3, 176 . 6 | 6 , 627 . 2 | 1 4, 661 . 8 | 22 ,0 21 . 5 |
| E P S(b a sic , pre-ex c ept ) (N T $) | 33. 65 | 67 . 6 4 | 1 49. 6 4 | 22 4. 75 |
| E P S(dilu te d , pre-ex c ept ) (N T $) | 33. 65 | 67 . 6 4 | 1 49. 6 4 | 22 4. 75 |
| E P S(b a sic , po s t-ex c ept ) (N T $) | 33. 65 | 67 . 6 4 | 1 49. 6 4 | 22 4. 75 |
| E P S(dilu te d , po s t-ex c ept ) (N T $) | 33. 65 | 67 . 6 4 | 1 49. 6 4 | 22 4. 75 |
| DPS (NT$) | 22. 0 1 | 44.23 | 97.85 | 146.96 |
| Div. payout ratio (%) | 65.4 | 65.4 | 65.4 | 65.4 |
| Balance Sheet (NT$ mn) | ______ | |||
| 12/25 | 12/26E | 12/27E | 12/28E | |
| C a sh& c a sh equiv a lents | 5,437.4 | 5, 1 86.5 | 8,563.7 | 1 7,75 1 .6 |
| Accounts receiv a ble | 2,479.9 | 4,690. 1 | 9,424. 1 | 1 2, 1 08.3 |
| Inventory | 5,0 11 .4 | 1 0,762.0 | 1 8,430.3 | 2 1 ,395.8 |
| Other current a ssets | 388.9 | 5 1 2.8 | 5 1 2.8 | 5 1 2.8 |
| Total current assets | 1 3,3 17 . 6 | 21 , 151 .3 | 3 6 ,93 0 .9 | 51 , 768 . 4 |
| Net PP&E | 7,729.4 | 9,494.7 | 1 0,897.9 | 1 2, 1 74. 1 |
| Net int a ngibles | 58 1 .3 | 492.6 | 352.6 | 208.0 |
| Tot a l investments | 668.5 | 549.2 | 549.2 | 549.2 |
| Other long-term a ssets | 1 ,706. 1 | 2,387.4 | 2,387.4 | 2,387.4 |
| Total assets | 24 , 002 . 8 | 3 4 , 075 . 2 | 51 , 118 . 0 | 67 , 087 . 2 |
| Accounts p a y a ble | 4,039.9 | 8,556.6 | 1 5,23 1 . 1 | 1 8,726.0 |
| Short-term debt | 1 ,350.0 | 850.0 | 850.0 | 850.0 |
| Short-term le a se li a bilities | -- | -- | -- | -- |
| Other current li a bilities | 2, 1 79.5 | 3, 1 90.2 | 3,230.2 | 3,270.2 |
| Total current liabilities | 7 , 56 9. 4 | 12 , 5 9 6 . 8 | 1 9,3 11 .3 | 22 , 846 . 2 |
| Long-term debt | 1 ,337.2 | 1 ,860.6 | 1 ,860.6 | 1 |
| Long-term le a se li a bilities | -- | -- | -- | ,860.6 -- |
| Other long-term li a bilities | 5 1 7.7 | 539.6 | 539.6 | 539.6 |
| Total long-term liabilities | 1 , 854 .9 | 2 , 400 . 2 | 2 , 400 . 2 | 2 , 400 . 2 |
| Total liabilities | 9, 424 . 2 | 14 ,99 7 . 0 | 21 , 711 . 5 | 25 , 246 . 4 |
| Preferred sh a | -- | -- | ||
| res Tot a l commonequity | 1 4,578.6 | -- 1 9,078.2 | -- 29,406.5 | 4 1 ,840.8 |
| Minority interest | 0 . 0 | 0 . 0 | 0 . 0 | -- |
| Total liabilities &equity | 24 , 002 . 8 | 3 4 , 075 . 2 | 51 , 118 . 0 | 67 , 087 . 2 |
| Net debt, a djusted | (2,750.2) | (2,475.9) | (5,853. 1 ) | ( 1 5,04 1 .0) |
Cash Flow (NT$ mn) ________________________________________
| Cash Flow (NT$ mn) | 12/25 | 12/26E | 12/27E | 12/28E |
|---|---|---|---|---|
| Net income | 3,176.6 | 6,627.2 | 14,661.8 | 22,021.5 |
| D&Aadd-back | 791.7 | 1,049.3 | 1,176.8 | 1,308.4 |
| Minority interest add-back | (1.3) | -- | -- | -- |
| Net (inc)/dec w orking capital | (990.8) | (3,444.0) | (5,727.8) | (2,154.7) |
| Other operating cash flo w | (938.2) | 1,049.3 | -- | -- |
| Cash flow fro m operations | 2 ,03 8 .0 | 5 , 281 . 9 | 1 0, 11 0. 7 | 21 , 175 . 2 |
| Capital expenditures | (3,881.3) | (2,786.9) | (2,400.0) | (2,400.0) |
| Acquisitions | (417.7) | (710.9) | -- | -- |
| Divestitures | -- | -- | -- | -- |
| Others | 223.7 | 28.5 | -- | -- |
| Cash flow fro m investing | (4,0 75 .4) | (3,4 69 . 2 ) | ( 2 ,400.0) | ( 2 ,400.0) |
| Repayment of lease liabilities | -- | -- | -- | -- |
| Dividends paid(common& pref) | (1,504.8) | (2,077.2) | (4,333.5) | (9,587.3) |
| Inc/(dec) in debt | 4,050.0 | 38.0 | -- | -- |
| Other financing cash flo w s | 1,234.6 | (24.4) | 0.0 | 0.0 |
| Cash flow fro m financing | 3, 779 . 7 | ( 2 ,0 6 3. 6 ) | (4,333. 5 ) | ( 9 , 587 .3) |
| Total cash flow | 1 , 7 4 2 .3 | ( 25 0. 9 ) | 3,3 77 . 2 | 9 , 187 . 9 |
| Free cash flo w | (1,843.3) | 2,495.1 | 7,710.7 | 18,775.2 |
Source: Company data, Goldman Sachs Research estimates.
e92c7a75ab8b4efbba794e6b187208c8
For the exclusive use of KEVINLU@LENOVO.COM
while qualifying its latest N2 products using all-MEMS solutions at the same time. We believe MPI may be gaining share from a foreign competitor that is refocusing on the ASIC supply chain, as the customer looks to secure su ffi cient probe-card supply. Overall, we estimate the CPU customer's probe card TAM could reach NT$13-14bn in 2026E. Assuming a 10% market share, we estimate this customer to contribute c.6% of MPI's probe card revenue in 2026E, with share potentially expanding to 30%+ in 2027E and contributing low teens % of revenue .
Slower CPO ramp, yet MPI remains well positioned
For MPI's CPO business, we continue to expect the Insertion 2 quali fi cation results in 2H26 and see the possibility for MPI to become the key provider of the Insertion 2 double-sided prober once quali fi ed. We believe MPI's competitive positioning remains favorable, as it is one of the few vendors capable of o ff ering optical/electrical testing solutions. However, we expect overall CPO progress to be slightly slower than previously anticipated, owing to early-stage technology ramp. Overall, we remain optimistic that CPO will become the standard for next-generation AI networking, and we now model MPI's CPO-related business to potentially contribute high single digit % and low teens % of its total revenue in 2027/2028E (vs. 15-20%/20-25% previously).
Risk-reward skewed to the upside
MPI's shares have declined -22% from their recent peak in July (vs. TAIEX's -7%). We believe this weakness largely re fl ects a cluster of market concerns, including a potential CPO delay. However, we believe MPI's probe card business remains solid with AI demand continuing to be robust along with new customer penetration, while its competitive position within CPO remains favorable. Given our view of a more aggressive capacity expansion, new CPU customer penetration with solid TAM, and resilient long-term CPO demand, we view the risk-reward as skewed to the upside and reiterate our Buy rating. Accordingly, we adjust our 2026E-2028E earnings by +7%/+1%/-9% and revise our 12-month TP to NT$8,000 from NT$8,800, implying 40% upside.
Source: Company data, Goldman Sachs Global Investment Research
Source: Company data, Goldman Sachs Global Investment Research
Earnings changes, valuation and risks
Forecast changes
We revise our 2026E-28E EPS by +7.4%/+0.7%/-9.1% mainly as we factor in 1) stronger e92c7a75ab8b4efbba794e6b187208c8
For the exclusive use of KEVINLU@LENOVO.COM
2Q26 revenue and GM assumptions, 2) more aggressive MEMS capacity expansion plan, but 3) lower CPO contribution in 2027E/2028E.
Exhibit 3: Earnings revisions
| 2026E | 2026E | 2026E | 2027E | 2027E | 2027E | 2028E | 2028E | 2028E | |
|---|---|---|---|---|---|---|---|---|---|
| (NT$mn) | Old | New | Diff (%) | Old | New | Diff (%) | Old | New | Diff (%) |
| Revenue | 21,465 | 22,027 | 2.6% | 42,223 | 42,553 | 0.8% | 64,546 | 61,844 | -4.2% |
| Gross profit | 12,708 | 13,085 | 3.0% | 26,084 | 26,508 | 1.6% | 40,918 | 39,216 | -4.2% |
| Op. income | 7,133 | 7,692 | 7.8% | 17,710 | 17,833 | 0.7% | 29,723 | 27,007 | -9.1% |
| Net income | 6,170 | 6,627 | 7.4% | 14,564 | 14,662 | 0.7% | 24,219 | 22,022 | -9.1% |
| EPS (NT$) | 62.99 | 67.64 | 7.4% | 148.67 | 149.64 | 0.7% | 247.23 | 224.75 | -9.1% |
| GM | 59.2% | 59.4% | 0.2% | 61.8% | 62.3% | 0.5% | 63.4% | 63.4% | 0.0% |
| OpM | 33.2% | 34.9% | 1.7% | 41.9% | 41.9% | 0.0% | 46.0% | 43.7% | -2.4% |
| NM | 28.7% | 30.1% | 1.3% | 34.5% | 34.5% | 0.0% | 37.5% | 35.6% | -1.9% |
| 2Q26E | 2Q26E | 2Q26E | 3Q26E | 3Q26E | 3Q26E | 4Q26E | 4Q26E | 4Q26E | |
|---|---|---|---|---|---|---|---|---|---|
| (NT$mn) | Old | New | Diff (%) | Old | New | Diff (%) | Old | New | Diff (%) |
| Revenue | 4,911 | 5,226 | 6.4% | 5,830 | 5,932 | 1.8% | 6,791 | 6,936 | 2.1% |
| Gross profit | 2,850 | 3,024 | 6.1% | 3,454 | 3,531 | 2.2% | 4,066 | 4,192 | 3.1% |
| Op. income | 1,551 | 1,678 | 8.2% | 1,961 | 2,077 | 5.9% | 2,349 | 2,665 | 13.5% |
| Net income | 1,323 | 1,428 | 7.9% | 1,661 | 1,756 | 5.7% | 1,959 | 2,216 | 13.1% |
| EPS (NT$) | 13.51 | 14.57 | 7.9% | 16.96 | 17.93 | 5.7% | 19.99 | 22.61 | 13.1% |
| GM | 58.0% | 57.9% | -0.2% | 59.2% | 59.5% | 0.3% | 59.9% | 60.4% | 0.6% |
| OpM | 31.6% | 32.1% | 0.5% | 33.6% | 35.0% | 1.4% | 34.6% | 38.4% | 3.8% |
| NM | 26.9% | 27.3% | 0.4% | 28.5% | 29.6% | 1.1% | 28.8% | 31.9% | 3.1% |
Source: Goldman Sachs Global Investment Research
Maintain Buy with TP revised down to NT$8,000 from NT$8,800
Following our earnings revisions, our TP is now revised to NT$8,000 (from NT$8,800 previously). Our 12-month TP is based on 40x 2028E discounted P/E (unchanged). We apply this to our 2028E EPS, and discount it back to 2027E at a 12.4% CoE to arrive at our TP of NT$8,000. Our key assumptions for CoE include: (1) 1.3x beta (sourcing Bloomberg), (2) a 4.25% risk-free rate (inline with GS house-view), and (3) a market risk premium of 6.25% (in line with our GS house view). This is also inline with WinWay's valuation. Overall, our new TP implies c.40% upside from the current share price, and we maintain our Buy rating on MPI.
e92c7a75ab8b4efbba794e6b187208c8
For the exclusive use of KEVINLU@LENOVO.COM
Exhibit 4: MPI's P&L overview
| 1Q26 | 2Q26E | 3Q26E | 4Q26E | 1Q27E | 2Q27E | 3Q27E | 4Q27E | 2026E | 2027E | 2028E | |
|---|---|---|---|---|---|---|---|---|---|---|---|
| P&L | |||||||||||
| Revenue | 3,933 | 5,226 | 5,932 | 6,936 | 7,977 | 9,919 | 11,278 | 13,379 | 22,027 | 42,553 | 61,844 |
| Gross profit | 2,338 | 3,024 | 3,531 | 4,192 | 4,890 | 6,206 | 7,043 | 8,368 | 13,085 | 26,508 | 39,216 |
| Operating profit | 1,273 | 1,678 | 2,077 | 2,665 | 3,190 | 4,167 | 4,665 | 5,810 | 7,692 | 17,833 | 27,007 |
| Net income | 1,227 | 1,428 | 1,756 | 2,216 | 2,596 | 3,456 | 3,863 | 4,746 | 6,627 | 14,662 | 22,022 |
| EPS (NT$) | 12.53 | 14.57 | 17.93 | 22.61 | 26.49 | 35.27 | 39.43 | 48.44 | 67.64 | 149.64 | 224.75 |
| Margins (%) | |||||||||||
| GM | 59.4% | 57.9% | 59.5% | 60.4% | 61.3% | 62.6% | 62.5% | 62.5% | 59.4% | 62.3% | 63.4% |
| OpM | 32.4% | 32.1% | 35.0% | 38.4% | 40.0% | 42.0% | 41.4% | 43.4% | 34.9% | 41.9% | 43.7% |
| NM | 31.2% | 27.3% | 29.6% | 31.9% | 32.5% | 34.8% | 34.3% | 35.5% | 30.1% | 34.5% | 35.6% |
| YoY (%) | |||||||||||
| Revenue | 39.0% | 58.7% | 73.8% | 80.8% | 102.8% | 89.8% | 90.1% | 92.9% | 64.7% | 93.2% | 45.3% |
| Gross profit | 44.0% | 57.6% | 93.7% | 103.2% | 109.2% | 105.2% | 99.5% | 99.6% | 76.2% | 102.6% | 47.9% |
| Operating profit | 51.5% | 55.5% | 131.8% | 177.8% | 150.6% | 148.4% | 124.7% | 118.0% | 103.8% | 131.8% | 51.4% |
| Net income | 69.6% | 127.1% | 100.4% | 133.8% | 111.5% | 142.1% | 119.9% | 114.2% | 108.6% | 121.2% | 50.2% |
| EPS | 63.2% | 118.4% | 92.8% | 126.4% | 111.4% | 142.1% | 119.9% | 114.2% | 101.0% | 121.2% | 50.2% |
| QoQ (%) | |||||||||||
| Revenue | 2.5% | 32.9% | 13.5% | 16.9% | 15.0% | 24.3% | 13.7% | 18.6% | |||
| Gross profit | 13.3% | 29.3% | 16.8% | 18.7% | 16.7% | 26.9% | 13.5% | 18.8% | |||
| Operating profit | 32.7% | 31.8% | 23.8% | 28.3% | 19.7% | 30.6% | 12.0% | 24.5% | |||
| Net income | 29.5% | 16.3% | 23.0% | 26.1% | 17.2% | 33.1% | 11.8% | 22.9% | |||
| EPS | 25.4% | 16.3% | 23.0% | 26.1% | 17.2% | 33.1% | 11.8% | 22.9% |
Source: Company data, Goldman Sachs Global Investment Research
e92c7a75ab8b4efbba794e6b187208c8
For the exclusive use of KEVINLU@LENOVO.COM
Exhibit 5: Taiex vs. MPI
Source: Bloomberg
Exhibit 7: Forward P/B
Source: Bloomberg
Exhibit 6: Forward P/E
Source: Bloomberg
Exhibit 8: P/B vs. ROE
Source: Bloomberg
e92c7a75ab8b4efbba794e6b187208c8
For the exclusive use of KEVINLU@LENOVO.COM
Investment Thesis, Price Target Risks and Methodology
Investment Thesis - MPI (6223.TWO)
MPI is a leading Taiwan-based probe card provider specializing in CPC (Cantilever Probe Card), VPC (Vertical Probe Card), and MEMS (Micro-Electro-Mechanical Systems) Probe Card, which are used in the chip probe (CP) stage. The company is the 4 th largest probe card supplier with c.7% market share (2024), and 57% of its total revenue comes from the probe card segment.
We like MPI as we expect its revenue/earnings CAGR to further accelerate to 67%/91% in 2025-28E, driven by 1) continued share gain in vertical probe card (VPC) market via AI ASIC, and 2) potential share gain in MEMS probe card market through penetration into new both AI and non-AI customers, along with AI ASIC upgrade. MPI is also aiming to increase its PCB self-su ffi ciency to enable shorter product delivery lead time, which would provide it with more advantages over peers. The company is now trading above its average AI cycle forward P/E; however, with increasing ASP thanks to rising chip complexity and shorter product cadence driving frequent probe card upgrade demand, we continue to see upside potential to its revenue and earnings growth. We have a Buy rating on the name.
Price Target Risks and Methodology - MPI (6223.TWO)
Valuation: We are Buy rated on MPI. Our 12-month TP of NT$8,000 is based on a target P/E of 40x (1.7x of 3-year average forward P/E) applied to our 2028E EPS, and discounted back to 2027E at 12.4% CoE. Our key assumptions for CoE include: (1) 1.3x beta (sourcing Bloomberg), (2) a 4.25% risk-free rate, and (3) a market risk premium at 6.25% (in line with GS house view).
Key risks to our views: 1) softer AI/HPC demand, 2) slower penetration into new TAM, and 3) intensifying competition.
e92c7a75ab8b4efbba794e6b187208c8
For the exclusive use of KEVINLU@LENOVO.COM