PDF 原檔:報告_GS_國巨2327_20260729_original.pdf
圖片清單(已驗證 2026-07-31)
| 檔名 | size | 分類 | 親眼所見內容 |
|---|---|---|---|
260729_gs_yageo_001.png |
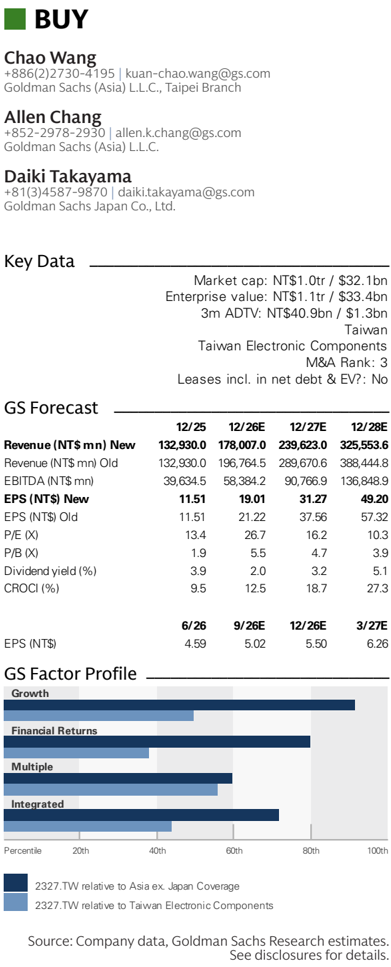
137KB | 真資料圖 | 分析師聯絡資訊 + Key Data + GS Forecast 表(Revenue/EBITDA/EPS New vs Old,12/25–12/28E)+ GS Factor Profile 分位圖(Growth/Financial Returns/Multiple/Integrated) |
260729_gs_yageo_006.png |
41KB | 真資料圖 | Exhibit 5 圓餅圖:2Q26 營收依應用別組合(Industrial 29%/Computing & ESs 27%/Automotive 16%/Consumer 12%/Telecom 12%/Aero/Def/Med 4%) |
260729_gs_yageo_007.png |
202KB | 真資料圖 | Ratio analysis and assumption 表:毛利率/營業費用率/營業利益率/淨利率 QoQ/YoY 成長率,1Q26–4Q28E |
260729_gs_yageo_008.png |
76KB | 真資料圖 | Goldman Sachs rating and stock price target history 圖:股價(藍線)vs 台股加權指數(灰線)+ 歷次目標價方塊標記,2023–2026,最新標記 346(2026 初)與近期上修至高點 |
分類只有三類:
真資料圖/裝飾·logo·banner/文字卡。<40KB 未 Read 者免列(預設 logo):002/003/004/005(26–38KB)。
原始內容
For the exclusive use of KEVINLU@LENOVO.COM
Yageo Corp. (2327.TW)
Elevated UTR to meet with strong demand in 2H26, along with ongoing capacity expansion; Buy, with new TP of NT$1,280
2327.TW
12m Pri c e Target:
NT$1,280.00
Pri c e:
NT$507.00
Upside:
152.5%
Yageo hosted its 2Q26 result call on July 29th, with key takeaways including:
- (1) Yageo guided that the UTR for both standard and premium product is expected to increase to 90%+ in 3Q26 from 80-85%/85+% in 2Q26 to meet with the strong demand. The company guided that revenue/GM/OPM in 3Q26 will all see a slight QoQ increase.
(2) UTR remains full for overall capacity thus the company will continue to expand capacity across all production lines (including Kaohsiung, Mexico, Vietnam, Suzhou, etc), with greater focus on expanding MLCC and tantalum capacitors capacity. The company mentioned that several CAPEX plans are already in the pipeline, which will gradually increase capacity on a quarterly basis in the coming quarters.
- (3) The company has noted increasing customer interest in entering LTA to secure longer-term supply, with demand for LTAs are more focused on MLCCs and tantalum capacitors. Customers showing stronger interest are primarily those experiencing higher growth driven by AI.
- (4) Management mentioned that BB ratio continue to improve on a monthly basis throughout 2Q26 and reached 2.2 by end of June (was at 1.0+ in 1Q26), which is one the factors that is showing positive sign of better demand in 2H26.
- (5) Yageo mentioned its AI revenue exposure reached 16% in 2Q26 (up from 14-15% in 1Q26), which is tracking ahead of previous target of reaching 15% in 2026, demonstrating strong outlook with AI-related business.
- (6) Management is seeing signs of a ramp in demand for high-capacitance capacitors driven by next-generation AI servers. As production capacity shifts toward high-end capacitors, supply of
Goldman Sachs does and seeks to do business with companies covered in its research reports. As a result, investors should be aware that the fi rm may have a con fl ict of interest that could a ff ect the objectivity of this report. Investors should consider this report as only a single factor in making their investment decision. For Reg AC certi fi cation and other important disclosures, see the Disclosure Appendix, or go to www.gs.com/research/hedge.html. Analysts employed by non-US a ffi liates are not registered/quali fi ed as research analysts with FINRA in the U.S.
Key Data _____________________________________
Market cap: NT$1.0tr / $32.1bn
Enterprise value: NT$1.1tr / $33.4bn
3m ADTV: NT$40.9bn / $1.3bn
Taiwan
Taiwan Electronic Components
M&A Rank: 3
Leases incl. in net debt & EV?: No
| GS Forecast | 12/25 | __________ 12/26E | 12/27E | 12/28E |
|---|---|---|---|---|
| Revenue(NT$mn) New | 132,930.0 | 178,007.0 | 239,623.0 | 325,553.6 |
| Revenue (NT$ mn) Old | 132,930.0 | 196,764.5 | 289,670.6 | 388,444.8 |
| EBIT D A(NT$ mn) | 39,634.5 | 58,384.2 | 90,766.9 | 136,848.9 |
| EPS(NT$) New | 11.51 | 19.01 | 31.27 | 49.20 |
| EPS (NT$) Old | 11.51 | 21.22 | 37.56 | 57.32 |
| P/E (X) | 13.4 | 26.7 | 16.2 | 10.3 |
| P/B (X) | 1.9 | 5.5 | 4.7 | 3.9 |
| D ividend yield (%) | 3.9 | 2.0 | 3.2 | 5.1 |
| CROCI (%) | 9.5 | 12.5 | 18.7 | 27.3 |
| 6/26 | 9/26E | 12/26E | 3/27E | |
| EPS (NT$) | 4.59 | 5.02 | 5.50 | 6.26 |
e92c7a75ab8b4efbba794e6b187208c8
For the exclusive use of KEVINLU@LENOVO.COM
BUY
Yageo Corp. (2327.TW) Rating since Jun 22, 2020
Ratios & Valuation __________________________________________
| 12/25 | 12/26E | 12/27E | 12/28E | |
|---|---|---|---|---|
| P/E (X) | 13.4 | 26.7 | 16.2 | 10.3 |
| P/B (X) | 1.9 | 5.5 | 4.7 | 3.9 |
| FCF yield (%) | 7.8 | 3.3 | 4.9 | 7.9 |
| EV/EBIT D AR(X) | 9.6 | 18.6 | 11.6 | 7.3 |
| EV/EBIT D A(excl. leases) (X) | 9.6 | 18.6 | 11.6 | 7.3 |
| CROCI (%) | 9.5 | 12.5 | 18.7 | 27.3 |
| ROE (%) | 14.3 | 21.6 | 31.3 | 41.3 |
| Net debt/e qu ity (%) | 35.8 | 21.0 | 4.1 | (14.6) |
| Net debt/e qu ity (excl. leases) (%) | 35.8 | 21.0 | 4.1 | (14.6) |
| I n te r est c ov e r (X) | 10.4 | 15.8 | 26.3 | 41.3 |
| D ays i nv e n t or y ou tst , sales | 81.6 | 62.9 | 50.0 | 45.1 |
| Recei v able days | 76.3 | 76.3 | 78.4 | 78.1 |
| D ays p ayable ou tsta n di ng | 71.1 | 65.9 | 64.8 | 64.4 |
| Du P on t ROE (%) | 13.6 | 20.2 | 28.7 | 37.1 |
| T urnov e r (X) | 0.3 | 0.4 | 0.5 | 0.6 |
| L e v e r a g e (X) | 2.2 | 2.2 | 2.1 | 2.0 |
| Gro ss cas h i nv ested (ex cas h ) (NT $ ) | 367 , 675.4 | 375 , 013.5 | 385 , 580.8 | 396 , 345.0 |
| A v e r a g e ca p ital e mp l o yed (NT $ ) | 232 , 763.5 | 234 , 837.1 | 233 , 099.8 | 232 , 626.3 |
| BVP S (NT $ ) | 83.22 | 92.34 | 107.31 | 130.87 |
Growth & Margins (%) ______________________________________
| 12/25 | 12/26E | 12/27E | 12/28E | |
|---|---|---|---|---|
| Total revenue growth | 9.3 | 33.9 | 34.6 | 35.9 |
| EBITDA growth | 20.1 | 47.3 | 55.5 | 50.8 |
| EPS growth | (69.8) | 65.1 | 64.5 | 57.3 |
| DPS growth | (70.0) | 65.1 | 64.5 | 57.3 |
| EBIT margin | 22.4 | 27 | 33.3 | 38.6 |
| EBITDA margin | 29.8 | 32.8 | 37.9 | 42 |
| Net income margin | 17.8 | 21.9 | 26.8 | 31 |
Price Performance __________________________________________
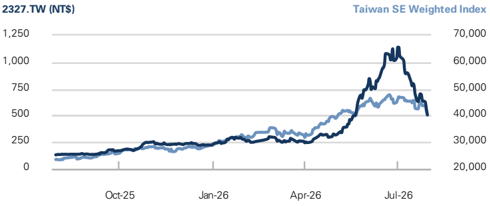
3m
57.5%
54.6%
6m
83.0%
1
2m
279.1%
48.7%
119.7%
Source: FactSet. Price as of 29 Jul 2026 close.
Absolute
Rel. to the Taiwan SE Weighted Index
Income Statement (NT$ mn) ________________________________
| To t a l r e v e nu e | 12/25 | 12/26E 178,007.0 | 12/27E 239,623.0 | 12/28E 325,553.6 |
|---|---|---|---|---|
| 132,930.0 | ||||
| Co s t of good s s old | (84,800.2) | (108,294.0) | (131,520.5) | (162,106.9) |
| SG&A | (14,910.4) | -- | -- | -- |
| R&D | (3,418.7) | 0.0 | 0.0 | 0.0 |
| Other operating inc./(exp.) | 0.0 | (21,733.7) | (28,310.9) | (37,901.0) |
| E BITDA | 39, 6 34. 5 | 58 ,3 8 4. 2 | 90, 766 .9 | 1 3 6 , 8 4 8 .9 |
| Depreciation& amortization | (9,833.8) | (10,404.9) | (10,975.3) | (11,303.1) |
| E BIT | 2 9, 8 00. 7 | 4 7 ,9 7 9.3 | 7 9, 7 9 1 . 6 | 125 , 5 4 5 . 7 |
| Net intere s t inc./(exp.) | 1,570.7 | 2,878.9 | 4,468.1 | 6,738.9 |
| Income/(lo ss ) from a ss ociate s | 0.0 | 946.3 | 607.1 | 279.6 |
| Pre-tax pro fi t | 3 1 , 11 9. 7 | 5 0,303. 6 | 81 , 776 . 7 | 127 , 2 03.3 |
| Provi s ion for taxe s | (7,342.8) | (11,153.3) | (17,455.8) | (26,084.8) |
| Minority intere s t | (142.6) | (133.7) | (120.0) | (120.0) |
| Preferred dividend s | -- | -- | -- | -- |
| N et inc . ( pre-ex c ept i o n a ls) | 2 3, 6 34. 2 | 39,0 16 . 5 | 6 4, 2 00.9 | 1 00,99 8 . 6 |
| Po s t-tax exceptional s | -- | -- | -- | -- |
| N et inc . ( po s t-ex c ept i o n a ls) | 2 3, 6 34. 2 | 39,0 16 . 5 | 6 4, 2 00.9 | 1 00,99 8 . 6 |
| E P S(b a sic , pre-ex c ept ) (N T $) | 11 . 51 | 1 9.0 1 | 3 1 . 27 | 49. 2 0 |
| E P S(dilu te d , pre-ex c ept ) (N T $) | 11 . 51 | 1 9.0 1 | 3 1 . 27 | 49. 2 0 |
| E P S(b a sic , po s t-ex c ept ) (N T $) | 11 . 51 | 1 9.0 1 | 3 1 . 27 | 49. 2 0 |
| E P S(dilu te d , po s t-ex c ept ) (N T $) | 11 . 51 6.00 | 1 9.0 1 | 3 1 . 27 | 49. 2 0 25.65 |
| DPS (NT$) | 9.91 | 16.30 | 52.1 | |
| Div. payout ratio (%) | 52.1 | 52.1 | 52.1 | |
| Balance Sheet (NT$ mn) | 12/25 | ______ 12/26E | 12/27E | 12/28E 183,622.4 |
| C a sh& c a sh equiv a lents | 81,473.5 30,509.6 | 103,351.8 43,892.1 | 134,613.8 | 80,273.5 |
| Accounts receiv a ble | 59,085.1 | 44,412.8 | ||
| Inventory | 31,635.6 | 29,669.6 | 36,033.0 | |
| Other current a ssets | 21,727.1 | 21,727.1 | 21,727.1 | 21,727.1 |
| Total current assets | 165 , 3 4 5 . 8 | 1 9 8 , 6 40. 7 | 251 ,4 5 9. 1 | 33 0,0 35 .9 |
| Net PP&E | 65,304.8 | 61,959.6 | 58,044.0 | 53,800.6 |
| Net int a ngibles | 106,699.8 | 105,696.2 | 104,692.5 | 103,688.8 |
| Tot a l investments | 45,202.5 | 46,148.8 | 46,755.9 | 47,035.5 |
| Other long-term a ssets | 8,236.2 | 8,236.2 | 8,236.2 | 8,236.2 |
| Total assets | 3 90, 78 9. 2 | 4 2 0, 681 .4 | 4 6 9, 187 . 7 | 5 4 2 , 7 9 7 .0 |
| Accounts p a y a ble | 18,031.4 | 21,093.6 | 25,617.7 | 31,575.3 |
| Short-term debt | 86,258.7 | 86,258.7 | 86,258.7 | 86,258.7 |
| Other current li a bilities | 31,789.3 | 39,807.8 | 52,936.0 | 72,118.0 |
| Total current liabilities | 136 ,0 7 9.4 | 1 4 7 , 16 0. 1 | 16 4, 812 . 3 | 18 9,9 52 .0 |
| Long-term debt | 57,588.8 | 57,588.8 | 57,588.8 | 57,588.8 |
| Long-term le a se li a bilities | -- | -- | -- | -- |
| Other long-term li a bilities | 23,124.5 | 23,124.5 | 23,124.5 | 23,124.5 |
| Total long-term liabilities | 8 0, 713 . 2 | 8 0, 713 . 2 | 8 0, 713 . 2 | 8 0, 713 . 2 |
| Total liabilities | 216 , 7 9 2 . 6 | 227 , 873 . 3 | 2 4 5 , 525 . 6 | 27 0, |
| 665 . 2 | ||||
| Preferred sh a res Tot a l commonequity | -- 170,877.8 | -- | -- 220,289.7 | -- 268,639.4 |
| Minority interest Total liabilities &equity | 3 , 118 . 7 3 90, 78 9. 2 | 189,555.7 3 , 252 .4 4 2 0, 681 .4 | 3 , 372 .4 4 6 9, 187 . 7 | 3 ,49 2 .4 5 4 2 , 7 9 7 .0 |
| Net debt, a djusted | 40,495.6 | 9,233.7 | (39,775.0) | |
| 62,374.0 |
Cash Flow (NT$ mn) ________________________________________
| 12/25 | 12/26E | 12/27E | 12/28E | |
|---|---|---|---|---|
| Net income | 23,634 . 2 | 39,016 . 5 | 64,200 . 9 | 100,998 . 6 |
| D&Aadd-back | 9,833 . 8 | 10,404 . 9 | 10,975 . 3 | 11,303 . 1 |
| Minority interest add-back | 142 . 6 | 133 . 7 | 120 . 0 | 120 . 0 |
| Net (inc)/dec working capital | (5,002 . 1) | (8,354 . 4) | (17,032 . 3) | (23,610 . 6) |
| Other operating cash flow | 2,254 . 6 | (946 . 3) | (607 . 1) | (279 . 6) |
| Cash flow fro m operations | 30, 86 3. 1 | 4 0, 254 . 5 | 57 , 656 . 7 | 88 , 5 3 1 . 5 |
| Capital expenditures | (6,056 . 0) | (6,056 . 0) | (6,056 . 0) | (6,056 . 0) |
| Acquisitions | 21,996 . 0 | -- | -- | -- |
| Divestitures | 1,344 . 3 | -- | -- | -- |
| Others | (21,009 . 6) | -- | -- | -- |
| Cash flow fro m investing | (3, 725 .3) | ( 6 ,0 56 .0) | ( 6 ,0 56 .0) | ( 6 ,0 56 .0) |
| Repayment of lease liabilities | -- | -- | -- | -- |
| Dividends paid(common& pref) | (10,265 . 2) | (12,320 . 1) | (20,338 . 7) | (33,466 . 9) |
| Inc/(dec) in debt | 89,213 . 2 | -- | -- | -- |
| Other financing cash flows | (85,730 . 0) | 0 . 0 | 0 . 0 | 0 . 0 |
| Cash flow fro m finan c ing | ( 6 , 782 .0) | ( 12 ,3 2 0. 1 ) | ( 2 0,33 8 . 7 ) | (33, 466 .9) |
| Total c ash flow | 2 0,3 55 .9 | 21 , 878 .3 | 3 1 , 262 .0 | 4 9,00 8 . 6 |
| Free cash flow | 24,807 . 1 | 34,198 . 5 | 51,600 . 7 | 82,475 . 5 |
Source: Company data, Goldman Sachs Research estimates.
e92c7a75ab8b4efbba794e6b187208c8
Revenue
Gross profits
Operating profits
Pre-tax income
Net earnings
EPS, NTS
Gross margin (%)
EBIT margin (%)
Net margin (%)
For the exclusive use of KEVINLU@LENOVO.COM
2Q26
GS est.
Diff (%)
1Q26
QoQ
QoQ
YoY
2Q25
YoY
mid-to-low end capacitors is expected to tighten.
Investment view
9,613
22%
7,044
67%
Bloomberg consensus
Consensus
42,712
16,620
11,413
4%
3%
3%
We are positive on the company's solid position to bene fi t from the improving commodity MLCC pricing outlook (see here). We continue to see the ongoing shift in MLCC production toward AI grade (we expect 14/24/32% of global MLCC capacity to support AI MLCC demand in 2026/27/28E, up from 9% in 2025), which will tighten supply of commodity MLCCs, driving UTR towards full capacity (we expect the global non-AI MLCC industry utilization rate to revert to 82/97/100% in 2026/27/28E from 75% in 2025) and creating a more favorable pricing environment.
Moreover, we continue to see the company making process with AI-related products. AI-related exposure reached 16% this quarter, which is tracking ahead of previous 2026 target of 15% and is likely to trend higher going forward with the solid AI demand ahead. Products used in AI applications (including tantalum capacitors, inductors, transistors, and MLCCs) typically carry higher margin, which will further support GM expansion.
Maintain Buy on Yageo with a new 12-m TP of NT$1,280 (down from NT$1,490).
2Q26 overview
Yageo's 2Q26 core business was 1% lower than GSe mainly due to slower GM expansion (2Q26 GM at 38.5% vs. GSe of 40.0%) despite lower opex (at NT$5,367mn vs. GSe of NT$5,983mn). Total revenue is largely in line with GSe but was 4% above consensus, supported by solid growth from both standard and premium products.
| Exhibit 1: 2Q26result comptable | Exhibit 1: 2Q26result comptable | Exhibit 1: 2Q26result comptable | Exhibit 1: 2Q26result comptable |
|---|---|---|---|
Source: Company data, Goldman Sachs Global Investment Research, Bloomberg
44,456
17,116
11,749
12,223
9,418
4.59
38.5%
26.4%
21.2%
e92c7a75ab8b4efbba794e6b187208c8
Exmvll < lageorevenuve mkby Chamnel (4<40)
Yageo P&L (NTS mn)
Sales
EBIT
Others
8%
Eamlulto lageu levenlue mla by reglon (<e40)
2027E New
2028E New
239,623
Consumer
108,103
2026E New
178,007
69,713
-10%
Diff.
-12%
2026E Old
MLCC
196,765
79,322
19%
47,979
Net Income
79,792
53,735
-11%
39,017
Direct Sales
EPS (NTS)
Gross margin
43,553
-10%
Exhibit 2: Yageo revenuve mix by channel (2Q26)
Ratio analysis
EBIT margin
Magnetics
Distributors
46%
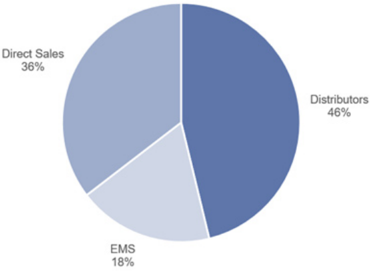
24%
Net margin
Source: Company data
Exhibit 4: Yageo revenue mix by product (2Q26)
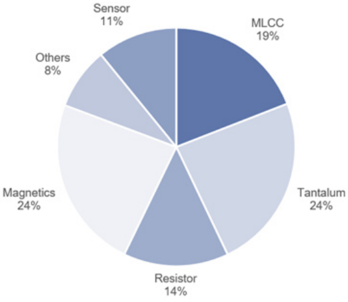
Source: Company data
40.3%
-1.2pp
64,201
31.27
45.1%
26.8%
33.3%
2027E Old
Diff.
289,671
-17%
China
4%
-17%
325,554
12%
163,447
125,546
132,901
96,350
Diff.
US
Industrial
27%
2028E Old
388,445
196,095
29%
2029E New
168,549
-19%
147,002
-15%
-14%
Exhibit 3: Yageo revenue mix by region (2Q26) 100,999 117.671
45.9%
33.3%
-0.8pp.
26.6%
0.2pp
0.0pp
Automotive
16%
27%
136,413
wwww
52.1%
40.6%
32.9%
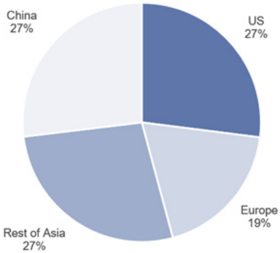
Rest of Asia
Source: Company data
Exhibit 5: Yageo revenue mix by application (2Q26)
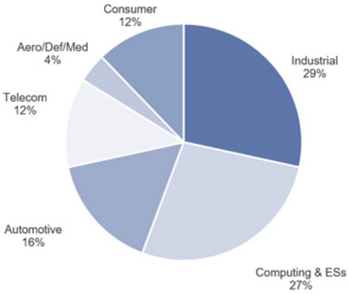
Source: Company data
50.2%
50.5%
-0.3 pp.
Aero/Def/Med
27%
Sensor
For the exclusive use of KEVINLU@LENOVO.COM
39.2%
Earnings revisions
We revise down our 2026/27/28E earnings estimate by 10/17/14% to re fl ect a more conservative pricing increase assumption for both MLCC and tantalum business (revise down 2026/27/28E revenue estimates by 10/17/16%). We now expect the contribution from margin accretive product to be lower, thus revise down GPM by 1.2/0.8/0.3ppt in 2026/27/28E.
Also, we introduce our 2029E earnings estimates in this report.
Exhibit 6: Earnings revision table
Source: Company data, Goldman Sachs Global Investment Research
Valuation and risks
e92c7a75ab8b4efbba794e6b187208c8
NTSmn
Revenue
Gross profit
Operating expense
Operating income
Pretax income
Taxes expense
Net income
1Q26
(4,929)
9,613
10,325
(2,287)
8.001
EPS, NTS
3.90
Ratio analysis and assumption
As % of sales
Gross margin
Operating expense ratio
Operating margin
Net margin
Revenue
2Q26
(5,384)
11,732
12,234
(2,770)
9.427
4.59
38.5%
12.1%
26.4%
3Q26E
46,818
18,414
(5,682)
12,732
13,252
(2,915)
10,307
5.02
39.3%
12.1%
27.2%
38.1%
12.9%
25.2%
21.0%
21.2%
22.0%
Exhibit 7: P&L table
Gross profit
7.6%
17.7%
8.4%
Operating income
Net income
YoY growth (%)
Revenue
Gross profit
Operating income
Net income
For the exclusive use of KEVINLU@LENOVO.COM
4Q26E
48,568
19.641
(5,739)
13,902
14,492
11,281
5.50
2Q27E
57,351
25,492
(6,828)
18,664
3Q27E
63.626
29,134
(7,552)
21,582
4Q27E
66,687
31,412
(7,819)
23,593
1Q28E
71,382
34,374
(8,306)
26,068
2Q28E
78.894
39,280
(9,266)
30,014
3Q28E
85.960
43,684
(9,998)
33.686
4Q28E
89,318
46,109
(10,331)
35,778
2025
132,930
48,130
(18,307)
29,822
2026E
178,007
69,713
(21,734)
47,979
2027E
239,623
108,103
(28,311)
79,792
2028E
325,554
(37,901)
125,546
2029E
415,133
(47,656)
168,549
We reiterate our Buy rating on Yageo with a new 12m TP of NT$1,280 (from NT$1,490), based on the same 26x 2028E PB/ROE (which is in line with the past 10-year peak multiple), after factoring in our earnings revision. 19.01 66.45
Key downside risks: (1) weaker inventory builds from OEMs; (2) softer IT end-demand; and (3) slower-than-expected integration of Kemet/Chilisin/Telemecanique/Shibaura.
23.2%
3.7%
6.7%
26.3%
10.4%
15.5%
24.7%
7.0%
12.3%
27.3%
10.9%
14.3%
28.3%
4.8%
7.8%
29.1%
7.0%
9.4%
31.0%
10.5%
14.3%
31.3%
9.0%
11.2%
32.3%
3.9%
5.6%
| 9.8% | 8.5% | 9.2% 14.8% | 17.0% | 15.6% | 9.3% | 10.5% | 15.1% | 12.2% | 6.2% | ||||||
|---|---|---|---|---|---|---|---|---|---|---|---|---|---|---|---|
| 22.0% 17.8% | 9.3% | 9.4% 13.9% | 17.2% | 15.5% | 8.6% 10.1% | 17.7% | 10.0% | 7.0% | |||||||
| 18.2% | |||||||||||||||
| 22.7% | 35.7% 41.5% | 35.0% | 36.1% | 29.0% | 35.9% | 37.3% | 37.4% | 37.6% | 35.1% | 33.9% | 9% | 34% | 35% | 36% | 28% |
| 31.2% | 46.9% 53.8% | 46.4% | 51.7% | 48.9% | 58.2% | 59.9% | 55.8% | 54.1% | 49.9% | 46.8% | 15% | 45% | 55% | 51% | 32% |
| 48.7% | 66.6% 68.4% | 58.8% | 66.0% | 59.1% | 69.5% | 69.7% | 63.4% | 60.8% | 56.1% | 51.6% | 27% | 61% | 66% | 57% | 34% |
| 44.7% | 88.6% 62.2% | 66.7% | 60.7% | 59.8% | 68.8% | 67.4% | 61.8% | 62.4% | 54.7% | 52.6% | 22% | 65% | 65% | 57% | 35% |
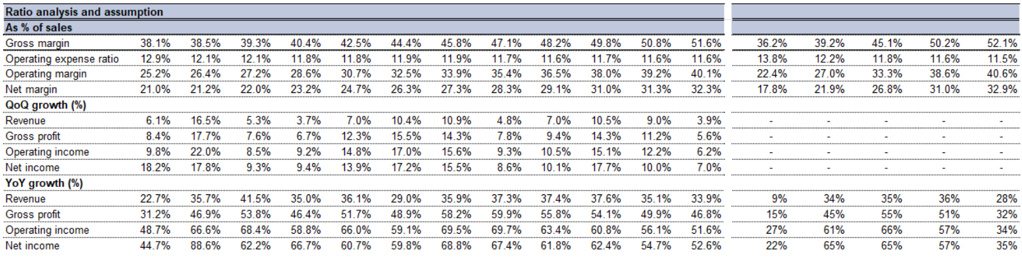
Source: Company data, Goldman Sachs Global Investment Research
Investment thesis and Valuation & Risks
Yageo, as the third largest MLCC and largest resistor / tantalum capacitor supplier globally, should see a stronger then peers earnings growth in the future, underpinned by better pricing environment, product upgrade, expansion strategy and more diversi fi ed product portfolio given the recent Kemet, Chilisin and Shibaura acquisitions. Yageo continues to penetrate into the high-end MLCC market (especially automotive/EV, industrial and high-end computing), which has a better S/D outlook compared to the commoditized market. Also, high-end MLCC market demand visibility is much clearer, with a more stable pricing trend, which suggests a less volatile earnings outlook. Yageo has started to bene fi t from an improving pricing environment for low-end MLCCs, driven by tightening supply. We hold a positive view on Yageo, given it is the supplier with the broadest product portfolio, which should help the company increase its market share by cross-selling and up-selling. Valuation o ff ers attractive risk-reward with shares trading below historical multiples. Key downside risks: (1) weaker inventory builds from OEMs; (2) softer IT end-demand; and (3) slower-than-expected integration of Kemet/Chilisin/Telemecanique/Shibaura.
Our 12m TP of NT$1,280 is based on a 26x average 2028E PB/ROE (in-line with the peak valuation historically and is in-line with JP peers' average 2027/28E PB/ROE). Key downside risks: (1) weaker inventory builds from OEMs; (2) softer IT end-demand; and (3) slower-than-expected integration of Kemet/Chilisin/Telemecanique/Shibaura.
17.8%
21.9%
26.8%
31.0%
32.9%
e92c7a75ab8b4efbba794e6b187208c8
For the exclusive use of KEVINLU@LENOVO.COM