PDF 原檔:報告_GS_台積電2330_20260702_original.pdf
圖片清單(已驗證 2026-07-03)
| 檔名 | size | 分類 | 親眼所見內容 |
|---|---|---|---|
報告_GS_台積電2330_20260702_004.png |
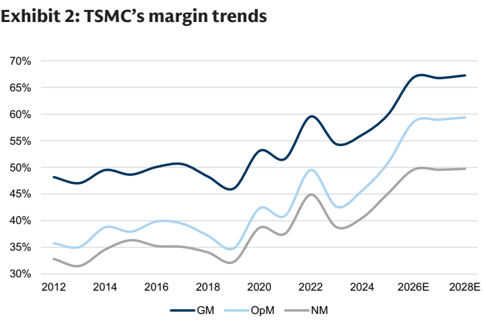
41KB | 真資料圖 | Exhibit 2 台積電三率趨勢(GM/OpM/NM,2012–2028E;GM 尾端升至 ~67%) |
報告_GS_台積電2330_20260702_005.png |
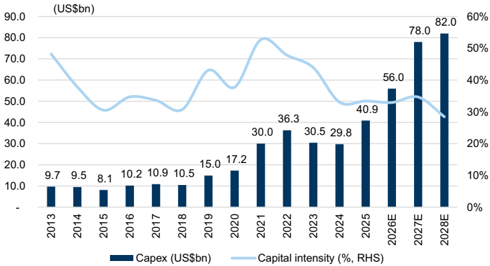
44KB | 真資料圖 | Exhibit 3 台積電年度 capex 柱狀圖(US$bn,2013–2028E:…40.9/56.0/78.0/82.0)+ 資本密集度折線 |
報告_GS_台積電2330_20260702_002.png |
41KB | 真資料圖 | Price Performance:2330 vs 加權指數(Jul-25–Jul-26,12m 絕對報酬 +127.2%) |
報告_GS_台積電2330_20260702_013.png |
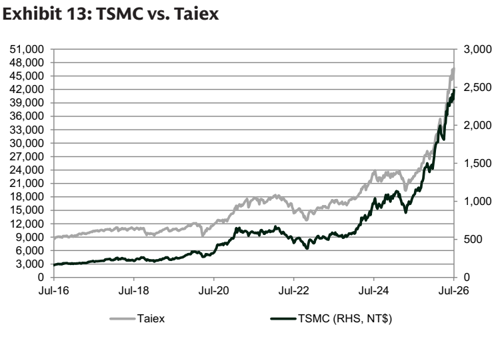
50KB | 真資料圖 | Exhibit 13 TSMC vs Taiex 長期走勢(2016–2026) |
報告_GS_台積電2330_20260702_014.png |
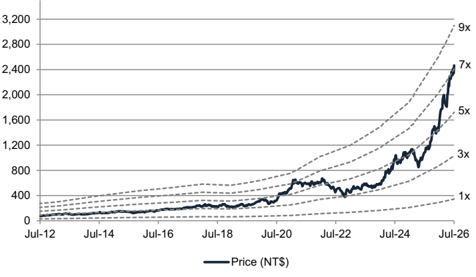
41KB | 真資料圖 | P/B band(1x–9x) |
報告_GS_台積電2330_20260702_015.png |
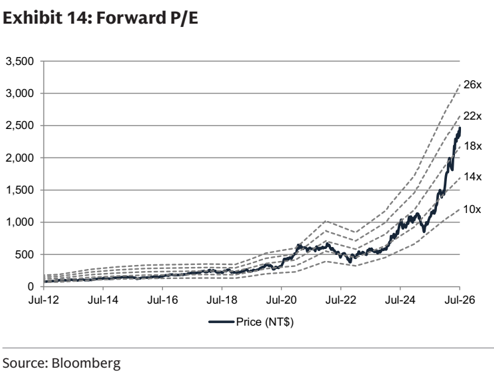
49KB | 真資料圖 | Exhibit 14 Forward P/E band(10x–26x) |
報告_GS_台積電2330_20260702_017.png |
74KB | 真資料圖 | GS 台積電評等/目標價沿革圖(630→3,000,TWD) |
報告_GS_台積電2330_20260702_018.png |
74KB | 真資料圖 | GS TSM ADR 評等/目標價沿革圖(104→600,USD) |
lib 嵌圖只挑
_005(capex 展望)與_004(三率趨勢);其餘走勢/估值 band/評等沿革不嵌。<40KB 未列(CoWoS 產能 Exhibit 5-10 圖皆 <40KB,數字已在正文表格)。
原始內容
Accelerating capacity build to secure a stronger growth trajectory; reiterate Buy with TP up to NT$3,000
2330.TW
12m Pri c e Target:
NT$3,000.00
Pri c e:
NT$2,465.00
Upside:
21.7%
TSM
12m Pri c e Target:
$600.00
Pri c e:
$444.23
Upside:
35.1%
TSMC will host its 2Q26 analyst meeting on 16 July 2026. We continue to view AI/HPC demand as a multi-year structural growth engine for TSMC. Over the past quarter, we see even stronger momentum for 2027 especially from AI accelerators and server CPUs, with demand continuing to run well ahead of supply across both advanced nodes and advanced packaging. Against this backdrop, we expect TSMC to further accelerate its capacity build and capex, while ongoing productivity gains and strategic pricing drive a structurally higher GM trajectory into 2027 and beyond.
Accelerating capacity buildout across both front/back-end
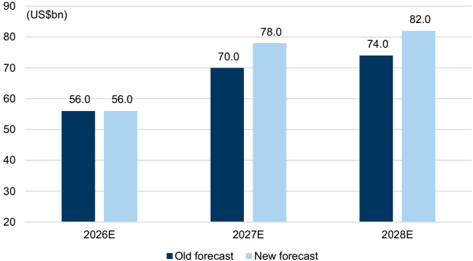
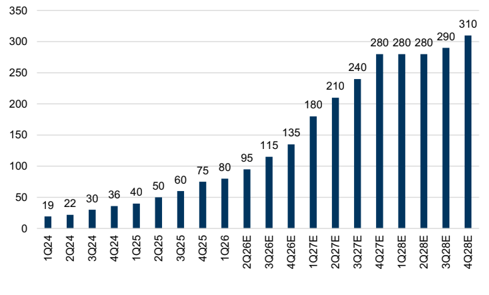
We now expect N3/N2 wafer-out capacity to reach 200kwpm/140kwpm by end-2027E (vs. 190kwpm/130kwpm prior), as we see stronger demand from customers especially for AI/HPC applications. On the back-end, we also raise our 2027E CoWoS (incl. WMCM) capacity to 280kwpm (vs. 250kwpm prior). As a result, we lift our 2027E capex to US$78bn (vs. US$70bn prior).
Further GM upside ahead
In terms of pro fi tability, we also expect to see a better GM outlook for TSMC. We now model its GM to reach 66.9%/66.8%/67.3% (vs. 64.9%/64.7%/66.5% previously) in 2026-28E , supported by better pricing, more favorable product mix, a sustained high level of loading, and continued productivity improvement - which are expected to largely o ff set the overseas-fab GM dilution, with the impact likely to come in milder than expected.
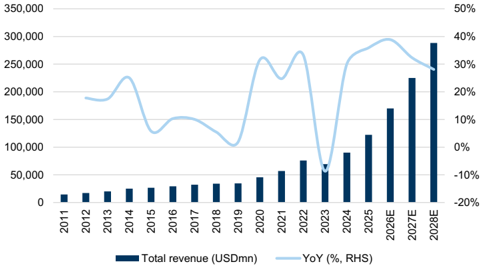
Overall, we now expect TSMC's 2026-2028E revenue (in USD terms) to grow 39%/32%/28% YoY (vs. 38%/30%/31% YoY previously). On an unchanged target P/E of 22x applied to our 2027E EPS, we raise our 12m TP to NT$3,000 (from NT$2,750 ).
With 22% of implied upside, we reiterate our Buy rating on TSMC.
Goldman Sachs does and seeks to do business with companies covered in its research reports. As a result, investors should be aware that the fi rm may have a con fl ict of interest that could a ff ect the objectivity of this report. Investors should consider this report as only a single factor in making their investment decision. For Reg AC certi fi cation and other important disclosures, see the Disclosure Appendix, or go to www.gs.com/research/hedge.html. Analysts employed by non-US a ffi liates are not registered/quali fi ed as research analysts with FINRA in the U.S.
BUY
Evelyn Yu
+886(2)2730-4187 | evelyn.yu@gs.com Goldman Sachs (Asia) L.L.C., Taipei Branch
James Schneider, Ph.D.
+1(212)357-2929 | jim.schneider@gs.com Goldman Sachs & Co. LLC
Ryan Huang, CFA
+886(2)2730-4084 | ryan.huang@gs.com Goldman Sachs (Asia) L.L.C., Taipei Branch
Key Data _____________________________________
Market cap: NT$63.9tr / $2.0tr
Enterprise value: NT$61.2tr / $1.9tr
3m ADTV: NT$87.1bn / $2.8bn
Taiwan
Taiwan Semiconductor
M&A Rank: 3
Leases incl. in net debt & EV?: Yes
| GS Forecast | __________ 12/25 | 12/26E | 12/27E | 12/28E |
|---|---|---|---|---|
| Revenue(NT$mn) New | 3,809,054.3 5,385,597.1 7,132,115.4 | 9,135,711.6 | ||
| Revenue (NT$ mn) Old | 3,809,054.3 5,254,033.6 6,815,428.5 | 8,902,725.9 | ||
| EBIT D A(NT$ mn) EPS(NT$) New | 2,624,188.0 66.26 102.99 | 3,879,063.9 | 5,185,333.2 136.34 | 6,692,134.6 175.24 |
| EPS (NT$) Old | 66.26 | 96.82 | 125.00 | 168.07 |
| P/E (X) | 17.6 | 23.9 | 18.1 | 14.1 |
| P/B (X) | 5.6 | 8.5 | 6.2 | 4.6 |
| D ividend yield (%) | 1.9 | 1.2 | 1.3 | 1.5 |
| CROCI (%) | 24.3 | 32.1 | 36.3 | 39.5 |
| 3/26 | 6/26E | 9/26E | 12/26E | |
| EPS (NT$) | 22.08 | 24.34 | 27.84 | 28.74 |
Source: Company data, Goldman Sachs Research estimates. See disclosures for details.
BUY
TSMC (2330.TW)
Rating since May 7, 2019
Ratios & Valuation __________________________________________
| 12/25 | 12/26E | 12/27E | 12/28E | |
|---|---|---|---|---|
| P/E (X) | 17.6 | 23.9 | 18.1 | 14.1 |
| P/B (X) | 5.6 | 8.5 | 6.2 | 4.6 |
| FCF yield (%) | 3.3 | 2.3 | 3.5 | 5.5 |
| EV/EBITDAR (X) | 10.8 | 15.8 | 11.5 | 8.5 |
| EV/EBITDA (excl. leases) (X) | 10.8 | 15.8 | 11.5 | 8.5 |
| CROCI (%) | 24.3 | 32.1 | 36.3 | 39.5 |
| ROE (%) | 35.4 | 41.4 | 39.8 | 37.6 |
| Net debt/equity (%) | (34.3) | (36.7) | (40.8) | (49.1) |
| Net debt/equity (excl. leases) (%) | (34.3) | (36.7) | (40.8) | (49.1) |
| Inte r est c ov e r (X) | 99.1 | 152.6 | 311.7 | 821.0 |
| Days in v ent or y o utst , sales | 27.6 | 20.9 | 20.0 | 19.3 |
| Recei v able days | 26.6 | 20.5 | 16.9 | 13.7 |
| Days p ayable o utstandin g | 157.7 | 146.3 | 134.2 | 149.7 |
| DuP o nt ROE (%) | 31.5 | 35.4 | 34.3 | 32.5 |
| Tu r n ov e r (X) | 0.5 | 0.5 | 0.6 | 0.6 |
| L e v e r a g e (X) | 1.5 | 1.3 | 1.2 | 1.2 |
| Gro ss cas h in v ested (ex cas h ) (NT $ ) | 9 , 199 , 168.9 | 11 , 084 , 101.3 | 13 , 382 , 866.2 | 15 , 656 , 627.3 |
| A v e r a g e ca p ital e mp l o yed (NT $ ) | 3 , 371 , 689.3 | 4 , 181 , 830.6 | 5 , 434 , 062.4 | 6 , 597 , 064.1 |
| BVP S (NT $ ) | 208.99 | 289.08 | 395.42 | 536.66 |
Growth & Margins (%) ______________________________________
| 12/25 | 12/26E | 12/27E | 12/28E | |
|---|---|---|---|---|
| Total revenue growth | 3 1.6 | 41.4 | 3 2.4 | 28.1 |
| EBITDA growth | 3 2.2 | 47.8 | 33 .7 | 29.1 |
| EPS growth | 46.4 | 55.4 | 3 2.4 | 28.5 |
| DPS growth | 29.4 | 3 1.8 | 1 3 .8 | 12.1 |
| EBIT margin | 50.8 | 58.5 | 59.0 | 59.4 |
| EBITDA margin | 68.9 | 72.0 | 72.7 | 7 3 . 3 |
| Net income margin | 45.1 | 49.6 | 49.6 | 49.7 |
Absolute
Rel. to the Taiwan SE Weighted Index
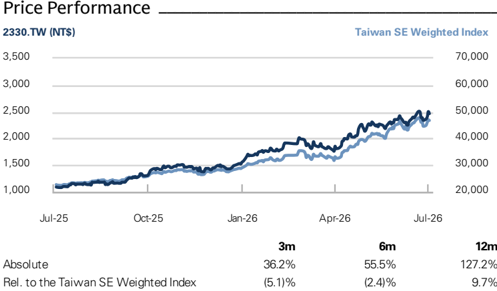
Source: FactSet. Price as of 2 Jul 2026 close.
Income Statement (NT$ mn) ________________________________
Cash Flow (NT$ mn) ________________________________________
| 12/25 | 12/26E | 12/27E | 12/28E | |
|---|---|---|---|---|
| Tota l r e v e nu e | 3,809,054.3 | 5,385,597.1 | 7,132,115.4 | 9,135,711.6 |
| Cost of goods sold | (1,527,760.3) | (1,783,551.3) | (2,369,720.5) | (2,990,515.9) |
| SG&A | (98,775.0) | (119,819.5) | (149,995.9) | (188,595.9) |
| R&D | (246,427.3) | (330,026.7) | (407,026.7) | (531,026.7) |
| Other operating inc./(exp.) | -- | -- | -- | -- |
| E BITDA | 2 , 62 4, 188 .0 | 3, 87 9,0 6 3.9 | 5 , 185 ,333. 2 | 6 , 6 9 2 , 1 34. 6 |
| Depreciation& amortization | (688,096.4) | (726,864.4) | (979,961.0) | (1,266,561.5) |
| E BIT | 1 ,93 6 ,09 1 . 7 | 3, 152 , 1 99. 6 | 4, 2 0 5 ,3 72 . 2 | 5 ,4 25 , 57 3. 1 |
| Net interest inc./(exp.) | 86,206.5 | 85,610.8 | 93,596.7 | 99,606.8 |
| Income/(loss) from associates | 5,496.6 | 1,684.9 | 0.0 | 299.9 |
| Pre-tax pro fi t | 2 ,04 1 , 662 . 8 | 3, 2 4 5 , 66 0.0 | 4, 2 9 8 ,9 68 .9 | 5 , 525 ,4 7 9. 8 |
| Provision for taxes | (326,266.1) | (573,518.0) | (761,980.3) | (979,835.5) |
| Minority interest | 2,485.8 | (1,286.2) | (1,286.2) | (1,286.2) |
| Preferred dividends | -- | -- | -- | -- |
| N et inc . ( pre-ex c ept i o n a ls) | 1 , 717 , 882 . 6 | 2 , 67 0, 855 . 8 | 3, 5 3 5 , 7 0 2 .4 | 4, 5 44,3 58 . 1 |
| Post-tax exceptionals | -- | -- | -- | -- |
| N et inc . ( po s t-ex c ept i o n a ls) | 1 , 717 , 882 . 6 | 2 , 67 0, 855 . 8 | 3, 5 3 5 , 7 0 2 .4 | 4, 5 44,3 58 . 1 |
| E P S(b a sic , pre-ex c ept ) (N T $) | 66 . 26 | 1 0 2 .99 | 1 3 6 .34 | 175 . 2 4 |
| E P S(dilu te d , pre-ex c ept ) (N T $) | 66 . 26 | 1 0 2 .99 | 1 3 6 .34 | 175 . 2 4 |
| E P S(b a sic , po s t-ex c ept ) (N T $) | 66 . 26 | 1 0 2 .99 | 1 3 6 .34 | 175 . 2 4 |
| E P S(dilu te d , po s t-ex c ept ) (N T $) | 66 . 26 | 1 0 2 .99 | 1 3 6 .34 | 175 . 2 4 |
| DPS (NT$) | 22.00 | 29.00 | 33.00 | 37.00 |
| Div. payout ratio (%) | 33.2 | 28.2 | 24.2 | 21.1 |
| Balance Sheet (NT$ mn) | ______ 12/25 | 12/26E | 12/27E | 12/28E |
| C a sh& c a sh equiv a lents | 2,767,856.4 | 3,365,366.9 322,225.1 | 4,505,503.5 340,006.1 | 6,962,170.6 345,766.0 |
| Accounts receiv a ble | 282,059.2 | |||
| Inventory | 288,109.5 | 329,954.4 | 450,967.9 | 515,980.6 |
| Other current a ssets | 479,105.8 | 553,731.5 | 553,731.5 | 553,731.5 |
| Total current assets | 3, 817 , 1 30. 8 | 4, 571 , 278 .0 | 5 , 85 0, 2 09.0 | 8 ,3 77 , 6 4 8 . 8 |
| Net PP&E | 3,691,840.9 | 4,823,111.7 | 6,324,345.9 | 7,665,779.5 |
| Net int a ngibles Tot a l investments | 24,952.6 172,370.4 | 18,212.3 166,566.5 | 9,617.2 166,566.5 | 1,022.0 166,866.4 |
| Other long-term a ssets | 226,729.2 | 249,463.0 | 249,463.0 | 249,463.0 |
| Total assets | 7 ,933,0 2 3.9 | 9, 828 , 6 3 1 . 6 | 12 , 6 00, 2 0 1 . 6 | 16 ,4 6 0, 77 9. 8 |
| Accounts p a y a ble | 714,546.9 | 715,231.3 | 1,027,860.9 | 1,424,572.3 |
| Short-term le a se li a bilities | -- | -- | -- | |
| 743,472.4 | -- 860,083.3 | 860,083.3 | ||
| Other current li a bilities | 1 | 860,083.3 | 101,017.7 | |
| Total current liabilities | ,4 58 ,0 1 9.3 | 1 , 575 ,3 1 4. 7 | 1 , 887 ,944. 2 | 2 , 28 4, 655 . 6 |
| Long-term debt | 896,062.0 -- | 601,017.7 | 301,017.7 -- | -- |
| Long-term le a se li a bilities | 118,147.3 | -- | 113,289.6 | |
| Other long-term li a bilities | 1 | 113,289.6 | 113,289.6 | |
| Total long-term liabilities | ,0 1 4, 2 09.3 | 71 4,30 7 .3 | 4 1 4,30 7 .3 | 21 4,30 7 .3 |
| 2 , 28 9, 622 .0 | 2 5 | 2 ,49 8 ,9 62 .9 | ||
| Total liabilities | 2 ,4 72 , 228 . 6 | ,30 2 , 251 . | ||
| Total liabilities &equity | 7 ,933,0 2 3.9 | 9, 828 , 6 3 1 . 6 | 12 , 6 00, 2 0 1 . 6 | 16 ,4 6 0, 77 9. 8 |
| Net debt, a djusted | (6,861,152.9) | |||
| (1,871,794.4) | (2,764,349.2) | (4,204,485.8) |
| 12/25 | 12/26E | 12/27E | 12/28E | |
|---|---|---|---|---|
| Net income | 1,717,882.6 | 2,670,855.8 | 3,535,702.4 | 4,544,358.1 |
| D&Aadd-back | 688,096.4 | 726,864.4 | 979,961.0 | 1,266,561.5 |
| Minority interest add-back | (2,485.8) | 1,286.2 | 1,286.2 | 1,286.2 |
| Net (inc)/dec working capital | 98,731.8 | (81,326.4) | 173,835.1 | 325,938.8 |
| Other operating cash flow | (227,249.3) | (72,924.0) | 0.0 | (299.9) |
| Cash flow fro m operations | 2 , 274 ,9 75 . 6 | 3, 244 , 756 .0 | 4 , 6 90, 784 . 7 | 6 , 1 3 7 , 844 . 7 |
| Capital expenditures | (1,272,410.5) | (1,774,092.8) | (2,472,600.0) | (2,599,400.0) |
| Acquisitions | -- | -- | -- | -- |
| Divestitures | -- | -- | -- | -- |
| Others | 128,017.1 | (6,091.0) | -- | -- |
| Cash flow fro m investing | ( 1 , 144 ,393. 4 ) | ( 1 , 78 0, 18 3. 8 ) | ( 2 , 472 , 6 00.0) | ( 2 , 5 99, 4 00.0) |
| Repayment of lease liabilities | -- | -- | -- | -- |
| Dividends paid(common& pref) | (440,851.8) | (622,379.8) | (778,044.0) | (881,773.5) |
| Inc/(dec) in debt | 40,448.1 | (285,987.3) | (300,000.0) | (200,000.0) |
| Other financing cash flows | (89,949.1) | 41,305.4 | (4.1) | (4.1) |
| Cash flow fro m financing | ( 4 90,3 52 .9) | ( 867 ,0 61 . 7 ) | ( 1 ,0 78 ,0 48 . 1 ) | ( 1 ,0 81 , 777 . 6 ) |
| Total cash flow | 64 0, 22 9. 4 | 5 9 7 , 51 0. 5 | 1 , 14 0, 1 3 6 . 6 | 2 , 456 , 667 . 1 |
| Free cash flow | 1,002,565.1 | 1,470,663.2 | 2,218,184.7 | 3,538,444.7 |
Source: Company data, Goldman Sachs Research estimates.
Adding capacity where the bottlenecks are tightest
We expect TSMC to embark on an aggressive capacity expansion roadmap across both advanced nodes and advanced packaging, as supported by the AI upcycle. On the leading-edge roadmap, the fi rst-year N2 wafer output is expected to exceed that of N3 by 45% , implying a signi fi cantly faster adoption cycle and supported by a rapid expansion across Fab20 (Hsinchu) and Fab22 (Kaohsiung) in 2026. Looking beyond the initial ramp, N2/A16 capacity is projected to grow at a 70% CAGR during 2026-28 , while combined N3/N5 capacity will continue expanding at a 25% CAGR through 2027 to support AI/HPC demand and node migration fl exibility.
For N3, we now expect capacity to reach 200kwpm by end-2027E (vs. 190kwpm previously), as N3 has become the key bottleneck for AI GPU and ASICs, following the migration of leading-edge AI from N5 to N3. We believe TSMC will continue to lift N3 output partially through ongoing N5-to-N3 tool conversion and capacity optimization, keeping advanced-node UTR fully loaded through 2027. As for N2, we are now expecting capacity to reach 140kwpm by end-2027E (vs. 130kwpm previously). Net net, we are modeling 5nm and below node to account for 69%/75%/82% of total wafer revenue in 2026E-28E.
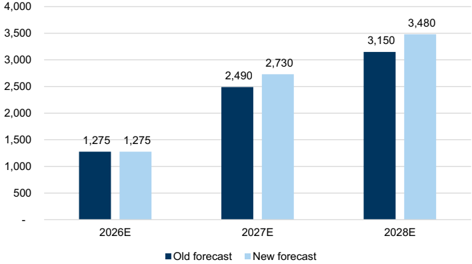
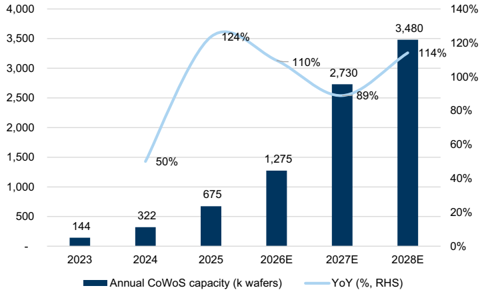
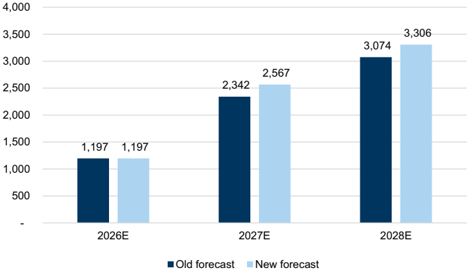
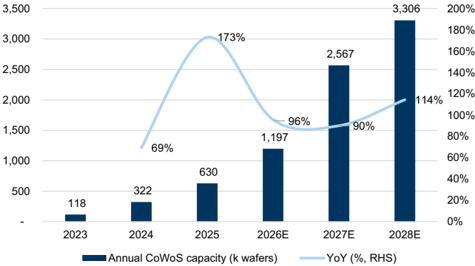
On the back-end, we are raising both our CoWoS capacity and shipment forecasts, as we believe TSMC is speeding up its advanced-packaging expansion to ful fi ll strong CPU and AI demand. On capacity, we now model 2026-2028E annual CoWoS (including WMCM) capacity to reach 1,275k/2,730k/3,480k (vs. 1,275k/2,490k/3,150k previously), representing 89%/114%/27% YoY growth. On shipment, we revise up our 2026-2028E annual CoWoS (including WMCM) shipment to 1,197k/2,567k/3,306k (vs. 1,197k/2,342k/3,074k previously), representing 90%/114%/29% YoY growth.
Capex stepping up to secure the AI build out
Re fl ecting our expectation of greater capacity expansion across both front-end and back-end, we raise our 2027/2028E capex forecast to US$78bn/US$82bn (vs. US$70bn/US$74bn previously), with 2026E capex unchanged at US$56bn. We believe the step-up is underpinned by additional cleanroom completions coming online and rising investment intensity for both leading-edge nodes and advanced packaging in 2027 and beyond.
Exhibit 1: TSMC's revenue growth (in USD terms)
Source: Company data, Goldman Sachs Global Investment Research
Source: Company data, Goldman Sachs Global Investment Research
Exhibit 3: TSMC's capex outlook
Source: Company data, Goldman Sachs Global Investment Research
Exhibit 5: TSMC's annual CoWoS capacity revisions (k wafers)
Source: Company data, Goldman Sachs Global Investment Research
Exhibit 7: TSMC's annual CoWoS capacity growth trend
Source: Company data, Goldman Sachs Global Investment Research
Exhibit 4: TSMC's capex forecast revisions
Source: Company data, Goldman Sachs Global Investment Research
Exhibit 6: TSMC's annual CoWoS shipments (k wafers)
Source: Company data, Goldman Sachs Global Investment Research
Exhibit 8: TSMC's annual CoWoS shipment growth trend
Source: Company data, Goldman Sachs Global Investment Research
Exhibit 9: TSMC's quarterly CoWoS capacity ramp (kwpm)
Source: Company data, Goldman Sachs Global Investment Research
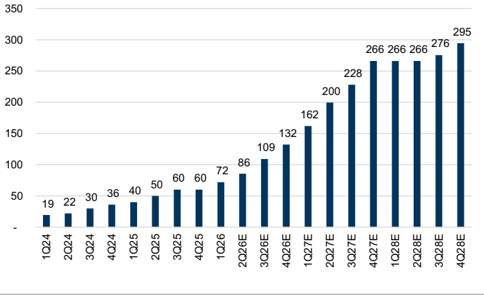
Exhibit 10: TSMC's quarterly shipments (kwpm)
Source: Company data, Goldman Sachs Global Investment Research
Earnings estimate revisions, valuation and risks
Forecast changes
We have revised up 2026-2028E earnings by 6%/9%/6% to re fl ect 1) stronger capacity expansion, and 2) higher GM forecast on rush orders and productivity improvements.
Exhibit 11: Forecast changes
| 2026E | 2026E | 2026E | 2027E | 2027E | 2027E | 2028E | 2028E | 2028E | |
|---|---|---|---|---|---|---|---|---|---|
| (NT$mn) | Old | New | Diff (%) | Old | New | Diff (%) | Old | New | Diff (%) |
| Revenue | 5,254,034 | 5,385,597 | 2.5% | 6,815,428 | 7,132,115 | 4.6% | 8,902,726 | 9,135,712 | 2.6% |
| Gross profit | 3,407,825 | 3,602,046 | 5.7% | 4,407,033 | 4,762,395 | 8.1% | 5,922,789 | 6,145,196 | 3.8% |
| Op. income | 2,957,978 | 3,152,200 | 6.6% | 3,850,009 | 4,205,372 | 9.2% | 5,203,165 | 5,425,573 | 4.3% |
| Net income | 2,510,786 | 2,670,856 | 6.4% | 3,241,489 | 3,535,702 | 9.1% | 4,358,509 | 4,544,358 | 4.3% |
| EPS (NT$) | 96.82 | 102.99 | 6.4% | 125.00 | 136.34 | 9.1% | 168.07 | 175.24 | 4.3% |
| GM | 64.9% | 66.9% | 2.0% | 64.7% | 66.8% | 2.1% | 66.5% | 67.3% | 0.7% |
| OpM | 56.3% | 58.5% | 2.2% | 56.5% | 59.0% | 2.5% | 58.4% | 59.4% | 0.9% |
| NM | 47.8% | 49.6% | 1.8% | 47.6% | 49.6% | 2.0% | 49.0% | 49.7% | 0.8% |
| 3Q26E | 3Q26E | 3Q26E | 4Q26E | 4Q26E | 4Q26E | 1Q27E | 1Q27E | 1Q27E | |
|---|---|---|---|---|---|---|---|---|---|
| (NT$mn) | Old | New | Diff (%) | Old | New | Diff (%) | Old | New | Diff (%) |
| Revenue | 1,391,816 | 1,450,312 | 4.2% | 1,475,239 | 1,515,861 | 2.8% | 1,515,752 | 1,589,556 | 4.9% |
| Gross profit | 877,913 | 969,244 | 10.4% | 929,538 | 1,000,468 | 7.6% | 979,103 | 1,052,286 | 7.5% |
| Op. income | 758,407 | 849,738 | 12.0% | 805,532 | 876,462 | 8.8% | 852,597 | 925,780 | 8.6% |
| Net income | 646,231 | 721,939 | 11.7% | 686,253 | 745,202 | 8.6% | 726,085 | 787,086 | 8.4% |
| EPS (NT$) | 24.92 | 27.84 | 11.7% | 26.46 | 28.74 | 8.6% | 28.00 | 30.35 | 8.4% |
| GM | 63.1% | 66.8% | 3.8% | 63.0% | 66.0% | 3.0% | 64.6% | 66.2% | 1.6% |
| OpM | 54.5% | 58.6% | 4.1% | 54.6% | 57.8% | 3.2% | 56.2% | 58.2% | 2.0% |
| NM | 46.4% | 49.8% | 3.3% | 46.5% | 49.2% | 2.6% | 47.9% | 49.5% | 1.6% |
Source: Goldman Sachs Global Investment Research
Exhibit 12: TSMC's P&L summary
| 1Q26 | 2Q26E | 3Q26E | 4Q26E | 1Q27E | 2Q27E | 3Q27E | 4Q27E | 2026E | 2027E | 2028E | |
|---|---|---|---|---|---|---|---|---|---|---|---|
| P&L (NT$mn) | |||||||||||
| Revenue | 1,134,103 | 1,285,321 | 1,450,312 | 1,515,861 | 1,589,556 | 1,726,203 | 1,843,029 | 1,973,327 | 5,385,597 | 7,132,115 | 9,135,712 |
| Gross profit | 751,295 | 881,038 | 969,244 | 1,000,468 | 1,052,286 | 1,149,915 | 1,234,713 | 1,325,481 | 3,602,046 | 4,762,395 | 6,145,196 |
| Operating profit | 658,966 | 767,033 | 849,738 | 876,462 | 925,780 | 1,015,409 | 1,090,707 | 1,173,475 | 3,152,200 | 4,205,372 | 5,425,573 |
| Net income | 572,480 | 631,236 | 721,939 | 745,202 | 787,086 | 830,493 | 924,303 | 993,820 | 2,670,856 | 3,535,702 | 4,544,358 |
| EPS (NT$) | 22.08 | 24.34 | 27.84 | 28.74 | 30.35 | 32.03 | 35.64 | 38.32 | 102.99 | 136.34 | 175.24 |
| Margins (%) | |||||||||||
| Gross margin | 66.2% | 68.5% | 66.8% | 66.0% | 66.2% | 66.6% | 67.0% | 67.2% | 66.9% | 66.8% | 67.3% |
| Operating profit margin | 58.1% | 59.7% | 58.6% | 57.8% | 58.2% | 58.8% | 59.2% | 59.5% | 58.5% | 59.0% | 59.4% |
| Net margin | 50.5% | 49.1% | 49.8% | 49.2% | 49.5% | 48.1% | 50.2% | 50.4% | 49.6% | 49.6% | 49.7% |
| YoY (%) | |||||||||||
| Revenue | 35.1% | 37.6% | 46.5% | 44.9% | 40.2% | 34.3% | 27.1% | 30.2% | 41.4% | 32.4% | 28.1% |
| Gross profit | 52.3% | 61.0% | 64.7% | 53.4% | 40.1% | 30.5% | 27.4% | 32.5% | 57.9% | 32.2% | 29.0% |
| Operating profit | 61.9% | 65.5% | 69.7% | 55.2% | 40.5% | 32.4% | 28.4% | 33.9% | 62.8% | 33.4% | 29.0% |
| Net income | 58.3% | 58.5% | 59.6% | 47.3% | 37.5% | 31.6% | 28.0% | 33.4% | 55.5% | 32.4% | 28.5% |
| EPS | 58.3% | 58.5% | 59.6% | 47.3% | 37.5% | 31.6% | 28.0% | 33.4% | 55.4% | 32.4% | 28.5% |
| QoQ (%) | |||||||||||
| Revenue | 8.4% | 13.3% | 12.8% | 4.5% | 4.9% | 8.6% | 6.8% | 7.1% | |||
| Gross profit | 15.2% | 17.3% | 10.0% | 3.2% | 5.2% | 9.3% | 7.4% | 7.4% | |||
| Operating profit | 16.7% | 16.4% | 10.8% | 3.1% | 5.6% | 9.7% | 7.4% | 7.6% | |||
| Net income | 13.2% | 10.3% | 14.4% | 3.2% | 5.6% | 5.5% | 11.3% | 7.5% | |||
| EPS | 13.2% | 10.2% | 14.4% | 3.2% | 5.6% | 5.5% | 11.3% | 7.5% |
Source: Company data, Goldman Sachs Global Investment Research
Reiterate Buy; TP raise to NT$3,000 from NT$2,750
We raise our 12m TP to NT$3,000 from NT$2,750 (2330.TW), following our upward earnings revisions. Our TP is based on a target P/E of 22x (unchanged, benchmarked to 1.0stdv above 5-year avg. forward P/E) applied to our higher 2027E EPS. Accordingly, we raise our 12 month TP for the ADR to US$600 from US$550, based on an unchanged FX conversion of USD/TWD of 30.0 and unchanged ADR premium of 20%. Our 22x target
P/E multiple is also benchmarked to TSMC's trading average of 22x during its previous revenue upcycle where its 3-year revenue CAGR (2019-2021) was 28%, vs. our 3-year revenue CAGR at 34% during 2025-2028E.
Our new TP implies 22% (ADR 35%) upside to the last close. As a result, we reiterate our Buy ratings for TSMC/ADR. We maintain our constructive view on TSMC's long-term growth outlook as we believe the company's solid technology leadership and execution better positions it vs. peers to capture the industry's long-term structural growth opportunities, especially in AI.
Source: Bloomberg
Exhibit 15: Forward P/B
Source: Bloomberg
Source: Bloomberg
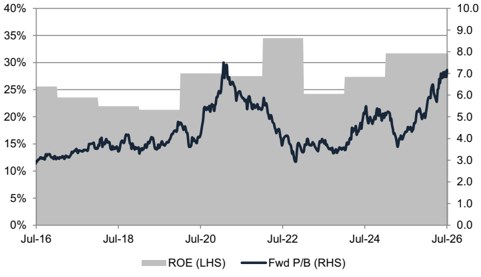
Exhibit 16: P/B vs.ROE
Source: Bloomberg
Investment Thesis - TSMC (2330.TW/TSM)
TSMC is a leading global foundry company specializing in cutting-edge nodes. Its leading technology stance enables it to enjoy more than 60% revenue share in the global foundry market. We like TSMC as we believe its solid technology leadership and execution better position it vs. peers to capture the industry's long-term structural growth opportunities, particularly in areas such as AI/5G/HPC/EV. In addition, valuation looks attractive in our view, with the shares trading at the mid-range of their 10-year trading history (P/E: 10-29x). Furthermore, we view TSMC as the key AI enabler among our Taiwan Semis coverage, thanks to its leadership stance in leading edge nodes and advanced packaging technology - CoWoS (chip on wafer on substrate). We believe TSMC will achieve its 25% revenue CAGR target for the next several years, driven primarily by increasing silicon content growth and AI/HPC demand, with LT GM to remain at 56%+. We are Buy rated.
Price Target Risks and Methodology - TSMC (2330.TW/TSM)
Valuation methodology: We have a 12m TP of NT$3,000, which is derived by applying a target P/E multiple of 22x to our 2027E EPS. Our 22x target P/E is benchmarked against 1.0stdv above its 5-year trading average. For the ADR (TSM), we have a 12m TP of US$600, based on a USD/TWD rate of 30.0 and an ADR premium of 20%.
Key downside risks to our views: (1) further deterioration in end-demand recovery impacting capacity utilization; (2) slower customer node migrations; (3) slowdown in AI investment resulting in lower long-term semiconductor content growth; (4) poor yields/execution resulting in worse-than-expected pro fi tability; (5) stronger competition resulting in ASP/pro fi tability erosion; and (6) unfavorable FX trend or higher-than-expected cost increase weighing on the margin outlook.